
Abstract
The food-entrainable oscillator, which underlies the prefeeding activity peak developed by restricted daily feeding (RF) in rodents, does not depend on the circadian pacemaker in the suprachiasmatic nucleus (SCN) or on the known clock genes. In the present study, to clarify the roles of SCN circadian pacemaker and nutrient conditions on the development of prefeeding activity peak, RF of 3-h daily feeding was imposed on four groups of adult male mice for 10 cycles at different circadian times, zeitgeber time (ZT)2, ZT8, ZT14, and ZT20, where ZT0 is the time of lights-on in LD12:12. Seven days after the termination of RF session with ad libitum feeding in between, total food deprivation (FD) for 72 h was imposed. Wheel-running activity and core body temperature were measured throughout the experiment. Immediately after the RF or FD session, the PER2::LUC rhythms were measured in the cultured SCN slices and peripheral tissues. Not only the buildup process and magnitude of the prefeeding activity peak, but also the percentages of nocturnal activity and hypothermia developed under RF were significantly different among the four groups, indicating the involvement of light entrained circadian pacemaker. The buildup of prefeeding activity peak was accomplished by either phase-advance or phase-delay shifts (or both) of activity bouts comprising a nocturnal band. Hypothermia under FD was less prominent in RF-exposed mice than in naïve counterparts, indicating that restricted feeding increases tolerance to caloric restriction as well as to the heat loss mechanism. RF phase-shifted the peripheral clocks but FD did not affect the clocks in any tissue examined. These findings are better understood by assuming multiple bout oscillators, which are located outside the SCN and directly drive activity bouts uncoupled from the circadian pacemaker by RF or hypothermia.
The time structure of physiology and behaviors in mammals is primarily determined by the circadian pacemaker located in the suprachiasmatic nucleus (SCN) of the hypothalamus. However, introduction of a feeding regimen such as restricted daily feeding (RF; Stephan et al., 1979) and a work for food protocol (WFP; Hut et al., 2011) in small rodents are known to alter the time structure. In the case of RF in the light phase, the prefeeding peak develops in behavior, body temperature, and corticosterone secretion with substantial suppression of circadian rhythms in these measures entrained by a light-dark (LD) cycle (Mistlberger, 1994). The prefeeding peak takes several days to fully develop and persists for several cycles under total food deprivation (FD) after the termination of RF (Coleman et al., 1982). Energy metabolism was changed under RF (Curi and Hell, 1986) and a negative energy balance is required for the development of the prefeeding peak (Honma et al., 1983, 1987b). The prefeeding peak is independent of the SCN circadian pacemaker (Krieger et al., 1977) and hypothesized to be driven by an oscillator in the circadian domain called “the food-entrainable oscillator” (FEO; Stephan et al., 1979) locating outside the SCN. However, neither the location nor the mechanism of FEO is elucidated. The peripheral clocks are affected by RF and change their phase-position (Stokkan et al., 2001). The known clock genes such as Per(s) or Cry(s) are not necessary to express the FEO (Iijima et al., 2005; Storch and Weitz, 2009). On the contrary, WFP in mice gradually phase-advanced the nocturnal activity into the light phase (diurnalization; Hut et al., 2011). There is a positive correlation between the amount of workload and the extent of diurnality (van der Vinne et al., 2014). The SCN circadian pacemaker was not affected but the peripheral clocks such as in liver and adrenal showed phase-advanced shifts by WFP (van der Vinne et al., 2014). Total FD also alters the time structure of behaviors and induced hypothermia in mice (Sakurada et al., 2000).
RF, WFP, and FD in small rodents are associated with hypothermia in the dark phase of LD cycle (Hut et al., 2011; Nagashima et al., 2003; Satoh et al., 2006). The hypothermia is due to not only decreased food intake but also increased heat loss (Nagashima et al., 2003). It occurs during the dark phase when animals are usually active even under constant room temperature. The circadian rhythm in core body temperature is in principle a determinant of a balance between the heat production by metabolism and the heat loss by vasodilatation (Aschoff and Heise, 1972). Heat production is relatively high and heat loss is relatively low in the active phase, and vice versa in the rest phase. The autonomic nervous system is likely involved in the circadian regulation of core body temperature, in which the sympathetic activity stimulates heat production through metabolism and prevents heat loss through vasoconstriction, whereas attenuation of sympathetic activity and/or stimulation of an active vasodilatation of the extremities accelerate heat loss (Tansey and Johnson, 2015). Total FD induces foraging wheel-running activity and develops hypothermia afterward in small rodents, probably through rebound suppression of the sympathetic activity. Rodents such as rats, mice, and hamsters continuously run in the wheel until death from exhaustion. Hypothermia suppresses behavioral activity in the late dark phase and the activity rhythm looks like phase-advanced. Thus, several factors are involved in the development of prefeeding activity peak by RF.
In the present study, effects of RF at different times of day were examined on the time structures of wheel-running and core body temperature in mice to understand the buildup mechanism of the RF-induced prefeeding activity. The obtained results indicate a strong association of the prefeeding activity and multiple activity bouts uncoupled from the circadian pacemaker. In addition, hypothermia developed under RF modified the magnitude and shape of prefeeding activity. Interestingly, thermal tolerance to starvation developed by RF. Based on these findings, a complex oscillator hypothesis for the prefeeding activity was advanced.
Materials and Methods
Animals
Male wild-type (C57BL/6J) and mPER2::LUC knock-in mice (Yoo et al., 2004) of C57BL/6J background were used in this study at 2 to 4 months old. Wild-type mice were purchased from CLEA Japan and kept at least 1 week in our animal quarters where environmental conditions were controlled (temperature 22 ± 2 °C, humidity 60% ± 5%, LD 12:12 h with lights-on at 0600-1800 h). The light intensity at the surface of the cage was ca.100 lux. Mice were fed commercial chow and tap water ad libitum unless otherwise stated. All experiments were performed in accordance with Guidelines for the Care and Use of Laboratory Animals in Hokkaido University with permission No. 12-0064 from the Committee for Animal Experimentation of Hokkaido University.
Experimental Procedure
Animals were transferred to individual cages equipped with a running wheel. Two weeks later, a thermometer device was implanted into the peritoneal cavity. After a recovery period of 2 days, the intraperitoneal temperature was monitored for 7 days under ad libitum feeding. The mice were then divided into four groups to which food was supplied for 3 h from zeitgeber time (ZT) 2 (RF2), from ZT8 (RF8), from ZT14 (RF14), and from ZT20 (RF20) where ZT0 and ZT12 represent time of lights-on and lights-off, respectively. Water was available all the time. The four groups were accordingly designated as RF2, RF8, RF14, and RF20. The RF schedule was started by removing a food cup at 21 h before the time of first RF. From the time of meal removal to the end of meal supply was defined as one RF cycle. The RF schedule was continued for 10 cycles. Following the last meal supply, mice had free access to food for 7 days. On the eighth day of ad libitum feeding, 72-h FD was started from the onset of darkness (ZT12).
Other groups of mice which have never been exposed to RF schedule (naïve mice) were deprived of food for 48 h under LD cycle. FD was started from ZT12. Behavioral activities as well as body temperature were measured continuously before, during, and after 48-h FD.
A few animals died during RF but none during 48- or 72-h FD. In some animals, thermometer devices failed to monitor body temperature during the experiment, the data of which were not used for analyses. Thus, the number of animals that successfully finished the experiment was 10 in RF2, 9 in RF8, 11 in RF14, 14 in RF20, and 7 in 48-h FD (naïve mice).
PER2::LUC knock-in mice were subjected to ad libitum feeding (Control), RF8, RF20, and 48-h FD with the exactly same schedule as mentioned above and to ex vivo experiments for PER2::LUC measurement. The final number of animals was 13 for Control, 10 for RF8, 13 for RF20, and 5 for 48-h FD.
Measurement of Behavioral Activity
The cages (15 cm × 25 cm × 15 cm) equipped with a running wheel (10 cm in diameter) were placed in the light-proof boxes (40 cm × 50 cm × 30 cm). In the boxes, the light intensity was ca. 300 lux at the light phase, and the ambient temperature was kept at 24.0 ± 1.2 °C. Wheel-running activity was expressed as the number of full wheel revolutions per minute. The records were fed into a PC system (Chronobiology kit, Stanford Software Systems) and analyzed by ClockLab (Actimetrics).
Measurement of Abdominal Temperature
Intraperitoneal temperature was continuously recorded with a thermometer device (DS1922L, Thermocron iButton, Maxim Integrated Product Inc., Sunnyvale, CA, USA) containing thermometer, microchip, and battery. The device monitored temperature at 15-min intervals for up to 40 days. The temperature resolution was 0.1 °C. To reduce the weight of device, the stainless steel jacket was removed (Lovegrove, 2009). The device was wrapped with cellophane sheet and coated with paraffin wax (mixed 5 volume of paraffin wax with 1 volume of Evaflex; Masaki et al., 2005). The jacketless device weighed ca. 2.0 g. Implantation of the device into the abdominal cavity was performed under isoflurane anesthesia. After the experiment was over, the device was taken out to read out the data.
Measurement of PER2::LUC Expression in Cultured Tissues
Immediately after the RF schedule or 48-h FD, the SCN, brown adipose tissue (BAT), liver, adrenal grand, and rectus abdominis muscle were cultured as described previously (Nishide et al., 2006). Briefly, the tissues were sampled at around the middle of light phase. A coronal brain slice of 300 μm thick was prepared with Microslicer (Dosaka, Osaka, Japan) including the middle part of the SCN. A bilateral SCN was dissected from the slice with a surgical knife. Liver was sliced into 300 μm thick by tissue chopper (McIlwain, Surrey, England) and dissected with a razor knife. The other peripheral tissues were cut into small pieces. The tissues were explanted on a culture membrane (Millicell CM, pore size 0.4 μm, Millipore) in a 35-mm petridish and cultured with 1.3 mL Dulbecco’s Modified Eagle Medium (DMEM; Gibco-Invitrogen) supplemented with 0.1 mM D-Luciferin K salt (Wako), NaHCO3 (2.7 mM), HEPES (10 mM), kanamycin (20 μg/mL, Gibco), insulin (5 μg/mL, Sigma-Aldrich), putrescine (100 μM, Sigma-Aldrich), human transferrin (100 μg/mL, Sigma-Aldrich), Progesterone HBC complex (2.3 μg/mL, Sigma-Aldrich), and sodium selenite (30 nM, Gibco). The dishes were placed on a luminometer (AB-2550 Kronos Dio, ATTO, Tokyo, Japan) and bioluminescence was measured for 1 min at 10 min intervals. The number of animals was 8 in the control (ad libitum feeding), 15 in RF8, 13 in RF20, and 5 in 48-h FD.
Measurement of Food-intake and Body Weight
Daily food intake was measured by weighing the food pellets and expressed with g/gBW/day. Body weights of animals were measured 4 days before the RF schedule, in Cycles 3 and 10.
Data Analyses and Statistics
Nocturnality index was calculated as follows: the sum of activity in the dark phase was divided by the total (24 h) activity. Thus, when the animal was active exclusively in the dark phase, the index was 1.0, and when it was active exclusively in the light phase, the index was 0.
The appearance day of prefeeding peak was estimated as follows: In the case of RF during the light phase (RF2 and RF8), the peak appearance was defined when the number of activity for 2 h immediately prior to the meal time exceeded the mean activity counts + 3 SD for the corresponding times under ad libitum feeding. The prefeeding peak should continue at least two consecutive days. In the case of RF during the dark phase (RF14 and RF20), the activity level was already high under ad libitum feeding even on the first day of RF. However, the activity counts decreased immediately afterward to a very low level in almost all animals examined. We estimated the day of peak appearance after the initial decline of the activity. In two cases of RF14, the activity onset at the lights-off time continued throughout the RF period, which made it difficult to estimate the appearance day. We excluded these animals from the analyses.
Hypothermia was defined as body temperature lower than the circadian temperature trough under ad libitum feeding before RF (hypothermic temperature [HT]). Hypothermic area under the curve (hAUC) was the area that was below the HT and above the body temperature lower than HT. The hAUC was calculated by summing the differences between HT and the lower body temperature for 24 h or for certain circadian phases. The lowest temperature in the day during RF was referred as the temperature minimum (Tmin), which was not necessarily identical to the circadian trough of temperature rhythm.
The peak circadian phase of PER2::LUC expression was obtained as described previously (Nishide et al., 2012). A set of original time-series data of bioluminescence was smoothed by a 5-point moving average method and detrended by a 24-h moving average subtraction method.
Changes in behavioral activities, core body temperature, food intake, body weight, and circadian parameters of PER2::LUC rhythm were evaluated by one-way or two-way factorial analysis of variance (ANOVA) with post hoc Tukey test (IBM SPSS statistics, version 22.0). In the case of comparison within individuals, one-way or two-way repeated-measure ANOVA with post hoc Tukey test was used.
Results
Buildup Processes of Prefeeding Peaks in Behavior, Hypothermia, and Changes in Nocturnality Index Throughout RF Schedule
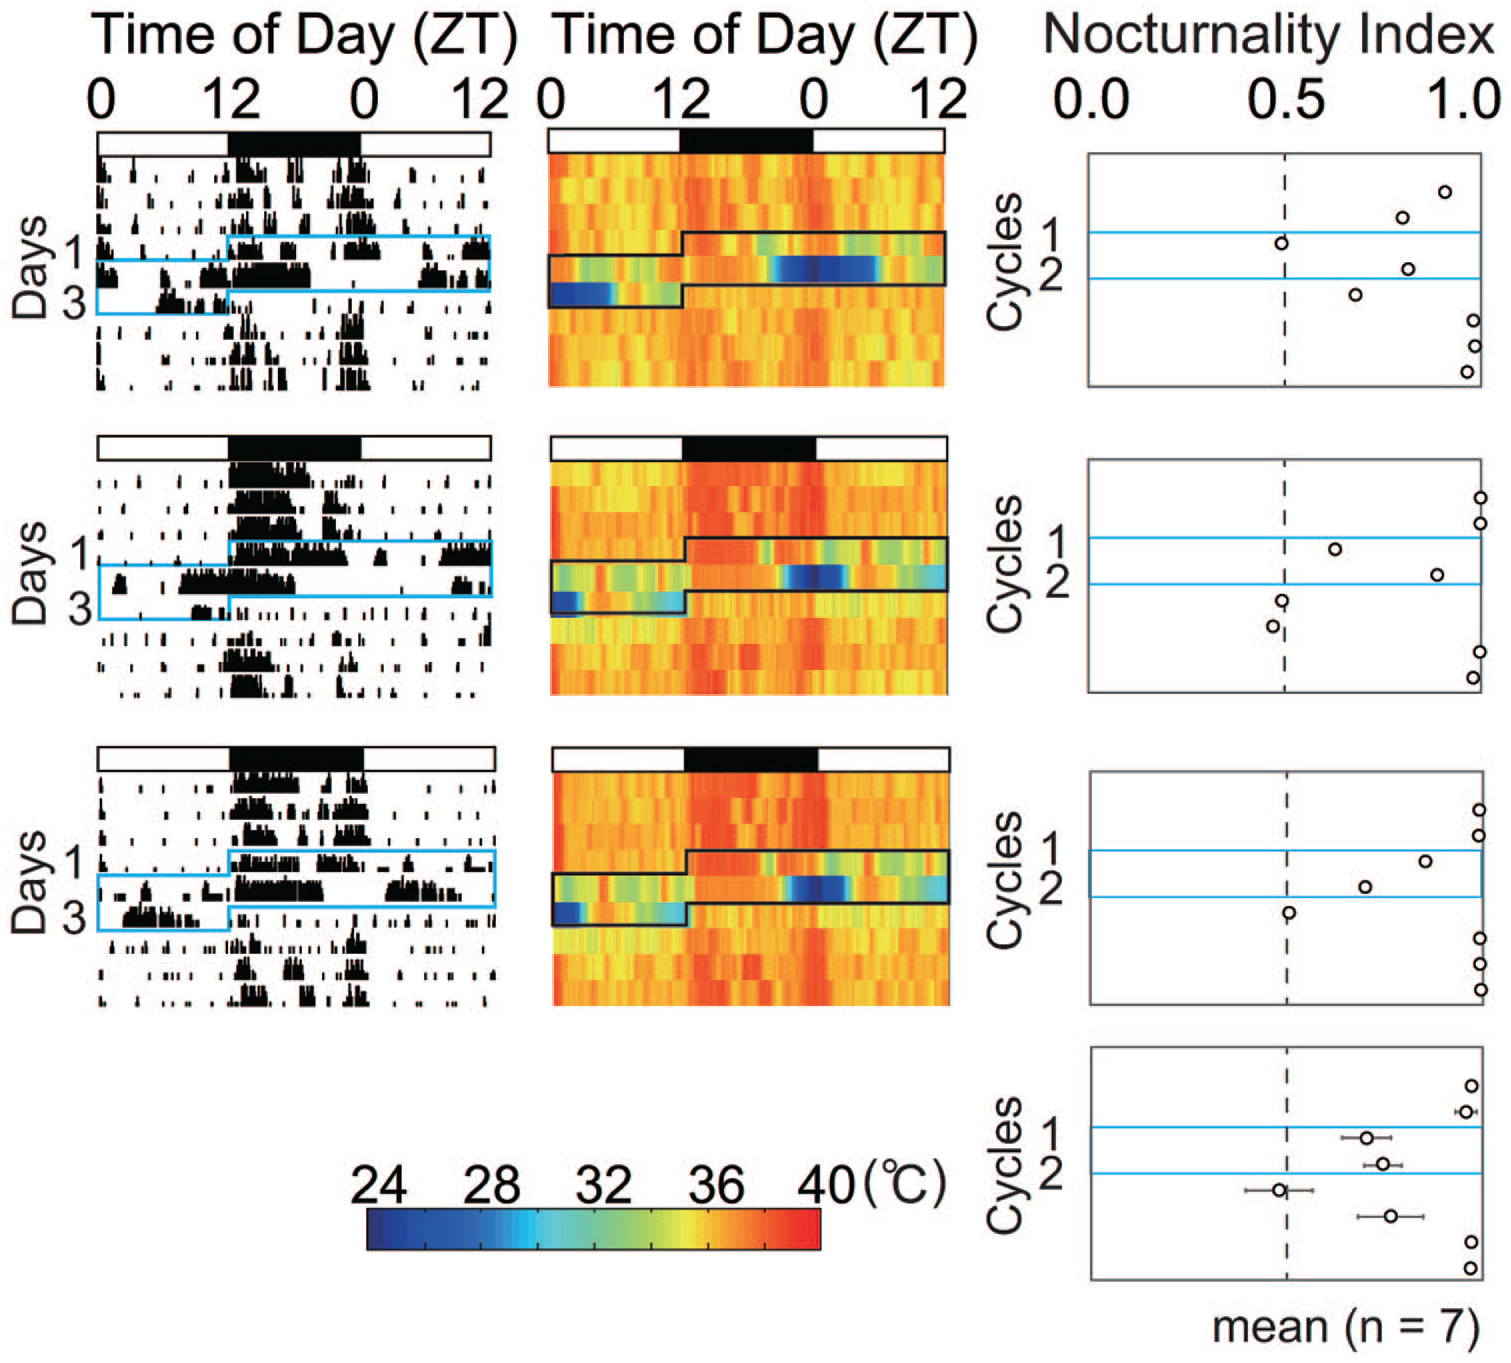
Twenty-four-hour profiles of wheel-running activity, abdominal core body temperature, and nocturnality index were substantially changed during the course of RF of different times of day (Figure 1, Suppl. Figs. S1 and S2). Immediately after the start of RF, the nocturnal activity was suppressed, and activity bouts which composed the activity band under ad libitum feeding showed phase-advance, phase-delay, or both phase-shifts. They caught up with the time of RF and build up the prefeeding peak. As a result, the latency for appearance of the prefeeding peak was significantly different according to the time of RF (p = 3.5E-12, one-way ANOVA), the earliest in RF14 where the time of RF was closed to the activity onset and the latest in RF2 and RF20 where the time of RF is far from the activity onset (Figure 2). Post hoc Tukey test reveals significant differences between two groups (RF2 vs. RF8, p = 1.8E-9; RF2 vs. RF14, p = 0.0011; RF8 vs. RF14, p = 0.00028; RF8 vs. RF20, p = 6.3E-12; RF14 vs. RF20, p = 1.3E-6, a, vs. RF2; b, vs. RF8; c, vs. RF20). Interestingly, the prefeeding peak in RF20 seemed to be built-up not by phase-delay shifts of the onset components but by phase-delay shifts of the offset component (Figure 1 and Suppl. Figs. S1 and S2). The overlays of actograph and thermograph are illustrated in Supplementary Figure S3. The nocturnal activity was also suppressed by FD and nocturnal activity bouts made phase-advance and delay shifts.
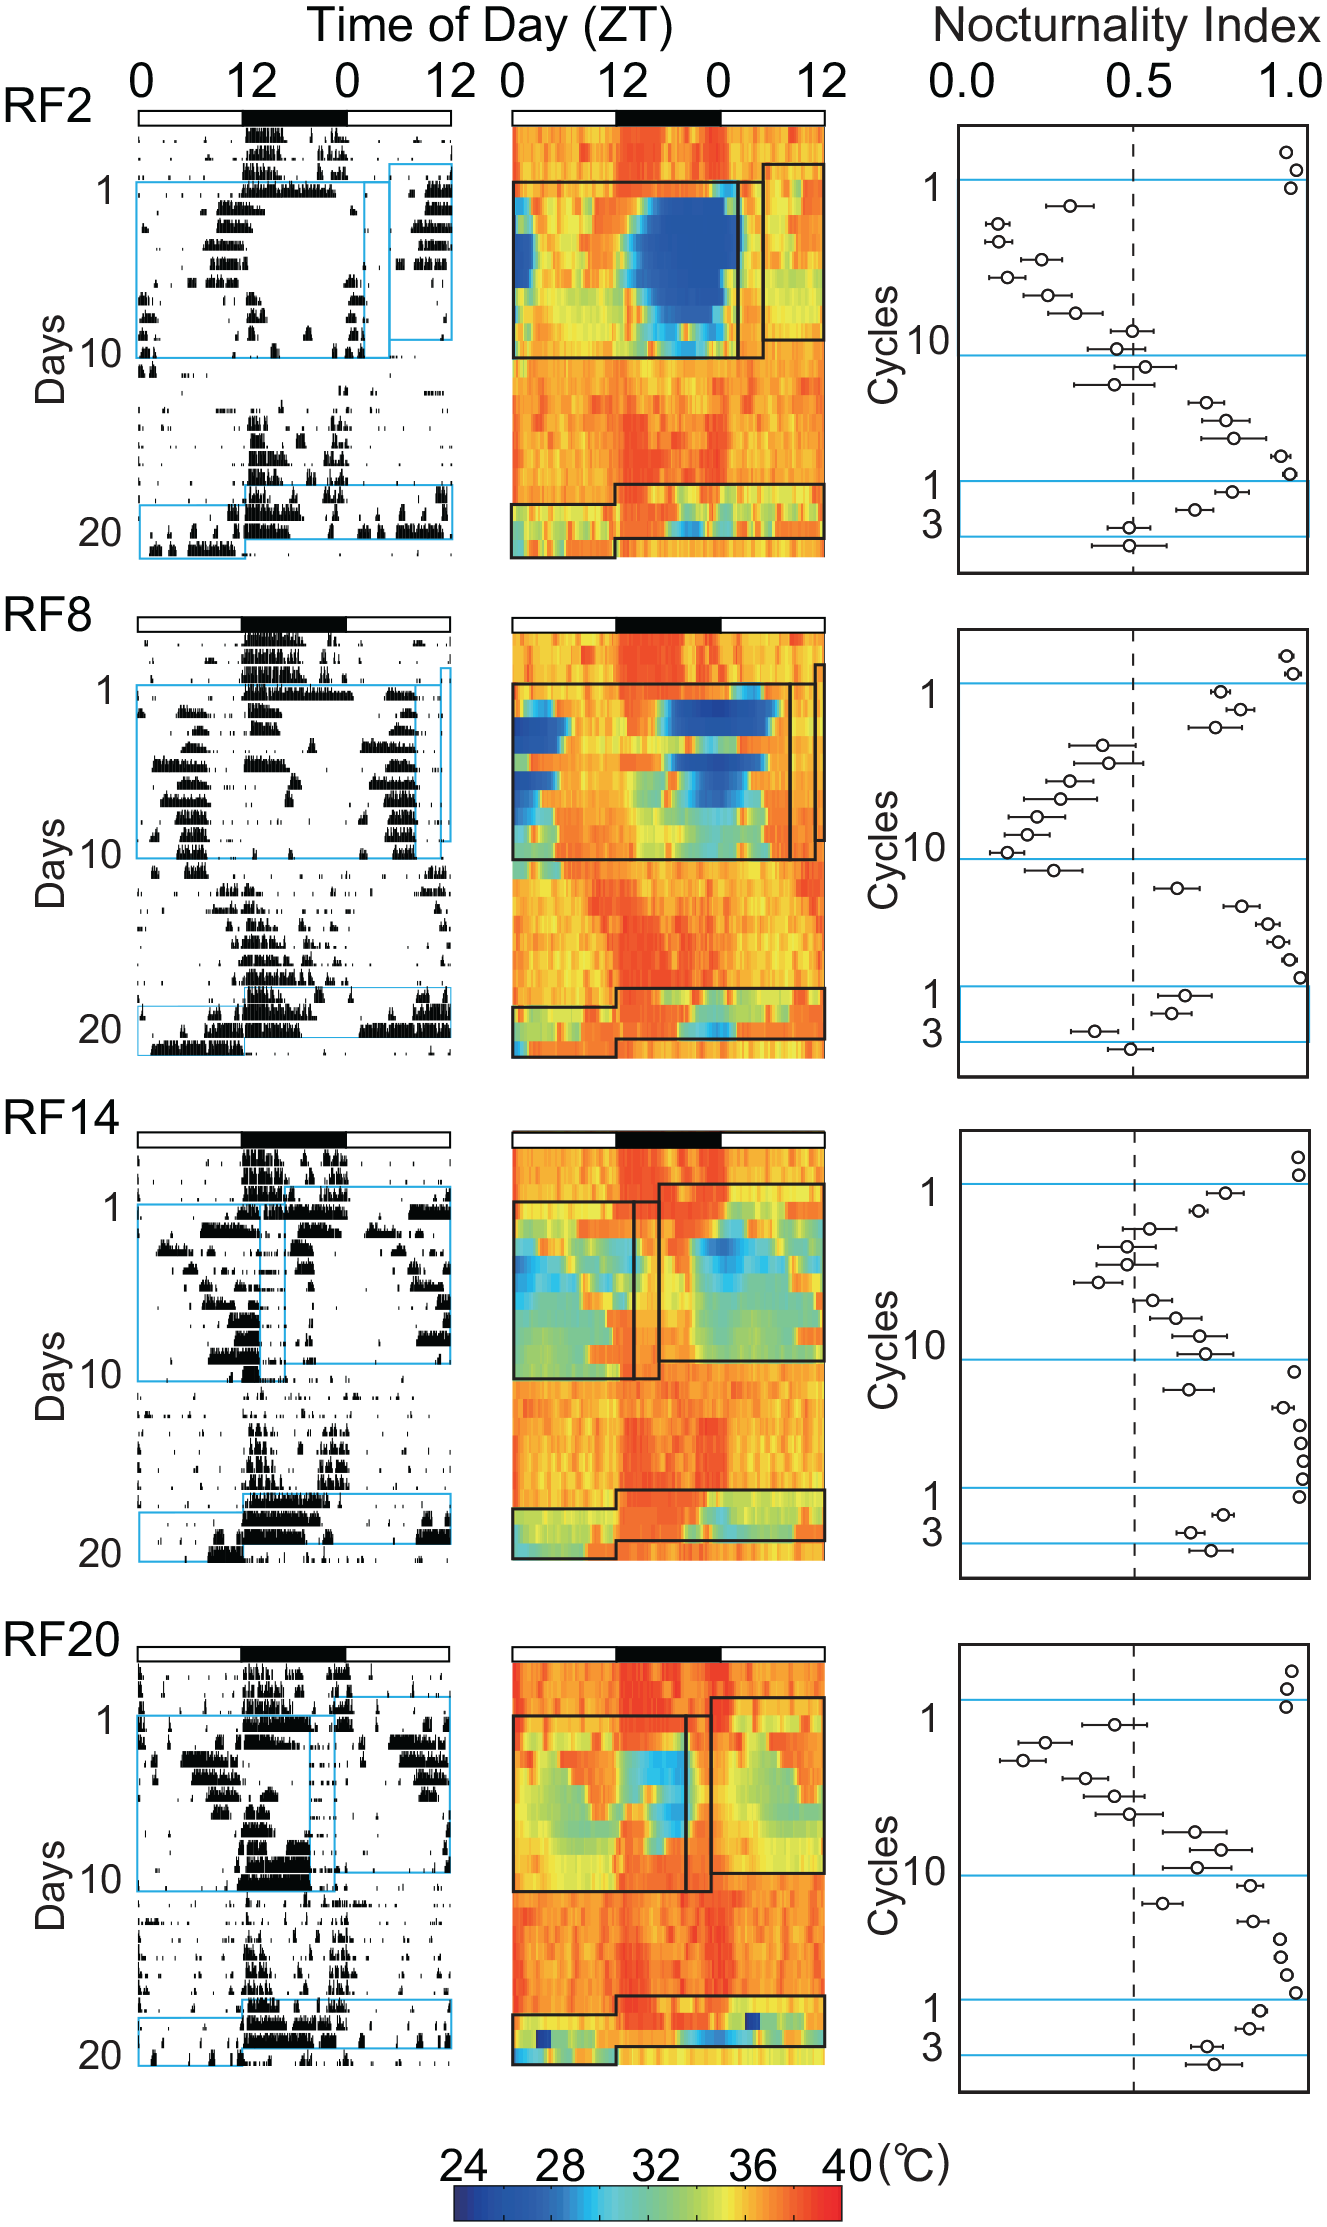
Actogram, body temperature, and nocturnality index in mice subjected to RF and food deprivation. Abbreviations: RF = restricted daily feeding; ZT = zeitgeber time; LD = light-dark. Representative actographs of wheel-running activity (left), core body temperature (middle), and changes of nocturnality index (right) in mice subjected to RF at four different times of day and food deprivation (see text). The ordinate in actographs indicates days from the start of RF schedule and that in nocturnal index the RF cycle. Blue squares in each panel indicate the phases of RF schedule and food deprivation. The abscissa indicates the local time of day (ZT) and the nocturnality index. White and black bars on the top of each panel indicate the light and dark phases of the LD cycle. Wheel-running activity and core body temperature are expressed in 15-min bin. The wheel-running activity is expressed with counts per 15 min and the core body temperature with pseudo-color. Nocturnality index is expressed by mean and standard error of the mean. The scale bar of pseudo-color is located at the bottom of actograph. Columns show the duration of RF and fasting schedule. For the formula of nocturnality index, see the text.
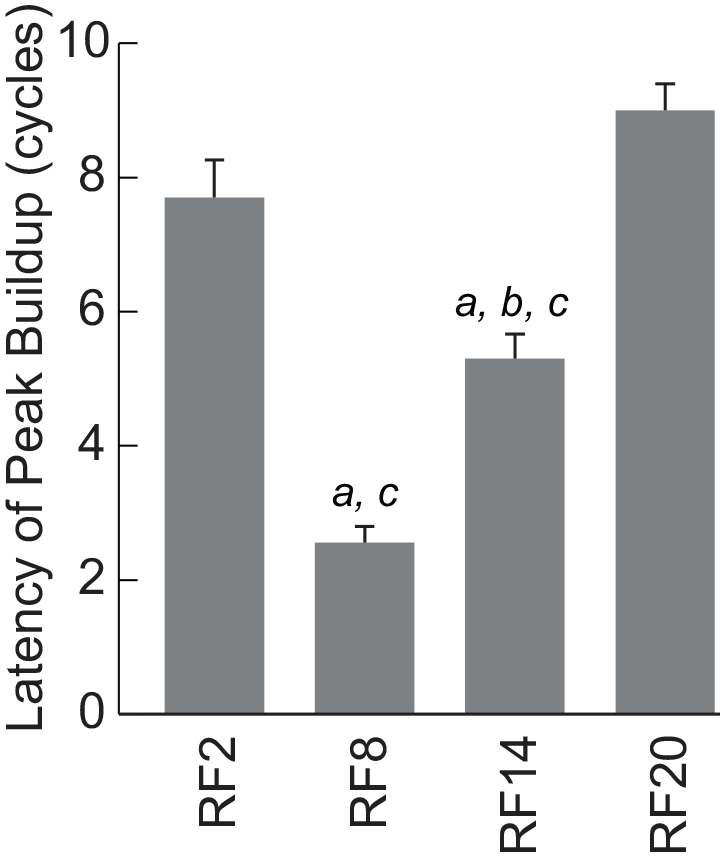
Different latency for appearance of RF peak. Abbreviation: RF = restricted daily feeding. The mean latencies for appearance of RF peak depend on the time of RF. The ordinate indicates the mean cycles of the first RF appearance with standard error of the mean and the abscissa the RF groups (RF2, n = 10; RF8, n = 9; RF14, n = 11; RF18, n = 14). There is significant difference among the groups.
The hypothermia developed immediately after the start of RF schedule. The hypothermia was evident from the late dark phase to the early light phase, irrespectively of the time of RF, although masking effects of meal feeding modified the feature of hypothermia. The hypothermia was alleviated as the RF schedule proceeded. The FD also induced hypothermia from the late dark phase to the early light phase.
Nocturnality index significantly decreased suddenly (RF2, RF20) or gradually (RF8, RF14) in all RF groups after the start of RF (RF2, p = 4.8E-8; RF8, p = 3.1E-6; RF14, p = 5.8E-9; RF20, p = 1.5E-7, one-way repeated-measure ANOVA). After the termination of RF schedule, nocturnal index returned to 1 gradually (RF2) or rapidly (RF14). Nocturnal index was decreased by FD.
Development of the Prefeeding Peak in Activity
Since the development of the prefeeding peak in wheel-running activity depends on the time and cycle of RF, we used the concept of “cycle” to denote the sequence of RF schedule, instead of a “Day” which was based on the LD cycle. The cycle starts from the begining of FD or the end of previous meal to the end of the following meal time.
Development of the prefeeding peak depended on the time of RF. At Cycle 3-4, the activity peak did not appear in RF2 and RF20 (Figure 3). The peak appeared in RF8 and RF14, but the amplitude of peak was small as compared with those at Cycle 9-10. In all RF groups, we detected activity bouts in the light phase at Cycle 3-4. At Cycle 9-10, the prefeeding peak buildup in RF2 and RF20 and the peaks in RF8 and RF14 were significantly larger than those in Cycle 3-4. In RF20, the prefeeding activity peaked several hours before RF and declined afterward. The amplitude of prefeeding peak immediately prior to RF was significantly higher in RF2, RF8, and RF14 than that in RF20 (p < 0.05, Mann-Whitney U test). Interestingly, the total number of wheel revolutions in 36 h was not different between Cycle 3 to Cycle 4 (Cycle 3-4) and Cycle 9-10.
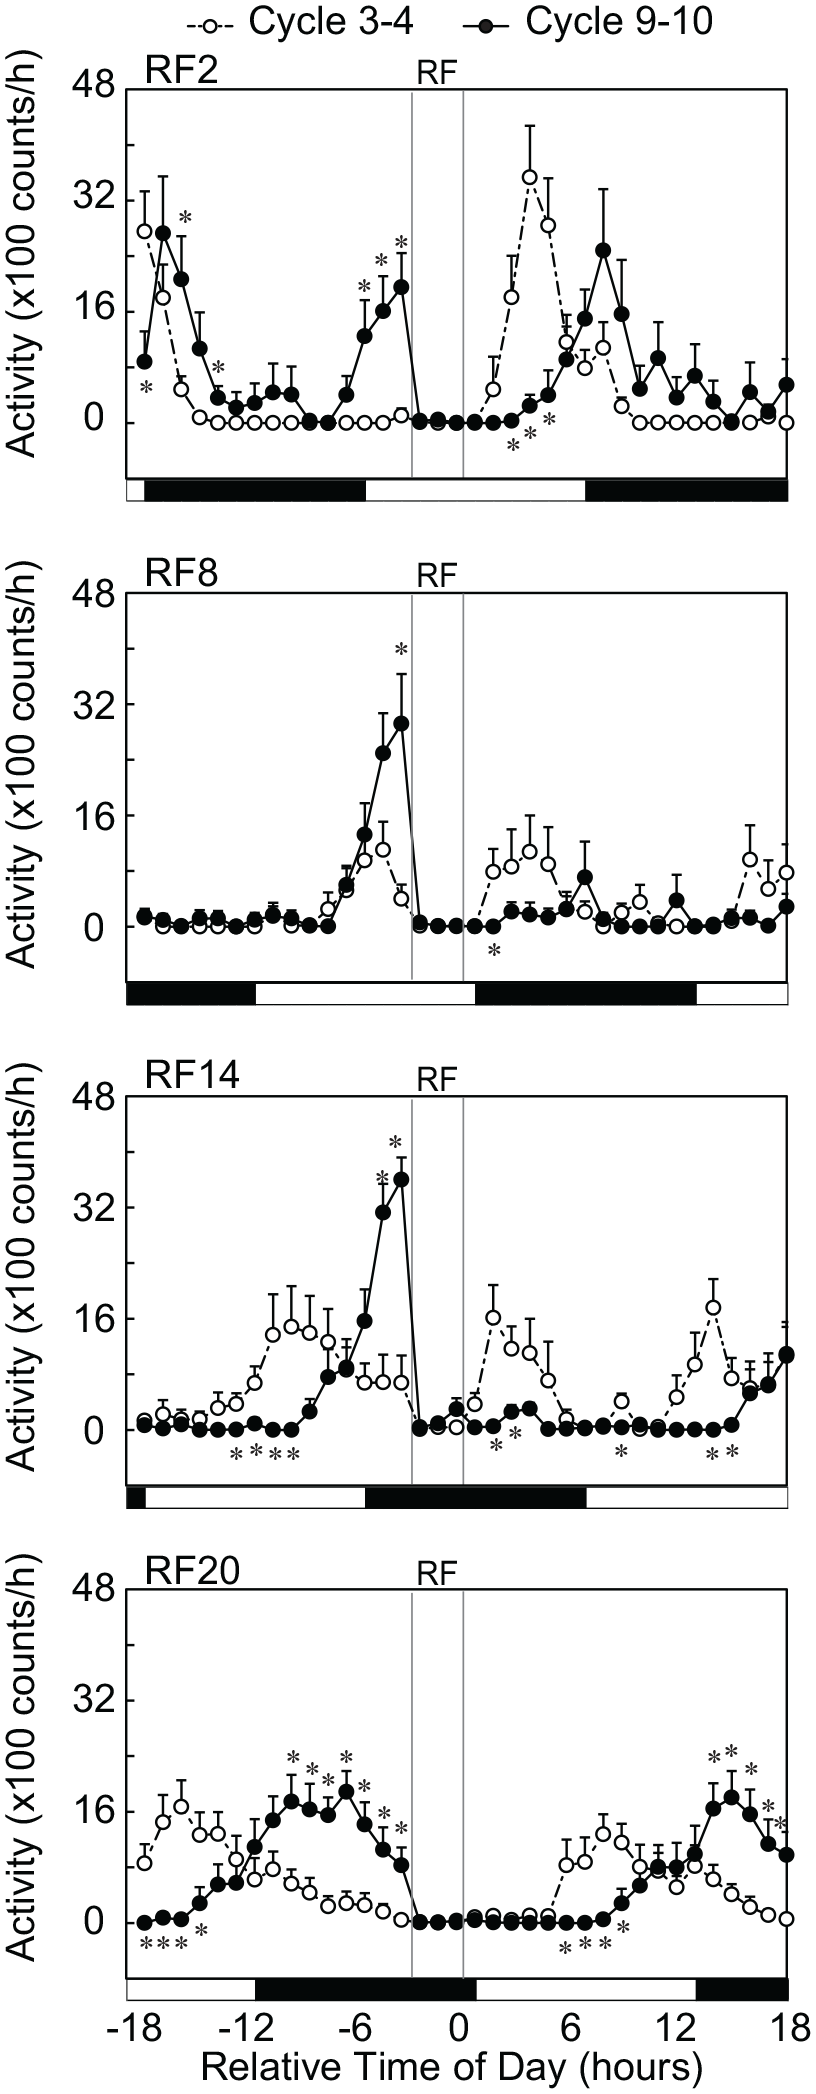
Changes in magnitude of RF peak in the course of RF schedule. Abbreviations: RF = restricted daily feeding; LD = light-dark; ANOVA = analysis of variance. The mean running wheel activities in Cycle 3-4 and Cycle 9-10 are illustrated for each RF group. Running wheel activity is averaged in 15-min bin throughout 36 h (last 18 h in the preceding cycle and first 18 h in the succeeding) and expressed by open circles with broken lines for Cycle 3-4 or by closed circles with solid lines for Cycle 9-10. Activity is expressed with the mean and standard error of the mean. The abscissa indicates the relative time from the end of daily feeding. The feeding period is marked with a column in each panel. The horizontal white and black bars indicate the light and dark phase of the LD cycle.
Dependence of Phase and Severity of Hypothermia on the Time and Cycle of RF
Hypothermia developed immediately after the start of RF and reached the lowest level in a few cycles (Figure 1). The extent of hypothermia was changed among the RF groups and the cycle of RF in terms of the minimum body temperature (Tmin) and the hAUC (Figure 4). There is significant difference among RF groups on Day 3 (p = 9.9E-9) and on Day 10 (p = 0.007) by one-way ANOVA. Post hoc Tukey test reveals significant differences between two groups on Day 3 (RF2 vs. RF14, p = 3.5E-7; RF2 vs. RF20, p = 1.1E-5; RF8 vs. RF14, p = 3.1E-6; RF8 vs. RF20, p = 0.00010) and on Day 10 (RF2 vs. RF14, p = 0.0071). The hAUC on Day 10 is significantly smaller than that in Day 3 in each group (RF2, p = 2.5E-9; RF8, p = 3.1E-9; RF14, p = 0.0045; RF20, p = 0.0027). The Tmin decreased significantly in Cycle 1 and reached the lowest levels in a few days (Suppl. Fig. S3). The Tmin levels were near room temperature. The Tmin in all RF groups gradually increased from Cycle 4 and became significantly higher on Cycle 10 than the lowest level of Tmin (p = 0.000021, two-way repeated-measure ANOVA).
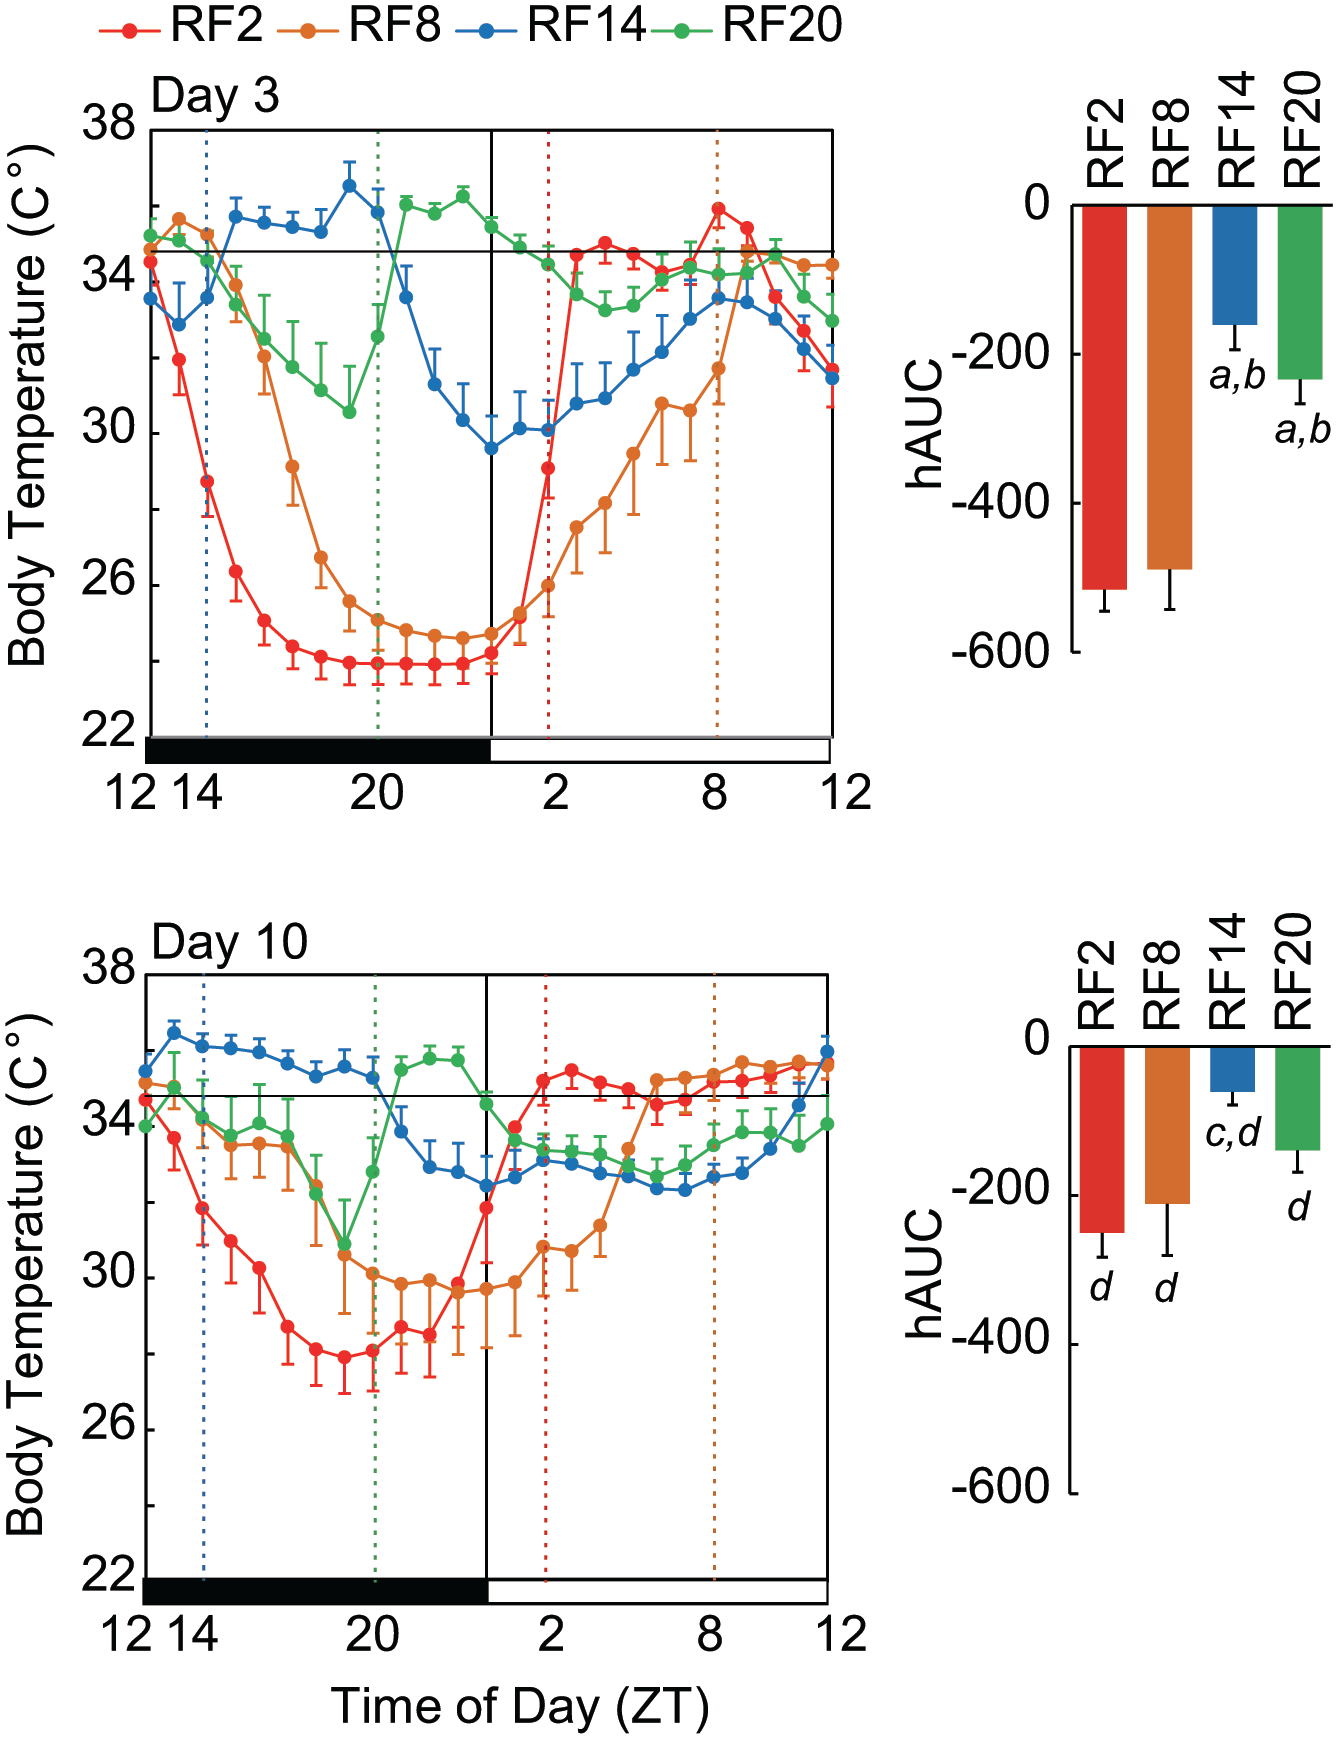
Hypothermia in each RF group and on Days 3 and 10. Abbreviations: RF = restricted daily feeding; hAUC = hypothermic area under the curve; SEM = standard error of the mean; ZT = zeitgeber time. Extent of hypothermia depends on RF groups and the time course of RF. In the upper panel, mean body temperature at 1-h intervals (left) and extend of hypothermia (right) in terms of hAUC for 24 h are illustrated in each RF group on Day 3, and in the lower panel on Day 10. Values are expressed by the mean and SEM. A horizontal bar in each panel indicates the mean circadian trough level of body temperature. Character indicates significant difference by post hoc Tukey test (a, vs. RF2 on Day 3; b, vs. RF8 on Day 3 c, vs. RF2 on Day 10; d, vs. a value of respective group on Day 3).
The phase of hypothermia also depended on the time of RF (Figure 4). Hypothermia was detected from the middle dark phase to the early light phase in all RF groups, although masked by meal feeding. In RF20, hypothermia was biphasic, once at the middle dark phase and once at the early light phase. The prefeeding level of core body temperature was low in all RF groups at Cycle 3-4 but elevated to the prandial level at Cycle 9-10, except for RF20.
Hypothermia disappered immediately after returning to ad libitum feeding and the circadian rhythmicity was blurred (Figure 1).
Wheel-running Activity, Hypothermia, and Nocturnal Index Under 48 h Total FD
Seven days after the return to ad libitum feeding, the animals were totally deprived of their food pellets for 72 h. The naïve mice to RF were also subjected to total FD for 48 h. The FD was started from the time of lights-off. The activity band was phase-advanced, phase-delayed, or became ultradian-like rhythms in RF groups and the naïve mice (Figures 1 and 5, Suppl. Figs. S1, S2, and S4) and the nocturnal index significantly decreased (Figures 1 and 5). Hypothermia appeared at the late dark to early light phase in all RF and naïve mice (Figures 1 and 5, Suppl. Fig. S4). The average of body temperature at ZT23-1 on the second day of FD was significantly lower in the naïve group than all four RF groups (p = 0.000013, one-way ANOVA, Figure 6). Post hoc Tukey test reveals significant differences between RF groups and naïve (vs. RF2, p = 0.00010; vs. RF8, p = 0.00045; vs. RF14, p = 8.2E-5; vs. RF20).
Wheel-running activity, core body temperature, and nocturnality index in mice subjected to 48 h food deprivation. Abbreviation: ZT = zeitgeber time. Representative wheel-running activity, core body temperature, and nocturnality index in mice subjected to 48 h food deprivation. The ordinate indicates days or cycles from the start of food deprivation. Horizontal column in each panel shows the period of food deprivation. The mean nocturnality index is shown. See also the legend of Figure 1.
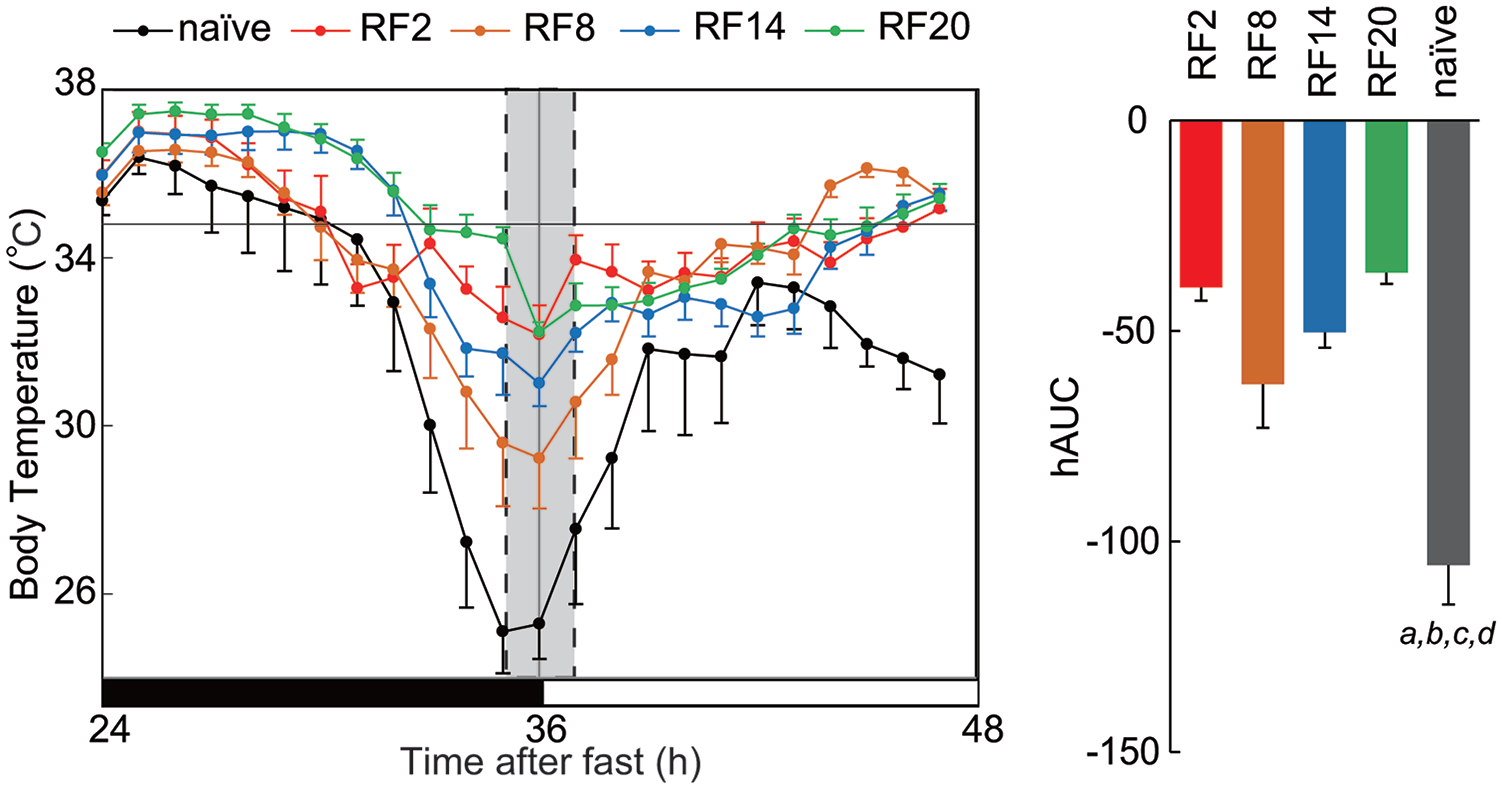
Core body temperature on the second day of food deprivation in RF experienced and naïve mice. Abbreviations: RF = restricted daily feeding; hAUC = hypothermic area under the curve; SEM = standard error of the mean. The mean of core body temperature is illustrated in each RF group and naïve mice on the day of food deprivation (left). The mean temperature is calculated at 1-h intervals and expressed with SEM. The mean hAUC is demonstrated by vertical column with SEM (right). A horizontal line in the panel indicates the mean circadian trough level. Significant difference is detected between all RF groups and naïve mice as well as among RF groups. Character indicates significant difference by post hoc Tukey test (a, vs. RF2; b, vs. RF8; c, vs. RF14; d, vs. RF20).
Circadian PER2::LUC Rhythms in the SCN, BAT, Liver, Adrenal Gland, and Muscle in Mice Subjected to RF and 48-h Total FD
Circadian PER2::LUC rhythms were measured in the cultured SCN, BAT, liver, adrenal, and muscle and the circadian peak phase on the first day of culture was assessed in Control (fed ad libitum), RF8, RF20, and FD (48-h FD) mice (Figure 7, Suppl. Fig. S5). One-way ANOVA with post hoc Tukey test reveals significant phase-shift from Control (BAT of RF8, p = 0.00038; liver of RF8, p = 3.5E-5; muscle of RF8, p = 0.023; body temperature of RF8, p = 2.3E-5; muscle of RF20, p = 0.0050; body temperature of RF20, p = 1.0E-12; body temperature of FD, p = 8.4E-6). In RF8, the circadian peak phases in these tissues were phase-advanced, except for the adrenal gland. However, the amount of phase-shifts was different among the tissues. The mean phase-shift was 5.4 ± 0.4 (mean ± SEM) h in the BAT, 7.1 ± 0.2 h in the liver and 2.6 ± 0.3 h in the muscle. In RF20, the circadian phase in muscle was significantly phase-delayed by 3.0 ± 0.8 h. Forty-eight-hour FD did not affect the circadian phases in these tissues except for the adrenal gland (vs. Contol, p < 0.05).
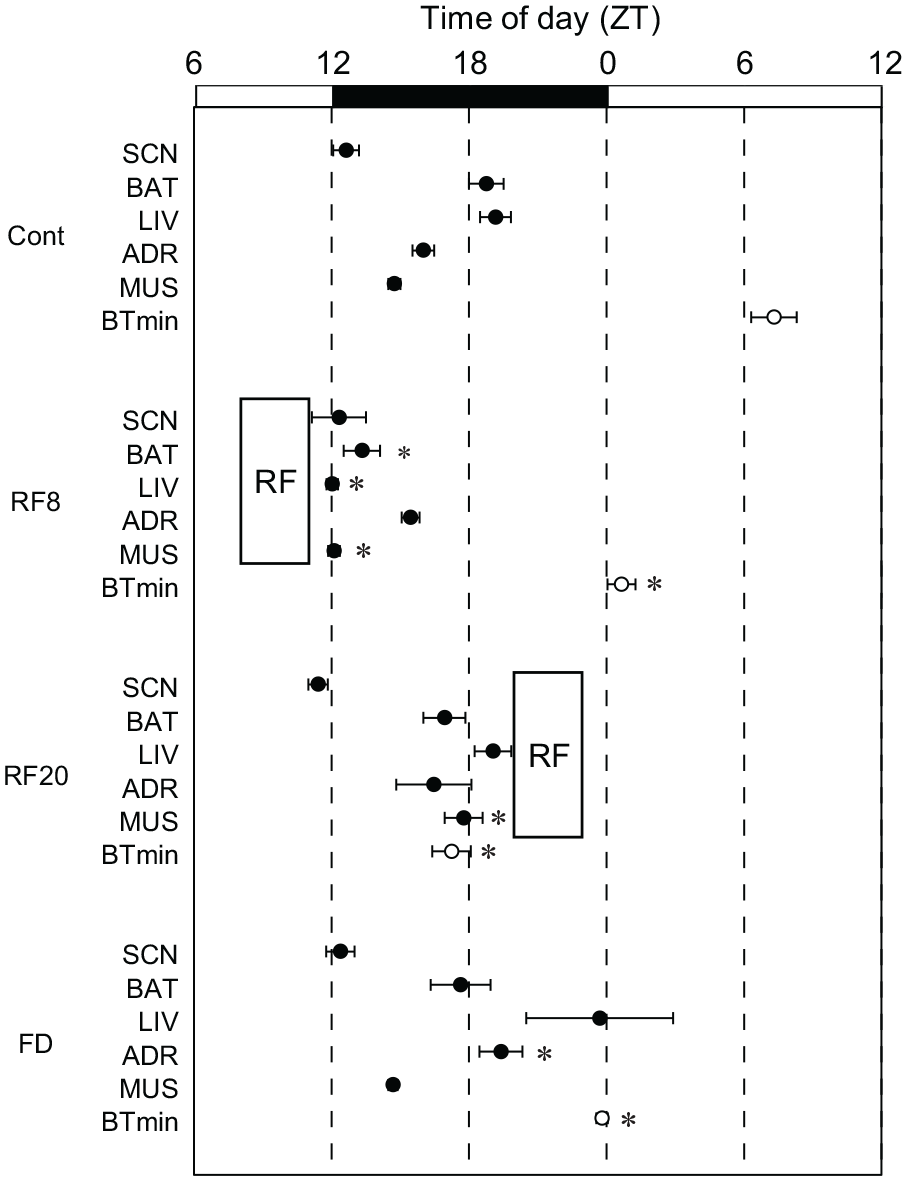
Phase-map of the first circadian peak of PER2::LUC rhythm in culture. Abbreviations: SCN = suprachiasmatic nucleus; BAT = brown adipose tissue; FD = food deprivation; SEM = standard error of the mean; LD = light-dark; RF = restricted daily feeding. The first peak phases in five different tissues (SCN, BAT, liver as LIV, adrenal gland as ADR, muscle as MUS) in culture obtained from circadian PER2::LUC rhythms. The tissue samples are obtained from mice under ad libitum feeding (Cont), immediately after the termination of RF schedule (RF8, RF20) or 48 h FD (FD). The peak phases are illustrated in phase-map. The trough phase of core body temperature are also indicated (BTmin). Values are expressed as the mean and SEM. White and black bars on the top of each panel indicate the light and dark phase of the LD cycle. A vertical column indicates the time of RF.
Food Intake and Body Weight
Food intake at Cycle 1 significantly decreased to almost one-third of that under ad libitum feeding immediately prior to RF (Suppl. Fig. S6). The decrease in RF2 (0.128 ± 0.006 g/gBW/day) and RF8 (0.115 ± 0.010 g/gBW/day) was much larger than those in RF14 (0.086 ± 0.008 g/gBW/day) and RF20 (0.084 ± 0.006 g/gBW/day) (RF2 vs. RF14, p = 0.00068; RF2 vs. RF20, p = 0.00014; RF8 vs. RF14, p = 0.028; RF8 vs. RF20, p = 0.010, one-way ANOVA, post hoc Tukey test). Food intake increased from Cycle 5 and reached approximately 80% of the pre-RF level at Cycle 10. The total food intake during the RF schedule was not significantly different among the RF groups.
Body weight also significantly decreased at Cycle 3 from the pre-RF level by approximately 10%, irrespective of the RF groups (p = 4.8E-44, two-way repeated-measure ANOVA). However, body weight at Cycle 10 was not significantly different from the pre-RF level except for RF20, in which body weight was still significantly lower than the pre-RF level by approximately 7.5% (Suppl. Fig. S7).
Discussion
The present study shows the following novel findings which may contribute to the understanding of the mechanism for changes in time structure of physiology and behavior by RF in mice. First, the development of prefeeding activity involves the phase-shifts of activity bouts which composed the activity band of circadian behavioral rhythm under ad libitum feeding. The direction of phase-shifts depends on the time of RF. Second, the magnitude of prefeeding activity depends on the time and stage of RF. Third, the extent of RF-induced hypothermia depends on the time and stage of RF but the phase is fixed at the transition from the dark to the light period. Fourth, RF develops thermal tolerance to FD. Fifth, the circadian PER2::LUC in the peripheral organs is phase-shifted toward the time of RF but not by FD. These findings allow us to advance a novel interpretation for the development of prefeeding activity by RF and the attenuation of nocturnality by limited food supply in mice.
Development of Prefeeding Activity of Wheel-running by RF
Prefeeding activity of wheel-running is generally accepted as the expression of FEO. The development of prefeeding activity takes several days when RF is imposed in the early light phase. In the present study, the appearance of prefeeding activity depended on the time of RF and associated with the phase-advance or phase-delay shifts of activity bouts which composed the activity band of circadian behavioral rhythm under ad libitum feeding. Interestingly, the direction of phase-shifts was different according to the time of RF. Phase-advance shifts of the onset bouts were detected in RF2 and RF8, while phase-delay shifts of offset bouts were seen in RF14 and RF20 (Figure 1). As a result, the time required for the appearance of prefeeding activity was different (Figure 2); immediate in RF8, in which the feeding time was relatively close to the onset of activity band, whereas the appearance was relatively late in RF2, in which the time of RF was far from the onset of activity band. The same is true for phase-delay shifts of activity offset. These findings suggest first the activity bouts that used to be circadian activity components uncouple and entrain to RF. Previously, two different activity bouts were demonstrated to appear under RF in the SCN lesioned rats, which separately entrained to phase-shifted RF with one phase-delaying and the other phase-advancing (Stephan, 1992). Also, two prefeeding activity bouts were demonstrated to develop under dual RFs in a day (Bolles and Moot, 1973; Stephan, 1989; Mistlberger et al., 2012). These findings together with the present results strongly support the involvement of two different oscillators in RF-induced prefeeding activity. Since the prefeeding activity develops without the SCN, these putative oscillators are likely located outside the SCN. We call them bout oscillators which are coupled with the SCN circadian pacemaker under ad libitum feeding but are able to uncouple from it under special conditions (Honma et al., 2014). The onset components are regulated by bout oscillators with circadian periods shorter than 24 h and the offset components by the oscillators with the periods longer than 24 h. In this respect, the development of prefeeding peak and FEO is quite similar to the methamphetamine (MAP) induced behavioral rhythm which also does not depend on the SCN (Honma et al., 1987a). MAP-induced behavioral rhythm is the expression of MAP-induced oscillation (MAO) which is most likely constructed by the reorganization of bout oscillators in the brain outside the SCN (Honma et al., 2014). These bout oscillators are otherwise entrained by the SCN circadian pacemaker. MAO desynchronizes the bout oscillators from the SCN circadian pacemaker or reorganizes the non-SCN oscillators in the SCN lesioned animals (Natsubori et al., 2014).
The magnitude of prefeeding activity depended on the time of RF in a day as well as the stage of RF (Figure 3). The prefeeding activity became larger in general in the late stage of RF, suggesting the progressive assembly of activity bouts. Interestingly, the prefeeding activity in RF20 peaked several hours prior to RF and decreased toward the meal time, which was not detected in other RF regimens. This could be due to the suppression of activity by hypothermia at the late dark phase (Figure 4). Hypothermia modified the shape of prefeeding activity in various extents.
Development of Hypothermia by RF
Hypothermia was detected already on the first RF cycle and became progressively profound toward the third cycle. The body temperature in RFs during the light phase went down to near room temperature, which was however alleviated afterward (Figure 4). In the early stage of RFs, the hypothermia was observed in the late dark to the early light phase, irrespectively of the time of RFs. However, the extent of hypothermia depended on the time of RF, more profound in RFs in the light phase than those in the dark (Figure 4). These differences could be explained by the circadian rhythm in thermoregulation and masking effects of RF. The circadian rhythm in core body temperature is the results of heat production and heat conservation in the active phase and attenuation of heat production and acceleration of heat loss in the rest phase (Aschoff and Heise, 1972). The autonomic nervous system is involved in both heat production and heat loss. Sympathetic activity accelerates heat production by energy metabolism and heat conservation by vasoconstriction, and parasympathetic activity promotes heat loss through vasodilation. It is a matter of debate whether the acceleration of heat loss in the rest phase is due to attenuation of the sympathetic activity and/or activation of vasodilation by parasympathetic activity (Tansey and Johnson, 2015). The mechanism of daily fluctuation of core body temperature could be applied to nocturnal rodents such as rats (Honma and Hiroshige, 1978b).
RF-induced hypothermia is essentially similar to starvation-induced low temperature (Satoh et al., 2006; Nagashima et al., 2003). The phase of hypothermia is primarily determined by the LD cycle. Nagashima et al. (2003) demonstrated that the peripheral skin temperature of starved rats increased when they entered in hypothermia and decreased when they returned from it, while oxygen consumption, an indicator of heat production, remained constantly low throughout the day. The authors concluded that the starvation-induced hypothermia was primarily due to suppression of heat preservation. Starvation was reported to reduce sympathetic activity (Young and Landsberg, 1977) and to decrease tolerance to cold (Avakian and Horvath, 1981). Hypothermia did not develop in rats with bilateral SCN lesions (Liu et al., 2002) or was less prominent in arrhythmic Cry double deficient mice (Nagashima et al., 2005). These findings also indicated that starvation-induced hypothermia is not simply due to reduction of energy supply or heat production, but to the circadian niches of thermoregulation. In this respect, it is of interest to note that the onset of torpor in hamsters always occurs at the transient from the dark to light phase of LD cycle (Ruby, 2003).
In small rodents, the body temperature is heavily masked by behavioral activity and specific dynamic action of meal eating. Alternatively, suppression of nocturnal behavioral activity was accompanied by hypothermia. It could be a matter of debate whether behavioral activity is suppressed by hypothermia or hypothermia was interrupted by physical activity. The mechanism of masking effects of behavioral or hypothermia on either of them are not well understood. In the present study, the prefeeding activity bout was accompanied by increase of core body temperature, where the body temperature started to increase far before the burst of prefeeding activity (Figures 3 and 4). A similar phase relation between a single bout of behavioral activity and core body temperature was reported in rats which showed ultradian rhythms under constant light (Honma and Hiroshige, 1978a). A common central command may stimulate both increases of body temperature and behavioral activity. The idea is consistent with the results of a recent study, in which optogenetic stimulation of the preoptic GABAergic neurons was reported to suppress behavioral activity together with body temperature (Zhao et al., 2017). In the present study, the time of hypothermia was essentially independent of the time of RF, at least in its early stage. In addition, there was detected only a slight difference in food intake among different RFs, and the amount of food intake was not correlated with the severity of hypothermia (Figure 4, Suppl. Fig. S6). Taken together, hypothermia induced by RF is most likely due to the acceleration of heat loss by starvation, the phase of which is controlled by the circadian rhythm in the autonomic nerve activity, and modified by the prefeeding behavioral activity and prandial heat production, which are more prominent in the latter stage of RF.
Total FD and Thermal Tolerance
By 48-h total FD imposed 7 days after the termination of RF, hypothermia developed on the second cycle at the late dark phase irrespectively of the time of previous RF (Figure 1). The extent of hypothermia was less prominent in mice which had experienced RF than the naïve mice (Figure 6), indicating that the thermal tolerance developed during RF. In addition, the onset of nocturnal activity phase-advanced and the nocturnality index decreased in all animals examined. Starvation induced hypothermia was well documented but the interpretation of hypothermia as for its mechanism was inconsistent. The hypothermia was attributed to the change in thermo-effector thresholds (Sakurada et al., 2000), to the attenuation of the heat conservation mechanism (Nagashima et al., 2003), or to the changes in the energy metabolism which was not related to locomotor activity (Satoh et al., 2006). Whatever the mechanism might be, RF-induced hypothermia may contribute to the development of tolerance to starvation-induced hypothermia.
Circadian Clocks in the SCN and Peripheral Tissues
The circadian clock in the SCN in terms of circadian PER2::LUC rhythm was not affected by RF (Figure 7), as reported previously (Stokkan et al., 2001). On the contrary, except for the adrenal gland, the peripheral clocks in the tissues examined were significantly phase-shifted by RF in the light phase. RF in the dark phase did not produce phase-shifts except for muscle. The amount of phase-shifts was larger in the BAT and liver than in muscle, suggesting that the sensitivity to the time cues or the time cue itself was different in these peripheral clocks. The prefeeding activity, meal feeding, hypothermia could be the candidates for possible time cues.
Forty-eight-hour FD did not significantly affect the phases of peripheral clocks in these organs except for the adrenal gland, indicating that FD itself does not seem to be potent enough to affect these peripheral clocks. Since the fasting continued only 2 days, the possibility remains that they are in transient of phase-shifting or desynchronization. On the contrary, the nocturnal wheel-running activity either phase-advanced or delayed (Figure 5, Suppl. Fig. S4), suggesting that the bout oscillator(s) in the brain are uncoupled by starvation.
Possible Mechanism for the Formation of Prefeeding Activity by RF
The mechanism of phase-shifts of activity bouts into the light phase seems to be common phenomenon among RFs of different meal time and the total FD. Phase-shifts were detected in the first cycle of RF or FD in most animals. The simplest explanation for this phenomenon is a positive masking by foraging activity and a negative masking by hypothermia-associated suppression of activity. However, this hypothesis does not explain the different direction of phase-shifts observed in RF of different time and total FD. Previously, we postulated the presence of extra-SCN oscillators in the brain, which directly drive activity bouts and were called bout oscillators (Honma et al., 2014). The bout oscillators have intrinsic periods in the circadian domain and entrain to the SCN circadian pacemaker under ad libitum feeding. Starvation itself or starvation-induced hypothermia may uncouple the bout oscillators from the SCN pacemaker to allow free-running. The onset components of activity band are driven by the bout oscillators with a period shorter than 24 h, and the offset components are driven by the oscillators with a period longer than 24 h. Under such conditions, activity bouts desynchronize from each other, and time structure of behavioral activity will eventually be lost. In the presence of a non-photic time cue such as RF, the bout oscillators entrain to it and form FEO. The buildup process of prefeeding activity could be explained by the re-entrainment of bout oscillators to RF. Masking effects of hypothermia may modify the entrained activity. The hypothesis is illustrated in Figure 8. The evening and morning oscillators in the SCN (Yoshikawa et al., 2017) may couple with the bout oscillators, which drive the onset components and offset of activity band, respectively.
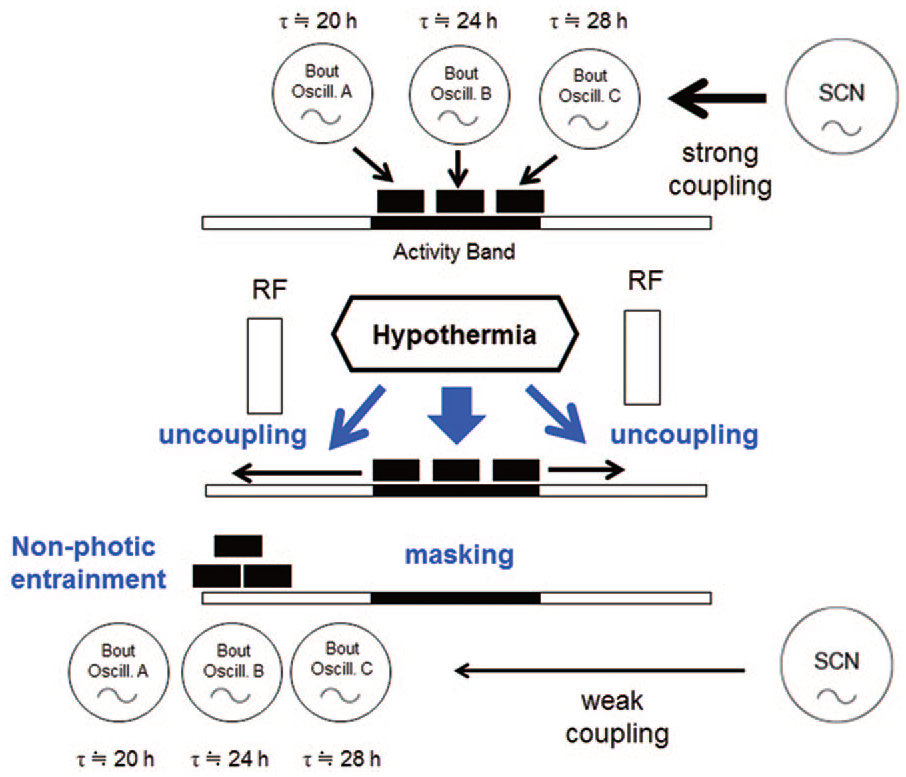
A bout oscillator hypothesis. Abbreviations: SCN = suprachiasmatic nucleus; LD = light-dark; RF = restricted daily feeding. Bout oscillators drive directly an activity component of the circadian behavioral rhythm and strongly coupled with the SCN pacemaker, resulting in the LD entrained activity band (upper). Each bout oscillator has a different intrinsic circadian period, for instance, 20 h, 24 h, 28 h. By RF, or RF-induced hypothermia, the bout oscillators are uncoupled from the SCN circadian pacemaker and entrained to meal time (lower). The nocturnal activity is negatively masked by hypothermia.
Conclusion
In conclusion, the temporal structures of wheel-running activity and core body temperature in mice under RF depend on the time and stage of RF schedule. Hypothetical bout oscillators are uncoupled from the circadian pacemaker and build up the prefeeding behavioral activity. Hypothermia develops in association with RF and modifies the prefeeding as well as nocturnal activity, which depends on the time of RF in a day and the stage of RF. Thermal tolerance to starvation develops during RF. The time structure of behavioral activity under RF is shaped by multiple mechanisms in mice.
Supplemental Material
sj-pdf-1-jbr-10.1177_07487304211047937 – Supplemental material for The Food-entrainable Oscillator Is a Complex of Non-SCN Activity Bout Oscillators Uncoupled From the SCN Circadian Pacemaker
Supplemental material, sj-pdf-1-jbr-10.1177_07487304211047937 for The Food-entrainable Oscillator Is a Complex of Non-SCN Activity Bout Oscillators Uncoupled From the SCN Circadian Pacemaker by Shinya Nishide, Yohko Suzuki, Daisuke Ono, Sato Honma and Ken-ichi Honma in Journal of Biological Rhythms
Footnotes
Acknowledgements
The present study is dedicated to past professor Serge Daan, University of Groningen, The Netherlands, who suggested the present study when he visited us in Sapporo. We thank Dr. Tetsuo Morita (Miyazaki University) for his technical advice on measurement of body temperature. The study was financially supported in parts by Heiwa Nakajima Foundation, Aschoff and Honma Memorial Foundation, and the Ministry of Education, Sport, Science, Technology and Culture (No. 24390055).
Conflict of Interest Statement
The authors have no potential conflicts of interest with respect to the research, authorship, and/or publication of this article.
Notes
References
Supplementary Material
Please find the following supplemental material available below.
For Open Access articles published under a Creative Commons License, all supplemental material carries the same license as the article it is associated with.
For non-Open Access articles published, all supplemental material carries a non-exclusive license, and permission requests for re-use of supplemental material or any part of supplemental material shall be sent directly to the copyright owner as specified in the copyright notice associated with the article.