
Abstract
Although the intracellular molecular clocks that regulate circadian (~24 h) behavioral rhythms are well understood, it remains unclear how molecular clock information is transduced into rhythmic neuronal activity that in turn drives behavioral rhythms. To identify potential clock outputs, the authors generated expression profiles from a homogeneous population of purified pacemaker neurons (LNvs) from wild-type and clock mutant Drosophila. They identified a group of genes with enriched expression in LNvs and a second group of genes rhythmically expressed in LNvs in a clock-dependent manner. Only 10 genes fell into both groups: 4 core clock genes, including period (per) and timeless (tim), and 6 genes previously unstudied in circadian rhythms. The authors focused on one of these 6 genes, Ir, which encodes an inward rectifier K+ channel likely to regulate resting membrane potential, whose expression peaks around dusk. Reducing Ir expression in LNvs increased larval light avoidance and lengthened the period of adult locomotor rhythms, consistent with increased LNv excitability. In contrast, increased Ir expression made many adult flies arrhythmic and dampened PER protein oscillations. The authors propose that rhythmic Ir expression contributes to daily rhythms in LNv neuronal activity, which in turn feed back to regulate molecular clock oscillations.
Keywords
Forward genetic screens in mice and Drosophila have revealed a conserved mechanism for the molecular clocks that operate in key central brain pacemaker neurons to generate circadian (~24 h) rhythms in behavior and physiology. These molecular clocks consist of interlocked transcriptional-translational feedback loops that drive circadian rhythms in gene expression (reviewed by Hardin, 2011). At the cellular level, circadian pacemaker neurons have electrical activity rhythms (Michel et al., 1993; Welsh et al., 1995; Cao and Nitabach, 2008; Sheeba et al., 2008). These are presumably regulated by the molecular clock since the period of the firing rate of mammalian pacemaker neurons in the suprachiasmatic nucleus (SCN) is altered in clock gene mutants (Liu et al., 1997; Herzog et al., 1998).
However, direct links between the molecular clock and neuronal activity have proved elusive despite various channels being implicated in pacemaker neuron activity. For example, SCN firing frequency rhythms are likely regulated by BK/Kcnma1, a Ca2+-activated K+ channel, and by the Kv3.1/Kcnc1 and Kv3.2/Kcnc2 fast-delayed rectifier K+ channels (Itri et al., 2005; Meredith et al., 2006). Mice lacking either BK or both Kv3.1 and Kv3.2 display weakened behavioral rhythms, although no altered periods were seen (Meredith et al., 2006; Kudo et al., 2011). BK RNA levels are rhythmic in the SCN (Panda et al., 2002). Kv3.1 and 3.2 protein levels are also rhythmic (Itri et al., 2005), although the mechanism has not been established. However, the SK channel may be more important than BK in the subgroup of Per+ SCN neurons that show dramatic daily changes in their resting membrane potential (Belle et al., 2009). Indeed, the diversity of clock neurons in the SCN may have obscured the identification of clock-regulated outputs. Therefore, we decided to generate whole-genome expression profiles from a homogeneous group of pacemaker neurons.
We chose to study the ventral lateral neurons (LNVs) from Drosophila. The adult small LNVs (s-LNVs) are the master circadian pacemaker neurons since they set the pace for other clock neurons and for locomotor activity rhythms (Stoleru et al., 2005). We purified LNvs from larval brains for 3 main reasons: (1) The 4 larval LNvs in each brain lobe are differentiated neurons with functional molecular clocks and become the adult s-LNvs. (2) Larval LNvs modulate circadian rhythms in light avoidance, which peaks at dawn (Mazzoni et al., 2005; Collins et al., 2012) just as s-LNvs drive morning activity in adult flies (Grima et al., 2004; Stoleru et al., 2004), suggesting that larval LNvs are functionally similar to adult s-LNvs. (3) The neuropeptide Pigment dispersing factor (PDF) distinguishes LNvs from other clock neurons. However, in adult flies, PDF is also produced in the large LNvs (l-LNvs), which regulate sleep and arousal rather than circadian rhythms (Parisky et al., 2008; Shang et al., 2008; Sheeba et al., 2008; Chung et al., 2009). Thus, we used Pdf-Gal4 to mark larval LNvs and purified a homogeneous population of circadian pacemaker neurons for expression profiling, with the idea that genes expressed in larval LNvs would also likely be expressed in adult s-LNvs.
Materials and Methods
Isolation of Larval Neurons
For GeneChips, third instar larvae were kept in a standard LD (light:dark) cycle and dissections centered around ZT3 or ZT15 (ZT: zeitgeber time in a 12:12 h LD cycle; lights-on at ZT0, lights-off at ZT12). Approximately 200 brains were dissected for each biological replicate, which took ~90 min. Thus, cells were isolated from a narrow time range, rather than precisely at ZT3 or ZT15. For qPCR, larvae were taken from constant darkness (DD) and ~50 brains dissected per replicate. Brains were transferred to Schneider’s Insect Medium (Sigma, St. Louis, MO) in nonstick tubes (Neptune Scientific, San Diego, CA) on ice to minimize gene expression changes. Brains were washed twice with cold phosphate-buffered saline (PBS) and dissociated as in Wegener et al. (2004) by transferring to a 50:50 mix of 1× Collagenase (Sigma):1× Dispase II (Roche, Basel, Switzerland) and incubating for 2 h at 25 °C. After 2 h, the dissociation solution was replaced with Schneider’s medium with 10% fetal bovine serum (FBS). Brains were triturated 100× with a pipette and strained through a 35-µm nylon mesh filter. Trypan blue exclusion indicated that >90% cells were viable after dissociation. Cells in Schneider’s medium/10% FBS were kept on ice for transport to the NYU Medical School FACS center. We used a size filter to remove cell clusters to minimize contamination by cells attached to GFP+ cells. We only selected cells 2 to 3 orders of magnitude more fluorescent than most other cells. Cells were sorted directly into Arcturus PicoPure Total RNA extraction buffer (Invitrogen, Carlsbad, CA). We analyzed RNA from 750 to 1100 LNvs for GeneChips, 1000 or 10,000 GFP+ neurons for Elav GeneChips, and 200 to 300 LNvs for qPCR.
RNA Amplification and Analysis
For GeneChips, mRNA was amplified using the NuGen Ovation RNA Amplification System V2 (NuGEN, San Carlos, CA) and labeled single-stranded DNA hybridized to Affymetrix Drosophila 2.0 GeneChips (Affymetrix, Santa Clara, CA). Hybridization, staining, and washing were as in the manufacturer’s protocol. The entire procedure was performed 3 times each for each genotype (Pdf-Gal4; UAS-CD8::GFP larvae at ZT3 and ZT15 and per0; PDF-RFP and Pdf-RFP; cyc0 larvae at ZT15).
For quantitative real-time PCR (qPCR), we used an amplification strategy (WT-Ovation Pico System; NuGEN) optimized for smaller amounts of input total RNA to generate ~5 µg of single-stranded amplified unlabeled cDNA product. For each qPCR reaction, 20 ng cDNA was amplified in a Roche LightCycler. RNA levels were determined by comparing when the reaction moved into the detectable exponential phase to standard curves for each primer set constructed by reamplifying known quantities of PCR products. We normalized the absolute level of each gene in an experiment to RNA levels of Pdf (a noncycling transcript). The qPCR results are an average of 2 to 3 independent experiments. For each time series plotted, the maximum value was set to 1. Primer sequences are given in the Supplementary Online Material.
GeneChip Data Analysis
Raw hybridization intensities from each CEL Affymetrix file (Drosophila 2.0 GeneChip) were analyzed using MATLAB (MathWorks, Natick, MA) and the accompanying bioinformatic toolbox. For the initial processing step, we used the gcrma algorithm (Irizarry et al., 2003), which incorporates a measure of nonspecific hybridization to compute an adjusted perfect match (aPM) intensity for each probe. The aPMs were then quantile-normalized (Irizarry et al., 2003) across replicates and experiments to yield a single expression measure for each probe set.
We removed low-intensity value probe sets (lowest 20th percentile) prior to testing for differential expression, and a second filter removed probe sets showing minimal variance across all conditions (lowest 20th percentile). Nonspecific filtering when profiling homogeneous tissue reduces noise introduced by the large numbers of nonexpressed and underexpressed genes and thus improves sensitivity for detecting truly differentially expressed genes (Blalock et al., 2003; Calza et al., 2007; Keegan et al., 2007).
Differential expression was determined using statistical analysis of variance (permuted Student t test) adjusted for multiple-hypothesis testing. To estimate the false discovery rate, we followed the procedure introduced by Storey and Tibshirani (2003) to compute q-values and the positive false discovery rate FDR (pFDR). We applied cutoffs for differentially expressed genes of p < 0.01 and FDR <8%. For genes meeting these statistical criteria, we further imposed fold change cutoffs: 8-fold for enrichment and 2-fold for time dependence or clock regulation. Correlations between the 3 replicates for each condition were as follows with numbers indicating highest and lowest correlations: ZT3 (0.92-0.88), ZT15 (0.91-0.88), per0 (0.95-0.92), cyc0 (0.94-0.87), and Elav (0.89-0.87).
Raw GeneChip data have been uploaded to GEO and are accessible at http://www.ncbi.nlm.nih.gov/geo/query/acc.cgi?token=nbwdnouyqyquobg&acc=GSE35752.
Fly Stocks and Immunocytochemistry
The Pdf-RFP transgene has 0.6 kb of Pdf regulatory genomic DNA (0.5 kb upstream the start site of transcription and 0.1 kb downstream) fused to DNA encoding mRFP1, a monomeric soluble red fluorescent protein (Shaner et al., 2004), generously provided by Roger Tsien. DNA was injected into y w flies by the MGH CBRC Transgenic Drosophila Core. We thank Ben Collins and Dave Reeves for these flies. Other fly strains are described in the Supplementary Online Material. The P-element in Ird flies was excised using standard procedures. Immunodetection of whole-mount adult brains was as previously described using a monoclonal mouse antibody to PDF (Cyran et al., 2005), guinea pig anti-VRI (generously provided by Paul Hardin), rabbit anti-GFP (Invitrogen) to detect nYFP, and rabbit anti-PER (generously provided by Jeff Hall). PER levels were measured in 5 s-LNv clusters (each from a different brain) with typically 2 to 4 s-LNvs per cluster.
Behavioral Analysis
To assay larval light avoidance, we followed the method of Mazzoni et al. (2005) in which 15 larvae roam for 15 min on a 1% agar surface in a Petri dish. We used a light box with a fluorescent tube lighting the assay plate from below that is blocked from transmitting to half the Petri dish by nontranslucent dividers placed between the light source and assay plates. Light intensity was reduced to 30 lux by increasing the distance of the plates from the light source using these dividers and adding neutral transmittance filters (Roscolux #397: pale gray). Larvae on both sides were counted after 15 min. Four plates were run in parallel. Each data point is the mean of 12 plates.
For adult circadian assays, adult flies were placed in TriKinetics locomotor assay cuvettes (TriKinetics, Waltham, MA) and entrained to LD cycles for at least 3 days prior to shifting to constant darkness (DD) for at least 7 days. We calculated the period of each locomotor rhythm (τ), by chi-square periodogram analysis as in Price et al. (1998). The power of the rhythm is the height in arbitrary units of the periodogram peak, which quantifies the rhythm strength and is only reported for flies meeting the significance threshold (p < 0.01). Visual inspection of actograms was also used to determine percent rhythmic flies.
Results
GeneChips Identify Transcripts Enriched in Larval LNvs
To purify master pacemaker neurons, we dissected brains at ZT3 or ZT15 from larvae with the LNv-specific driver, Pdf-Gal4 (Park et al., 2000), expressing green fluorescent protein (GFP) (Figure 1A). Larval brains were dissociated into a single-cell suspension and flow cytometry used to select single GFP+ larval LNvs (Figure 1B). mRNA was purified and amplified and the resulting labeled single-stranded DNA hybridized to GeneChips.
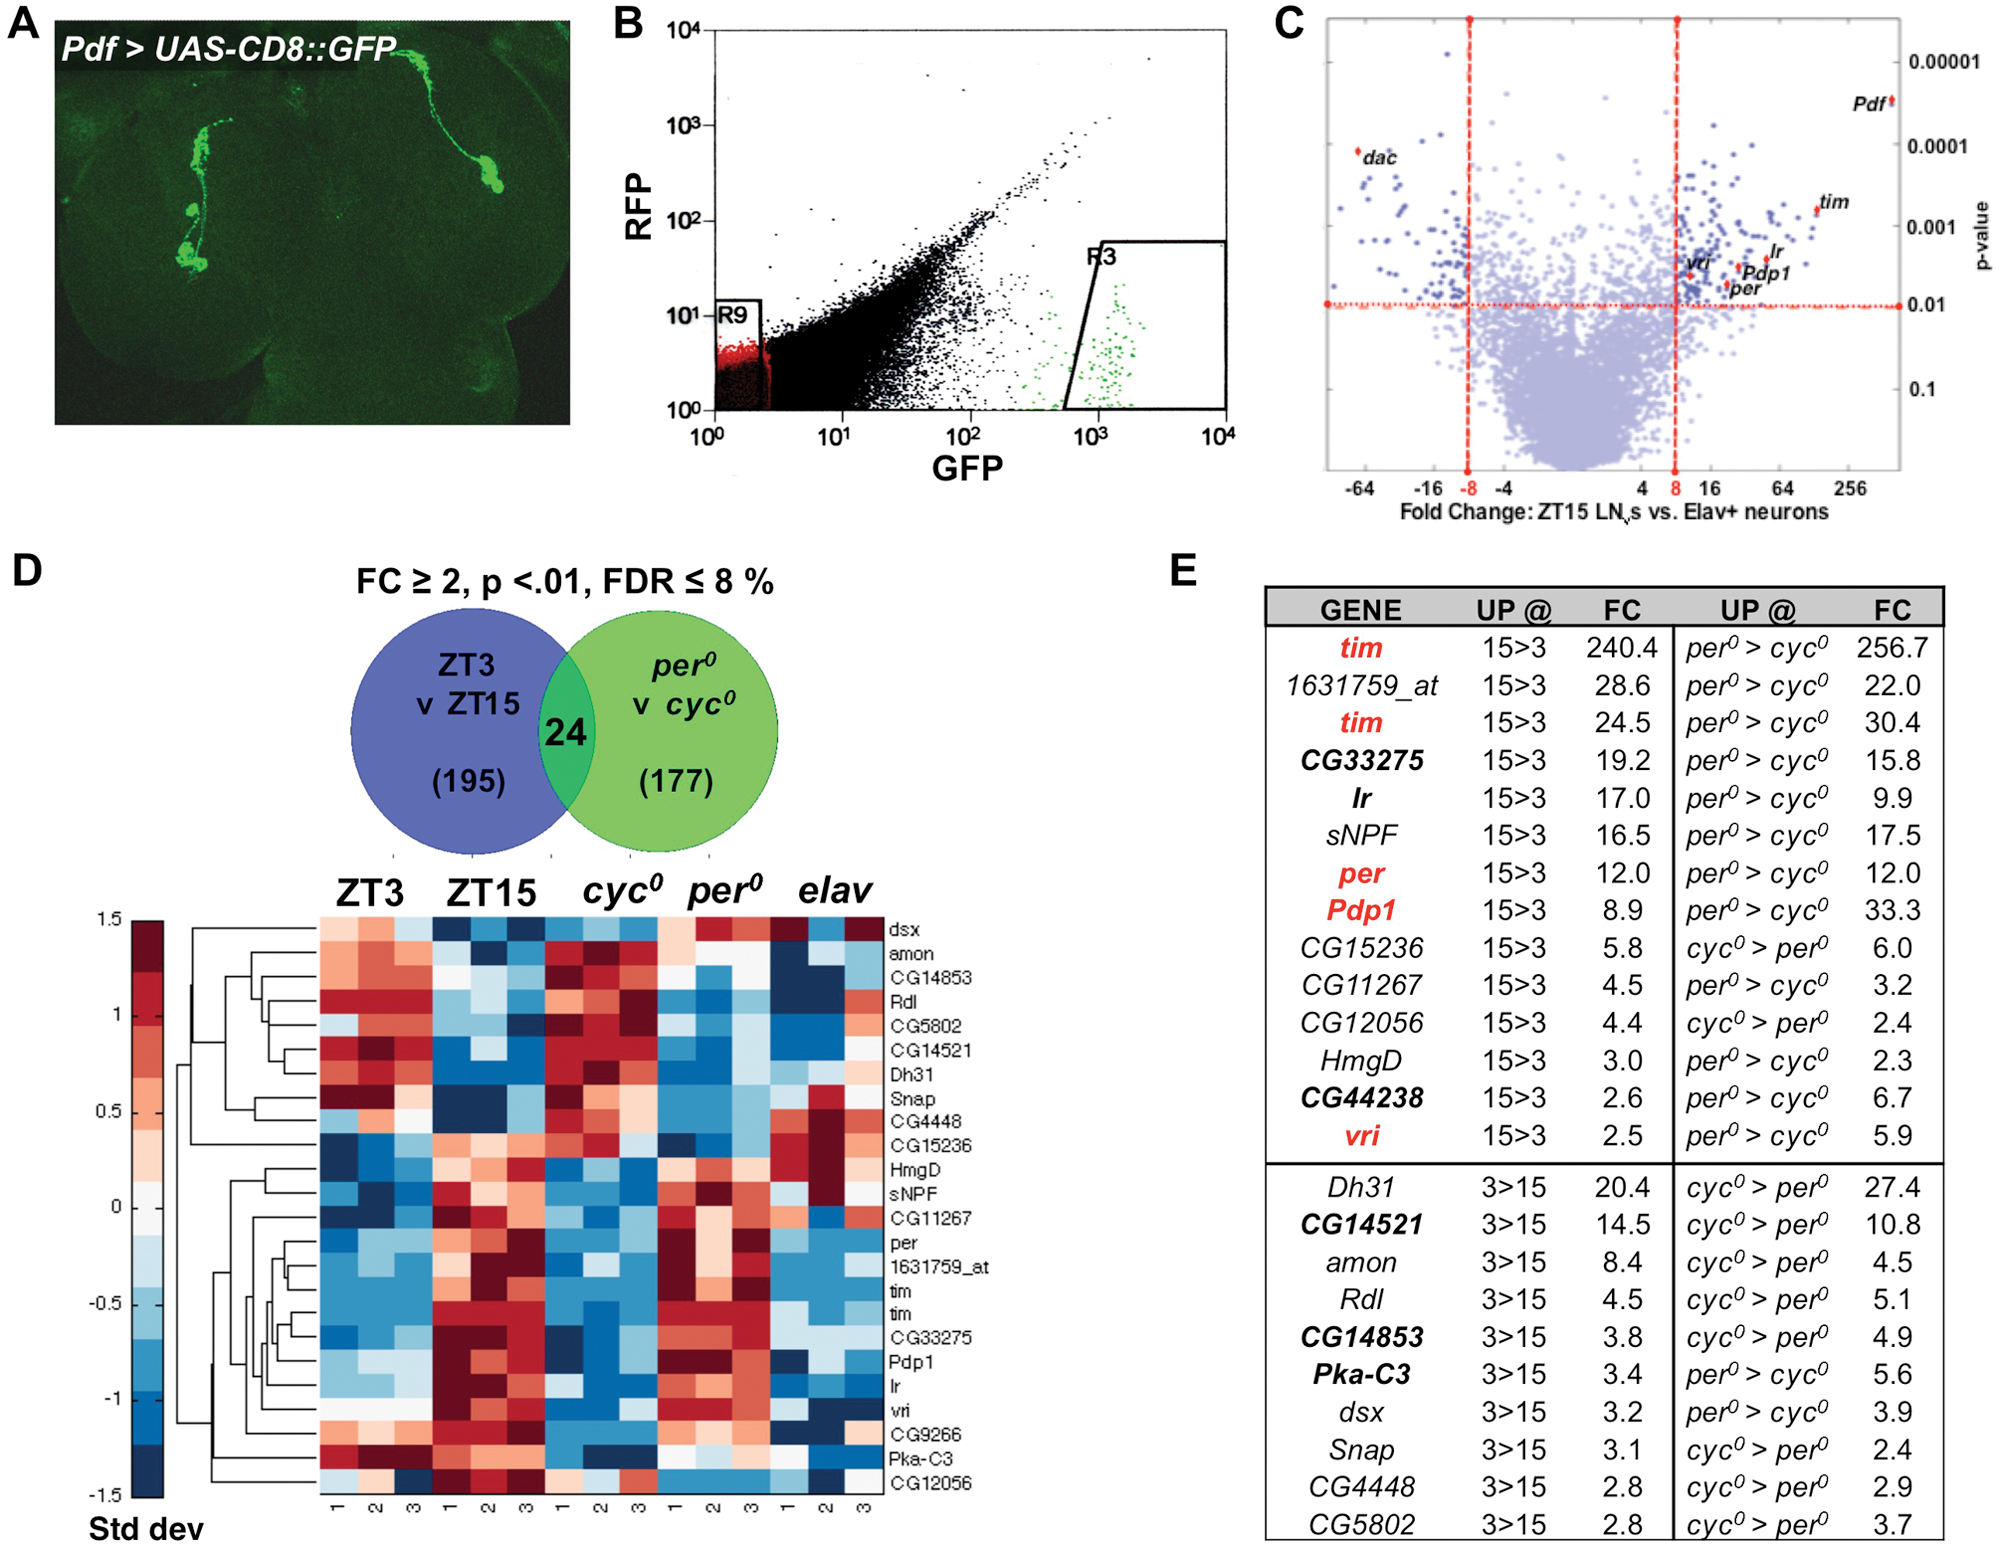
Identification of genes enriched in larval pacemaker neurons that are also time- and clock-dependent. (A) Whole-mount of larval brain lobes with Pdf-Gal4 expressing UAS-CD8:GFP. Green fluorescent protein (GFP) antibodies label 4 ventral lateral neurons (LNvs) in each lobe. (B) Fluorescence-activated cell sorting scatter plot shows the .01% most-GFP+ cells (gate R3). Collected GFP+ cells are ~2 to 3 orders of magnitude more fluorescent than GFP– cells of the same size (gate R9). GFP+ cells group together by size (data not shown). RFP = red fluorescent protein. (C) Gene expression in larval LNvs isolated at ZT15 vs. Elav+ neurons. Each blue circle represents one of the 18,952 GeneChip probes covering the Drosophila genome. x-axis: Fold change in LNvs vs. Elav+ neurons. y-axis: p value (t test). Cutoff lines at 8-fold and p = 0.01 show mRNAs with significantly enriched expression in LNvs compared with Elav+ cells. Core clock genes and Ir are highlighted with red diamonds, as is the de-enriched gene dac (dachsund). (D) Twenty-four mRNAs (23 unique genes) are rhythmically expressed and clock-regulated (clock-driven, p < 0.01, false discovery rate [FDR] <8%, and fold change > 2) when comparing LNvs at ZT3 vs. ZT15 (195 mRNAs) and per0 vs. cyc0 (177 mRNAs). Plots below the pie charts show expression values for these 24 mRNAs (rows) across 5 genomic conditions with 3 replicates for each (columns). Values were standardized by mean centering (row mean = 0, row standard deviation = 1) and assigned color-map values based on their standard deviation from the row mean. Rows were clustered using the Euclidean pairwise distance algorithm. (E) Fold changes for clock-driven mRNAs. The charts show the clock-driven transcripts whose expression is higher at ZT15 than at ZT3 (top) or higher at ZT3 than at ZT15 (bottom). FC = fold change of the mean of 3 replicates each for ZT 3, ZT 15, per0, and cyc0. UP @ columns show whether expression of that transcript was higher at ZT15 or ZT3 (left) or in per0 or cyc0 LNvs (right). Expression of 10 of these 23 clock-driven genes was also enriched in LNvs vs. Elav+ neurons (bold), and 4 of these are core clock genes (red).
Before examining differences in gene expression in larval LNvs between ZT3 and ZT15, we wanted to validate the procedure. We compared LNv gene expression profiles with those from a heterogeneous group of larval brain neurons that produce the postmitotic marker Elav to identify mRNAs whose expression was “enriched” in LNvs compared with Elav+ neurons. Pdf was the most highly enriched transcript in LNvs: 610-fold more abundant at ZT15 in LNvs than in Elav+ neurons (Figure 1 and Suppl. Table S1A). The core clock genes per, tim, vrille (vri), and PAR-domain protein 1 (Pdp1) were all in the top 130 enriched mRNAs at ZT15 (close to their peak expression time) with FDR <8%, p values (t test) < 0.01, and >8-fold enrichment. The inclusion of these genes indicates that the LNv purification and RNA amplification method works well. Applying these cutoffs, we identified 95 and 153 mRNAs enriched in LNvs at ZT3 and ZT15, respectively (Suppl. Table S1), with 57 mRNAs enriched at both time points.
An alternative strategy involving manual picking of Drosophila clock neurons was described by Nagoshi et al. (2010). We found 16 of their 63 LNv-enriched mRNAs in our ZT15-enriched data sets (underlined in Suppl. Table S1). This overlap is considerably more than expected by chance, and there are differences between the 2 studies, including the pooling of larval and adult LNv data (including l-LNvs) by Nagoshi et al. (2010) and the timing of LNv isolation.
GeneChips Identify Transcripts Whose Levels Are Time Dependent in LNvs
Since CLK/CYC-regulated transcripts are low in larval LNvs at ZT3 (early morning) and high at ZT15 (early evening), we compared LNv expression profiles at these times. As expected, expression of the core clock genes per, tim, vri, and Pdp1 was higher at ZT15 than at ZT3 (Figure 1D-E and Suppl. Table S2). We identified 195 mRNAs with ≥2-fold differences in LNvs between ZT3 and ZT15 applying the same cutoffs for p value and FDR as for enrichment (Suppl. Table S2). Eighty-seven percent (161/195) of these mRNAs are not enriched transcripts and are presumably expressed broadly in the larval brain as well as in a time-dependent manner in LNvs. Only 11 of the 195 time-dependent genes we identified in larval LNvs (including per, tim, vri, and Pdp1) are among the rhythmic genes identified by meta-analyses of the multiple whole Drosophila head microarray studies (Wijnen et al., 2006; Keegan et al., 2007), validating the purification of LNvs. Kula-Eversole et al. (2010) came to the same conclusion that most rhythmically expressed genes in adult l-LNvs are not rhythmically expressed when analyzing RNA from whole fly heads.
A Subset of Time-Dependent LNv Genes Is Also Clock Regulated
Rhythmically expressed genes could be driven by LD cycles rather than by the molecular clock (Wijnen et al., 2006). To distinguish light-regulated from clock-regulated genes, we isolated LNvs from per and cyc null mutants since they have opposite molecular clock effects (Hardin, 2011). Therefore, if any of the 195 time-dependent mRNAs are clock regulated, their expression should differ between per0 and cyc0 larval LNvs. Applying the same cutoffs as for ZT3 versus ZT15, we identified 177 clock-regulated mRNAs whose expression differs between per0 and cyc0 LNvs (Suppl. Table S3 and Figure 1D). Twenty-four mRNAs have both time-dependent (ZT3 vs. ZT15) and clock-regulated expression (per0 vs. cyc0), which we term clock driven (Figure 1D,E). As expected, this group includes some known direct CLK/CYC target genes: per, tim, vri, and Pdp1.
Two surprising omissions from the clock-driven list are cry and Clk. cry expression was more highly enriched at ZT3 than at ZT15 but did not meet the statistical cutoffs for time dependency. This may reflect its delayed time to reach peak levels in larval LNvs since, as described below, qPCR from isolated LNvs revealed higher cry RNA levels at CT10 than at CT4 in larval LNvs (CT: circadian time: time in DD after prior LD cycles). Thus, our list of clock-driven LNv transcripts is presumably incomplete for this reason and because other transcripts (such as Clk) are lowly expressed and/or difficult to amplify. The lack of overlap between genes showing time-dependent and clock-dependent expression is also surprising and remains to be fully explained. Interestingly, per, tim, vri, and Pdp1 are the only overlap between the 24 clock-driven genes in larval LNvs and the ~100 genes with circadian expression identified by a meta-analysis of multiple whole head microarray studies (Wijnen et al., 2006).
Circadian Gene Expression Profiles
To validate the GeneChip data, we focused on genes whose expression is clock driven and enriched. These are the 4 core clock genes (per, tim, vri, and Pdp1) and 6 genes previously unstudied in LNvs: Ir, which encodes an inward rectifier K+ channel; CG33275, predicted to encode a Rho-GEF; a Protein Kinase A catalytic subunit gene (Pka-C3), and 3 uncharacterized genes (CG14521, CG42238, and CG14853).
Supplementary Figure S1 shows the expression profiles for 9 of the genes that are both clock driven and enriched as well as for Pdf, a noncycling enriched gene. Rhythmic expression in LD and clock regulation made it likely that all of these genes would also be rhythmically expressed in constant darkness. This has already been demonstrated in larval and/or adult LNvs for tim, vri, Pdp1, and cry RNA (Price et al., 1998; Yang and Sehgal, 2001; Peng et al., 2003; J. Blau, unpublished data). To validate rhythmic LNv expression for the previously unstudied genes and to test for rhythms in DD, LNvs were isolated from wild-type larvae at 4 time points on day 2 in DD. RNA was isolated from fluorescence-activated cell sorting (FACS)–sorted LNvs as for the GeneChip experiments. mRNA was then amplified using a method that includes random priming, and expression levels were measured by qPCR. Thus, the amplification and quantification strategies differ from the GeneChip studies, which used a poly-T–driven amplification.
Figure 2A shows the results of qPCR using primers to amplify cry, Ir, per, and Pdp1 from RNA isolated at 4 different time points in DD. The results show circadian rhythms in gene expression for all 4 genes. We detected peak levels of cry at CT10 and trough levels at CT16, whereas Ir, per, and Pdp1 RNAs have a different phase with peak levels at CT10/CT16 and trough levels at CT4/CT22. The results in Figure 2B also show robust oscillations in DD for all 5 mRNAs: Pka-C3, CG14853, and CG14521 are all at much higher levels at CT10 than at CT22 (like cry); CG33275 oscillates in phase with per, and CG42238 RNA levels are highest at CT22. These qPCR data extend the conclusions from the GeneChip experiments since strong circadian rhythms in gene expression were detected for all 6 novel LNv genes.
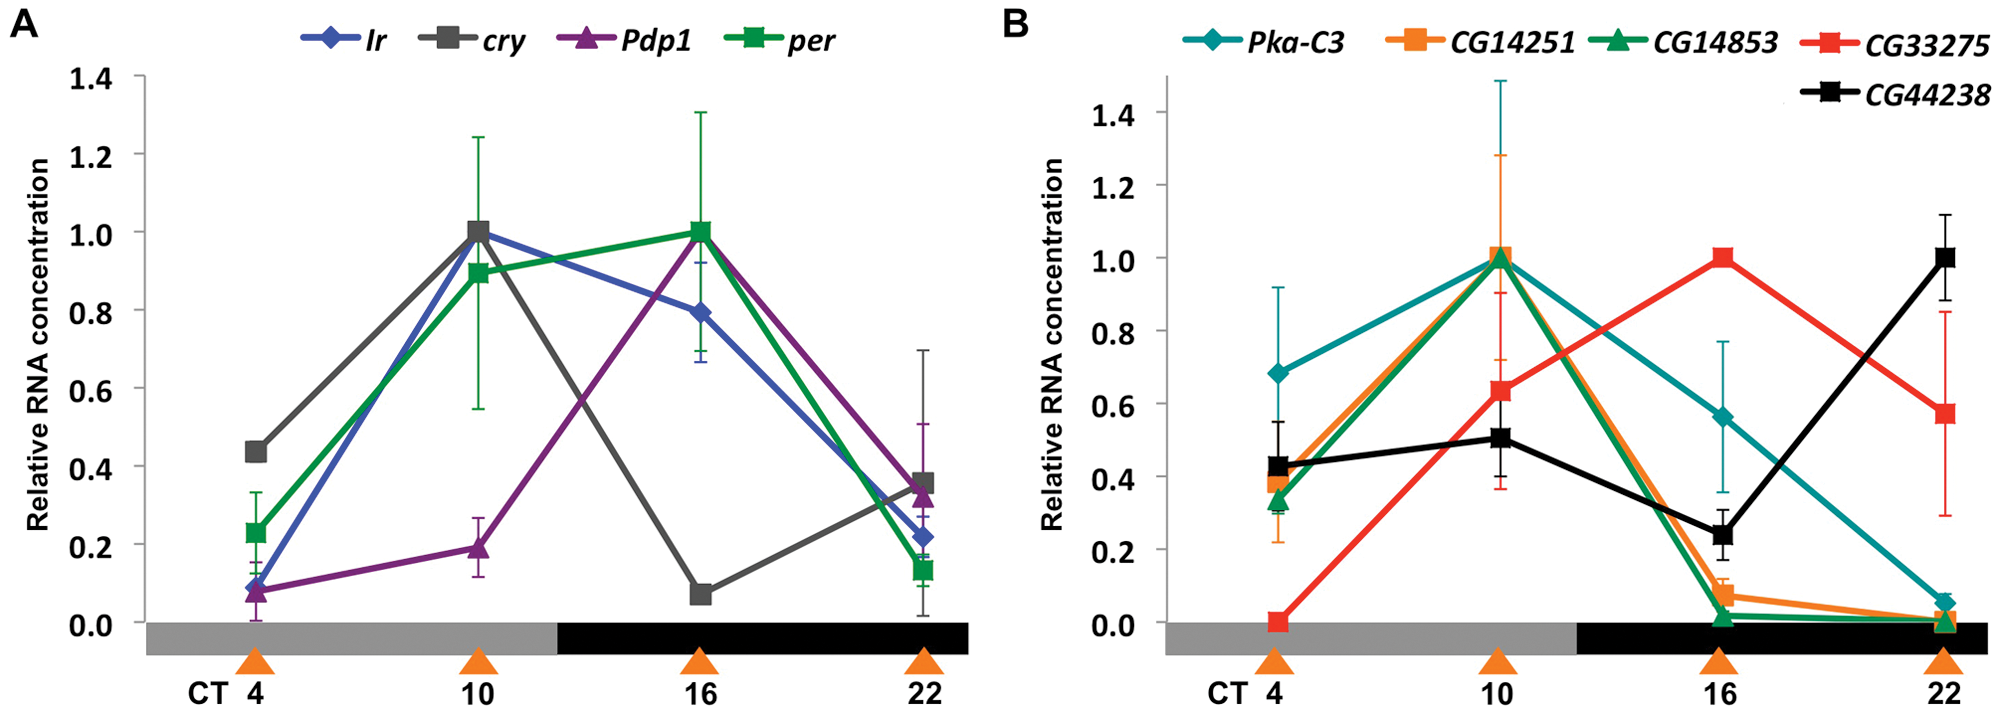
Clock-driven transcript profiles in DD across time, genotype, and cell type. (A) Real-time qPCR on amplified LNv RNA for Ir (blue diamonds), Pdp1 (purple triangles), cry (gray squares), and per (green squares) at 4 time points on day 2 in DD. Each data point is an average of 2 or 3 biological replicates. Error bars show SEM. For mRNAs here and in panel B, we tested for differences in expression across the time series. One-way analysis of variance found differences in expression for all transcripts (p < 0.05) except for per and Pka-C3, which showed differences between peak and trough only by t test (p < 0.005 for per and p < 0.01 for Pka-C3). (B) Real-time qPCR curves as in A for 5 additional enriched clock-driven genes: Pka-C3 (blue diamonds), CG14251 (orange squares), CG14853 (green triangles), CG33275 (red squares), and CG44238 (black squares).
Altered Expression of Ir in LNvs Affects Circadian Behavior
Clock-driven oscillations in Ir expression could be one mechanism by which LNvs generate circadian rhythms in excitability since inward rectifier K+ channels regulate resting membrane potential (Hille, 2001). More inward rectifiers at the cell membrane should increase K+ efflux, hyperpolarizing the cell, while decreased Ir levels should decrease K+ efflux and depolarize the cell. The temporal profile of Ir expression (Figure 2A) is consistent with electrophysiological measurements of adult s-LNvs, which become progressively depolarized toward the end of the night when Ir expression is low and then hyperpolarize again after dawn when Ir RNA levels begins to rise (Cao and Nitabach, 2008).
We first tested a role for Ir in LNv function using larval light avoidance. In this assay, larvae are placed in the middle of a Petri dish half exposed to light and the number of larvae on the dark side is counted 15 min later. Wild-type larvae show a robust preference for the dark side, with ~70% in the dark after 15 min at bright light. LNvs are downstream of the larval visual system, and their neuronal activity rapidly increases with light exposure. This response is elevated when LNvs are made hyperexcitable by expressing NaChBac, a low-threshold voltage-gated sodium channel from bacteria (Yuan et al., 2011). This likely explains how larvae with Pdf-Gal4 expressing NaChBac in LNvs avoid low light levels much better than control larvae (Collins et al., 2012; Figure 3A).
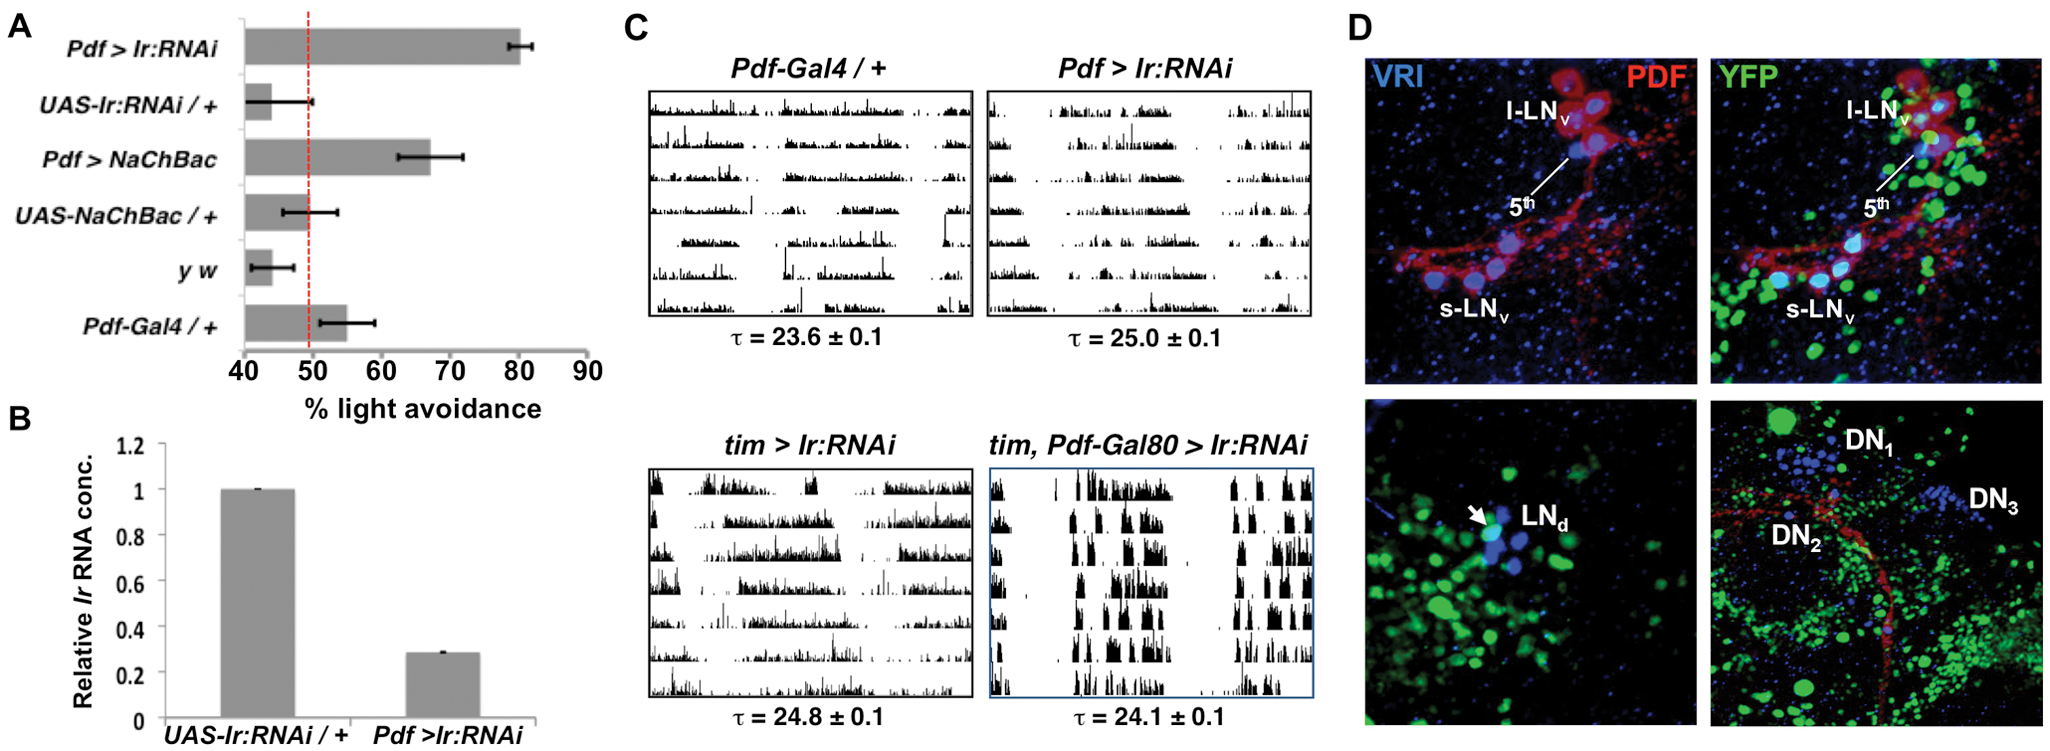
Reduced Ir levels in ventral lateral neurons (LNvs) affect larval and adult behavior. (A) Foraging third instar larvae were tested for light avoidance (30 lux) by measuring the percent of larvae on the dark side of a Petri dish after 15 min. Control y w, UAS-NaChBac / + and UAS-Ir:RNAi / + larvae do not avoid light at this intensity and are not different from each other (p > 0.1 for all comparisons, t test). Red line indicates 50% light avoidance: larvae cannot differentiate between 30 lux light and darkness. Larvae with Pdf-Gal4 and either UAS-NaChBac2 (Pdf > NaChBac) or UAS-Ir:RNAi (Pdf > Ir:RNAi) avoid light significantly better than control strains (p < 0.01). These experiments were performed from ZT14 to ZT16. Error bars show SEM. (B) Real-time qPCR on amplified LNv RNA from either control larvae (UAS-Ir:RNAi / +) or with Pdf-Gal4 expressing UAS-Ir:RNAi (Pdf > Ir:RNAi) at ZT15. RNA levels were normalized to noncycling levels of Pdf, with the maximum value set to 1.0. Ir RNA levels are lower in Pdf > Ir:RNAi than in control LNvs (p < 0.0005, t test). Data are an average of 2 independent experiments. Error bars show SEM. (C) Actograms showing adult locomotor activity in DD. Top panels: Pdf-Gal4 / + controls have a shorter period than flies with Pdf-Gal4 expressing UAS-Ir:RNAi (Pdf > Ir:RNAi, p < 0.01). Pdf > Ir:RNAi flies also have longer periods than flies with Pdf-Gal4 expressing a control RNAi (p < 0.01, Suppl. Table S4). Bottom panels: Flies with tim(UAS)-Gal4 expressing UAS-Ir:RNAi in all clock neurons (tim > Ir:RNAi) have longer periods than tim(UAS)-Gal4, Pdf-Gal80 expressing UAS-Ir:RNAi in all clock neurons except LNvs (tim, Pdf-Gal80 > Ir:RNAi, p < 0.01) or control tim(UAS)-Gal4/ + or UAS-Ir:RNAi / + flies (p < 0.01, Suppl. Table S4). Period and SEM are reported for flies with significant activity rhythms. (D) Adult brains with UAS-nuclear-YFP reporting expression from Ir-Gal4 were dissected at ZT15 and stained using antibodies to Green fluorescent protein (GFP) to detect Yellow fluorescent protein (YFP) (green), Pigment dispersing factor (PDF) (red), and VRI (blue). Top panels show LNvs. Nuclear YFP was detected in all 4 PDF+ small LNVs (s-LNvs) in all 10 brains examined, in 2 to 3 of the 5 large LNvs (l-LNvs) but not in the fifth PDF– s-LNv. YFP was detected in 1 of 6 dorsal lateral neurons (LNds, lower left panel) but not in dorsal clock neurons (DN1, DN2, or DN3, lower right panel).
We tested the effect of knocking-down Ir expression specifically in LNvs using Pdf-Gal4 to express a UAS transgene that expresses RNAi directed to Ir (UAS-Ir:RNAi) at ZT15, when Ir expression is high. The results in Figure 3A show that knocking down Ir in LNvs made larvae super-sensitive to low light (30 lux) compared with control UAS-Ir:RNAi or Pdf-Gal4 larvae. The similar light-avoidance phenotypes of larvae in which LNvs either express NaChBac or Ir:RNAi are consistent with the idea that Ir levels in LNvs are inversely related to LNv excitability.
To quantify the efficacy of Ir:RNAi, LNvs were isolated by FACS from either control larvae (UAS-Ir:RNAi alone) or with Pdf-Gal4 expressing UAS-Ir:RNAi at ZT15. mRNA was amplified and gene expression measured by qPCR. The results in Figure 3B show a 3.8-fold decrease in Ir transcript abundance in larval LNvs expressing Pdf-Gal4 and UAS-Ir:RNAi, verifying that the UAS-Ir:RNAi transgene reduces Ir RNA levels in LNvs.
Altered Ir Expression in Adult LNvs Changes Circadian Locomotor Activity
One reason for profiling larval LNvs was to identify key genes expressed in adult s-LNvs without co-purifying l-LNvs. To test a role for Ir in adult LNvs, we measured the locomotor activity rhythms of flies with Pdf-Gal4 expressing UAS-Ir:RNAi. These flies had strong 25.0-h-long period locomotor rhythms in DD compared with control flies with periods between 23.6 and 24.5 h (Figure 3C, Suppl. Table S4). Long-period behavioral rhythms are also seen when LNvs are hyperexcited via UAS-NaChBac, which leads to a 25.5-h behavioral period and complex behavioral rhythms (Nitabach et al., 2006), or via UAS-dnATPase, a dominant-negative Na+/K+-ATPase α subunit (Sun et al., 2001; Suppl. Table S4). The similar period phenotypes of flies with Pdf-Gal4 expressing UAS-Ir:RNAi, UAS-NaChBac, or UAS-dnATPase are consistent with decreased Ir expression increasing LNv excitability and further support the idea that Ir levels regulate LNv excitability.
A similar long period rhythm was observed when Ir-RNAi was expressed in all adult clock neuron groups using the tim(UAS)-Gal4 driver (Figure 3C, Suppl. Table S4). This was surprising because tim(UAS)-Gal4 usually gives stronger phenotypes than Pdf-Gal4. Indeed, hyperexciting all clock neurons with tim(UAS)-Gal4 and UAS-NaChBac makes flies arrhythmic (Collins et al., 2012). This suggested that Ir might not play a role in other clock neurons. To test this, UAS-Ir:RNAi was expressed in all clock neurons except LNvs, using the tim(UAS)-Gal4 driver and a Pdf-Gal80 transgene to inhibit Gal4 activity in LNvs (Stoleru et al., 2004). The results in Figure 3C and Supplemental Table S4 show that flies in which Ir:RNAi was restricted to non-LNv clock neurons have normal circadian rhythms. This also contrasts with expressing NaChBac in non-LNv clock neurons, which dramatically constricts the time when flies are active (Collins et al., 2012). Thus, Ir does not seem to regulate non-LNv clock neurons and is perhaps not expressed in non-LNvs.
To test where Ir is expressed, we used a Gal4 enhancer trap inserted in Ir (NP2554, hereafter referred to as IrGal4). Ir-Gal4 flies were crossed to a UAS-nuclear-YFP transgene (Kimura, 2005). Brains were dissected at ZT15 and stained for YFP, PDF to mark LNvs and VRI to mark all clock neurons. Nuclear YFP was detected in all 4 adult PDF+ s-LNvs and 2 to 3 of the 5 l-LNvs but not in the fifth PDF– s-LNv (Figure 3D). We detected YFP in 1 of the 6 LNds (dorsal lateral neurons) but in none of the three dorsal neuron (DN) groups. The relatively broad expression of Ir-Gal4 in the brain is consistent with Ir being one of only 3 inward rectifier channels in the Drosophila genome and underlines the importance of purifying LNvs prior to expression profiling to detect rhythmic Ir expression. Although this IrGal4 enhancer trap line might not precisely reflect Ir expression, the pattern is consistent with our genetic data indicating that s-LNvs are the locus where Ir acts in circadian rhythms. This is consistent with Nagoshi et al. (2010), who detected high-level Ir expression in larval and adult LNvs but not in other clock neurons. In addition, Kula-Eversole et al. (2010) found that Ir is rhythmically expressed in adult LNvs.
Increased Ir Expression Disrupts Behavioral Rhythms and the LNv Molecular Clock
As an additional test of the role of Ir in circadian rhythms, we assayed a novel Ir P-element insertion line (Ird08240, referred to hereafter as Ird); 47% of Ird flies were arrhythmic, and this phenotype was reverted by P-element excision (Ird rev, Figure 4A). To understand how Ird affected Ir expression, we measured Ir levels in RNA extracted from whole fly heads. Figure 4B shows a 1.6- to 1.8-fold increase in Ir RNA in Ird flies compared with control flies. Ird rev flies had the same Ir expression levels as control flies, indicating that Ir overexpression likely underlies the behavioral defects. However, we have not determined how strongly Ir is overexpressed in Ird LNvs.
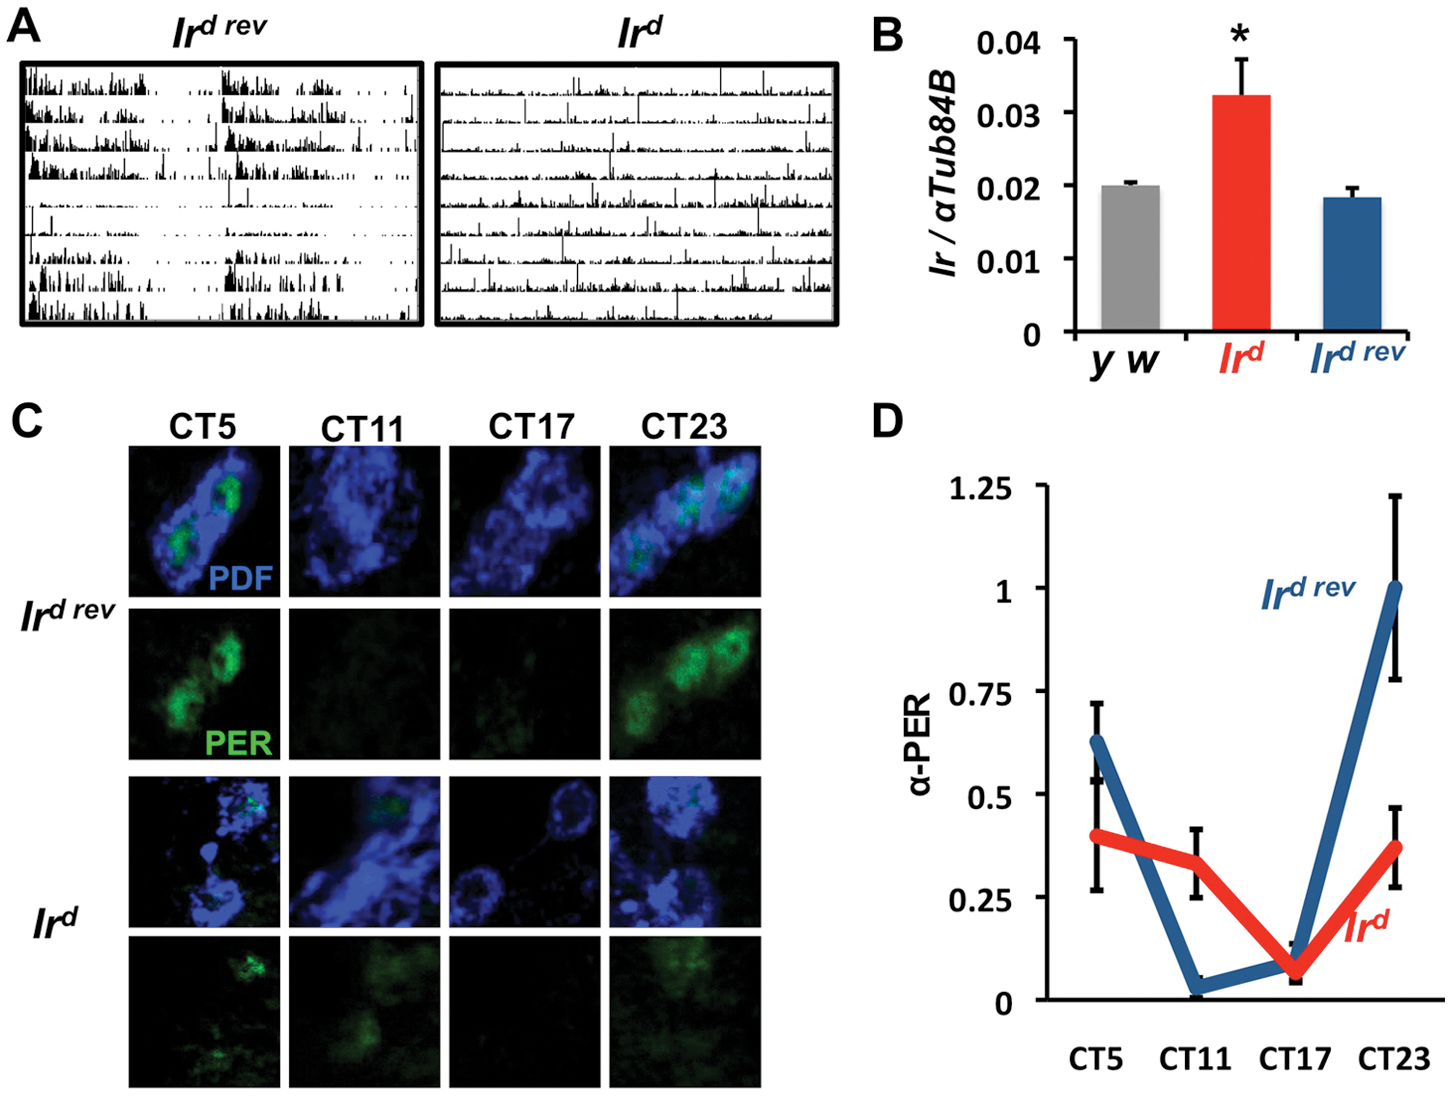
Increasing Ir expression disrupts adult circadian behavioral and molecular rhythms. (A) A P-element inserted in Ir (Ird) makes ~50% of flies lose behavioral rhythms. This phenotype is rescued by excising the P-element (Ird rev). (B) Ir RNA levels in RNA isolated from whole fly heads are higher in Ird flies than in y w or Ird rev control flies (*p < 0.05, t test). The data are an average of 4 biological replicates isolated at ZT11. Error bars show SEM. (C) Representative images of PER protein levels in adult small LNVs (s-LNvs) of Ird rev control flies (top panels) and Ird flies (bottom panels) at 4 time points on day 5 in DD. (D) Quantitation of data from C normalized to peak PER levels at CT23 in Ird rev controls. Error bars show SEM. PER levels are lower at CT23 in Ird (red) than in Ird rev s-LNvs (blue, p < 0.05, t test).
As Ird does not target LNvs specifically, we measured molecular clock oscillations in LNvs to test how they are affected by increased Ir expression. Overexpressing Ir in LNvs should hyperpolarize these cells, and the behavioral phenotype of Ird mutants is similar to LNvs expressing the dORKΔ K+ channel, which causes LNv molecular clocks to run down with the constitutively expressed Pdf-Gal4 driver (Nitabach et al., 2002, 2005). A mammalian inward rectifier K+ channel (mKir2.1) expressed in LNvs also hyperpolarized LNvs and caused their molecular clocks to run down (Nitabach et al., 2002, 2005; Wu et al., 2008), leading to the idea that the LNv molecular clock requires LNv membrane activity for robust rhythms in DD. However, this idea has been challenged by Depetris-Chauvin et al. (2011), who found that expressing mKir2.1 only in adulthood via an inducible Pdf-Gal4 made flies arrhythmic but did not dramatically affect their molecular clocks. However, it has not yet been tested how strongly constitutive and inducible mKir2.1 expression affect s-LNv resting membrane potential. The long periods seen with Ir:RNAi (Figure 3C) suggest that Ir, as an endogenous ion channel, affects molecular clock oscillations. To test how Ir overexpression affects the LNv molecular clock, we measured PER protein rhythms in the s-LNvs of Ird and Ird rev adult flies on day 5 in DD. The results in Figure 4C,D show that peak PER protein levels at CT23 are reduced in Ird flies (t test, p < 0.05). Taking these data together with the modest period lengthening in Ir:RNAi flies leads us to propose that Ir is not just a clock output but, by affecting LNv excitability, feeds back to regulate the molecular clock.
Discussion
Expression Profiling of Drosophila Pacemaker Neurons
There have been relatively few insights into how circadian molecular clocks control pacemaker neuronal activity rhythms. Because circadian rhythms in mRNA levels are widespread across organisms (e.g. Harmer et al., 2000; Storch et al., 2002), rhythmic expression of output genes that underlie rhythmic neuronal activity is an attractive idea. Our approach to identifying clock-regulated output genes differed from most previous circadian expression profiling studies by starting with a homogeneous population of behaviorally relevant pacemaker neurons. Single-cell type expression profiling is clearly a powerful approach because the vast majority of rhythmically expressed transcripts identified in larval LNvs (this study) or adult l-LNvs (Kula-Eversole et al., 2010) differ from those with rhythmic expression in whole fly heads.
Ir Contributes to the Regulation of LNv Excitability
We focused on Ir because of the well-described roles of inward rectifier K+ channels in resting membrane potential and neuronal activity (Hille, 2001). As Ir transcript levels are high at CT10 and CT16 (around dusk) and low at CT22 and CT4 (around dawn), LNvs should be less excitable at dusk than at dawn. This inference correlates with electrophysiological measurements of adult s-LNv resting membrane potential, which becomes progressively depolarized toward the end of the night (Cao and Nitabach, 2008). Low Ir expression in cyc0 mutants and high expression in per0 mutants are consistent with data indicating that larval LNv excitability is high when CLK/CYC activity is low (Collins et al., 2012). Ultimately, these ideas will require measuring when Ir protein is present and functional. The ~365aa cytoplasmic Ir C-terminus has 63 serines and threonines, suggesting that phosphorylation also regulates Ir activity. Low Ir RNA levels in LNvs at dawn, and thus high LNv excitability, are consistent with LNvs promoting (1) larval light avoidance, which peaks around dawn (Mazzoni et al., 2005), and (2) the morning peak of adult locomotor activity in LD cycles (Grima et al., 2004; Stoleru et al., 2004). The presence of multiple E boxes (potential CLK/CYC binding sites) in the Ir regulatory region (M. Ruben and J. Blau, data not shown), its phase of expression, and the effect of the per0 and cyc0 mutations on Ir RNA levels support the idea that Ir is a direct CLK/CYC target, although this also remains to be tested.
Although Ir is rhythmically expressed in LNvs, we propose that other clock neurons have different mechanism(s) to link their molecular clocks to neuronal activity. Larval LNvs and DN1s have opposite relationships between CLK/CYC activity and excitability: LNvs are most excitable when CLK/CYC activity is low and DN1s are most excitable when CLK/CYC activity is high (Collins et al., 2012). Cell type–specific clock outputs have already been observed in mammals, where similarly phased molecular clocks lead to rhythmic expression of outputs that differ extensively between tissues (e.g., Storch et al., 2002). Similarly, we propose that CLK/CYC regulate distinct sets of output genes in different clock neurons.
A Holistic Model for Regulating LNv Output
While Ir affects circadian behavior, the rhythmic physiology of LNvs probably derives from multiple redundant mechanisms, perhaps explaining why forward genetics has revealed little about clock outputs. Our LNv GeneChips identify additional clock-driven genes with potential roles in clock output, including amontillado, an enzyme that cleaves inactive neuropeptide precursors; Snap (Soluble NSF attachment protein), which helps recycle synaptic vesicles from the plasma membrane; and Rdl, a GABA-activated chloride channel.
It will be interesting to determine how similar the mechanisms for regulating circadian rhythms in excitability are between Drosophila and mammals. For the SCN, rhythms in excitability can be subdivided into rhythms in resting membrane potential and action potential frequency (Kuhlman and McMahon, 2006). No channels have yet been identified that regulate SCN membrane potential, but firing frequency is likely regulated by BK, Kv3.1, and Kv3.2 K+ channels (Itri et al., 2005; Meredith et al., 2006; Kudo et al., 2011). Although mice lacking either BK or both Kv3.1 and Kv3.2 display weakened behavioral rhythms, no altered periods were seen (Meredith et al., 2006; Kudo et al., 2011). However, manipulating the channel(s) that determine resting membrane potential in SCN neurons may change period length because artificially hyperpolarizing SCN slices in vitro with low K+ either altered period or lead to loss of mPer1-luciferase rhythms (Lundkvist et al., 2005), suggesting a link between membrane potential and the molecular clock in the SCN. At least for Drosophila, the period-altering phenotypes with Ir knockdown and LNv hyperexcitation via NaChBac blur the conventional distinction between clock outputs and inputs.
Footnotes
Acknowledgements
We gratefully acknowledge Jason Rihel for suggesting this approach to clock neuron function, Paul D’Agostino and Esteban Mazzoni for encouraging us to use FACS, Chris Wegener for the cell dissociation protocol, Ben Collins and Dave Reeves for creating Pdf-RFP flies, and Alex Keene for the larval light box. Special thanks to Ben Collins and David Dahdal for early morning dissections and to John Hirst, Peter Lopez, and Gelo Victoriano de la Cruz for FACS. We also thank Ken Birnbaum, Mark Siegal, and John Hogenesch for advice on FACS and GeneChip analysis and Ryan Baugh for advice on RNA amplification. We thank Jeff Hall, Paul Hardin, Mike Nitabach, Michael Rosbash, Paul Salvaterra, Simon Sprecher, Roger Tsien, the DSHB, the DGRC (Japan), the NIG (Japan), and the VDRC for flies, antibodies, and DNA. We thank Emi Nagoshi and Michael Rosbash for sharing data prior to publication, Frank Doring and Claude Desplan for many invaluable discussions on this project, and Matthieu Cavey, Ben Collins, and David Dahdal for comments on the manuscript. This investigation was conducted in a facility constructed with support from Research Facilities Improvement grant C06 RR-15518-01 from the National Center for Research Resources (NCRR), National Institutes of Health (NIH) and in the NYU Center for Genomics & Systems Biology Core Facility. The NYUCI flow cytometry core is supported by NIH National Cancer Institute (NCI) grant P30CA16087-31. This work was supported by an NYU Dean’s Dissertation fellowship (D.M.) and NIH grants NRSA F32 GM72197 (M.D.D.) and GM063911 (J.B.).
Conflict of Interest Statement
The author(s) have no potential conflicts of interest with respect to the research, authorship, and/or publication of this article.
Notes
References
Supplementary Material
Please find the following supplemental material available below.
For Open Access articles published under a Creative Commons License, all supplemental material carries the same license as the article it is associated with.
For non-Open Access articles published, all supplemental material carries a non-exclusive license, and permission requests for re-use of supplemental material or any part of supplemental material shall be sent directly to the copyright owner as specified in the copyright notice associated with the article.