
Abstract
The circadian clock controls daily activities at the cellular and organismic level, allowing an organism to anticipate incoming stresses and to use resources accordingly. The circadian clock has therefore been considered a fitness trait in multiple organisms. However, the mechanism of how circadian clock variation influences organismal reproductive fitness is still not well understood. Here we describe habitat-specific clock variation (HSCV) of asexual reproduction in Neurospora discreta, a species that is adapted to 2 different habitats, under or above tree bark. African (AF) N. discreta strains, whose habitat is above the tree bark in light-dark (LD) conditions, display a higher rhythmicity index compared with North American (NA) strains, whose habitat is under the tree bark in constant dark (DD). Although AF-type strains demonstrated an overall fitness advantage under LD and DD conditions, NA-type strains exhibit a habitat-specific fitness advantage in DD over the LD condition. In addition, we show that allelic variation of the clock-controlled gene, Ubiquinol cytochrome c oxidoreductase (NEUDI_158280), plays a role in HSCV by modulating cellular reactive oxygen species levels. Our results demonstrate a mechanism by which local adaptation involving circadian clock regulation influences reproductive fitness.
Most organisms have cellular clocks that allow them to predict and prepare for incoming environmental challenges to maintain their survival with certain regularities; for example, daily, seasonal, and yearly cycles. The most fundamental and well-characterized biological rhythm is a set of 24-h cellular rhythms, collectively called the circadian rhythm. The importance of circadian rhythms to fitness and survival in nature has been tested in a variety of organisms (Ouyang et al., 1998; Beaver et al., 2002; Green et al., 2002; Michael et al., 2003; Dodd et al., 2005; O’Donnell et al., 2011). However, the underlying mechanisms that link the circadian clock and organismal fitness are not well understood. Several studies with the filamentous fungi Neurospora crassa have shown that asexual reproduction is circadian regulated and coupled with primary elements of several core circadian oscillators, including positive elements, White Collar-1 (WC-1) and White Collar-2 (WC-2), and negative elements, Frequency (FRQ), FRQ-Interacting RNA Helicase (FRH), and Casein Kinase 1 (CK-1; Hurley et al., 2015; Dunlap and Loros, 2017; Loros, 2019). Furthermore, Neurospora has a large evolutionary time scale compared with other clock models. Therefore, we considered Neurospora to be a potential model for understanding the mechanisms associating the circadian clock and reproductive fitness.
Although N. crassa is a classic model organism for circadian clock studies, we have chosen Neurospora discreta Phylogenic Species 4b (PS4b) for the current study for 2 important reasons. N. discreta PS4b strains are found living in diverse geographical locations (from Alaska to the equator), whereas N. crassa strains have been identified only in temperate regions (Jacobson et al., 2004; Dettman et al., 2006; Jacobson et al., 2006). In addition, N. discreta PS4b live in 2 distinctive local habitats. North American (NA) strains of N. discreta PS4b have been found only living underneath the bark of burnt trees. Whereas PS4b strains from other continents (OC) have been found living on top of the bark of burnt trees (Jacobson et al., 2006).
In the current study, we have explored the mechanism that underlies habitat-specific clock variation (HSCV) and resulting fitness consequences in N. discreta PS4b collected from all over the world. We observed low-amplitude circadian rhythm of asexual reproduction with N. discreta PS4b NA strains compared with OC strains. We further investigated the mechanisms of HSCV using a representative sample of N. discreta PS4b strains from North America and Africa. Taken together, our results demonstrate that allelic variation in the clock-controlled gene, Ubiquinol cytochrome c oxidoreductase (NEUDI_158280), is shaped by local habitat and plays an important role in HSCV and resulting fitness variation by modulating cellular reactive oxygen species (ROS) levels.
Methods
Estimating Rhythmicity of the Overt Rhythm
The rhythmicity index (RI) was measured from images of race tubes using the Chrono software developed by Till Roenneberg at the Institute of Medical Psychology, Ludwig-Maximilians-University of Munich, and widely used in the chronobiology research community (Rémi et al., 2010). RI scores were obtained using the CompCurve Analysis tool in ChronOSX3 after converting images to densitometry readings with ChronoOSX2. RI was calculated by multiplying amplitude and regression coefficient, r (Blautzik et al., 2013).
Phylogenetic Tree
We generated whole-genome single nucleotide polymorphism (SNP) data from 53 strains of N. discreta PS4b and 2 N. discreta sensu stricto strains using the genotyping-by-sequencing method (De Donato et al., 2013). We used a threshold of no more than 20% missing data for inclusion of each strain, and this filter excluded 1 sample, FGSC 8579 (Nd49). In addition, we retained only SNPs with no missing data for phylogenetic analysis, a total of 16,172 SNPs. Using the dist function in R (http://www.R-project.org/), we constructed a pairwise distance matrix of Euclidean distances among strains. We used the NJ function of the ape package in “R” to construct a tree and rooted the tree using the N. discreta ss strain (Nd1) as an outgroup (Paradis et al., 2004). For the unrooted tree, we used the TASSEL 5 (Bradbury et al., 2007) neighbor joining method.
DNA Extraction
Petri dishes (100 mm × 15 mm) containing 20 mL of high-glucose liquid medium (2% glucose, 0.5% L-Arginine, 1X Vogel’s Salt, pH 5.8) were inoculated with conidia and incubated for 36 to 48 h at 25 °C. Mycelia tissues were washed with water, vacuum filtered, frozen in liquid nitrogen, and stored at −80 °C. Tissue disruption was achieved using the TissueLyser bead-beater system (QIAGEN, Hilden, Germany), and genomic DNA was extracted using DNeasy Plant Mini Kits (QIAGEN).
Western Blot Analysis
We used the following culture conditions for Western blot analysis: liquid cultures (100 rpm) were shaken in high-glucose liquid medium (1X Vogel’s Salt, 0.5% arginine, and 2% glucose) in constant darkness (DD) at 25 °C for 64 h for the experiment in Figure 1. Prior to moving samples to another chamber with an average light intensity of 3378.0 lux (SD ±89.4), the DD samples were harvested and frozen in liquid nitrogen. After an 8-h exposure to light, the light induction samples were also frozen in liquid nitrogen and stored at −80 °C. Using a mortar and pestle, mycelial tissue was pulverized to a fine powder in liquid nitrogen and suspended in a nonreducing/denaturing extraction buffer (50 mM HEPES pH 7.4, 137 mM NaCl, 10% glycerol, pepstatin A 1 µg/mL, leupeptin 1 µg/mL, and phenylmethylsulfonyl fluoride 1 mM). Protein concentrations for each sample were determined in triplicate using the Bradford assay (Bradford, 1976). Prior to sodium dodecyl sulfate– polyacrylamide gel electrophoresis, the samples were heated to 95 °C in a protein loading buffer (50 mM Tris pH 6.8, 0.1 M DTT, 2% sodium dodecyl sulfate, 0.1% bromophenol blue, and 10% glycerol), and 50 µg of total protein was loaded into each lane. Samples were electrophoresed at 150 V for 65 min on a 7.5% polyacrylamide gel and transferred to a polyvinylidene difluoride membrane with the Trans-Blot Turbo Transfer System (Bio-Rad, Hercules, CA) under the following conditions: 2.5 amp, 25 V, for 13 min. For immunodetection, FRQ antiserum was used at a 1:40 dilution in a 5% milk phosphate-buffered solution containing 0.3% Tween 20 (PBS-T) and incubated for 1 h. A stabilized goat anti-rabbit immunoglobulin G (H+L) peroxidase-conjugated secondary antibody (Thermo Fischer Cat. No. 32460) was used at a 1:250 dilution in a 5% milk PBS-T solution and incubated with the blot for 1 h. Chemifluorescence detection was performed with a Storm Phoshporimager (Amersham, Little Chalfont, UK) as directed in the ECL Plus Western Blot Detection Reagent handbook.
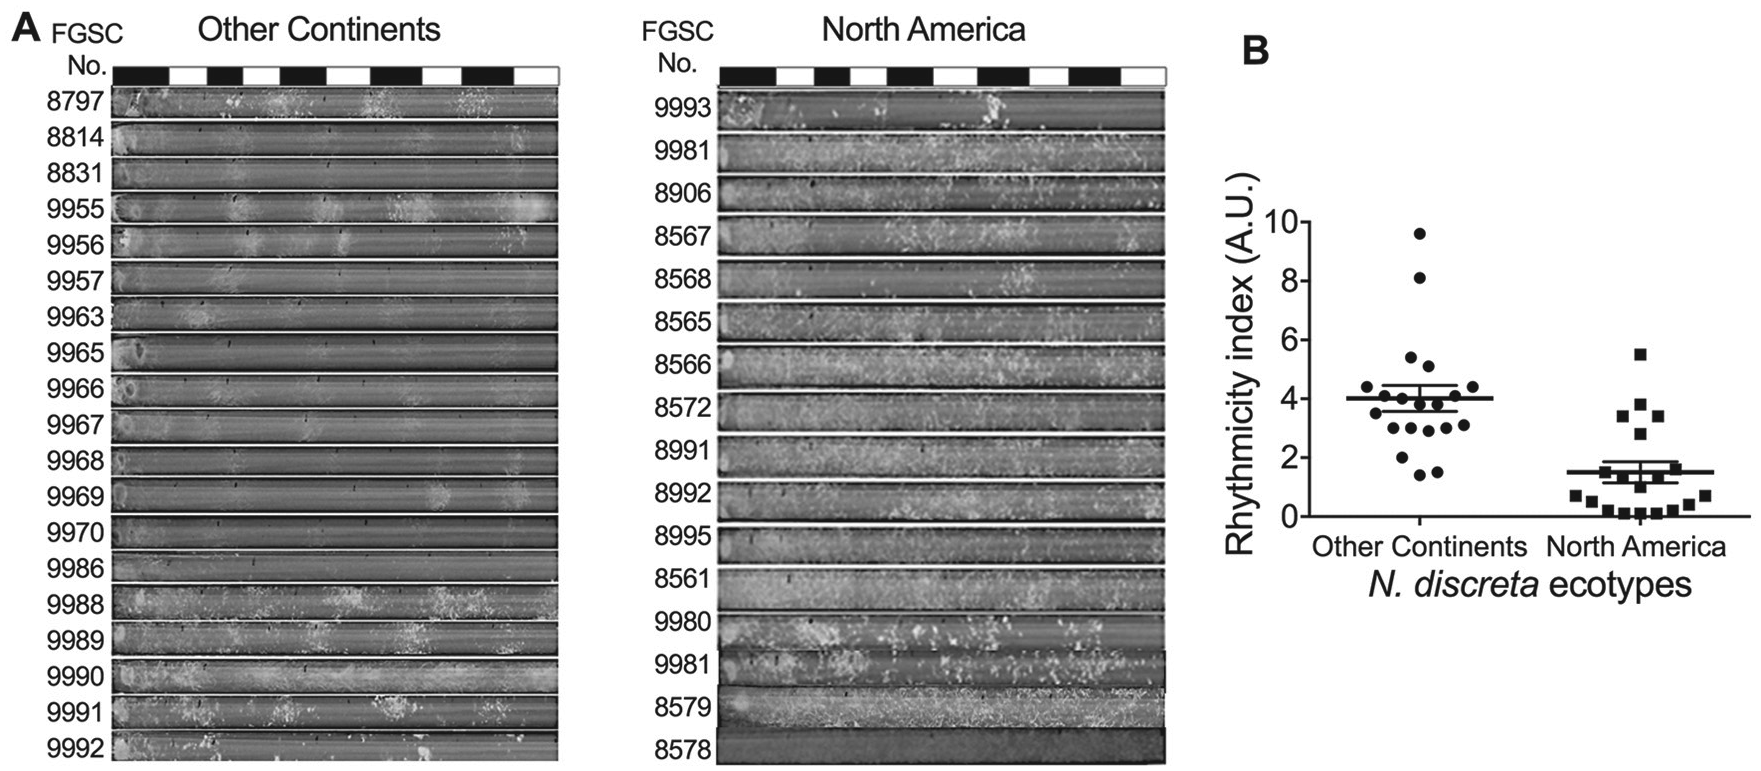
Habitat-specific clock variation in N. discreta PS4b. (A) Inverted race tube analysis of N. discreta ecotypes under 12-h light/dark (LD) cycles at 25 °C. The black bars indicate dark conditions, while the white bars indicate light conditions. (B) Scattered plot showing the distribution of rhythmicity index scores across samples from different continents: other continents (circle) and North America (square). Error bars represent SEM, Welch’s t test, p < 0.0001.
Fitness Test
Equal numbers of conidia (2 × 10⁵ spores) from 4 strains representative of each phenotype (NA: FGSC8578, N309-30, N309-38, and N309-50 and African (AF: FGSC8831, N309-10, N309-80, and N309-89) were inoculated into minimal media. Strains were grown in either 12-h light/dark cycles or in DD at 25 °C and 75% humidity for 7 days. Two milliliters of sterile water was added to each tube and vortexed for 10 s. A total of 500 µL of the resulting conidial suspension was transferred to a 96-well filter plate (Cat No. 1417566, Fisher, Waltham, MA) with a square (2 cm × 2 cm) of Miracloth (Cat. No. 475855-1R, Millipore, Burlington, MA) at the bottom of the plate. The filter plate was stacked on top of a collection plate (Cat. No. 09761116A, ThermoFisher) and centrifuged for 2 min at 1000 rpm using a Sorvall Lynx 6000 (Fisher). Twenty microliters of sample from the collection plate was mixed with 1 µL of Acridine Orange (Cat. No. B12536, Fisher) by pipetting 5 times and then loaded onto a SD100 Cell Counting Chamber (Cat. No. CHT4-PD100-002, Nexcelom, Lawrence, MA). Images and quantification were completed using Cellometer X2 (Nexcelom). Statistical tests were completed using the wilcox.test and t.test functions in R.
Race Tube Assay and Strains
Strains used in the study were obtained from the Fungal Genetic Stock Center (Kansas State University, Manhattan, KS). Strains were grown in minimal media that contained 1X Vogel’s Salts and 2% sucrose, pH 5.8. Strains were inoculated in high-glucose liquid media and then inoculated into inverted race tubes. Race tube media contained 1X Vogel’s Salts, 0.17% L-arginine, and 0.1% D-glucose, pH 5.8. Race tube analysis of N. crassa ras-1bd and N. discreta sensu stricto was performed under DD at 24 °C and 31 °C. Temperature compensation of each strain was assessed by the temperature coefficient (Q10) using the following equation: Q10 = (FRP31°C/ FRP24°C)10/(31°C-24°C). Twelve-hour light and dark cycles (LD 12:12) were used to test for photic entrainment of overt rhythms at 26.2 °C ± 0.7 °C. Entrained phase values indicate when the spore reaches its maximum during the 24-h cycle (φmax) in zeitgeber time (ZT). To test the uncoupling of circadian regulation of asexual development, NA strain FGSC9980 was transformed with a plasmid containing a translational fusion construct of FRQ:LUC, which contains the bacterial Biaphalos resistance gene (bar) as a selectable marker (Larrondo et al., 2012). Primary transformants were screened for chemiluminescent signal, and transformed nuclei were enriched by passaging through media containing the selection agent phosphinothricin (PPT; also called glufosinate). Experiments were performed in race tube media including 8% PPT in DD at 25
Mathematical Modeling
We used the classical Kuramoto model for coupled oscillators:
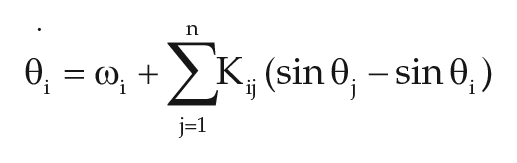
where
Conidiation was modeled as a process induced by a signal that surpasses the fixed threshold,
The weakly coupled oscillators with low sensitivity (K = 1, threshold T = 2) outperformed the highly coupled oscillators (K > 5) in terms of fitness (total number of conidiations over a fixed time interval). This result explains the advantage of NA strains in decoupling oscillators. We also note that for high values of K, the conidiation changes mildly as a function of sensitivity. Thus, the AF strain has environmental advantages in increasing sensitivity, which in turn mildly changes fitness.
Quantification of Gene Expression by Real-time Polymerase Chain Reaction
Fungal pads from low-glucose liquid media (1X Vogel’s Salts, 0.17% L-arginine, 0.1% D-glucose, pH 5.8) were snap frozen in liquid nitrogen followed by Trizol-based RNA extraction. Purity of the extracted RNA was measured using a NanoDrop1000 spectrophotometer at the absorbance ratio of 260 and 230 nm. Contaminated genomic DNA was removed from RNA samples using DNaseI acquired from New England BioLabs. MultiScribe Reverse Transcriptase (Applied Biosystems, Foster City, CA) was used to synthesize cDNA followed by quantitative polymerase chain reaction (qPCR) using SYBR Select Master Mix (Applied Biosystems; QuantStudio 6 Flex Real-Time thermal cycler, also from Applied Biosystems). The PCR reaction program included 10-min denaturation at 95 °C and 40 PCR cycles (15 s at 95 °C and 1 min at 60 °C). qPCR primers were designed, and efficiencies were validated for a target gene and for housekeeping genes (Suppl. Table S1). Expression of the target gene, NEUDI_158280, was normalized using N. discreta orthologs of the reference genes btl (NEUDI_98553) and vma-2 (NEUDI_168658) and scaled to samples with the highest expression levels using the ΔΔCt method (Livak and Schmittgen, 2001). Kits and reagents were used according to the manufacturer’s protocols. For 24-h time-course sampling, rhythmicity was measured by fitting the data to a sinusoidal curve using Circwave.
Measurement of ROS (Cellular ROS Measurement)
Cellular ROS was measured using the Abcam DCFDA Cellular ROS Detection Assay Kit (ab113851) protocol for adherent cells. Briefly, conidial suspensions in high-glucose liquid medium (HGLM) were prepared from 2-mL slants containing Vogel’s minimal media. Conidial suspensions were inoculated into 10-mL HGLM to generate mycelial mats. After 5 days of growth in constant light at room temperature, replicate mycelial pads were prepared from mycelial mats using a 3-gauge punch. Mycelial pads were inoculated into the wells of a clear-bottom, 96-well plate and washed with 100 µL of 1X dilution buffer. The buffer was removed and replaced with 100 µL of 25 µM DCFDA, and the tissues were incubated at 37 °C for 45 min. After incubation, the DCFDA was removed and replaced with 100 µL of 1X dilution buffer, and the luminescence was immediately measured using a ClarioStar plate reader with excitation/emission wavelengths of 485/535 nm. Blank-adjusted values were averaged across replicates, and the measurement was performed in 3 separate trials with at least 10 replicates per trial.
RNA Sequencing
RNA sequencing was performed for N. discreta PS4b parents FGSC 8831AF and FGSC 8578NA and their progeny 309-89af and 309-50na at each time point: 15M (15 min after dark to light transition), 1H (1 h after dark to light transition), 2H (2 h after dark to light transition), and 2DK (2 h after transition from light to darkness) for strains under a 12 h:12 h LD cycle. Trizol-based RNA extraction was performed on fungal tissues. Concentration and integrity of RNA were verified using a fragment analyzer with a high-sensitivity RNA analysis kit (15 nt) acquired from Agilent Technologies (Santa Clara, CA). polyA RNA was further purified from 5 to 10 µg of total RNA with oligo(dT) beads. After purification of polyA RNA (mRNA), ~100 ng mRNA was used for Illumina library preparation. Directional cDNA libraries were prepared using the dUTP method with a NEB Ultra Directional RNA Library Prep Kit for Illumina (New England Biolabs Inc., Ipswich, MA). Each sample was further ligated with different indexes and amplified with 12 PCR cycles. The quality and quantity of cDNA libraries were measured using a Qubit 2.0 fluorometer (Invitrogen, Life Technologies, Carlsbad, CA), a 2100 Bioanalyzer with the Agilent DNA 1000 Kit (Agilent Technologies), and real-time PCR using the KAPA Library Quantification Kit (Kapa Biosystems, Wilmington, MA). Adapter-ligated cDNA libraries were pooled together and loaded into an Illumina NextSeq 500 using the NextSeq 500/550 High Output Kit v3 based on the manufacturer’s protocol (Illumina). Illumina reads were demultiplexed and quality controlled using FastQC v0.11.4. Adaptor sequences and reads shorter than 36 bp with a quality score lower than 15 were removed using Cutadapt v1.3. The processed reads were mapped to the reference genome available from JGI (https://jgi.doe.gov/) using TopHat2 V2.1.1, and aligned reads were counted with the HTSeq framework v0.9.1. The count table was normalized so that all samples had the same level of total mapped reads. The data discussed in this publication have been deposited in NCBI’s Gene Expression Omnibus (Edgar et al., 2002) and are accessible through GEO Series accession number GSE120053 (https://www.ncbi.nlm.nih.gov/geo/query/acc.cgi?acc=GSE120053).
Results and Discussion
Most fungal circadian clock studies have been done with laboratory strains of the model species, N. crassa (Baker et al., 2012). To study the evolution of the circadian clock in this genus, we have extended this work to the N. discreta species complex, the members of which are more distantly related to N. crassa. We evaluated circadian properties of asexual development in the type strain of N. discreta phylogenetic species 4b (PS4b), N. discreta sensu stricto (ss) under constant dark and 12-h light-dark cycles (Suppl. Fig. S1). We evaluated the temperature compensation of N. discreta ss in constant free-running conditions at 24 °C and 31 °C (Suppl. Fig. S1). As a positive control, N. crassa ras-1bd was used to evaluate authentic circadian oscillation in N. discreta. Our results suggest that N. discreta exhibit robust circadian rhythms with all of the characteristics of an authentic circadian oscillator, including temperature compensation (Suppl. Fig. S1). After confirming an authentic circadian clock in the type species of N. discreta, we further evaluated the HSCV of N. discreta species using a globally dispersed species, N. discreta phylogenetic species 4-subgroup b (PS4b). N. discreta PS4b strains have been collected in a wide range of geographical regions from Alaska to Africa (Dettman et al., 2006), while the fungal clock model species N. crassa is found only in temperate regions. Thus, N. discreta PS4b is an ideal species for studying the adaptation of complex traits affected by variation in latitude, ecology, and temperature.
We screened the overt rhythm of PS4b natural strains collected from Europe, Africa, Asia, and North America under 12-h LD cycles. We found that the NA N. discreta PS4b population exhibited a weak overt rhythm and low RI scores compared with those from other continents, Welch’s t test, p < 0.0001 (Fig. 1, Methods section).
This result suggested that the clock in the NA population of N. discreta PS4b may have adapted to constant darkness (under tree bark), unlike the clocks in strains from OC, which grow in cycling light conditions (over tree bark; Jacobson et al., 2006). It has been reported that some species in extreme environments have shown either a compromised circadian rhythm or have completely lost their circadian rhythm (Lu et al., 2010; Cavallari et al., 2011). There are several possible hypotheses to explain this HSCV: (1) NA strains have lost their sensitivity to light, (2) the circadian oscillators in NA strains have weakened, or (3) the developmental rhythm is uncoupled from the circadian oscillator in NA strains. These hypotheses are not necessarily exclusive to each other.
To test the first hypothesis, we characterized the light response of FRQ in 6 representative strains. FRQ is the key negative regulator in the Neurospora circadian oscillator (Baker et al., 2012). FRQ is a light-responsive gene, and the clock is reset when ambient light raises FRQ levels through the light receptor WC-1 (Crosthwaite et al., 1997; Lee et al., 2003). Thus, the light response of FRQ is an appropriate way of measuring the sensitivity of the clock to ambient light. There was no significant difference (t test, p = 0.49) in the light response of the FRQ protein between NA and OC strains (Fig. 2A). Based on this result, we rejected the first hypothesis that NA strains have lost their sensitivity to light.
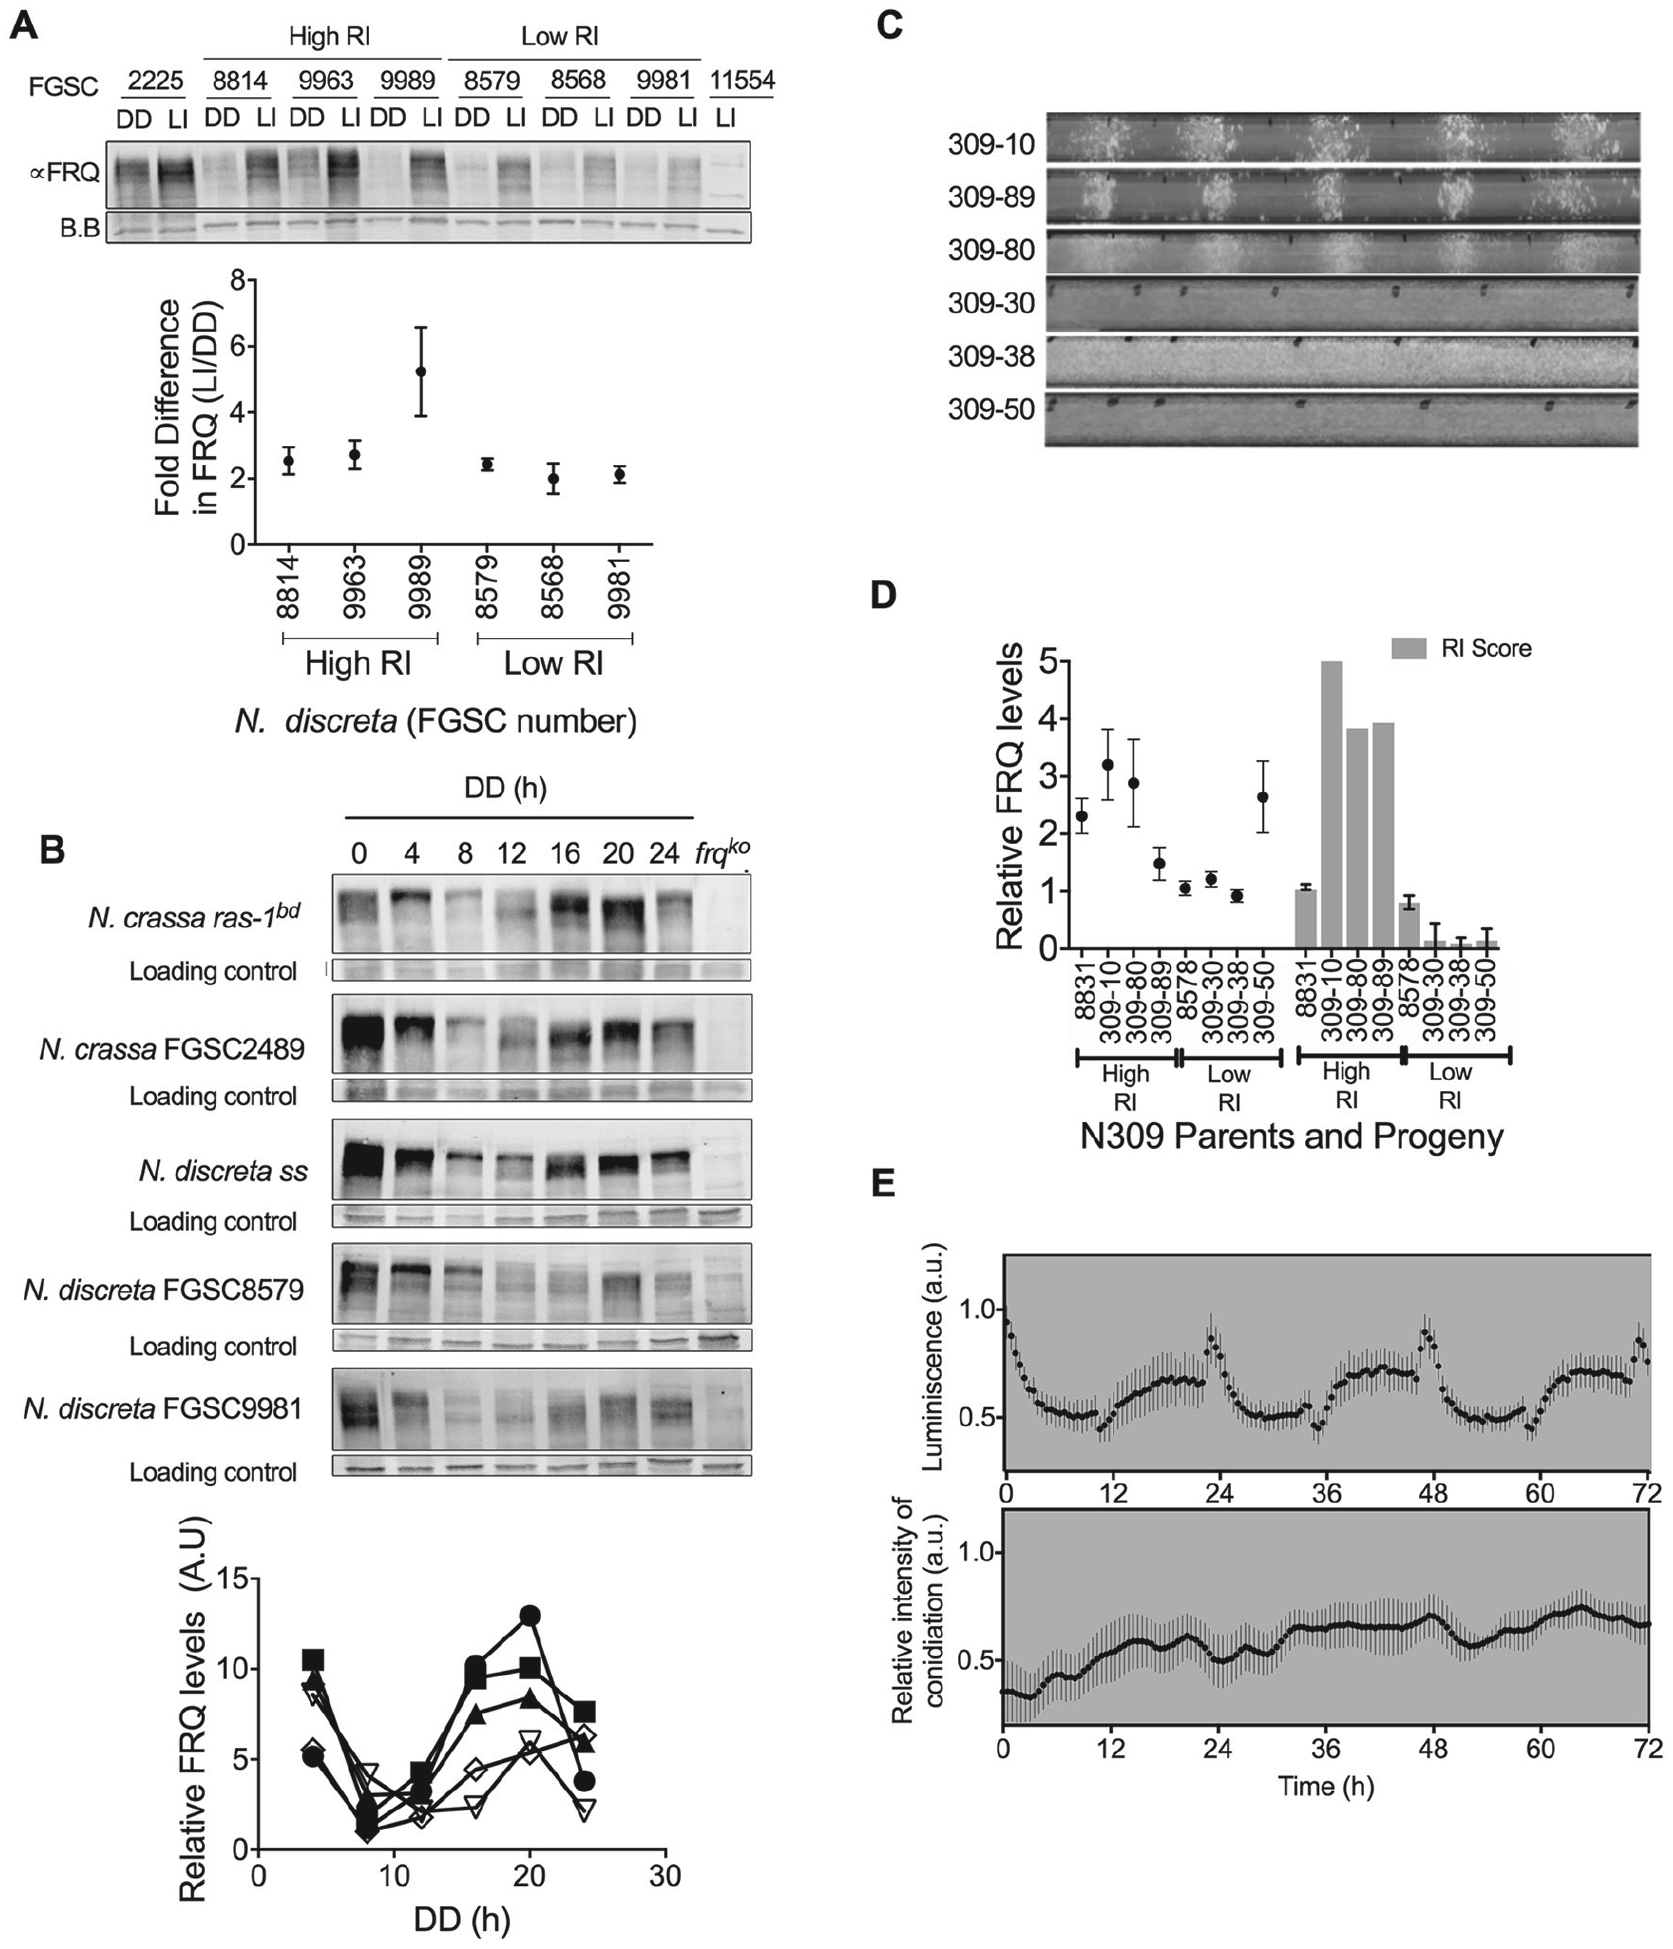
FRQ rhythms are uncoupled to circadian regulation of asexual development in North American (NA) strains. (A) Levels of FRQ in 3 representative NA strains (FGSC8579, New Mexico United States; FGSC8568, Idaho, United States; FGSC9981, Alaska, United States) and in 3 other continent strains (FGSC8814, Thailand; FGSC9963, Ivory Coast; FGSC9989, Portugal) in constant darkness (DD) and light induction (LI) conditions. Neurospora crassa FGSC 2225 and frq knockout (frqko; FGSC11554) strains were used as positive and negative controls, respectively. The graph below the Western blot analysis is the quantification of FRQ. There was no significant difference in light induction of FRQ between high and low rhythmicity index (RI) ecotypes (t test, p = 0.17). (B) Western blot analysis of FRQ in constant darkness shows the typical progressive phosphorylation and circadian oscillation in NA strains; N. discreta FGSC8579 and N. discreta FGSC9981 are representative NA strains. frqko is used as a negative control. The graph below the Western blot analysis is the quantification of FRQ. Open symbols represent NA strains. N. crassa ras-1bd (circle), N. crassa FGSC2489 (square), N. discreta sensu stricto (triangle), N. discreta FGSC8579 (open inverted triangle), N. discreta FGSC9981 (open diamond). (C-D) The cellular FRQ levels do not segregate with RI in N309. (C) Six representative race tube images of N309 strains with high RI (309-10, -80, and -89) and low RI (309-30, -38, and -50) in LD conditions. (D) FRQ levels in representative N309 strains with high and low RI and parent strains 8831 and 8578. There is no correlation between levels of FRQ and RI score (Pearson correlation; R2 = 0.3411, p = 0.1285). (E) Decoupling of the circadian regulation of asexual development. Asexual development of FGSC9980 (NA strain) in race tubes under LD at 25 °C. Error bar represents SEM, n = 6. Upper panel, A significant chemiluminescent molecular rhythm of FRQ:LUC translational fusion protein of the FGSC9980 strain bearing a FRQ:LUC fusion (analysis of variance [ANOVA], p < 0.0001). Measurements of arrhythmic conidiation (ANOVA, p = 0.99) in the transgenic FGSC9980 strain bearing a FRQ:LUC fusion construct from the same chamber where the race tube experiment (lower panel) was performed. Error bars represent SEM, n = 6. Data were collected every 10 min (lower panel) and 30 min (upper panel), respectively, for 3 days.
To test the second hypothesis that the circadian oscillators in NA strains have been compromised, we performed Western blot analysis of FRQ in representative NA and OC strains. The level of FRQ is one way of measuring the robustness of the clock; a higher FRQ level indicates a more robust circadian clock (Cheng et al., 2001). We analyzed the steady-state level of FRQ and WC-1 in constant light (LL) and constant dark (DD). We observed an apparent and consistent difference in FRQ levels between NA and OC strains; in particular, NA strains exhibited lower levels of FRQ and WC-1 in comparison with OC strains (Suppl. Fig. S2). These data suggest that the circadian oscillator in NA could be weaker relative to OC strains. To explore this further, we performed Western blot analysis of FRQ in constant darkness in 2 representative NA strains (FGSC8579 and FGSC9981) and found that the FRQ levels in NA strains show the expected progressive phosphorylation and rhythmic oscillation, although the amplitude and overall expression level of FRQ are comparatively lower than those in N. crassa and N. discreta ss (Fig. 2B). To test the causal relationship between the level of FRQ and HSCV, we used a genetic approach. We predicted that if relatively lower levels of FRQ in NA strains were responsible for the observed low RI phenotype, the rhythmicity phenotype would co-segregate with FRQ levels in the progeny of a cross between NA and OC strains. We chose to work on a representative AF strain to represent the OC group. N309 is the F1 population produced by crossing the following 2 parents: FGSC8831 from Golikro, Ivory Coast, Africa, and FGSC8578 from Belen, New Mexico, United States, North America. We note that Neurospora is a haploid organism, which simplifies the genetic analysis compared with diploid or multiploid organisms. As a control, we also generated a control F1 population (N310) by crossing 2 NA strains. As expected, we observed quantitative variation in the RI in N309 strains but only low RI in N310 (Suppl. Fig. S3). We compared the levels of FRQ across 3 N309 strains with AF-like RI phenotype (309-10, -80, and -89) and 3 N309 strains with NA-like RI phenotype (309-30, -38, and -50) and found no correlation between the level of FRQ and RI, Pearson correlation R2 = 0.3411, p = 0.1285 (Fig. 2C, D). These results do not support the view that the variation in the circadian oscillator measured by the level of FRQ is the main cause of the low RI phenotype observed in NA strains. To test the hypothesis that the low RI phenotype was caused by the weakening of the output pathway from the oscillator to the developmental rhythm, we generated a transgenic NA strain with a translational fusion protein, FRQ:LUC (Methods section, and Fig. 2E, top panel). The transgenic strain showed a robust molecular rhythm of FRQ in the absence of developmental rhythm (Fig. 2E, bottom panel). Taken together, our data support the view that the observed clock phenotype in NA strains is caused at the output pathway. This decoupling of developmental rhythm from circadian regulation has been reported before in one of the classical clock mutants, chol-1 (Shi et al., 2007). However, the current study is the first to document an uncoupling of developmental rhythm from circadian regulation in natural strains. To further characterize HSCV within a phylogenetic context, we constructed a phylogenetic tree and found that the NA strains comprise their own subbranch that is distinct from other continental strains (Suppl. Fig. S4). This relationship is consistent with a distinct population history and a past population split prior to any putative NA-specific changes to HSCV.
To characterize the consequences of local adaptation of the clock, we decided to study the fitness of the 2 clock ecotypes. One definitive test for fitness is the number of progenies produced by each organism. To this end, we measured the number of conidia produced by NA- and AF-type strains in LD and DD conditions to test whether HSCV affects fitness (Fig. 3).
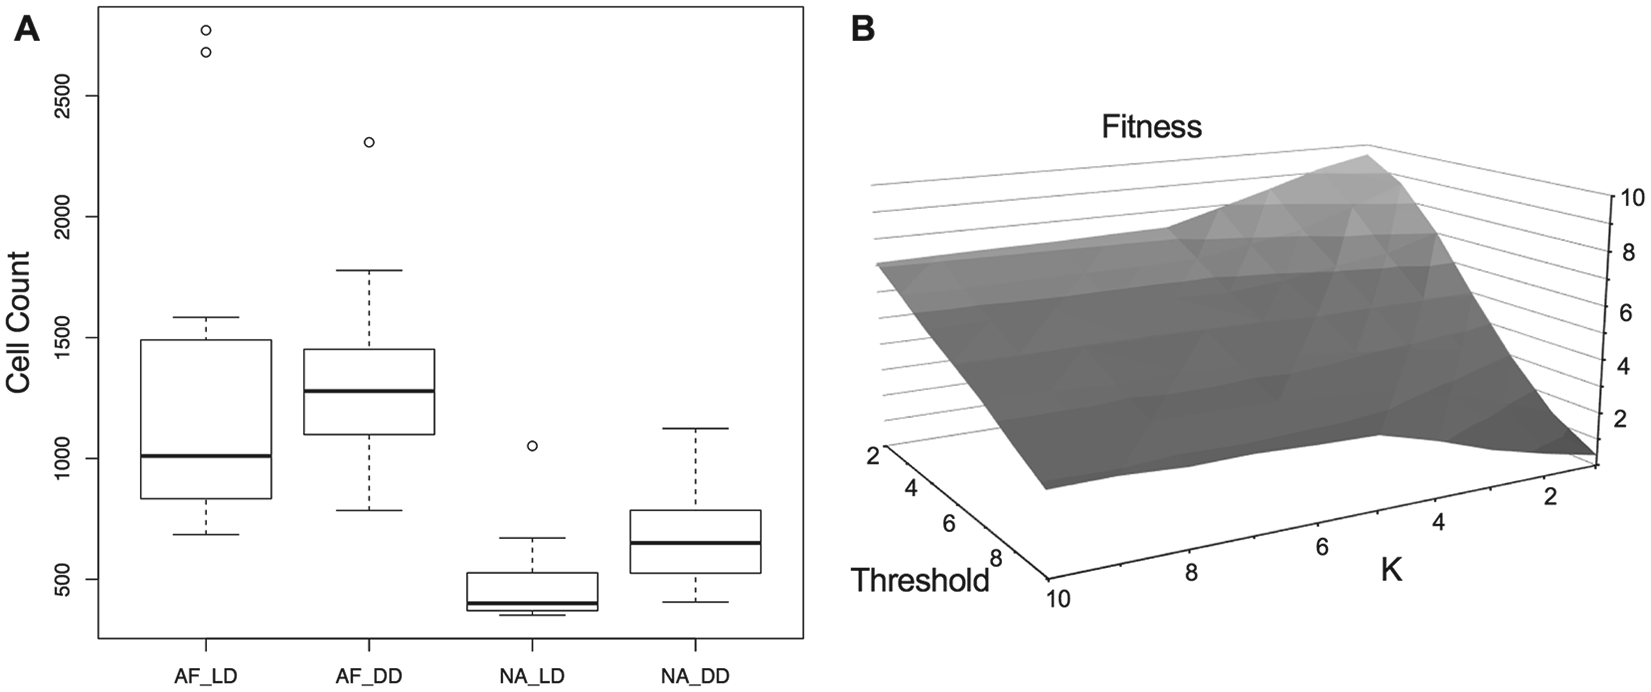
North America strains exhibit a fitness advantage in their habitat of constant dark. (A) The number of conidia is counted in African-type (AF) and North American–type (NA) strains in constant dark (DD) and light-dark (LD) cycling conditions, n = 16. AF-type strains demonstrate a significant fitness advantage over NA-type strains under both conditions (Wilcoxon rank-sum test: DD, W = 7, p = 3.3e-05; LD, W = 6, p = 2.2e-05). There was also a significant fitness advantage of NA-type strains in DD over LD conditions (Wilcoxon rank-sum test: W = 26, p = 0.007). (B) Plot of fitness (total number of conidia) as a function of the oscillators’ coupling and sensitivity. For fixed K (coupling strength, SI Appendix, Suppl. Fig. S5 and Methods section), conidiation decreases as the sensitivity increases. Weakly coupled oscillators with low sensitivity (K = 1) are outperforming highly coupled oscillators (K > 5). For large K’s, conidiation is changing mildly as a function of sensitivity.
We observed that AF-type strains demonstrated a significant fitness advantage over NA-type strains under all conditions (Wilcoxon rank-sum test: DD, W = 7, p = 3.3e-05; LD, W = 6, p = 2.2e-05). However, while AF-type strains demonstrated no light condition–specific fitness advantage (Wilcoxon rank-sum test: W = 59, p = 0.48), there was a significant fitness advantage in NA-type strains in DD over LD conditions (Wilcoxon rank-sum test: W = 26, p = 0.007). Based on these data, one simple explanation could be that decoupling the circadian regulation of asexual development improved the fitness in the NA strain during adaptation to life under tree bark. Our study does not address why and how the NA population adapted underneath the bark. However, it is tempting to speculate that the environment underneath the bark offset the fitness cost observed (Fig. 3A). Then, the decoupling of the circadian regulation on asexual development could have been a way of recovering at least some portion of the lost fitness under constant darkness in the NA population.
To understand how HSCV has shaped the fitness of natural Neurospora strains, we used mathematical modeling (Methods section). The eukaryotic circadian clock is composed of multiple cellular oscillators (Bell-Pedersen et al., 2001; Yao and Shafer, 2014; Nsa et al., 2015). Thus, we established mathematical clock models that are composed of multiple oscillators using MM kinetics for conidiation (Fig. 3B; Suppl. Fig. S5). The coupled circadian internal signal is the major signal for conidiation when the coupling strength is high. When the coupling of internal oscillators is weakened, individual environmental/internal signals induce conidiation when the organism’s sensitivity is low. Our model reflects the current developmental regulation representing NA and AF (Suppl. Fig. S5). We found that the 2 key parameters determining the rhythmicity of developmental regulation and fitness of the organism were the strength of the internal oscillator coupling and the sensitivity of the internal signal for development.
To identify the molecular component that might play a role in HSCV and its fitness consequence, we performed an RNA-Seq analysis (Methods section; Suppl. Figs. S6, S7, and S8). Using SNP and differential expression profiles of the 2 genotypes, we identified a functionally annotated candidate gene associated with HSCV and fitness: NEUDI_158280 (Ubiquinol cytochrome c reductase). We then performed a time-course qPCR experiment and found that the expression of NEUDI_158280 is rhythmic in AF-type (high RI) strains (Circwave, p < 0.001) but not in NA-type (low RI) strains (Fig. 4A). Furthermore, elevated levels of NEUDI_158280 transcripts are associated with the RI phenotype in multiple strains (Fig. 4B).
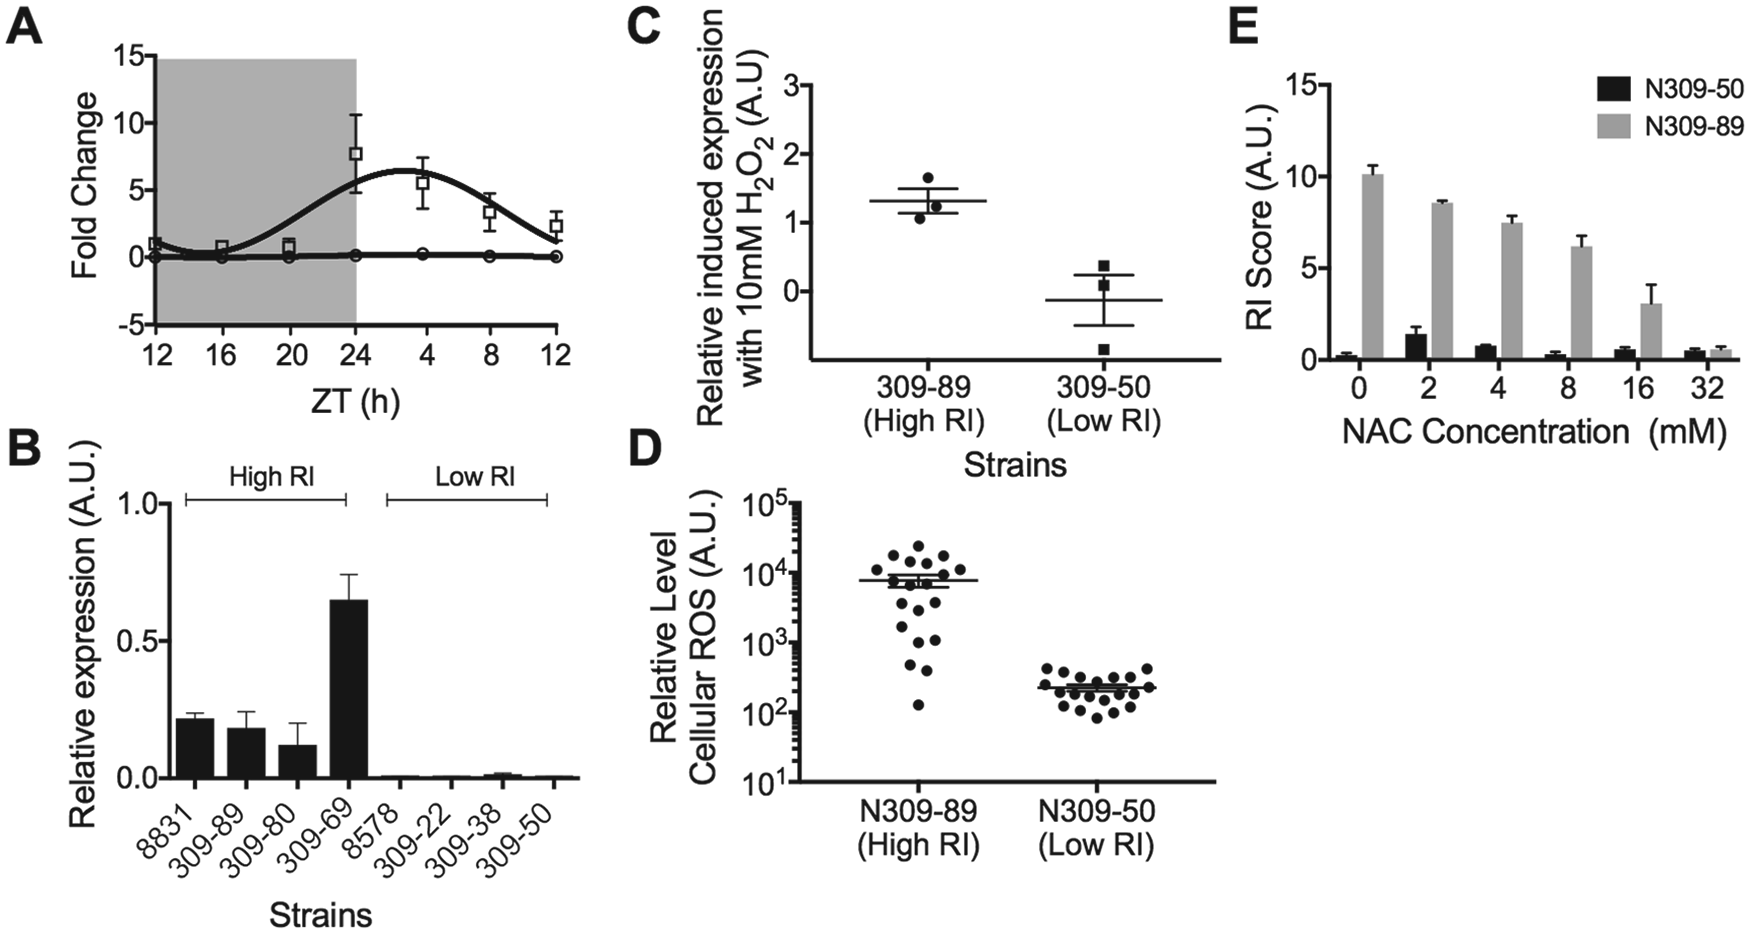
Habitat-specific clock variation of reproductive fitness is shaped by the variation in gene expression and cellular reactive oxygen species (ROS) due to allelic variation of NEUDI_158280. (A) Twenty-four-hour time-course mRNA analysis of NEUDI_158280 in high rhythmicity index (RI; N309-89; square) and low RI (N309-50; circle) phenotypes. mRNA expression is significantly rhythmic in high RI phenotypes (Circwave, p < 0.001). (B) Segregation of the levels of expression of NEUDI_158280 and RI phenotypes. (C) Response of NEUDI_158280 gene expression upon H2O2 treatment with N309-89 (circle) and 50 (square). N309-89 mRNA expression levels significantly increase with 10 mM H2O2 treatment (t test, p < 0.05), which is not observed with N309-50 (t test, p = 0.76). (D) Variation of ROS levels with N309-89 (high RI) compared with N309-50 (low RI). ROS levels are significantly higher with high RI compared with low I strains (t test, p < 0.01). (E) Inhibition of ROS with N-acetyl-L-cysteine reduces RI scores in high RI strain N309-89 but not low RI strain N309-50.
It is known that the redox condition in a cell is under circadian regulation and influences asexual development (Dettman et al., 2006; Jacobson et al., 2006). Taken together, we hypothesized that the allelic variation of NEUDI_158280 may play a role in the developmental rhythm by altering the homeostasis of redox conditions in a cell. First, the transcript level of NEUDI_158280 is upregulated, and the number of conidia is increased when the cells are challenged with H2O2 in the AF genotype but not in the NA genotype background (Fig. 4C). The relative endogenous ROS level in the AF phenotype (high RI) is higher than that of the NA (low RI) phenotype (Fig. 4D), and reduction of cellular ROS with NAC decreases the RI in the AF phenotype but not in the NA phenotype in a dose-dependent manner (Fig. 4E).
It has previously been demonstrated that endogenous cellular ROS is linked to development and conidiation through an unknown mechanism (Belden et al., 2007; Yoshida et al., 2008; Yoshida et al., 2011). It is believed that there is cross-talk between cycling levels of ROS and circadian oscillators and that higher concentrations of ROS enhance conidial banding, thus increasing rhythmicity (Yoshida et al., 2011). Our data support this idea and implicate Ubiquinol cytochrome c reductase (NEUDI_158280), one of the main endogenous producers of ROS in fungi, as being involved in the interplay between ROS and conidiation (Bourens et al., 2013). In AF-type strains, we observed rhythmic expression of NEUDI_158280, rhythmic patterns of conidiation, and high levels of endogenous ROS. In NA-type strains, we observed arrhythmic patterns of conidiation, low-level expression of NEUDI_158280, and low levels of endogenous ROS. Finally, reduction of cellular ROS with NAC reduced rhythmicity only in AF-type strains, further demonstrating that endogenous concentrations of ROS are directly correlated to banding intensity and therefore RI score. Together, these data suggest that circadian regulation of NEUDI_158280 may play a role in maintaining rhythmic production of cellular ROS, which serves as a signal between the cellular redox state and developmental rhythm. Furthermore, uncoupling of the ROS-generating output pathway from internal circadian oscillators in the NA population provided a fitness advantage in NA strains as they adapted to life under tree bark, where environmental cues could no longer inform endogenous oscillators. One alternative explanation that we cannot rule out with the current study is that the observed RI phenotype in LD conditions could be affected by clock-independent light signal pathways.
In summary, NA strains have adapted to live in dark environmental conditions (under tree bark) after the population/geographic split of NA and AF ancestral populations (Suppl. Fig. S4). This alternative habitat is associated with the decoupling of internal oscillators and improved fitness of the organism. Our study demonstrates that this decoupling was accomplished through changes in the regulation of NEUDI_158280 in NA strains, which disconnected ROS production from circadian output pathways. These results support a view that adaptive or pathological physiologies could arise by the uncoupling of output signal pathways without changing the core oscillator.
Supplemental Material
Koritala_2019_JBR_supple_2ndRevision_final_tracking – Supplemental material for Habitat-Specific Clock Variation and Its Consequence on Reproductive Fitness
Supplemental material, Koritala_2019_JBR_supple_2ndRevision_final_tracking for Habitat-Specific Clock Variation and Its Consequence on Reproductive Fitness by Bala S. C. Koritala, Craig Wager, Joshua C. Waters, Ryan Pachucki, Benedetto Piccoli, Yaping Feng, Laura B. Scheinfeldt, Sunil M. Shende, Sohyun Park, James I. Hozier, Parth Lalakia, Dibyendu Kumar and Kwangwon Lee in Journal of Biological Rhythms
Footnotes
Acknowledgements
The authors thank Dr. Luis Larrondo for providing the FRQ:LUC fusion construct and Dr. Christian Hong for the FRQ antibody. We thank Dr. Katie Hyma for her assistance in genotyping fungal strains. We also thank Drs. Martha Merrow and Charot Rodeget for critical reading and insightful comments. The work was supported by NSF MCB 0946860, NIH R15GM117523, and the Faculty Research Funding from Rutgers University–Camden.
Author Contributions
C.W. and K.L. conceived and designed the study; B.S.C.K, R.P., C.W., J.C.W., B.P., Y.F., S.P., J.H., P.L., D.K., and K.L. generated experimental data; L.B.S., C.W., and S.S. performed statistical analysis and phylogenetic tree analyses; K.L., R.P., and C.W. drafted the article with contributions from all authors.
Conflict of Interest Statement
The authors have no potential conflicts of interest with respect to the research, authorship, and/or publication of this article.
Notes
References
Supplementary Material
Please find the following supplemental material available below.
For Open Access articles published under a Creative Commons License, all supplemental material carries the same license as the article it is associated with.
For non-Open Access articles published, all supplemental material carries a non-exclusive license, and permission requests for re-use of supplemental material or any part of supplemental material shall be sent directly to the copyright owner as specified in the copyright notice associated with the article.