
Abstract
Circadian rhythms exist in nearly all organisms. In mammals, transcriptional and translational feedback loops (TTFLs) are believed to underlie the mechanism of the circadian clock. Casein kinase 1δ/ε (CK1δ/ε) are key kinases that phosphorylate clock components such as PER proteins, determining the pace of the clock. Most previous studies of the biochemical properties of the key kinases CK1ε and CK1δ in vitro have focused on the properties of the catalytic domains from which the autoinhibitory C-terminus has been deleted (ΔC); those studies ignored the significance of self-inhibition by autophosphorylation. By comparing the properties of the catalytic domain of CK1δ/ε with the full-length kinase that can undergo autoinhibition, we found that recombinant full-length CK1 showed a sequential autophosphorylation process that induces conformational changes to affect the overall kinase activity. Furthermore, a direct relationship between the period change and the autokinase activity among CK1δ, CK1ε, and CK1ε-R178C was observed. These data implicate the autophosphorylation activity of CK1δ and CK1ε kinases in setting the pace of mammalian circadian rhythms and indicate that the circadian period can be modulated by tuning the autophosphorylation rates of CK1δ/ε.
Circadian rhythms exist universally in nearly all organisms, including bacteria, fungi, plants, and animals. Although several independent/parallel origins have been proposed for the evolution of circadian clocks (Dunlap and Loros, 2018), the clock components in animals are very similar. Current understanding of the clock mechanisms started from the discovery of the fruit fly Period mutants through chemomutagenetic screening (Konopka and Benzer, 1971). Later, the fly Double-time (Dbt) mutants were discovered using ethyl methane sulfonate mutagenesis, and the DOUBLETIME (DBT) protein was found to be homologous to the human casein kinases casein kinase 1δ and CK1ε (Price et al., 1998; Kloss et al., 1998). Moreover, a spontaneous mutation Tau was identified in hamsters that dramatically shortens the period of the circadian behavioral rhythm, and ultimately the Tau mutation was located within the casein kinase 1ε gene (Ralph and Menaker, 1988; Lowrey et al., 2000).
The human genome includes more than 500 genes that encode different kinases (Manning et al., 2002). The CK1 kinase family has 7 members, and the csnk1d and csnk1e genes that are intimately implicated in circadian rhythms were cloned by separate groups in the 1990s (Graves et al., 1993; Fish et al., 1995). CK1δ (encoded by the csnk1d gene) and CK1ε (encoded by the csnk1e gene) are highly conserved, with 86% identity of their amino acid sequences (98% identity of the amino acid sequences within their catalytic domains; Cheong and Virshup, 2011; Knippschild et al., 2014). Both kinases contain C-terminal domains (CTDs) in addition to their catalytic domains, and these CTDs have been shown to rapidly inhibit the CK1 kinase activity on substrate proteins after the CK1 is autophosphorylated by the catalytic domain (inhibition within 5 to 10 min at 37 °C; Graves and Roach., 1995; Cegielska et al., 1998; Rivers et al., 1998). CK1ε is practically inactive when its CTD is completely autophosphorylated, but its activity can be restored in vitro by treatment with protein phosphatases (Cegielska et al., 1998).
Because both fly Dbt and hamster Tau mutants significantly affect the period of circadian clocks (Price et al., 1998; Kloss et al., 1998; Ralph and Menaker, 1988; Lowrey et al., 2000), CK1ε has been thought to be implicated in the circadian clockwork. In fact, both CK1δ and CK1ε phosphorylate substrates of the key mammalian clock protein family PERIOD (PER1, PER2, and PER3). These phosphorylation events regulate PER degradation and nuclear accumulation (Camacho et al., 2001; Akashi et al., 2002; Eng et al., 2017), which are considered to be a key step for determining the pace (aka period) of the circadian clock. In addition to the Tau mutant (CK1ε-R178C) with a period ~4 h shorter than wild-type (WT) animals (Ralph and Menaker, 1998; Lowrey et al., 2000), other mammalian natural or transgenic mutations in the csnk1d or csnk1e genes have been reported. For example, animals bearing the T44A mutation in CK1δ have a short period (Xu et al., 2005), and humans carrying the CK1ε-S408N allele appear to display delayed sleep phase syndrome (DSPS; Takano et al., 2004), which might be due to a long circadian period. Overexpression of a dominant-negative mutant form of CK1ε in mouse embryonic fibroblasts (MEFs) caused arrhythmicity (Lee et al., 2009). Thus, both kinases contribute to setting the speed of the clock.
But which kinase (CK1δ vs. CK1ε) is the primary determinant of circadian period? Genetic deletion and pharmacological studies have addressed which kinase principally regulates the clock speed. CK1δ-null MEFs in culture exhibited robust rhythmicity with an approximately 2-h longer period, while the period of MEFs from CK1ε-null mice were similar to those from WT mice (Etchegaray et al., 2009). Circadian behavior in animals shows that CK1ε-null mice exhibited a small but significant period lengthening with the locomotor activity (Loudon et al., 2007), but a comparable experiment with CK1δ-null animals is impossible because the CK1δ-null is embryonically lethal. Recently, very specific pharmacological inhibitors toward CK1δ (PF670462, IC50 = 13 nM) versus CK1ε (PF4800567, IC50 = 32 nM) have been developed (Walton et al., 2009). In the presence of these inhibitors, PF4800567 had only a small effect on the period, but PF670462 robustly lengthened the period (Walton et al., 2009), supporting the hypothesis that CK1δ is the principal kinase that governs the circadian period in mammals. On the other hand, the tau mutation of CK1ε (R178C) can dramatically shorten the circadian period of not only mutant hamsters but also of genetically tau-site introduced mutant mice (Ralph and Menaker, 1988; Meng et al., 2008). Despite these clear indications that the CK1δ and CK1ε kinases play key roles in determining circadian period in mammals, at a biochemical level, their action is unclear. For example, some studies have claimed that tau (R178C) in CK1ε is a gain-of-function mutation (i.e., it enhances catalytic activity; Gallego et al., 2006), while other studies claim that the R178C substitution reduces the kinase activity (Lowrey et al., 2000). It thus remains unclear how CK1ε regulates the pace of circadian rhythms, and the same confusion exists for CK1δ as well.
We report here that the autoinhibitory phosphorylation activity (rather than their catalytic activities on other substrates) of the CK1δ and CK1ε kinases is the key toward understanding their role in setting the pace of mammalian circadian rhythms. In reaching this conclusion, we apply a combination of in vitro biochemical assays with cell culture methods, including CRISPR/Cas9 technology, which has recently been successfully developed for studying circadian rhythms (Korge et al., 2015). In a circadian reporter cell line, genomic editing of the csnk1d and csnk1e loci using CRISPR/Cas9 recapitulated the phenotypes of previous reports, but the mechanism underlying the observed different period changes between these 2 knockout cell lines is not understood. Therefore, to understand the contributions of CK1δ versus CK1ε, we studied the properties of recombinant full-length CK1δ-WT, CK1ε-WT, and CK1ε-R178C proteins in vitro. Since the initial observations of the autoinhibitory property of the CTDs on CK1δ and CK1ε 20 years ago (Graves and Roach, 1995; Cegielska et al., 1998; Rivers et al., 1998), there have been practically no biochemical studies of the full-length CK1δ and CK1ε kinases in vitro. We found interesting autophosphorylation kinetics among the CK1 proteins that revealed the autokinase rates of CK1 to be temperature dependent instead of the expected temperature compensation. In addition to the full-length proteins that include the CTDs, the catalytic domains of each protein (ΔC versions) were purified and their overall kinase activities measured. We found opposite trends between the activities of the catalytic domains (ΔC versions, −CTDs) and the full-length kinases (+CTDs). This result plus the close correlation between period changes and the catalytic rates on clock substrates lead us to the conclusion that the apparent strength of the autokinase activity of CK1δ/ε may determine the period of mammalian circadian rhythms.
Materials and Methods
Reagents and Cells
Cultured cells were grown in DMEM (Gibco, No. 11965-092) supplemented with 10% fetal bovine serum and 1% penicillin/streptomycin at 37 °C (5% CO2). A mouse NIH3T3 cell line stably transfected with an mBmal1::luc reporter (made for this study, see Fig. 1C) was grown under these same conditions. Unless noted otherwise, the reagents used in this study were purchased from Sangon Biotech (Shanghai, China).
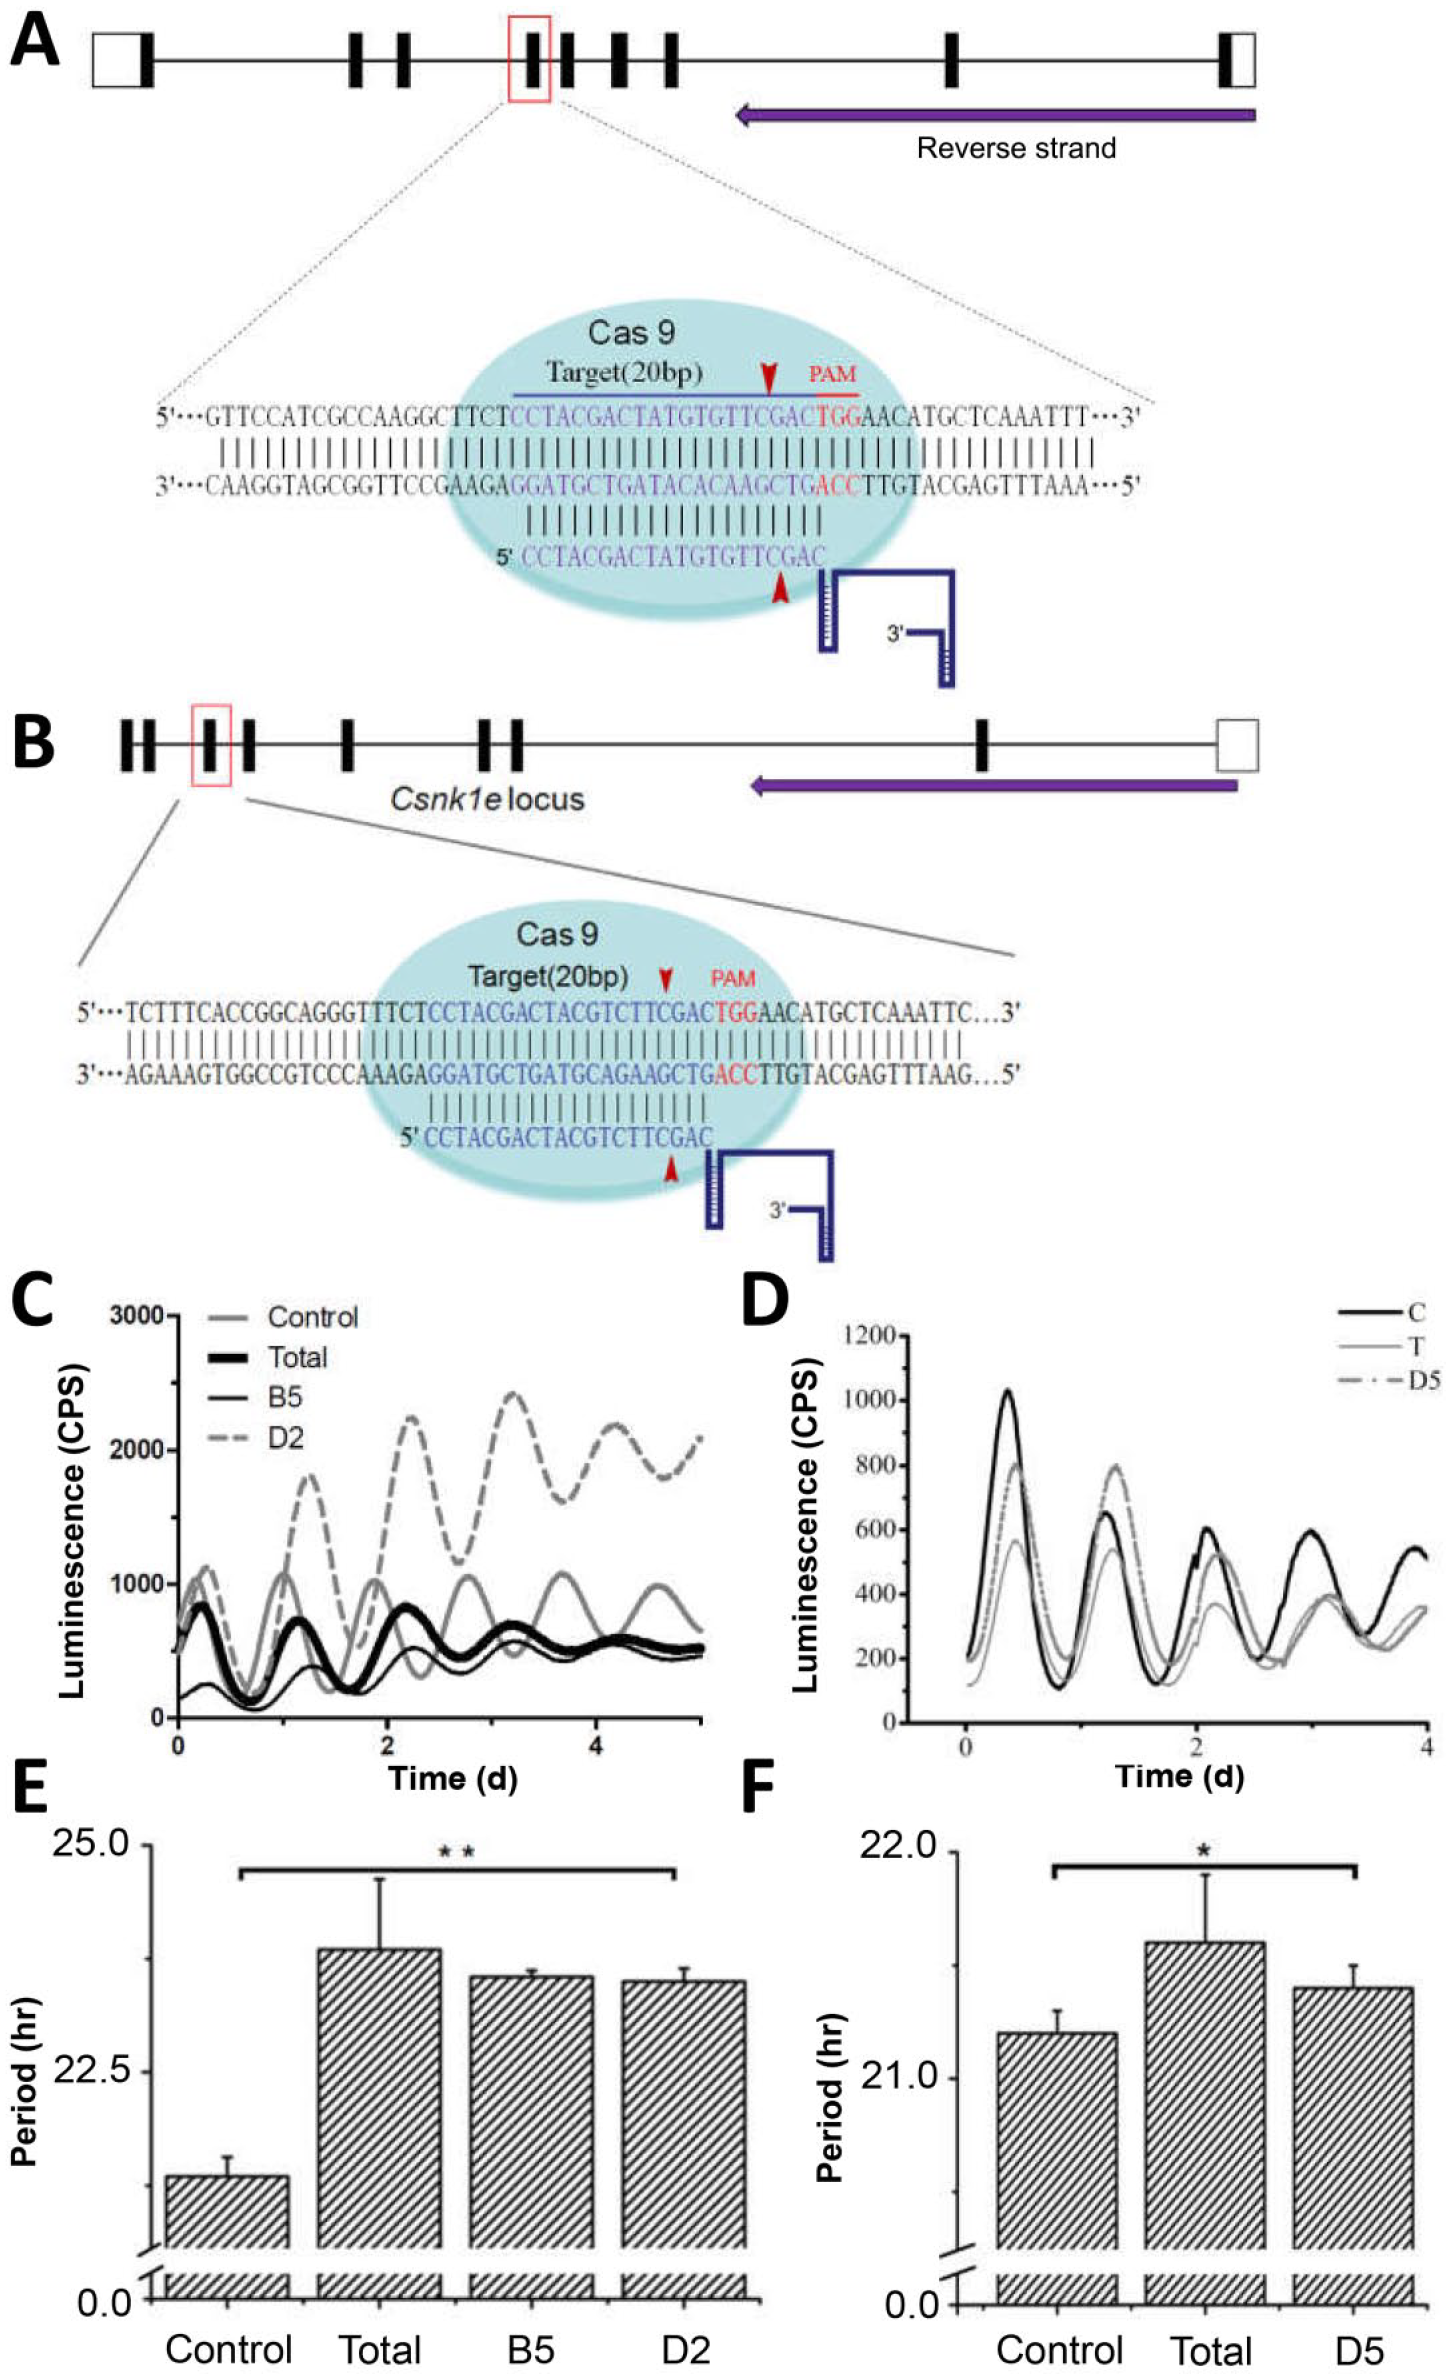
Csnk1d and Csnk1e knockout cells exhibited long circadian periods. (A) Schematic representation of the CRISPR/Cas9 genome editing on the Csnk1d locus. A single guide RNA sequence (20-nt long) targeting exon 6 of the mouse Csnk1d locus was selected. The PAM motif (5′-NGG) and the Cas9 cleavage positions are labeled. (B) Schematic representation of the CRISPR/Cas9 genome editing on the Csnk1e locus. For Csnk1e, the gRNA sequence was selected to target exon 7. (C) For Csnk1d knockout, NIH3T3 cells carrying a mBmal1 luciferase reporter were transfected with the pX459-Csnk1d construct. After screening, cell populations (named “Total”) and 2 clonal cell lines (Csnk1d-B5 and Csnk1d-D2) that survived the selection were recorded with a luminescence-monitoring apparatus. “Control” represents nonedited NIH3T3/mBmal1::luc cells. (D) For Csnk1e knockout, circadian luminescence rhythms were recorded from the cell populations (“Total”) and a clonal Csnk1e-D5 cell line that survived the selection. (E) The circadian periods were calculated for the Csnk1d knockout cell lines depicted in panel C. Error bars are ±standard deviation (3 or more independent experiments). (F) The circadian periods were calculated for the Csnk1e knockout cell line shown in panel D (3 or more independent experiments). Statistical analysis used an unpaired t test. *p < 0.05, **p < 0.01, n ≥ 3.
NIH3T3/mBmal1::luc Cell Line
The mBmal1promoter reporter pGL3-PmBmal1::luc was constructed by the following procedure. First, the mBmal1 promoter was isolated by polymerase chain reaction (PCR) amplification from NIH3T3 genomic DNA and inserted into the pGL3-basic vector (No. E1751; Promega, Madison, WI). Then, a hygromycin resistance gene cassette (hygroR) was inserted, resulting in the reporter construct pGL3-PmBmal1::luc. Cultured NIH3T3 cells were transfected with pGL3-PmBmal1::luc, followed by hygromycin screening (300 µg/mL). After a population of hygromycin-resistant cells was successfully obtained, clonal cell lines were screened by the limiting dilution method. Luminescence recording assays were performed with the cell line clones to confirm that the mBmal1 reporter was stably transfected into the NIH3T3 cells.
CRISPR/Cas9 Technology to Edit Csnk1d and Csnk1e Genome Loci
Oligonucleotides specific for the target sites of Csnk1d and Csnk1e gene loci were designed using the Optimized CRISPR Design tool (http://crispr.mit.edu/; Ran et al., 2013). The synthesized oligonucleotides were annealed, dephosphorylated, and then ligated into the expression vector pX459 (pSpCas9{BB}-2A-Puro was a gift from Feng Zhang, Addgene plasmid No. 48139) using the BbsI restriction site. NIH3T3/mBmal1::luc cells were seeded into 6-well plates 1 day before transfection at a density of 2 × 10⁵ cells per well. Cells were transfected with the vector constructs pX459 targeting either the Csnk1e or the Csnk1d gene locus using Lipo6000 reagent (No. C0529, Beyotime, Shanghai, China) according to the manufacturer’s instructions. Twenty-four hours after transfection, cells were screened with 1 µg/mL puromycin. Cell line clones were screened by the limiting dilution method.
T7 Endonuclease Assay
The screened cells were determined for gene knockout using T7 endonuclease I (T7E1) enzyme (No. E001, Viewsolid, Beijing, China). A pair of primers was designed to be located about 800-bp upstream and downstream of the genomic sgRNAsite, which was used to amplify by PCR the genomic sequence. A total of 500 ng of PCR product was denatured, reannealed, and digested with T7E1,which cleaves mismatched heteroduplex DNA. The reaction was analyzed by 2% agarose gel electrophoresis.
Construction of Prokaryotic Expression Plasmids
To generate the CKIδ/ε expression plasmid, the open reading frame of human CKIε-WT/TAU with the C-terminal truncation at position 314 (Δ314) was cloned into NdeI and Hind III/Not I sites of pET28a plasmid (No. 69864, Novagen, Madison, WI). Constructs to express other proteins, such as human protein phosphatase 1 (hPP1), mPer2, and full-length CK1 kinases, including CK1δ and CK1ε, were described previously (Qin et al., 2015).
Protein Purification
The mPER2 proteins were purified as described previously (Qin et al., 2015). Briefly, mPER2 GST-fusion proteins were expressed in Escherichia coli strain Rosetta2 cells (No. 71402, Novagen) and purified with glutathione agarose beads (No. 16100, Pierce, Rockford, IL), followed by cleavage of the GST with PreScission Protease (No. 27-0843-01, GE Healthcare, Chicago, IL). The purification procedures of hP53, hPP1, and full-length CK1 proteins were also described previously (Qin et al., 2015).
The concentration of each protein was measured with the Bradford reagent (Bio-Rad Protein Assay). The purity was determined on sodium dodecyl sulfate (SDS)–polyacrylamide gel electrophoresis (PAGE).
Autophosphorylation and Kinase Assays
A total of 2 µM CK1ε-FL (or CK1ε-R178C-FL) was dephosphorylated by 0.01 µM hPP1 1 day before the experiment at 37 °C in a buffer system (50 mM Tris-Cl, 100 mM NaCl, 5 mM DTT, 10 mM MgCl2, pH 8). Then, 1 mM adenosine triphosphate (ATP) was added to initiate the autophosphorylation assay. Samples were collected from the reactions at the time points indicated in each figure.
The kinase activity of either hCK1ε-ΔC or hCK1ε-FL was assessed by mixing 50 nM of the purified CK1 enzymes with 2 µM purified hP53 proteins (other substrates: bovine serum albumin [BSA], α-casein, or mPER2) in kinase reaction buffer (20 mM Tris-Cl, 10 mM MgCl2, 5 mM DTT, pH 8.0). To assess the kinase activity of hCK1ε-ΔC, ultra high-performance liquid chromatography (UPLC) was used to measure the released adenosine diphosphate (ADP), as described in the next section. If autoradiography was used to assess the kinase activity of either the catalytic domain (ΔC) or the full-length (–FL) forms, 0.1 µCi/µL of ATP-γ-32P (No. NEG002A250UC, PerkinElmer, Waltham, MA) was included as described previously (Qin et al., 2015).
UPLC to Measure Adenosine Nucleotides
The kinase reactions were quenched with 3 M perchloric acid and then neutralized with 2 M potassium hydroxide and 0.5 M potassium carbonate to a pH of 5.5 to 6.0. The acidic homogenate was centrifuged briefly and stored at −70 °C overnight to promote precipitation of the perchlorate. Samples were diluted after centrifugation at 12,000 rpm for 25 min (4 °C). A C-18 UPLC column (No. 3520-39991, 5 µm, 4.6 × 150 mm, Daojin, China) was used with these buffers at a rate of 0.5 mL/min: (1) buffer A contained 25 mM KH2PO4, 20 mM triethylamine, pH 5.6, and (2) buffer B was acetonitrile. Both buffers were vacuum filtered with a 0.22-µm filter and degassed using ultrasound.
The elution condition was 98% buffer A and 2% buffer B. Ten microliters of a prepared sample or of a standards sample was autoinjected, and the elution was monitored by ultraviolet absorbance (255-265 nm). Peaks were identified by their retention times and compared with the standards. The concentrations of ATP and ADP in the preparation of the standard curve were 0.5, 1, 2, 4, 8, and 16 µM in ultrapure water.
Circadian Luminescence Recording Assay
A total of 1 × 10⁵ NIH3T3/mBmal1::luc cells were inoculated into 35-mm culture plates (No. 9102, Costar) in triplicate. On the next day, cells in each well were synchronized with a 2-h treatment of 100 nM dexamethasone and recorded in a LumiCycle, as described previously (Yamazaki and Takahashi, 2005). Bioluminescence data were analyzed with the LumiCycle analysis program (Actimetrics, Wilmette, IL) to obtain circadian parameters such as period and amplitude.
Limited Trypsin Digestion Assay
A total of 0.001 µg/µL trypsin was incubated with 0.1 µg/µl hyper- or hypophosphorylated hCK1ε-WT or TAU proteins, and the samples were collected at the indicated time points. Hypophosphorylated hCK1ε was prepared by mixing the purified protein with the protein phosphatase hPP1 at a 200:1 molar ratio for 10 h at 37 °C. Hyperphosphorylated hCK1ε was prepared by incubating 5 mM ATP with the hypophosphorylated protein for 10 h at 37 °C.
Protein Extraction from Cells and Immunoblotting
Cultured cells were homogenized in RIPA buffer (150 mM NaCl, 5% NP-40, 50 mM Tris pH 8.0, 2 mM EDTA, 10% glycerol) supplemented with protease inhibitors (1 mM phenylmethylsulfonyl fluoride and 10 µg/mL leupeptin). The extracts were centrifuged to remove cell debris at 12,000 rpm for 10 min at 4 °C. Samples were heated at 95 °C for 5 min in 5X protein loading buffer, resolved on 10% SDS-PAGE, and transferred to nitrocellulose membrane. The membrane was blocked with 5% skimmed milk in Tris-buffered saline containing 0.05% Tween-20 and incubated with relevant antibodies. Antibodies used were rabbit α-CK1ε (No. D121893, Sangon), rabbit α-CK1δ (No. D222155, Sangon), and cy3-conjugated donkey α-rabbit IgG (No. D110052, Sangon) as the secondary antibody.
CK1ε Structure Prediction
We used a protein structure prediction tool, METATASSER, which was developed by Dr. Skolnick’s research group at the Georgia Institute of Technology. It is freely available for use on the website at http://psifr.cssb.biology.gatech.edu/ (Pandit et al., 2010). The prediction process was carried out online using the instructions on the website.
Results
CRISPR/Cas9 Editing of csnk1d and csnk1e Gene Loci Lengthen the Period to Different Extents
Genetic loss of functions are informative in understanding the functions of genes and their protein products. We applied CRISPR/Cas9 for genome editing of csnk1d and csnk1e loci in NIH3T3/mBmal1::luc reporter cells. The highest score of a 20-nt guide sequence targeting exon 6 of csnk1d gene was selected (Fig. 1A). The target sites precede a 5′-NGG PAM site (TGG in this case), and the Cas9 nuclease would produce a double-strand break at the −3 position (Fig. 1A). Similarly, a guide sequence targeting the csnk1e gene was selected for making the pX459-Csnk1e construct (Fig. 1B). Stably transfected cells with pX459-Csnk1d or pX459-Csnk1e constructs were screened in the presence of puromycin. Three single-colony cell lines, Csnk1d-B5, Csnk1d-D2, and Csnk1e-D5, were isolated from cell populations that survived the puromycin selection. These 3 single-colony lines and the survived cell populations (named as “Total”) were synchronized with dexamethasone, and the luminescence was monitored over several days (Fig. 1C and D). Both the Total population cells and the 2 single-colony cell lines showed lengthened periods of ~2 h (Fig. 1E). These phenotypes are similar to MEFs from CK1δ-knockout mice (Etchegaray et al., 2009), indicating an effective Csnk1d knockout. An equivalent approach applied to the csnk1e gene yielded a single-colony line, Csnk1e-D5, in which the cells exhibited a period ~20 to 30 min longer than nonedited control cells (Fig. 1F).
Interestingly, 2 clear bands were demonstrated in our attempts to amplify the genomic region flanking the Cas9 cleavage site of csnk1d. One band was close to the WT control, while the other band was ~100 bp larger (Suppl. Fig. S1A). To analyze if the PCR-amplified sequences contain different indels from the WT sequence, a T7E1 assay was applied to a series of annealing combinations and confirmed indels (Suppl. Fig. S1B). We could not detect by immunoblotting the CK1δ protein in either of the Csnk1d-B5 or Csnk1d-D2 lines, nor could we detect CK1ε in the Csnk1e-D5 line, confirming the intended knockouts (Suppl. Fig. S1C and D). The 2 PCR-amplified bands were isolated and purified separately, followed by DNA sequencing. Sequencing data showed an interesting result: one allele lacked 8 nucleotides after the Cas9 cleavage site, while the other allele had a 116-nucleotide insertion after that site (Suppl. Fig. S1F and G). Csnk1d-B5 and Csnk1d-D2 cells have the same genome-editing results, implying that the Csnk1d-B5 and Csnk1d-D2 lines originally derived from 1 edited cell with these 2 alleles. Mysteriously, the insertion sequence was from the E. coli genome, after we blasted the sequencing data at NCBI (Suppl. Fig. S1G). Our analysis of predicted open reading frames indicates that changes of both loci produce frame-shift mutations, resulting in early stop codons in CK1δ and CK1ε. But our immunoblotting results did not reveal possible truncated proteins (Suppl. Fig. S1E). We PCR amplified the targeted region from the Csnk1e-D5 genomic DNA, followed by sequencing. The results showed that both alleles in the Csnk1e-D5 cell lines were modified, with one allele losing 285 bp starting from the Cas9 cleavage site and the other allele having 1 nucleotide insertion right at that site (Suppl. Fig. S1I).
CK1δ/ε Autophosphorylation Kinetics at Various Temperatures
Full-length recombinant casein kinase proteins (CK1δ/ε-WT) were expressed and purified by affinity chromatography. After purification, both kinases exhibited smeared bands (Suppl. Fig. S2A), suggesting multiple phosphorylation forms. To confirm that the smeared bands were different phospho forms of CK1 rather than contaminating proteins, we treated the purified proteins with hPP1 overnight, and the slow-mobility bands disappeared (Suppl. Fig. S2A). The addition of fresh ATP to the dephosphorylated CK1 initiated the autokinase reaction. At 37 °C, CK1ε autophosphorylated itself rapidly so that autophosphorylation was complete within 30 to 60 min (Fig. 2A). To clearly observe the kinetics of CK1ε autophosphorylation, the autokinase assay was carried out over a range of temperatures from 4 °C to 37 °C. We observed a temperature-dependent change of the autophosphorylation kinetics (Fig. 2A). The autophosphorylation of purified CK1ε-R178C (the Tau mutant version of CK1ε) was also tested, and its temperature-dependent kinetics demonstrated a slower autokinase activity (Fig. 2B) than did the nonmutant native version of CK1ε (WT, Fig. 2A).
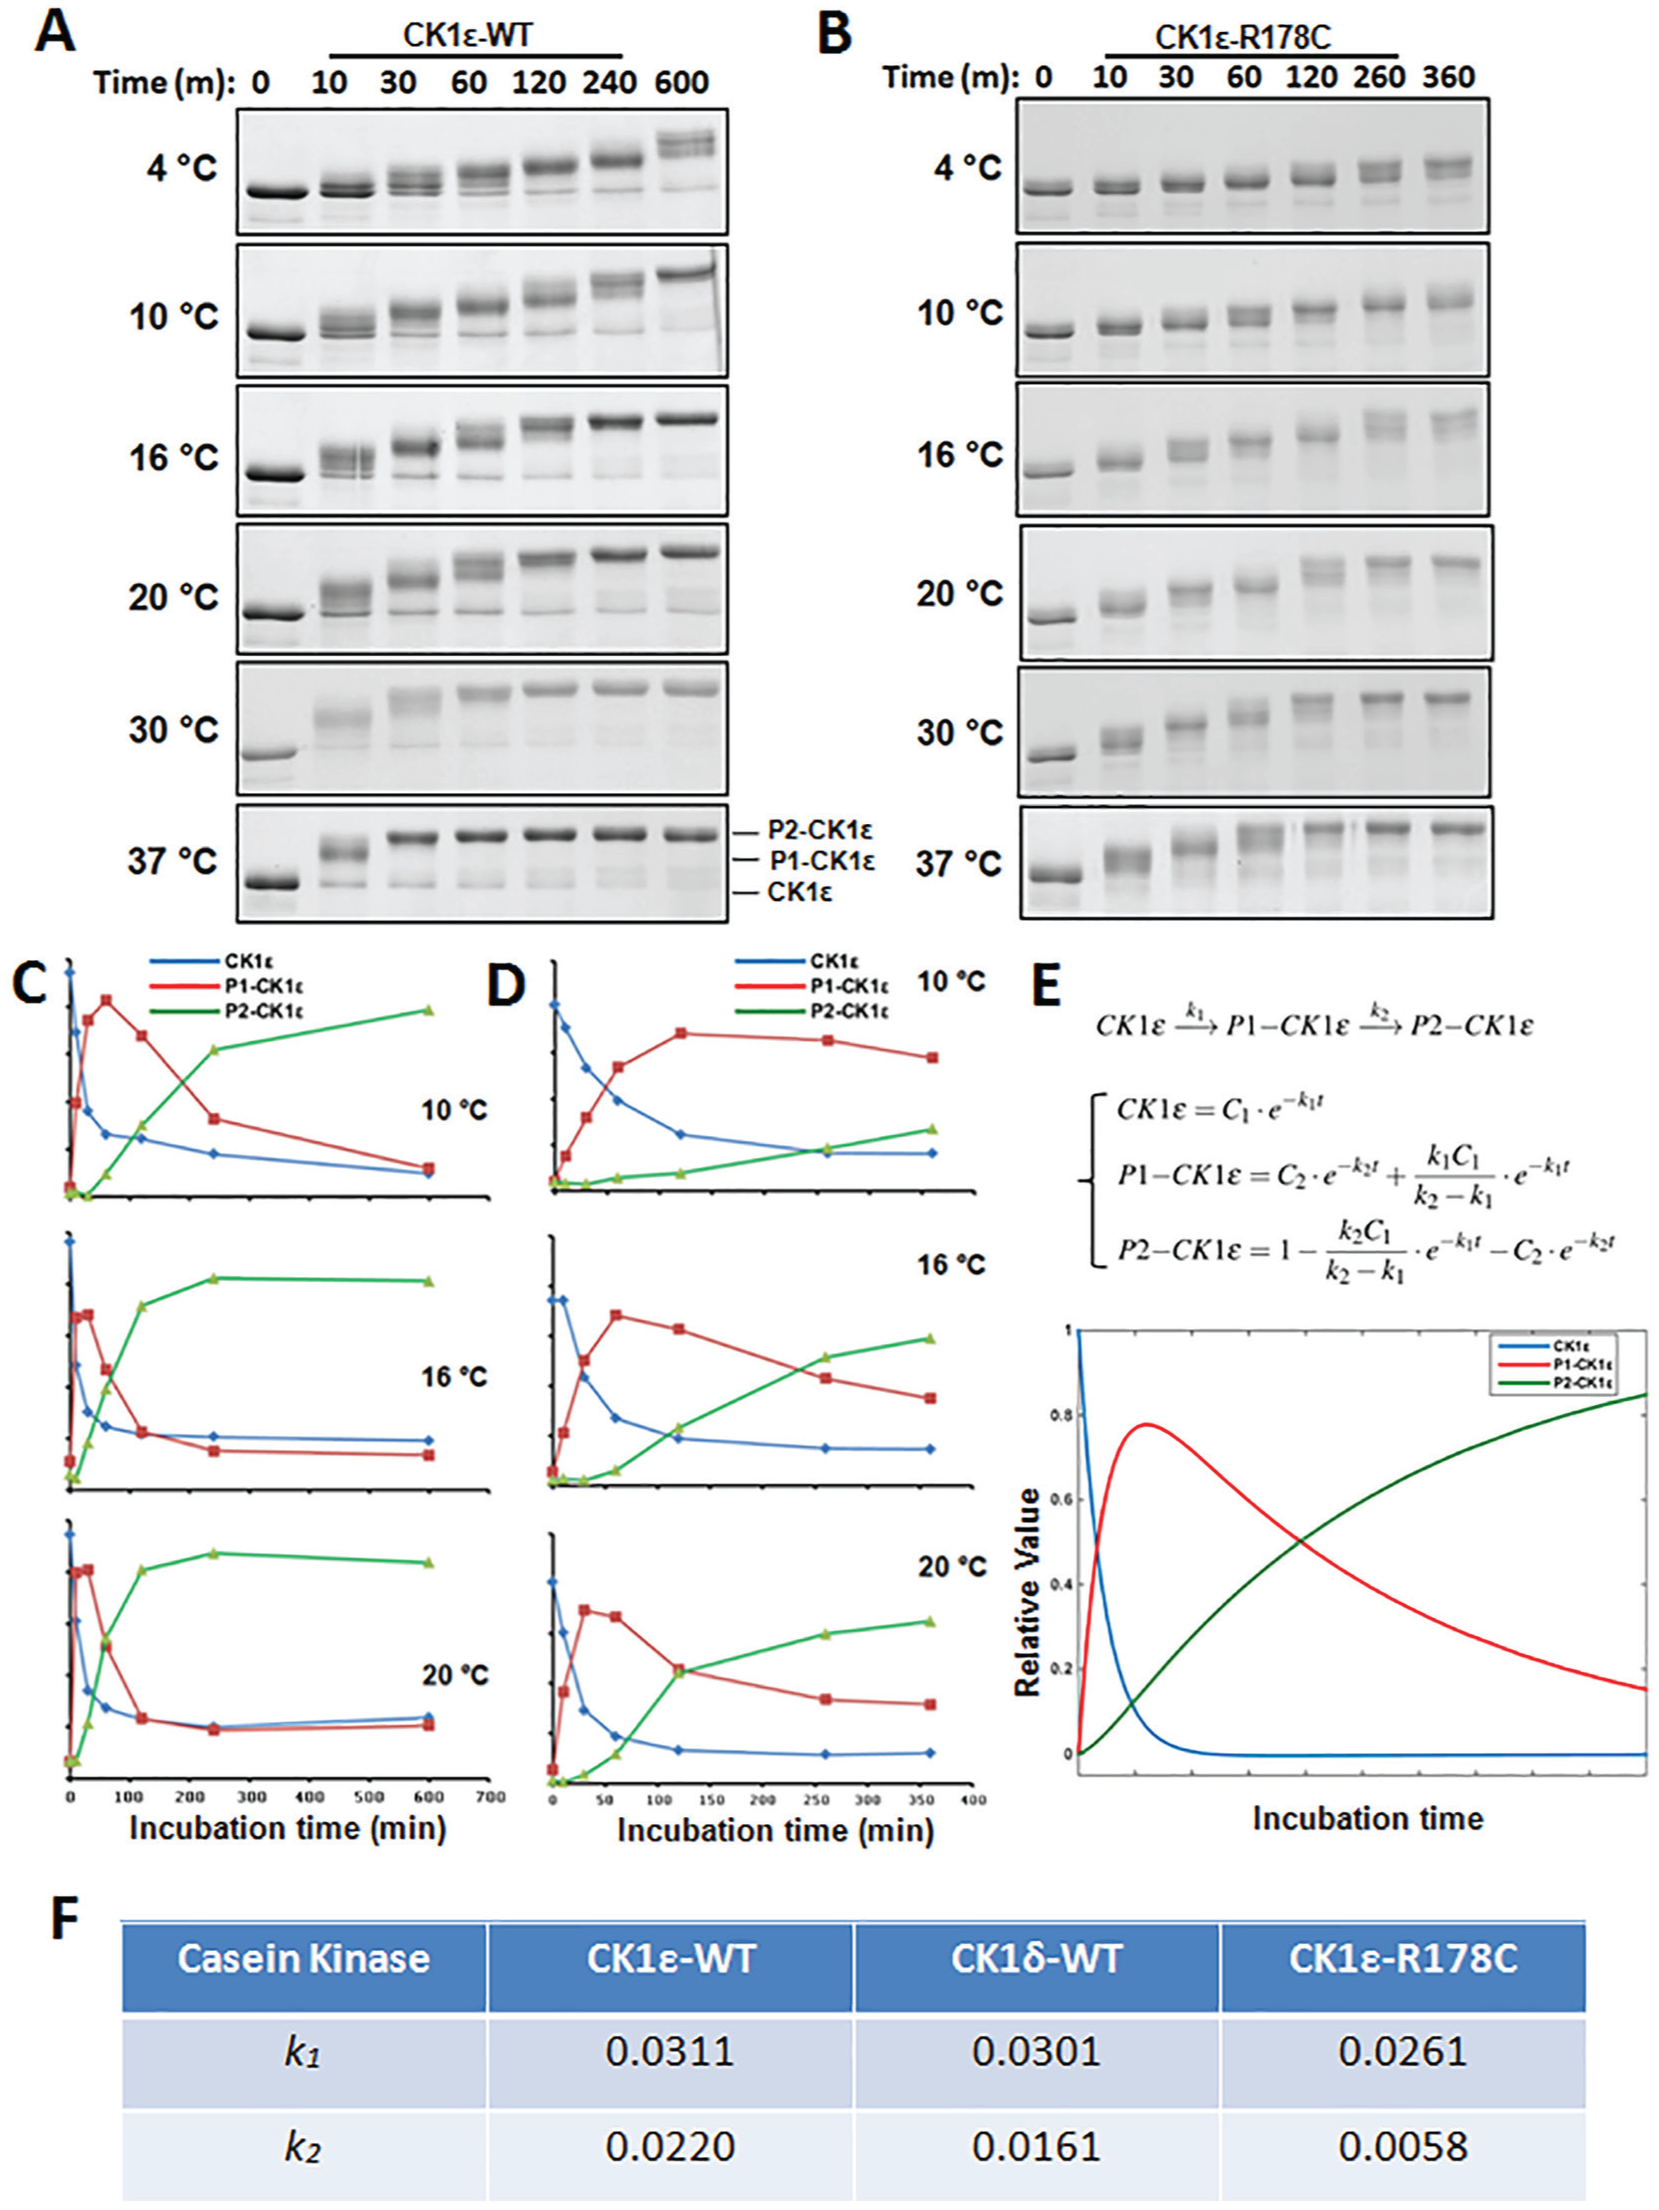
Autophosphorylation of CK1ε kinases is a sequential, temperature-dependent process. (A) The kinetics of CK1ε-WT autophosphorylation under a range of temperatures: 4 °C, 10 °C, 16 °C, 20 °C, 30 °C, and 37 °C. An ordered phosphorylation pattern can be observed as a progressive mobility shift. (B) Slower autophosphorylation kinetics were observed for CK1ε-R178C over the same temperature range. (C) The autophosphorylation process of CK1ε-WT at 10 °C, 16 °C, and 20 °C was quantified as the time dependence of the unphosphorylated form (blue), intermediately phosphorylated P1 form (red), and fully phosphorylated P2 form (green). (D) The autophosphorylation processes of CK1ε-R178C at 10 °C, 16 °C, and 20 °C were quantified as in panel C. Data in panels A to D are representative of 2 or more independent experiments. (E) A simplified 2-step phosphorylation model for the sequential autophosphorylation of CK1ε as described in the text. Each form of CK1ε (1) unphosphorylated, (2) P1-CK1ε, and (3) P2-CK1ε, was calculated by solving the differential equations in the model, and then MATLAB software was used to simulate the relative amount of each form over time. (F) k1 and k2 estimated for these 3 CK1s, indicating that CK1δ-WT has an intermediate autokinase rate.
Thus, both WT and R178C CK1ε showed progressive autophosphorylation (mobility of the proteins got slower during the incubation), indicating sequential autophosphorylation of CK1ε. To provide a quantifiable rate for the autokinase reaction that can be used to compare among CK1δ, CK1ε, and CK1ε-R178C, we simulated the autophosphorylation process with a simple 2-step reaction model: CK1ε → P1-CK1ε → P2-CK1ε (Fig. 2E). CK1ε is phosphorylated with reaction rate k1, and P1-CK1ε is phosphorylated with reaction rate k2. At least 8 in vivo phosphorylation sites have been identified on the CTD domain of CK1ε (Geitzen and Virshup, 1999), so the P1 and P2 states are not determined by single phosphorylation events and therefore the model includes multiple phosphorylation sites that define the P1-CK1ε and P2-CK1ε forms. “P1-CK1ε” stands for the first-reached intermediate phosphorylated state, while “P2-CK1ε” represents completely autophosphorylated CK1ε. Each form was simulated with MATLAB using differential equations (Fig. 2E), and the results of these computational analyses were consistent with the SDS-PAGE data (Fig. 2C, D, and E). Modeling of the CK1ε-R178C data at 10 °C versus 20 °C suggests the phosphorylation reaction rates k1 and k2 are temperature dependent with calculated Q10 values greater than 2 (Fig. 2D; Suppl. Fig. S3). Furthermore, the autophosphorylation of CK1δ was examined, and similar kinetics were observed (Suppl. Fig. S2). The model was used to compare the autokinase rates among the 3 enzymes, and the values show that for both k1 and k2, CK1ε > CK1δ > CK1ε-R178C (Fig. 2F; Suppl. Fig. S2).
Two Distinct Conformations Revealed by Computational Prediction and Trypsin Digestion
As mentioned above, both CK1δ and CK1ε contain an N-terminal catalytic domain and a CTD (Graves and Roach, 1995; Cegielska et al., 1998). Although crystal structures of the N-terminal catalytic domains of CK1δ and CK1ε have been reported (Long et al., 2012a, 2012b), the structures of the full-length CK1δ/ε including the CTDs have not been determined. However, a structure-estimation program (Pandit et al., 2010) applied to CK1ε predicted full-length CK1ε proteins exist in 2 forms. In one form, the CTD domain is unstructured and extended away from the catalytic domain (Fig. 3A), while in the other form, the CTD domain associates closely with the catalytic domain (Fig. 3B). The predicted structures suggest that CK1ε will change its conformation as it is progressively autophosphorylated. The catalytic domain of CK1δ/ε is positively charged and favors negatively charged substrates, such as peptides containing negative amino acids D/E or phosphorylated S/T. We therefore postulate that the compact form of CK1ε (Fig. 3B) corresponds with the structure of P2-CK1ε (Fig. 2). To confirm that unphosphorylated versus fully phosphorylated CK1ε have different 3-dimensional conformations, limited trypsin digestion assays were performed. The results showed that unphosphorylated CK1ε degraded faster than the fully phosphorylated (P2-CK1ε) form, as indicated by the dark black arrows in Figure 3C. Unphosphorylated CK1ε was cleaved within 10 min, while the hyperphosphorylated form was cleaved within 30 min. These results indicate that the autophosphorylation events render P2-CK1ε more resistant to trypsin digestion, providing support that CK1ε undergoes a conformational change to a more compact conformation as the CTD domain gets phosphorylated. This more compact conformation may make the trypsin cleavage sites less available. Moreover, the R178C mutation did not greatly affect the digestion kinetics (Fig. 3D), indicating that even though CK1ε and CK1ε-R178C have different autophosphorylation rates (Fig. 2), they have similar conformations in solution at the same phosphorylation status.
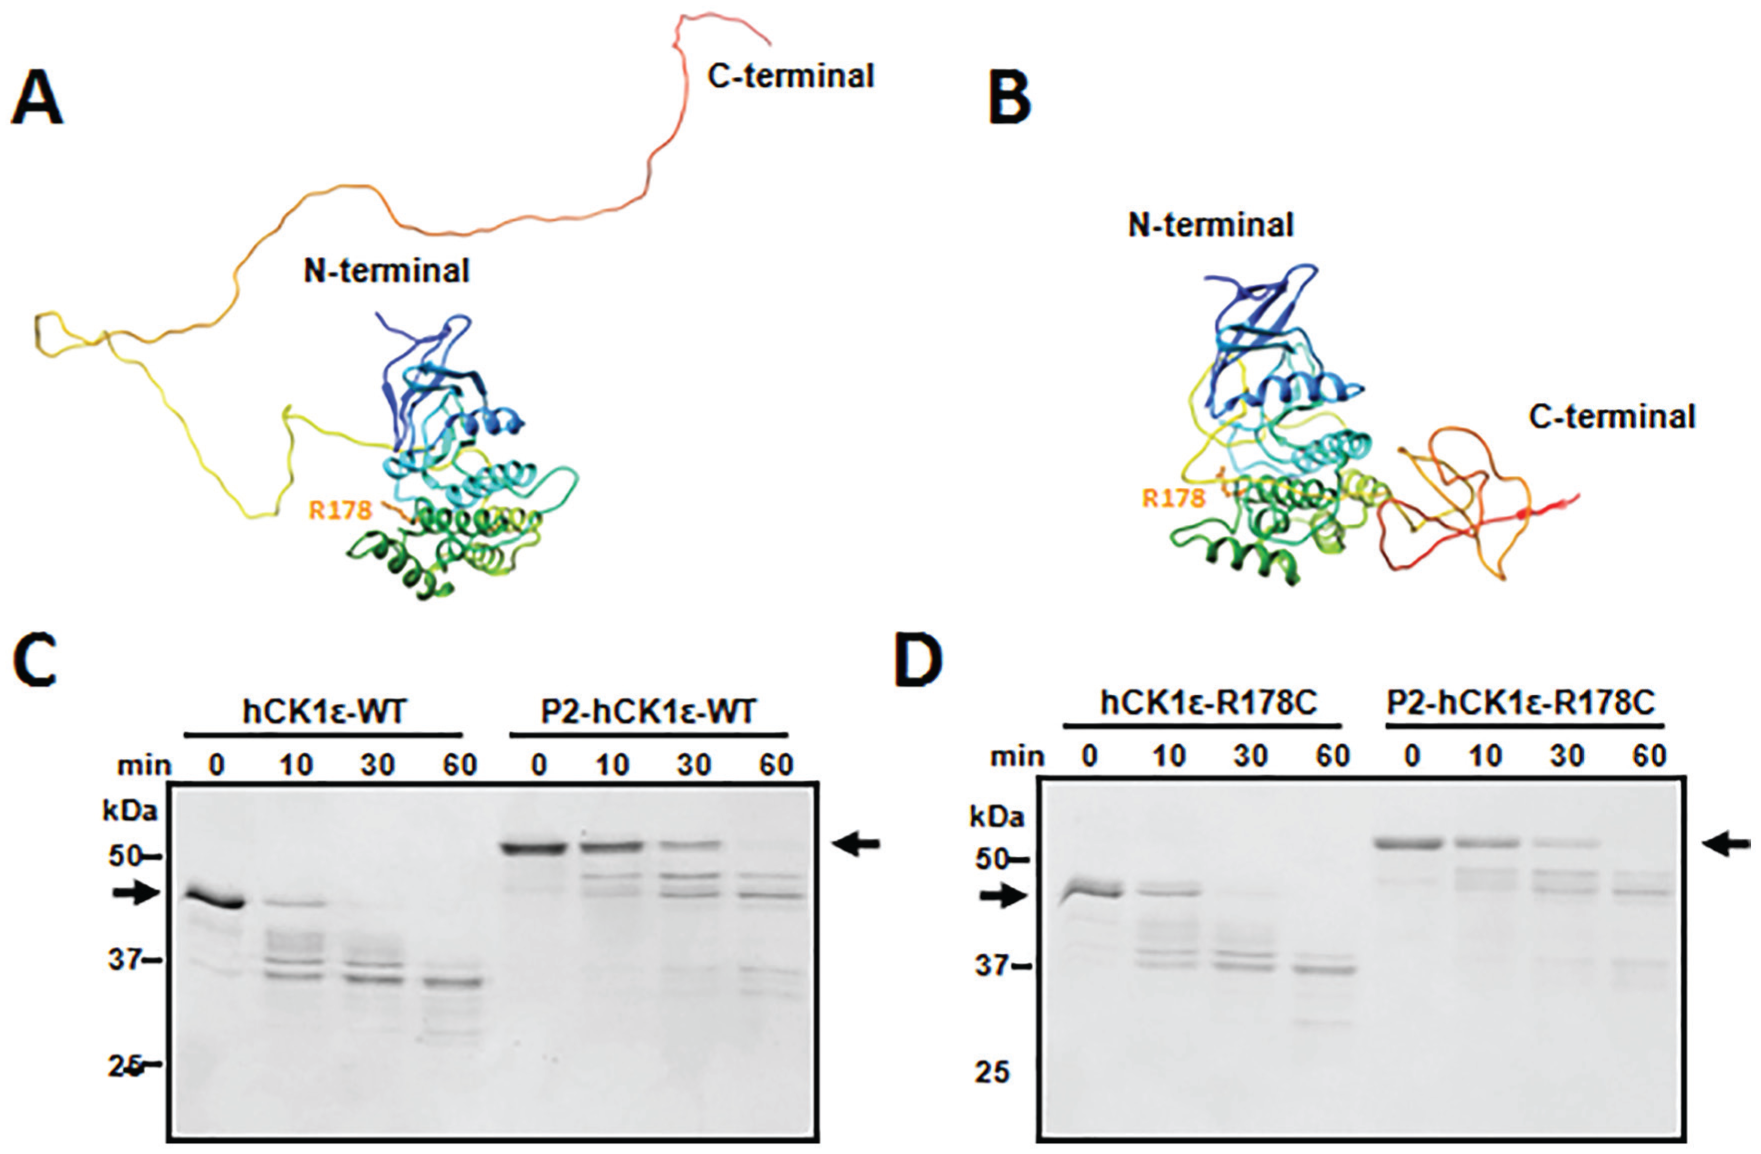
Two distinct conformations of CK1ε revealed by computational prediction and limited trypsin digestion. METATASSER was used to predict 3-dimensional structures of CK1ε de novo. Two forms were extracted. In one form, the C-terminal domain (CTD) domain of CK1ε is unstructured and extends away from the N-terminal catalytic domain (A). In the other form, the CTD domain is structured and present immediately adjacent to the catalytic domain (B). Limited trypsin digestion was applied to the differently phosphorylated forms of CK1ε. (C) Nonphosphorylated native CK1ε was digested faster than hyperphosphorylated native CK1ε. Black arrows indicate the positions of the nonphosphorylated and hyperphosphorylated CK1ε before trypsin digestion. (D) Similar digestion kinetics occur with CK1ε-R178C, indicating that CK1ε-WT and CK1ε-R178C have similar conformations in solution. Data are representative of 2 or more independent experiments.
Circadian Period Changes Correlate with the Autokinase Activity of Casein Kinases
Next, we investigated the kinase activity using a quantitative method to measure ATP conversion to ADP, UPLC. Peaks of ATP and ADP were separated well by their retention times (Suppl. Fig. S4A). A linear relationship existed between the detected peak areas by UPLC and the amount of ATP or ADP that we used as standards (Suppl. Fig. S4B). hP53 was used as the physiological substrate for the catalytic domains of the 3 enzymes lacking the CTD: CK1ε-ΔC, CK1ε-ΔC-R178C, and CK1δ-ΔC. By quantifying the ratio of phosphorylated hP53 protein to total hP53 protein from SDS-PAGE images (Suppl. Fig. S5A and B), we observed that CK1ε-ΔC exhibited the highest phosphorylation rate among these 3 kinases (Suppl. Fig. S5B and C). Measured ADP production during the reaction processes confirmed that CK1ε-ΔC has the highest rate of ATP hydrolysis (synergistically with catalytic activity), while CK1ε-ΔC-R178C has the lowest activity and CK1δ-ΔC is in between (Fig. 4A). The kinetics of the ATP hydrolysis (Fig. 4B) were different from the hP53-phosphorylation kinetics calculated from the SDS-PAGE images (Suppl. Fig. S5C), which might be due (1) to continued phosphate incorporation into proteins at later time points that does not produce further mobility shifts and/or (2) to ongoing ATP hydrolysis by the CTD-deleted CK1s that continues after the substrate is fully phosphorylated. Nevertheless, the order of higher-to-lower rates among the 3 proteins is the same regardless of the method used to measure kinetics.
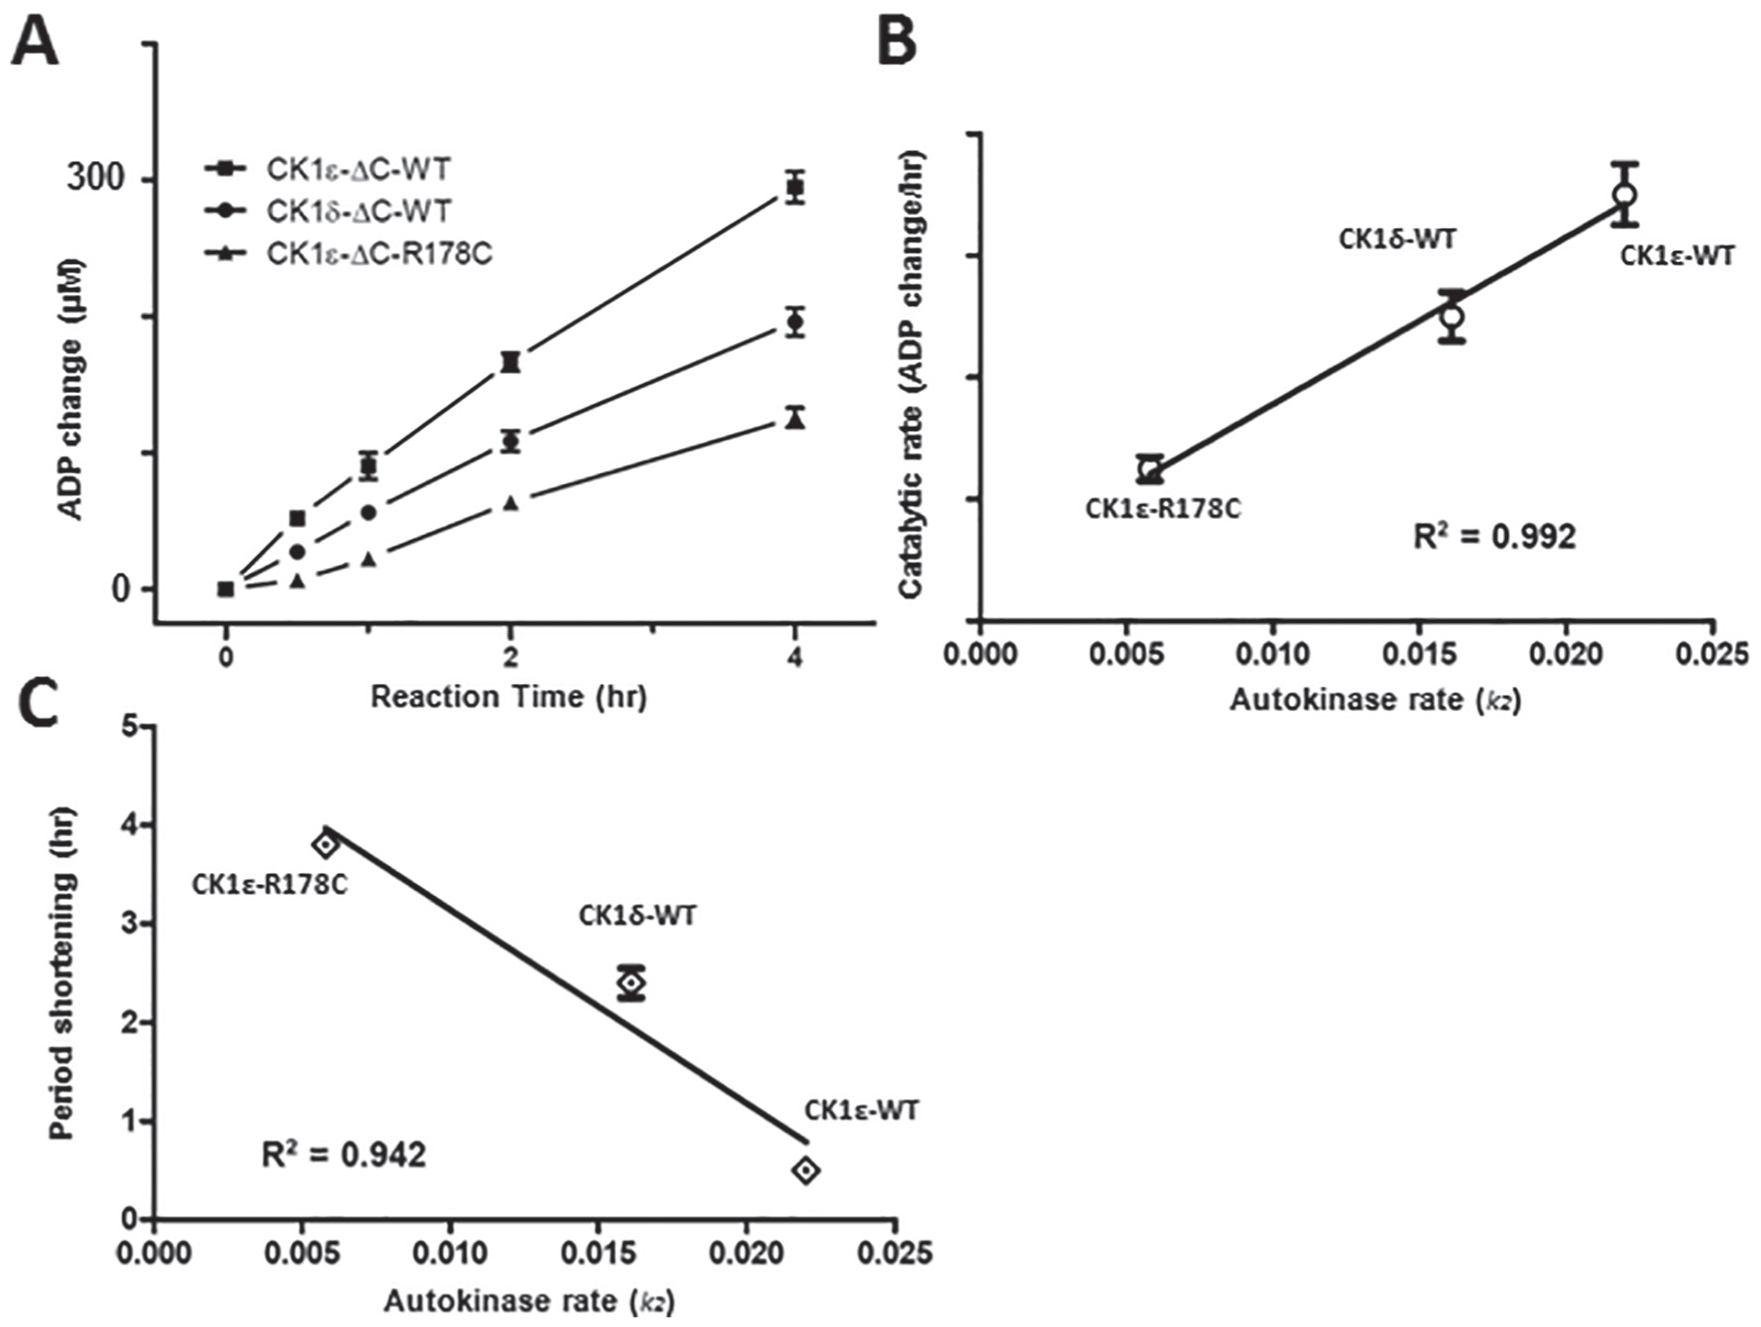
Lowest autophosphorylation rates correlate with the largest circadian period shortening (A) Rate of conversion of adenosine triphosphate to adenosine diphosphate as measured by ultra high-performance liquid chromatography (UPLC) for CK1ε-ΔC (squares), CK1ε-ΔC-R178C (triangles), and CK1δ-ΔC (circles). (B) The catalytic rates of ΔC domains of CK1s derived from the UPLC results correlate with the autokinase rates of full-length CK1s that were derived from Figure 2 and Supplementary Figures S2 and S3. (C) Correlation analysis between the circadian period shortening (see Table 1) and the autokinase activity of the different CK1s (Figures 2 and 4C-D; Suppl. Figs. S2 and S3). Error bars are ±standard deviation (from 3 or more independent experiments).
As shown in Table 1, the circadian period was shortened by ~4.0 h when CK1ε-/- mice were compared with mice carrying the CK1εR178C/R178C alleles (Loudon et al., 2007; Meng et al., 2008). In our cell-based studies, the circadian period was shortened by ~2.2 h and ~0.3 h when CK1δ and CK1ε WT alleles were reinserted into their respective knockout strains. The catalytic rates of different CK1 are equal to their autokinase activity since their CTDs are substrates of these kinases. The calculated catalytic rate of ΔC enzymes (UPLC data, Fig. 4A) is highly correlated with the calculated autokinase rate (Fig. 2F) among the 3 CK1s (Fig. 4B). Combining the data of Table 1 and Figure 4B, we find an obvious correlation between the autokinase rates of the different CK1 kinases and circadian period (Fig. 4C).
Circadian period shortening when knockouts are replaced with different CK1 alleles.
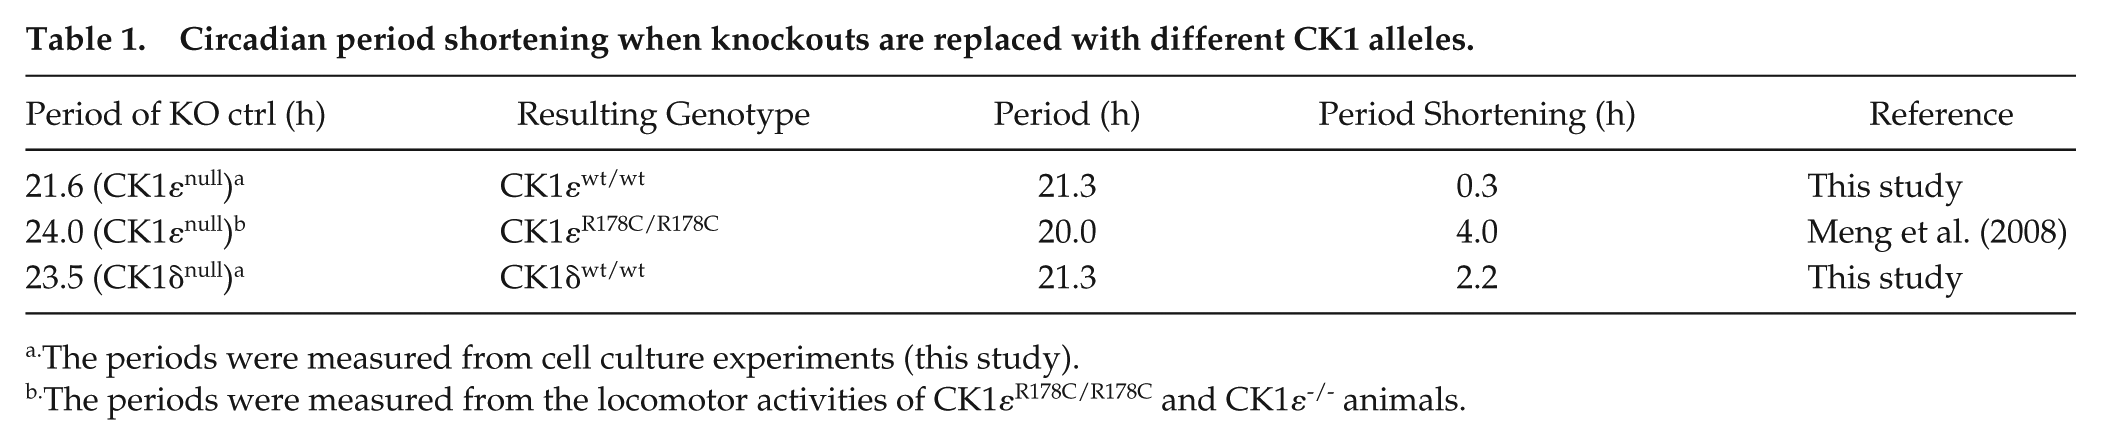
The periods were measured from cell culture experiments (this study).
The periods were measured from the locomotor activities of CK1εR178C/R178C and CK1ε-/- animals.
Opposite Kinase Activity Trends between the Catalytic Domain and the Full-Length Kinase
Conflicting mechanisms have been proposed for the tau mutant CK1ε-R178C: reduced activity versus gain of function (Lowrey et al., 2000; Gallego et al., 2006). The different sequential phosphorylation kinetics of the CTD between CK1ε-WT and CK1ε-R178C suggests that their activity rates might alter as they progressively autophosphorylate (Fig. 2A and B). Since CK1ε-R178C autophosphorylates its CTD slower than does native CK1ε (CK1ε-WT), it therefore autoinhibits itself more slowly. Consequently, we predict that CK1ε-R178C should exhibit enhanced kinase activity on physiologically relevant substrate proteins. To test that prediction, catalytic ΔC domains and full-length versions of CK1ε and CK1ε-R178C were tested with BSA, α-casein, and hP53 as substrates. Compared with native CK1ε-ΔC, CK1ε-R178C-ΔC showed reduced kinase activity on all 3 substrates (Fig. 5A-C). Quantification and normalization of these data confirmed that the extent of phosphorylation on these substrates was less for CK1ε-R178C-δC than for CK1ε-WT-ΔC (Suppl. Fig. S6A). When the full-length proteins were used, we observed that the R178C mutation enhances the kinase activity on physiological substrates (Fig. 5; Suppl. Fig. S6B). In particular, with the physiologically relevant substrate hP53, CK1ε-R178C phosphorylates hP53 more strongly than does native CK1ε (CK1ε-WT) at the same time that CK1ε-R178C autophosphorylates itself more slowly than does CK1ε-WT (Fig. 5F; Suppl. Fig. S6B). (CK1ε-WT is completely hyperphosphorylated within 30 min in the presence of hP53, while CK1ε-R178C barely reaches the hyperphosphorylated status at 60 min; Fig. 5F.) In the presence of its substrate, the autophosphorylation data of CK1ε depicted in Figure 5F are consistent with the results shown in Figure 2 when these kinases were incubated by themselves. On the other hand, with the nonphysiological substrates BSA and α-casein, the phosphorylation level catalyzed by CK1ε-R178C was lower than that catalyzed by the CK1ε-WT control (Fig. 5D and E). Taken together, the R178C mutation in full-length CK1ε enhances kinase activity on its physiological substrate, which supports the hypothesis that the R178C mutation reduces autoinhibition, thereby enhancing catalytic phosphorylation of physiologically relevant substrates.
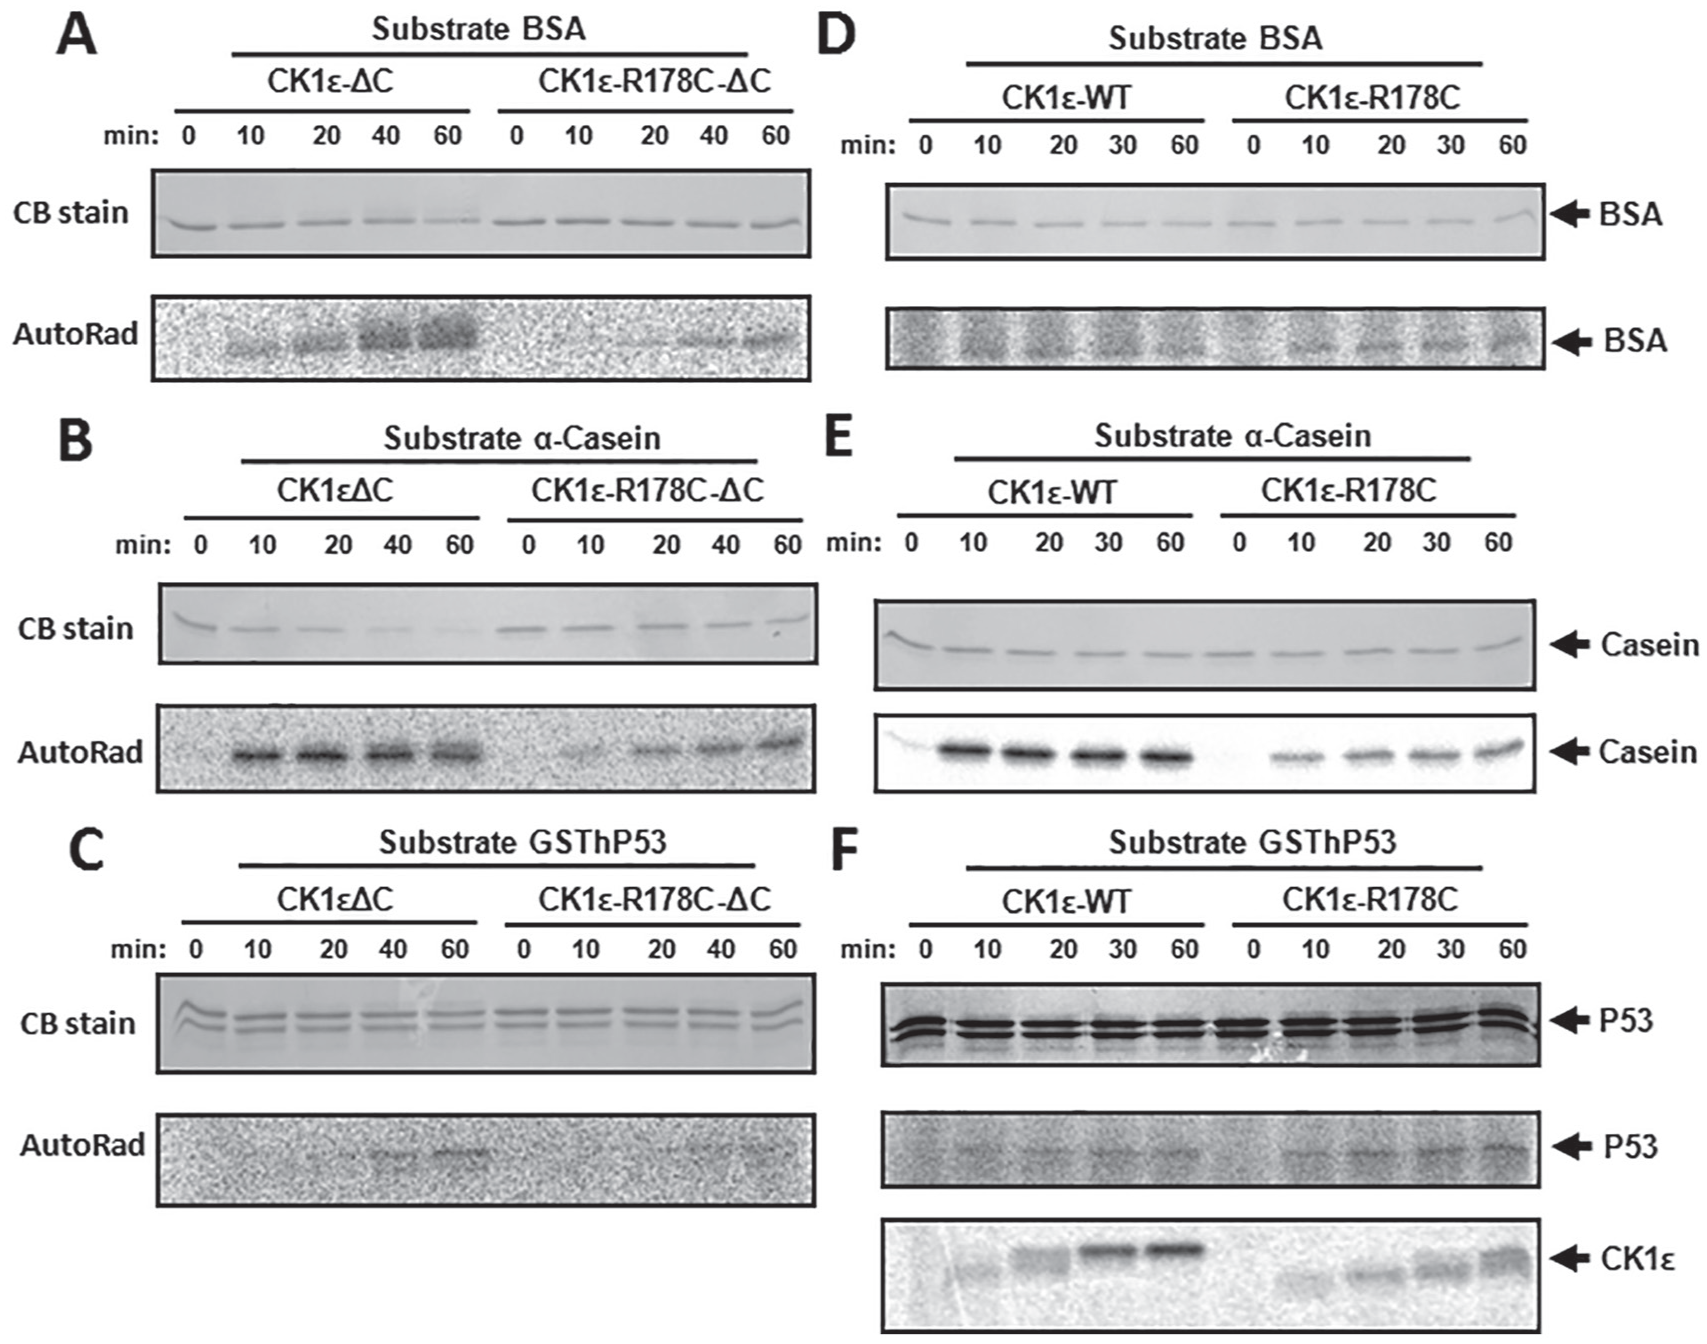
In vitro kinase assay comparing CK1ε-ΔC versus R178C-ΔC and CK1ε-WT versus CK1ε-R178C. Radioactive in vitro kinase assay was performed to assess the change caused by the R178C mutation of CK1ε on different substrates. Compared with native CK1ε-ΔC, the R178C mutation reduced catalytic activity toward bovine serum albumin (BSA; A), α-casein (B), and hP53 (C). To compare with the activity of the catalytic domains (ΔC) illustrated in panels A to C, full-length CK1ε and CK1ε-R178C kinases were applied to the same substrates with the in vitro radioactive kinase assay in panels D to E: (D) BSA, (E) α-casein, and (F) hP53. “CB stain” indicates the Coomassie Blue staining to assess the abundance of the proteins in the sodium dodecyl sulfate–polyacrylamide gel electrophoresis gels (left side). The phosphorylation of each substrate is indicated by P-32 incorporation (“AutoRad,” left side). Arrows point out each substrate (right side). The bottom of panel F adds an autophosphorylation time course of full-length CK1ε and CK1ε-R178C; note that native CK1ε-WT autophosphorylates itself faster than does CK1ε-R178C.
Lower Temperature Accelerates the Clock
Since we found that lower rates of the autokinase activity (Fig. 2F) and catalytic domains (Fig. 4A) correlate with a higher activity for the full-length kinase on the physiological substrate hP53 (Fig. 5), we sought another way to manipulate the activity of the catalytic center. When we decreased the temperature, a lower kinase activity of the catalytic domain (ΔC) was observed as expected (Suppl. Fig. S7A-C). We reasoned that for the full-length kinase, lowering the temperature would reduce the autophosphorylation of the inhibitory CTD domain, therefore slowing the rate of autoinhibition and allowing a higher rate of phosphorylation of a physiological substrate. We tested this prediction with full-length CK1ε. When full-length CK1ε was mixed with its physiological clock substrate mPER2 in the presence of radioactive γ-P32-ATP, the autophosphorylation rate of CK1ε itself was slower at the lower temperature of 25 °C (Suppl. Fig. S7D). In contrast, the phosphorylation of mPER2 was faster at 25 °C (Suppl. Fig. S7E), which supports the prediction that full-length CK1ε exhibits a higher kinase activity at lower temperature due to less autoinhibition. In addition, we executed a luminescence reporter assay with our NIH3T3/mBmal1::luc cells under 2 different physiological temperatures, 32 °C and 37 °C. The pace of the clock was significantly accelerated at the lower temperature with a much shorter period: 19.7 ± 0.43 h at 32 °C versus 21.3 ± 0.36 h at 37 °C (Fig. 6A), consistent with the inference that the overall apparent kinase activity may govern the speed of the clock.
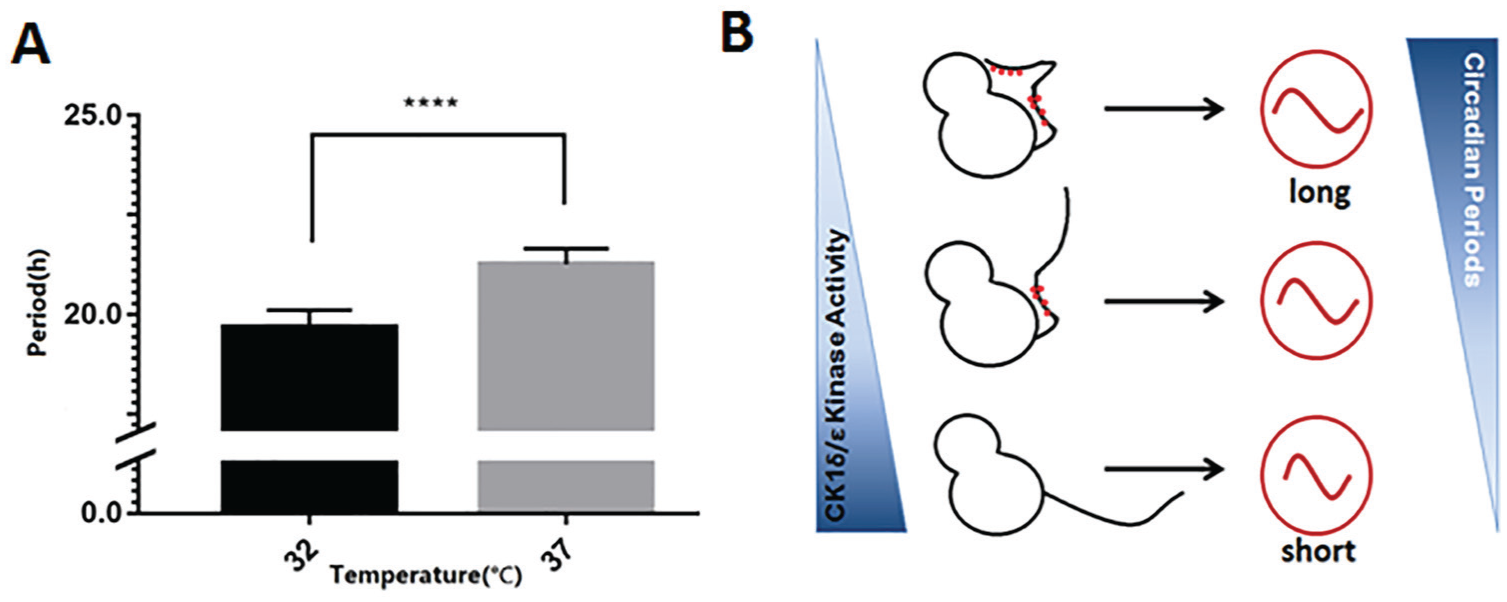
Lower temperature in the physiological range accelerates the clock. (A) Comparing 2 different temperatures, the circadian clock of NIH3T3/mBmal1::luc cells oscillated faster at the lower temperature, whereas native CK1ε exhibits a higher kinase activity on the clock substrate PER2 at lower temperature (Suppl. Fig. S6). At 32 °C, the period is 19.7 ± 0.43 h, while at 37 °C, the period is 21.3 ± 0.36 h. Error bars are ± standard deviation (n ≥ 6 independent repeats). Statistical analysis used an unpaired t test. ****p < 0.0001. (B) A schematic model illustrates the relationships among (1) the kinase activities of CK1δ/ε, (2) the structure and autophosphorylation of CK1δ/ε, and (3) the period of mammalian circadian rhythms. On physiological substrates, the activities of full-length CK1δ/ε kinases are inverted relative to their catalytic domain activities by the regulating influence of the autophosphorylation of their CTD domains.
Discussion
Most previous studies of the circadian properties of the key kinases CK1ε and CK1δ have focused on the properties of the catalytic (ΔC) domains and ignored the significance of the autoinhibition by autophosphorylation. We found that the kinetics of CK1ε autophosphorylation revealed a sequential process; the catalytic domain first autophosphorylates the CTD domain at initial sites, which leads to an ordered phosphorylation of later Ser/Thr sites. In our simplified model, the activity of each form of CK1ε (CK1ε, P1-CK1ε, and P2-CK1ε) can be simulated by differential equations (Fig. 2E). The fitted data indicate that the autophosphorylation rates are temperature dependent. The autokinase reaction rate for the mutant CK1ε-R178C is much slower than that of native CK1ε-WT, because the mutation site at residue 178 is in the crucial R178-G215-K224 triad that is predicted to recognize the substrate (Lowrey et al., 2000). When this key Arg178 residue is replaced with cysteine, the affinity between the catalytic domain and the CTD domain is likely to decrease, leading to a lower autokinase rate. We further showed that the autophosphorylation rate for CK1δ is intermediate between those of CK1ε and CK1ε-R178C (Suppl. Figs. S2 and S3).
We predicted that the rates of the 3 catalytic domains (ΔC versions) would exhibit the same trend pattern as their autophosphorylation rates. Indeed, when we measured the rate of phosphorylation of the substrate hP53 for CK1ε-ΔC, CK1ε-R178C-ΔC, and CK1δ-ΔC using UPLC, the results supported the prediction (Fig. 4). Substrate phosphorylation of both BSA and hP53 also exhibited a higher catalytic activity by CK1ε-ΔC than by CK1δ-ΔC (Fig. 5; Suppl. Fig. S6). Measurements of the overall activity of full-length CK1ε using a radioactive in vitro assay supports the model prediction that reduction of autoinhibition by the R178C mutation enhances the rate of phosphorylation of physiological substrates (Fig. 5; Suppl. Fig. S6B).
We were unsuccessful to introduce the CK1ε-R178C mutation in our reporter cell lines by CRISPR, and therefore our comparisons in Figure 4B and C include data from animal studies. Table 1 summarizes CK1-null animal studies and cell-based analyses (including our data) to show a ~2-h longer period in CK1δ-/- animals/cells and ~20- to 30-min longer periods in CK1ε-/- animals/cells, while Tau mutant mice exhibited ~4-h shorter periods for homozygous animals than that of CK1ε-/- animals (Loudon et al., 2007; Meng et al., 2008). Even though the actual period value of the CK1ε-/- genotype is different between animals and cell cultures, there is a comparable trend in the period change between animals and cell cultures upon reintroduction of CK1 alleles. In particular, when these data are compared in terms of the period shortening caused by the reintroduction of the WT or mutant allele to the relevant null, there is a clear correlation between the period change and the autophosphorylation rates of the 3 kinases: the lowest autokinase rate (CK1ε-R178C) corresponds with the largest degree of period shortening (Table 1; Fig. 4C). Thus, we propose a model in which the higher initial catalytic activity of CK1ε would autophosphorylate its inhibitory CTD domain faster, thereby retarding substrate phosphorylation more effectively, with the final result of a slower circadian clock. On the other hand, CK1ε-R178C with the lowest autophosphorylation rate would suppress its substrate phosphorylation less rapidly; the resulting enhanced/accelerated rate of substrate phosphorylation generates a faster circadian clock (Fig. 6B). Our in vitro biochemical studies support that the autoinhibition of the CTD domain could modulate the overall kinase activities of CK1s. This is in line with recent studies which have demonstrated that different lengths of the CTD of CK1δ vs. CK1ε differentially affect the circadian period through phosphorylating the PER2 proteins (Fustin et al. 2018; Narasimamurthy 2018).
Manipulating the catalytic activity in another way would further support our model. Although lowering the temperature would be expected to reduce the kinase activity toward substrates (and this was indeed true for CK1ε-ΔC; Suppl. Fig. S7A-C), we found that PER2 was phosphorylated to a stronger extent by full-length CK1ε at lower physiological temperature (Suppl. Fig. S7). This apparently counterintuitive result is consistent with our hypothesis, namely, that the cooler temperature slowed autoinhibition of substrate phosphorylation in full-length CK1ε but that this temperature-compensating reaction is defective in CK1ε-ΔC. This is a very interesting observation in the context of the canonical property of circadian rhythms, temperature compensation of period, which is present even in isolated cells of endothermic mammals (e.g., Rat-1/Pper1-luc cells, NIH3T3 cells, skin fibroblast cells, and Rat-1/Pbmal1-luc cells; Izumo et al., 2003; Tsuchiya et al., 2003; Dibner et al., 2009; Yeom et al., 2010).
Many small molecules have been developed to modulate the activity of CK1ε and CK1δ, such as CKI-7, PF670462, andPF4800567 (Yang et al., 2017). However, these inhibitors mainly lengthen the circadian period. In general, people with a longer period go to sleep and wake up later and are thus often considered “owls.” If drugs can be developed that manipulate the period in either an accelerating or decelerating direction, people could adjust their clocks optimally to their environment. For example, such pharmacological agents could be applied as a treatment of DSPS. The model we discuss in this article may suggest a novel pathway, to develop molecules that interfere with the interface between the catalytic domain and the CTD domain, thereby suppressing the autoinhibition. In this way, the overall activity of CK1 can be enhanced on substrates such as PER1/2 so that the mammalian clock may run faster, consequently correcting the DSPS phenotype.
Supplemental Material
Guo_et_al._Supplementary_Figures – Supplemental material for Autokinase Activity of Casein Kinase 1 δ/ε Governs the Period of Mammalian Circadian Rhythms
Supplemental material, Guo_et_al._Supplementary_Figures for Autokinase Activity of Casein Kinase 1 δ/ε Governs the Period of Mammalian Circadian Rhythms by Gaili Guo, Kankan Wang, Shan-Shan Hu, Tian Tian, Peng Liu, Tetsuya Mori, Peng Chen, Carl Hirschie Johnson and Ximing Qin in Journal of Biological Rhythms
Footnotes
Acknowledgements
We would like to thank Dr. Masaaki Ikeda for providing us with the original mouse Bmal1 reporter construct Bp/527-dluc. This work was financially supported by grants from the National Natural Science Foundation of China (31571208 and 31771302 to X.Q.), the Anhui Provincial Natural Science Foundation (1608085MH212 to X.Q.), and the U.S. National Institutes of Health (NIH/NIGMS grant GM 067152 to C.H.J.). Ximing Qin acknowledges the start-up fund provided by Anhui University. We are also grateful to the staff for providing technical support with using the facility of the Institute of Physical Science and Information Technology.
Author Contributions
X.Q. and C.H.J. conceived and designed the research; G.G., K.W., T.T., P.L., and T.M. performed the research; X.Q., P.C., and S.-S.H. simulated the 2 -step reaction model; all authors were involved in analyzing data; C.H.J. and X.Q. wrote the paper.
Conflict of Interest Statement
The authors have no potential conflicts of interest with respect to the research, authorship, and/or publication of this article.
Notes
References
Supplementary Material
Please find the following supplemental material available below.
For Open Access articles published under a Creative Commons License, all supplemental material carries the same license as the article it is associated with.
For non-Open Access articles published, all supplemental material carries a non-exclusive license, and permission requests for re-use of supplemental material or any part of supplemental material shall be sent directly to the copyright owner as specified in the copyright notice associated with the article.