
Abstract
The present study examines whether the daily rhythm of distal skin temperature (DST) is associated with brown adipose tissue (BAT) metabolism as determined by 18F-fluorodeoxyglucose (18F-FDG) uptake in young adults. Using a wireless thermometer (iButton) worn on the nondominant wrist, DST was measured in 77 subjects (26% male; age 22 ± 2 years; body mass index 25.2 ± 4.8 kg/m2) for 7 consecutive days. The temperatures to which they were habitually exposed over the day were also recorded. The interday stability of DST was calculated from the collected data, along with the intraday variability and relative amplitude; the mean temperature of the 5 and 10 consecutive hours with the maximum and minimum DST values, respectively; and when these hours occurred. Following exposure to cold, BAT volume and mean and peak standardized 18F-FDG uptake (SUVmean and SUVpeak) were determined for each subject via static 18F-FDG positron emission tomography/computed tomography scanning. Relative amplitude and the time at which the 10 consecutive hours of minimum DST values occurred were positively associated with BAT volume, SUVmean, and SUVpeak (p ≤ 0.02), whereas the mean DST of that period was inversely associated with the latter BAT variables (p ≤ 0.01). The interday stability and intraday variability of the DST were also associated (directly and inversely, respectively) with BAT SUVpeak (p ≤ 0.02 for both). All of these associations disappeared, however, when the analyses were adjusted for the ambient temperature to which the subjects were habitually exposed. Thus, the relationship between the daily rhythm of DST and BAT activity estimated by 18F-FDG uptake is masked by environmental and likely behavioral factors. Of note is that those participants exposed to the lowest ambient temperature showed 3 to 5 times more BAT volume and activity compared with subjects who were exposed to a warmer ambient temperature.
Keywords
Almost all living things have a circadian time-keeping system (Czeisler et al., 1999). The circadian system consists of a network of hierarchically organized structures that regulate the body’s temporal organization in relation to its environment (Froy, 2010; Garaulet et al., 2010a; Garaulet et al., 2010b; Hastings et al., 2003). From an evolutionary perspective, this biological clock has allowed organisms to adapt their metabolic processes and their behavior to cyclic environmental change (Garaulet et al., 2010b; Hansen et al., 2017; Terzibasi-Tozzini et al., 2017). In humans, current social habits commonly disrupt this system (chronodisruption), leading to metabolic problems such as obesity, dyslipidemia, or impaired glucose tolerance, perhaps even shortening our life span (Froy, 2010; Garaulet et al., 2010b; Garaulet et al., 2010a; Hastings et al., 2003). Certainly, the correct functioning of the circadian system seems necessary for properly and temporally adjusted behavioral and physiological functions and vice versa.
Brown adipose tissue (BAT) is a specialized thermogenic organ, mainly activated during exposure to cold. It produces heat via the action of uncoupling protein 1 (UCP1; Cannon and Nedergaard, 2004; Peirce and Vidal-Puig, 2013; Schilperoort et al., 2016). Given its energy-burning capacity, its endocrine function (Villarroya et al., 2017), and its contribution to metabolic homeostasis through the uptake of energy substrates, BAT is seen as a potential therapeutic target in the fight against obesity and diabetes (Bartelt et al., 2011; Blondin et al., 2017; Cannon and Nedergaard, 2004; Ruiz et al., 2018; Villarroya and Vidal-Puig, 2013). Consequently, much effort is being invested in understanding how human BAT function is physiologically regulated and how to safely exploit its functions.
Interestingly, in mice it has been shown that the formation and metabolic function of BAT are under circadian clock regulation (Gerhart-Hines et al., 2013; Hansen et al., 2017; Nam et al., 2016). The BAT transcriptome is robustly rhythmic (Zhang et al., 2014; Zvonic et al., 2006), with nearly 8% of the tissue’s expressed genes showing circadian rhythmicity. Accordingly, it has been shown that a number of key nuclear receptors involved in circadian rhythmicity, such as Rev-erb alpha and PER2, play essential roles in the modulation of murine UCP1 expression and BAT thermogenesis (Chappuis et al., 2013; Gerhart-Hines et al., 2013). In addition, experiments in rodents have shown that BAT receives inputs from different hypothalamic nuclei, shaping the rhythms of systemic glucose and lipids as well as those of body temperature and energy expenditure (Hansen et al., 2017; Orozco-Solis et al., 2016; Tan and Knight, 2018; van den Berg et al., 2018; van der Veen et al., 2012). Although there is growing evidence that the circadian rhythms of body temperature and metabolism are intimately related to a proper BAT function in rodents (Kooijman et al., 2015), evidence in humans is scarce. Lee et al. (Lee et al., 2016) recently suggested that glucose utilization by human BAT is coupled to heat production in a circadian manner. Whether BAT function is associated with the appropriate functioning of the circadian system, however, remains to be seen.
Several marker rhythms have been proposed as a means of assessing circadian system functioning. These marker rhythms, driven by the suprachiasmatic nucleus (SCN; the major pacemaker), allow the timing of internal biological processes to be followed. Marker rhythms need to be easy to measure in a noninvasive manner, be reliable, have a large amplitude, and have a specific phase relationship with the SCN (Terzibasi-Tozzini et al., 2017). Salivary melatonin or cortisol, the rest-activity pattern, and core temperature are among the most commonly used (Terzibasi-Tozzini et al., 2017). Distal skin temperature (DST) also provides a marker rhythm. This is supported by the fact (among others) that an increase in DST coincides with the onset of the release of dim-light melatonin (Bonmati-Carrion et al., 2014) and that it may lead to vasodilation (inducing heat loss) and an eventual fall in core body temperature that helps initiate sleep (Kräuchi and Wirz-Justice, 2001). In addition, the DST can be easily and comfortably recorded for long periods, is driven by the circadian clock via the autonomous nervous system, and its rhythm persists under demasking analytical conditions (Martinez-Nicolas et al., 2013).
The aim of the present work was to examine whether the daily rhythm of the DST, used as an indicator of the appropriate functioning of the circadian system, is associated with BAT volume and activity as determined by 18F-fluorodeoxyglucose (18F-FDG) uptake in young, healthy adults. The relationship between the DST rhythm and skeletal muscle 18F-FDG uptake was also examined, as was that between disruptions of the DST daily rhythm (more flattened, fragmented, less stable) and obesity and cardiometabolic risk.
Materials and Methods
The present cross-sectional study was performed within the framework of the ACTIBATE study (Sanchez-Delgado et al., 2015; (in ClinicalTrials.gov, ID: NCT02365129). The study subjects were 82 young healthy (27% male) adults (see enrollment flow chart in Suppl. Fig. S1). All were recruited via advertisements in electronic media and via leaflets. The inclusion criteria required subjects to be 18 to 25 years old, to be sedentary (self-reported <20 min of moderate-vigorous physical activity on <3 days/week), not to smoke or take any medication that might affect their cardiovascular or thermoregulatory responses to cold exposure, to have had a stable body weight over the past 3 months (changes <3 kg), to have no cardiometabolic disease (e.g., hypertension, diabetes, etc.), and to have no history of cancer among first-degree relatives.
Assessments were performed at our installations in Granada (southern Spain) between October and November 2016, in 4 waves involving approximately 20 subjects per wave (Suppl. Table S1). The study was approved by the Human Research Ethics Committee of the University of Granada (No. 924) and the Servicio Andaluz de Salud, and it was performed in accordance with the Declaration of Helsinki (revision of 2013). All subjects provided written, informed consent to be included.
Distal Skin Temperature
DST was measured using an iButton DS-1922 L Thermochron wireless temperature sensor (resolution 0.0625 °C; Maxim, Dallas, TX); subjects wore the sensor continuously for 7 consecutive days (Martinez-Tellez et al., 2019). The sampling frequency was set at 10 min. The sensor was placed on the ventral area of the nondominant wrist (over the radial artery) and secured with a wristband. Subjects were instructed to remove it only when bathing. Nonwear time periods for each day were recorded in a diary. Recordings were programmed to begin at 0600 h and to finish 7 days later at 0000 h (the morning when the 18F-FDG–positron emission tomography [PET]/computed tomography [CT] scan was performed; see below).
DST Processing
All of the nonwear time periods were excluded from analysis. Atypical data were also eliminated by suppressing the time points for which the rate of change with respect to the previous value was higher than the interquartile distance between quartiles 1 and 3 (percentiles 25 and 75, respectively; van Marken Lichtenbelt et al., 2006). Those subjects with fewer than 4 valid days (<75% of the data registered in 24 h) of data were excluded from the analyses. All sensors were programmed, and their data analyzed, using Temperatus software (http://profith.ugr.es/temperatus?lang=en) (Martinez-Tellez, Quesada-Aranda et al., 2019).
The interday stability (IS) of the DST readings (i.e., the constancy of the 24-h rhythmic pattern over the 7 days of data collection), the intraday variability (IV; i.e., the fragmentation of the rhythm), and the relative amplitude (RA) were then determined, as described elsewhere (Ortiz-Tudela et al., 2010; Witting et al., 1990). RA was determined as the difference between the mean DST for the 5 consecutive hours with the maximum DST values (M5) and the mean DST for the 10 consecutive hours with the minimum values (L10), divided by their sum (Martinez-Nicolas et al., 2011). Finally, the times at which L10 and M5 occurred (TL10 and TM5, respectively) were calculated as previously described (Martinez-Nicolas et al., 2011; Fig. 1A). The mean daily pattern for DST was calculated per individual, and then the mean for each group was calculated. Figure 1A shows an illustrative example of the daily pattern of the DST. The midsleep time point, chronotype, and social jet lag of the participants were also determined (see the supplementary material for more information).
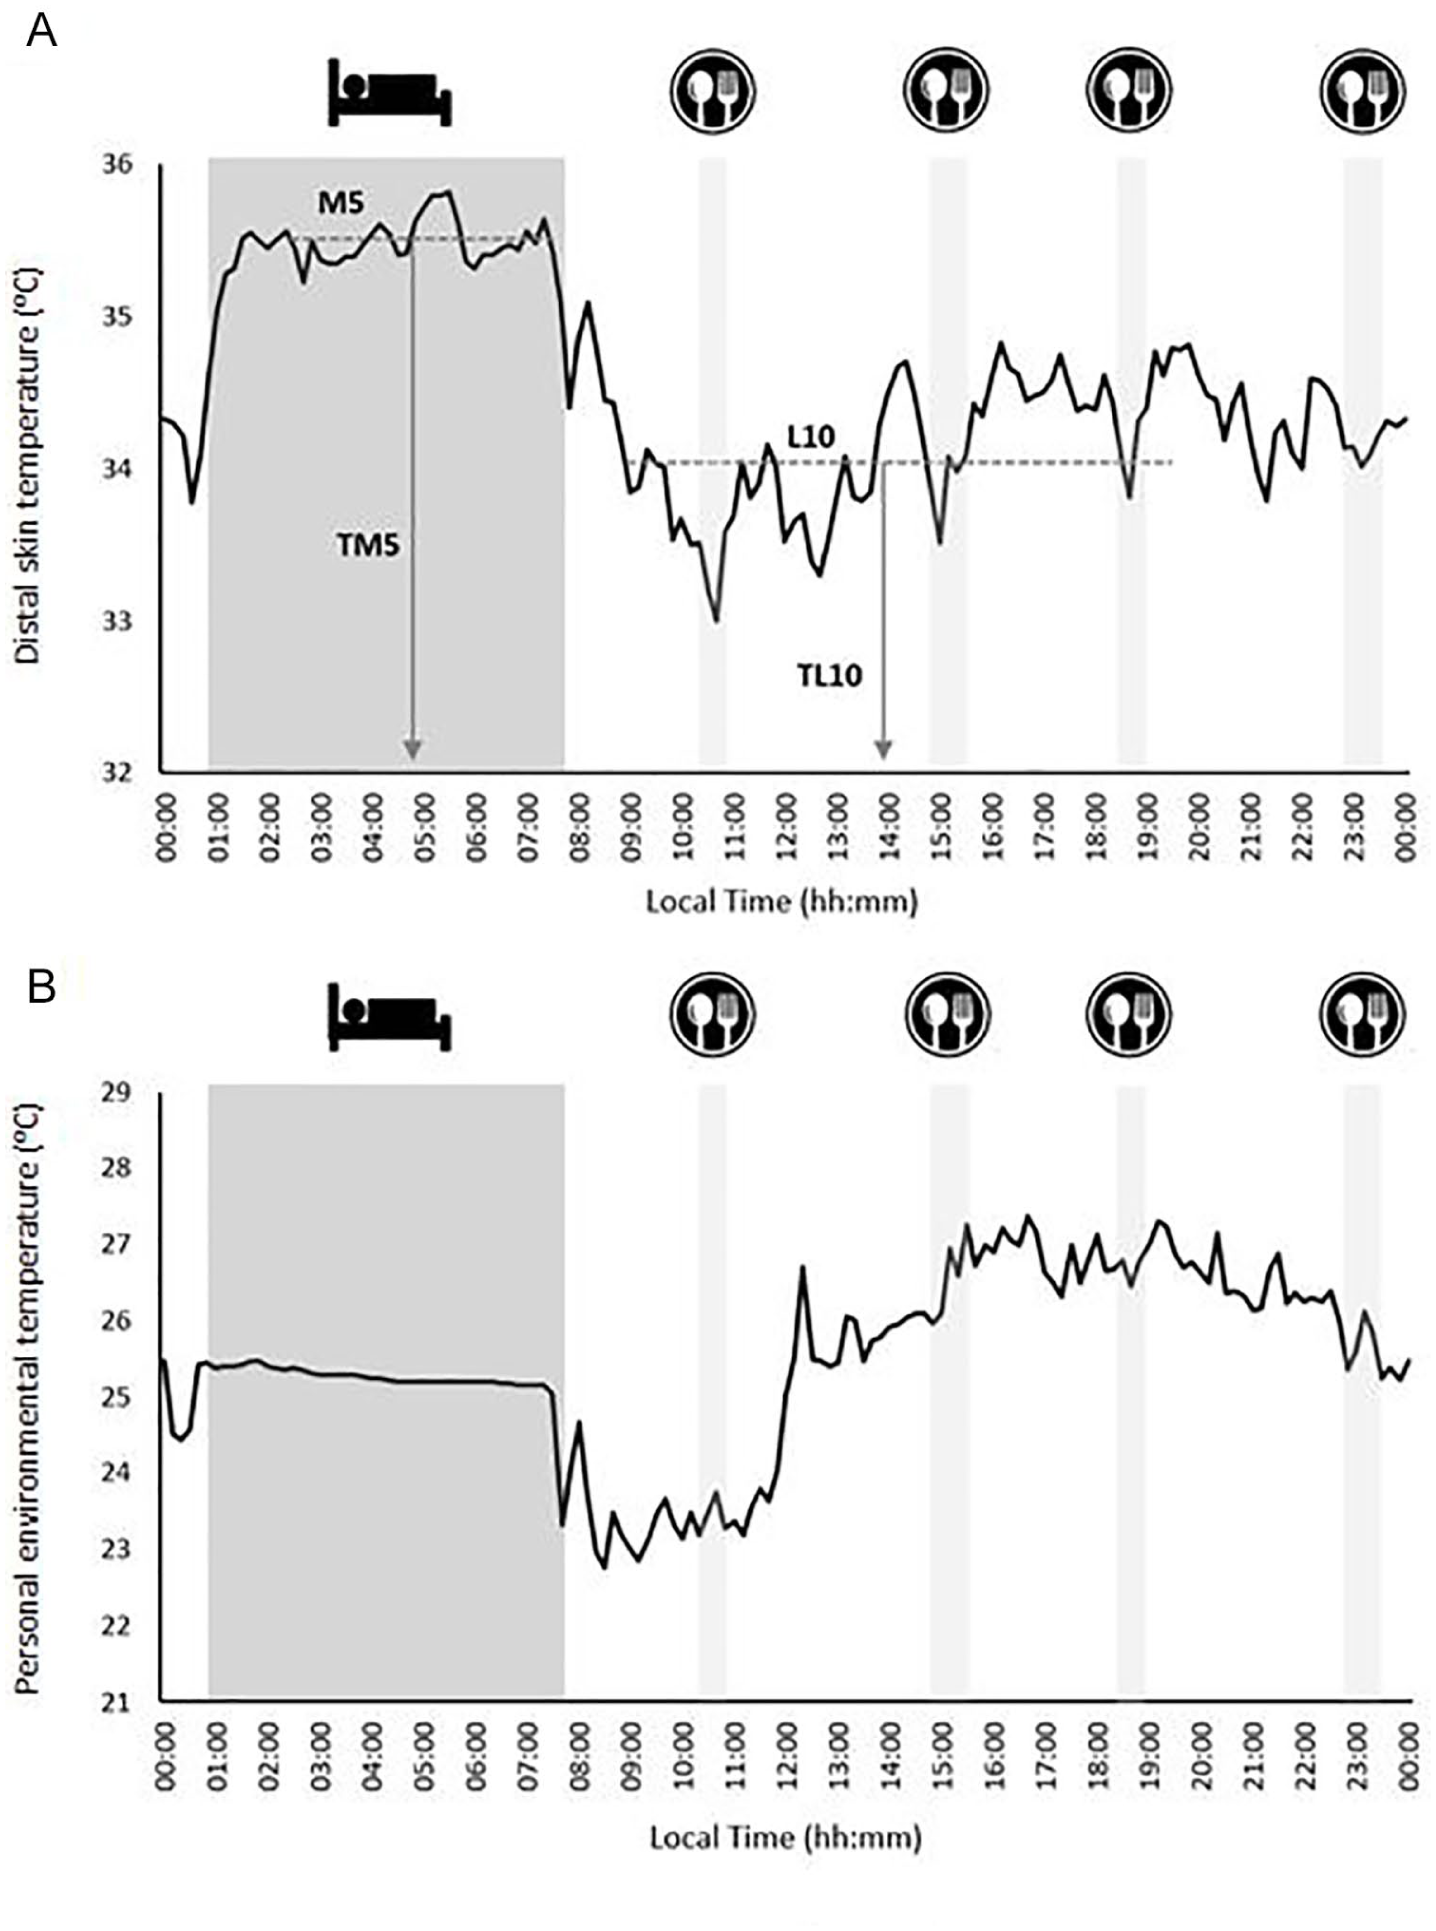
Illustrative example of the daily pattern of distal skin temperature (A) and personal environmental temperature (B). The darkest filled area represents the sleep time table, and the clearest filled areas represent the times of breakfast, lunch, a snack, and dinner. Panel A summarizes the analysis of the distal skin temperature, showing the M5 (average for the 5 consecutive hours with the maximum values), L10 (average for the 10 consecutive hours with the minimum values), and the times at which these occurred (TM5 and TL10, respectively).
Personal Environmental Temperature
Relationships have been reported to exist between the environmental temperature to which people are exposed and the presence, volume, and activity of BAT as estimated by 18F-FDG–PET/CT (Cypess et al., 2009; Ouellet et al., 2011). Since the study period was October to November 2016, the possible confounding effect of environmental temperature on the association between the DST and BAT 18F-FDG uptake was examined (Martinez-Tellez et al., 2018). People normally spend about 90% of their time indoors, especially in colder regions/seasons (Klepeis et al., 2001), rendering outdoor ambient temperature an inaccurate measure of true exposure. Thus, at the same time the DST assessments were made, the personal environmental temperature (personal-ET) to which participants were exposed was objectively measured using a hip-worn iButton (not covered by clothing). This sensor was never in direct contact with the body (Martinez-Nicolas et al., 2015). During periods of sleep, the sensor was placed on the bedside table. For a more extended explanation, see Martinez-Tellez et al. (2018). The processing, cleaning, and analysis of the personal-ET data were performed in the same way as for the DST variables (see above). The daily patterns for the personal-ET were then characterized as for DST. Figure 1B shows a sample personal-ET daily pattern. Finally, based on theoretical concerns and preliminary statistical analyses (data not shown), the mean personal-ET over the L10 period (personal-ETL10) was deemed to be a potential confounder of the examined relationships.
Personalized Cold Exposure and 18F-FDG–PET/CT Acquisition
Full details of how the subjects were exposed to personalized cold and how the 18F-FDG–PET/CT data were acquired can be found elsewhere (Acosta, Martinez-Tellez, et al., 2019; Martinez-Tellez et al., 2017). Briefly, subjects came to the laboratory and sat in a cool room (19.5-20 °C) wearing a water-perfused cooling vest (Polar Products Inc., Stow, OH). The water temperature was reduced from 16.6 °C by ~1.4 °C every 10 min until the subjects began to shiver (visually detected or self-reported); this value was recorded as the shivering threshold temperature. Some 48 to 72 h later, the subjects went to the Hospital Virgen de las Nieves, where they were again placed in a cool room (19.5–20 °C) and wore the same cooling vest but with the water temperature set ~4 °C above their shivering threshold temperature for 2 h. After the first hour of cold exposure, the subjects received an injection of 18F-FDG (180.6 ± 5.8 MBq, ≈2.9 MBq/kg), and the water temperature was increased by 1 °C to avoid shivering. One hour later, the PET/CT scan was performed using a Siemens Biograph 16 PET/CT scanner (Siemens, Erlangen, Germany). A low-dose CT scan (120 kV) was first performed for attenuation correction and anatomic localization. Immediately thereafter, 1 static acquisition of 2 PET bed positions (6 min each) was performed from the atlas vertebra to the mid-chest region (Martinez-Tellez et al., 2017). All personalized cold exposure treatments and 18F-FDG–PET/CT data acquisitions were performed according to current methodological recommendations (Chen et al., 2016).
18F-FDG–PET/CT Analysis
The BAT volume and metabolic activity, estimated via the 18F-FDG uptake, were then determined using the Beth Israel plug-in for the FIJI program (Schindelin et al., 2012). This required (1) outlining regions of interest (ROIs) in the supraclavicular, laterocervical, paravertebral, and mediastinal regions from the atlas vertebra to the fourth thoracic vertebra, using a 3-dimensional axial technique; (2) the determination of the number of pixels in the above ROIs with a radiodensity range of −190 to −10 Hounsfield units (HU); and (3) the calculation of individualized, standardized threshold 18F-FDG uptake values (SUV; 1.2/[lean body mass/body mass]; Chen et al., 2016). BAT volume was determined as the number of pixels in the above range with an SUV value above the SUV threshold. BAT activity was represented as the mean SUV (SUVmean: the mean quantity of 18FDG in the above same pixels) and peak SUV (SUVpeak: the mean of the 3 highest 18F-FDG contents in 3 pixels within a volume of <1 cm3). BAT metabolic activity was calculated as BAT volume × SUVmean. The mean BAT radiodensity was calculated as the mean HU value for the above mentioned ROIs (Martinez-Tellez, Sanchez-Delgado, Boon et al., 2019).
In addition, a single-slice ROI was used to determine the 18F-FDG uptake in several skeletal muscles (cervical, scalene, longus colli, paravertebral, subscapular, sternocleidomastoid, supraspinous, trapezius, deltoid, pectoralis major, and triceps braquii) on both the right and left sides of the body. The mean SUVpeak for both sides of the body for the deep (cervical, scalene, longus colli, paravertebral, subscapular), superficial (sternocleidomastoid, trapezius, deltoid, pectoralis major, triceps braquii), and all skeletal muscles or areas was then determined. Skeletal muscle was distinguished from adipose tissue since skeletal muscle has a radiodensity range of between 10 and 100 HU. The SUVpeak for the descending aorta (reference tissue) at the height of the fourth thoracic vertebra was also determined, using a single ROI from 1 slice. Finally, for confirmatory analyses, the BAT SUVmean and SUVpeak and the all-muscles and descending aorta SUVpeak with respect to lean body mass (SUVLBM; Leitner et al., 2017) were calculated.
Anthropometry and Body Composition
Subjects’ weight and height (without shoes and wearing the standard clothes) were determined using a SECA model 799 electronic column and scale (SECA, Hamburg, Germany). Waist circumference was measured twice (and the mean determined) at the minimum perimeter; when subjects had abdominal obesity, measures were taken just above the umbilicus, in the horizontal plane. Body composition was measured by dual X-ray absorptiometry using a Discovery Wi apparatus (HOLOGIC, Bedford, MA). Subject body mass indices (BMIs) were calculated as weight (kg) divided by height squared (m2), fat mass index (FMI) as weight (kg) of body fat/height squared (m2), and lean mass index (LMI) as lean body mass (kg)/height squared (m2).
Cardiometabolic Profile
To assess the cardiometabolic profile of the subjects and to examine how it is related to their DST variables, a set of glycemic and lipid markers was measured (see supplementary material) along with insulin, C-reactive protein, systolic and diastolic blood pressure at rest, and physical fitness (muscular strength and cardiorespiratory fitness). The value for the homeostatic model assessment (HOMA) of insulin resistance was also determined, and the prevalence of metabolic syndrome calculated. More information on how these variables were measured and calculated is provided in the supplementary material.
Statistical Analysis
Descriptive statistics for continuous and categorical variables were used to show the sociodemographic and clinical characteristics of the study participants. Since the interaction of sex × DST variables had no significant influence on the BAT 18F-FDG uptake variables (p > 0.05), all analyses were conducted for men and women together. Simple linear regressions were first performed to examine the association between the DST variables and BAT volume, SUVmean, and SUVpeak. Multiple linear regression analyses were then performed to examine this relationship after adjusting for sex and for sex plus personal-ETL10. Mean daily DST patterns across tertiles of BAT volume, metabolic activity, and SUVpeak were then calculated, and the Mann-Whitney test (exact significance) with Bonferroni correction was used to examine differences across BAT tertiles. Linear regression was also used to examine the association between DST variables and skeletal muscle and descending aorta 18F-FDG uptakes, before and after adjusting for sex and personal-ETL10. Linear regression analysis was further used to determine whether the DST variables were associated with body composition and subject cardiometabolic profile, before and after adjusting for sex and personal-ETL10. Statistical significance was set at p ≤ 0.05. Statistical analyses were performed using the Statistical Package for the Social Sciences (v.24, SPSS Inc., Chicago, IL).
Results
From among the 82 subjects with complete DST and 18F-FDG assessments, 3 subjects were excluded because of problems with their BAT analyses. Two more were excluded because they had less than 4 valid days of sensor measurements (Suppl. Fig. S1). The final study sample was therefore made up of 77 subjects (26% male). Table 1 shows the descriptive characteristics of these subjects by sex. Subjects wore the wrist sensor for 6.1 ± 0.5 days at 21 ± 0.2 h/day.
Characteristics of the study participants.
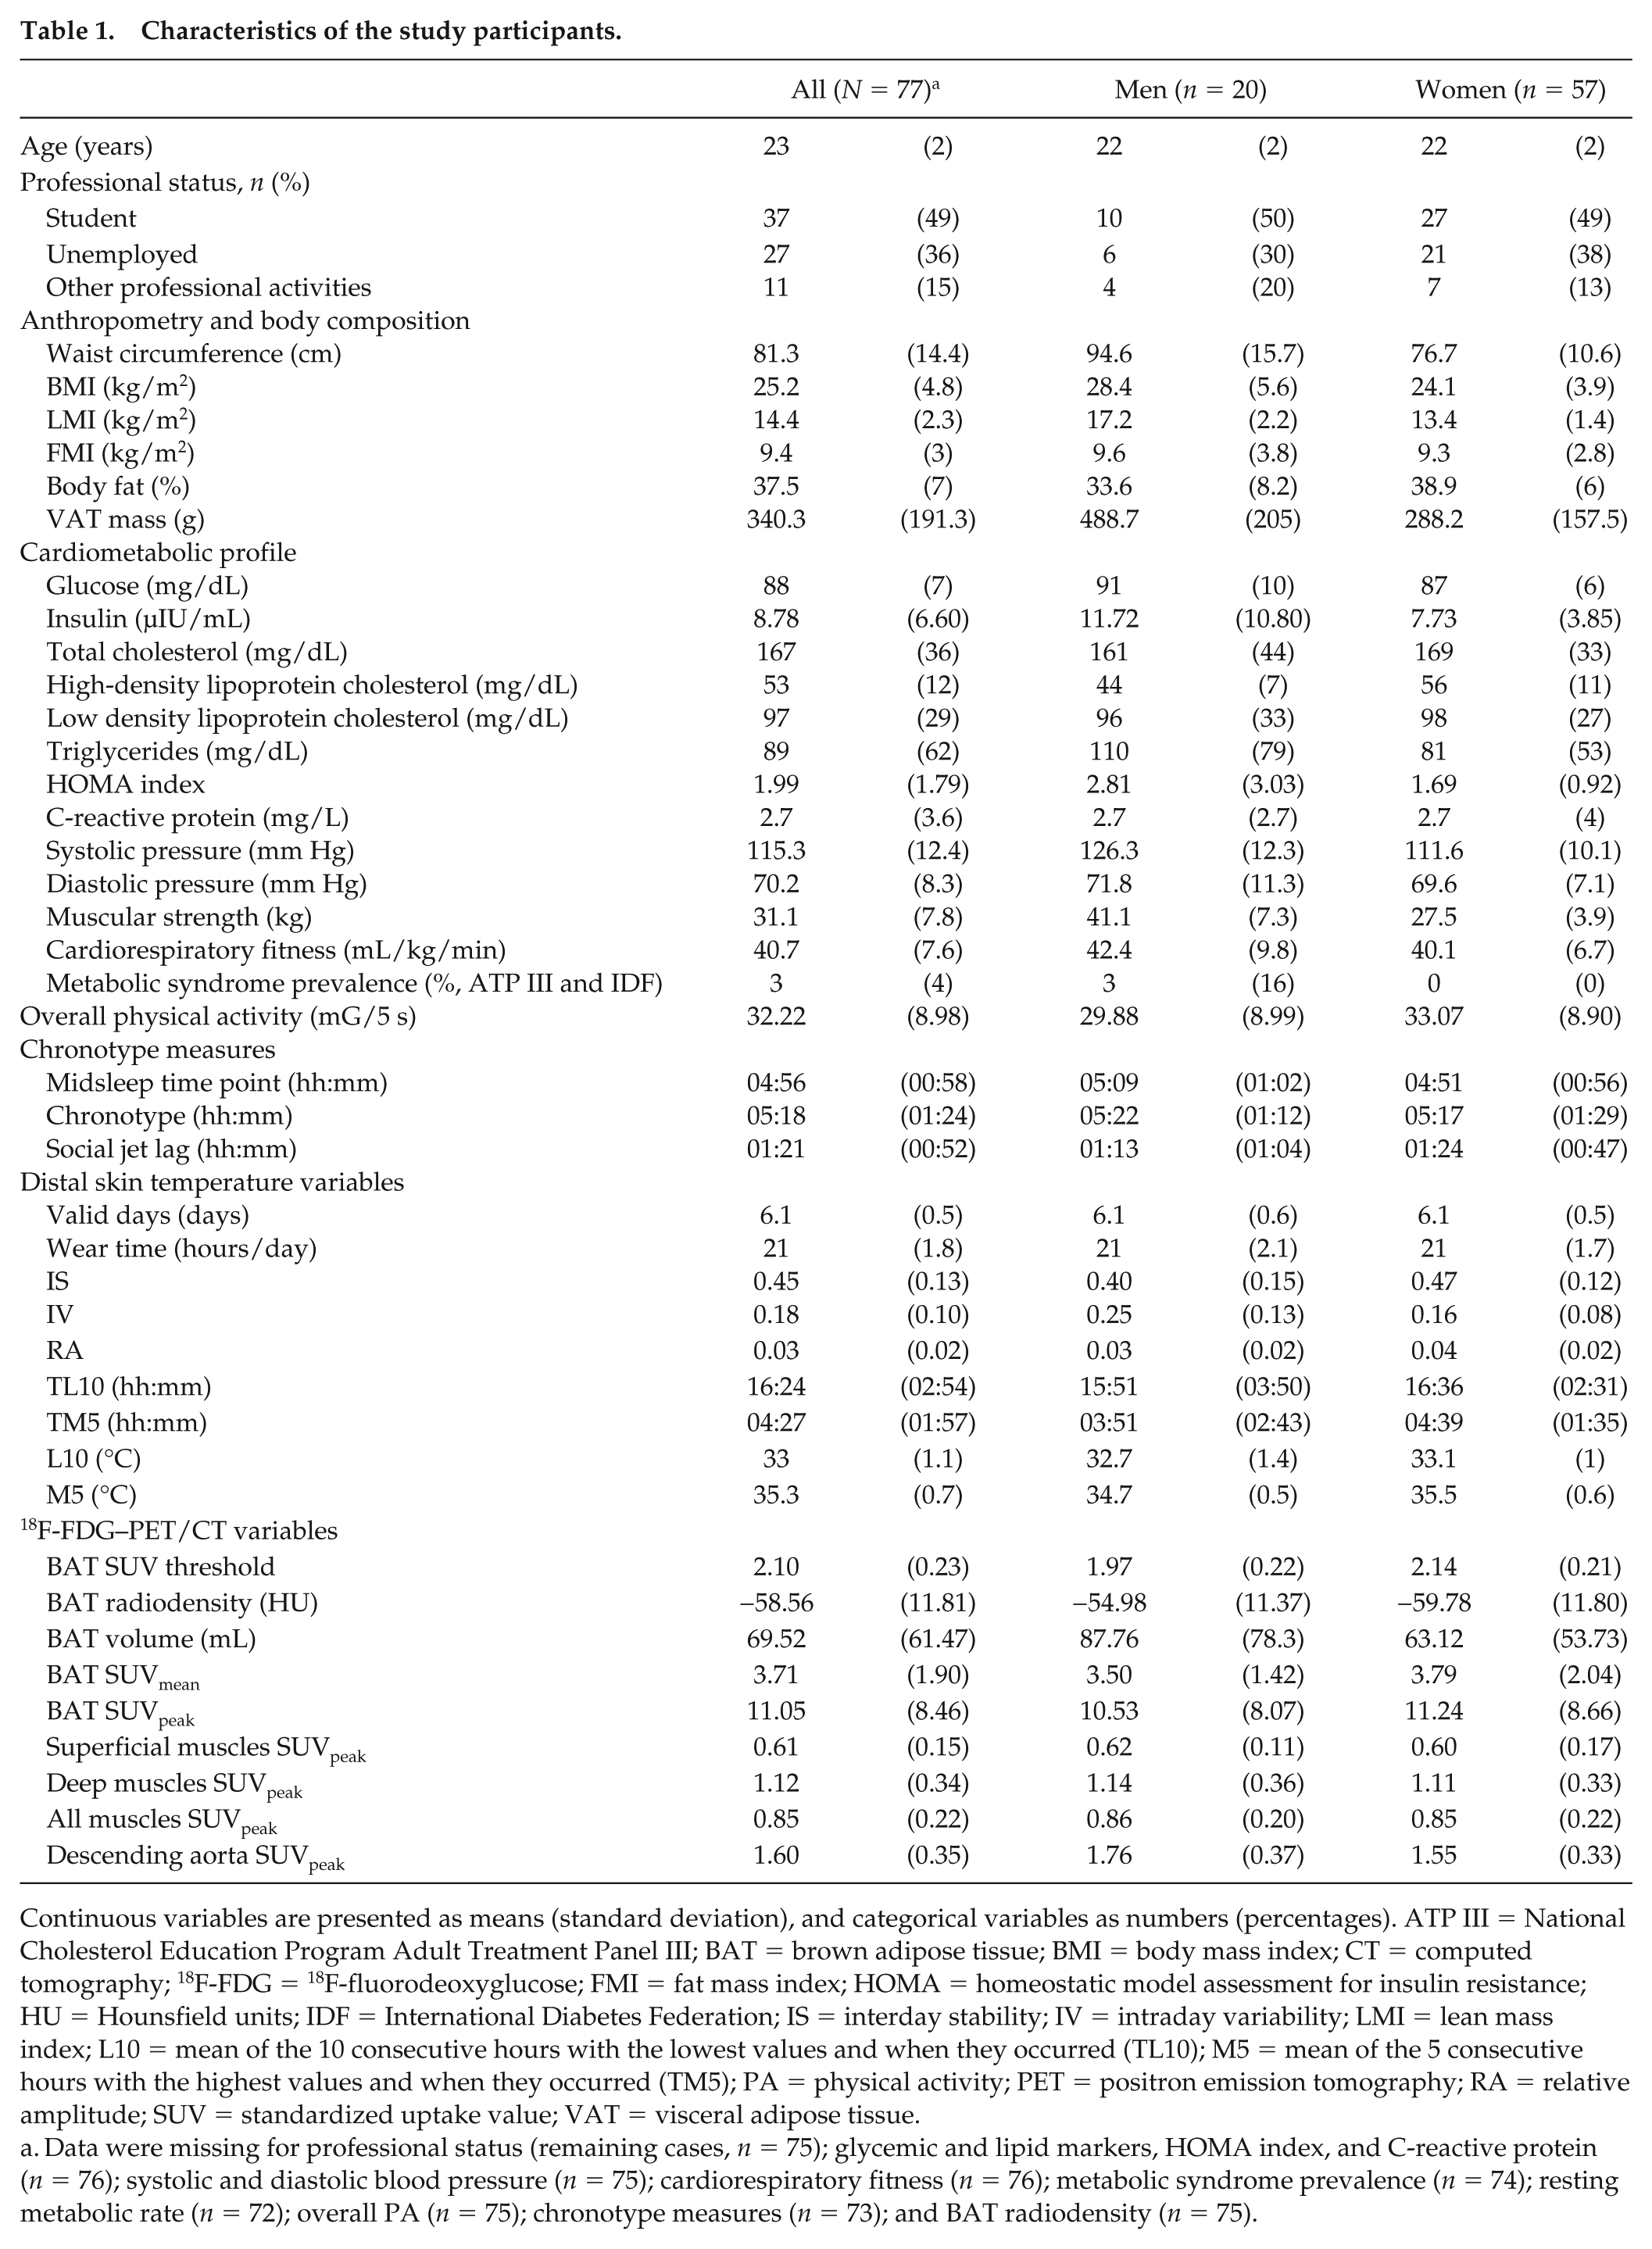
Continuous variables are presented as means (standard deviation), and categorical variables as numbers (percentages). ATP III = National Cholesterol Education Program Adult Treatment Panel III; BAT = brown adipose tissue; BMI = body mass index; CT = computed tomography; 18F-FDG = 18F-fluorodeoxyglucose; FMI = fat mass index; HOMA = homeostatic model assessment for insulin resistance; HU = Hounsfield units; IDF = International Diabetes Federation; IS = interday stability; IV = intraday variability; LMI = lean mass index; L10 = mean of the 10 consecutive hours with the lowest values and when they occurred (TL10); M5 = mean of the 5 consecutive hours with the highest values and when they occurred (TM5); PA = physical activity; PET = positron emission tomography; RA = relative amplitude; SUV = standardized uptake value; VAT = visceral adipose tissue.
Data were missing for professional status (remaining cases, n = 75); glycemic and lipid markers, HOMA index, and C-reactive protein (n = 76); systolic and diastolic blood pressure (n = 75); cardiorespiratory fitness (n = 76); metabolic syndrome prevalence (n = 74); resting metabolic rate (n = 72); overall PA (n = 75); chronotype measures (n = 73); and BAT radiodensity (n = 75).
Association between DST Variables and BAT 18F-FDG Uptake
Simple linear regression showed RA and TL10 to be directly associated with BAT, SUVmean, and SUVpeak (all p ≤ 0.02; see Fig. 2C and D), whereas L10 was inversely associated with them (all p ≤ 0.01; see Fig. 2F). Furthermore, IS was directly, and IV inversely, associated with BAT SUVpeak (all p ≤ 0.04; Fig. 2A and B). RA, TL10, and L10 explained the greatest amount of variance in the BAT volume (~8%-12%), SUVmean (~5%-10%), and SUVpeak (~8%-14%) values. Neither the midsleep time point, chronotype, nor social jet lag (see supplementary material) were associated with the BAT volume, SUVmean, or SUVpeak (all p > .05, data not shown). These results persisted when the analyses were adjusted for sex, except for the relationship between IS and BAT volume, which became significant (p = 0.03; see Table 2, model 1). When these analyses were adjusted for sex plus personal-ETL10, all of these associations disappeared (all p > 0.05; see Table 2, model 2), but an inverse relationship between TM5 and BAT SUVmean (p = 0.04) appeared. Overall, these results remained similar when the model 2 analysis was additionally adjusted for the time that the participants wore the sensor (data not shown), BMI, LMI, FMI, or percentage fat (see Suppl. Table S2) and when the evaluation wave (natural day of the year in which the PET/CT scan was performed) was taken into account instead of the personal-ETL10 (data not shown). The daily physical activity level had no influence on the latter relationship (data not shown; for further information, see supplementary material).
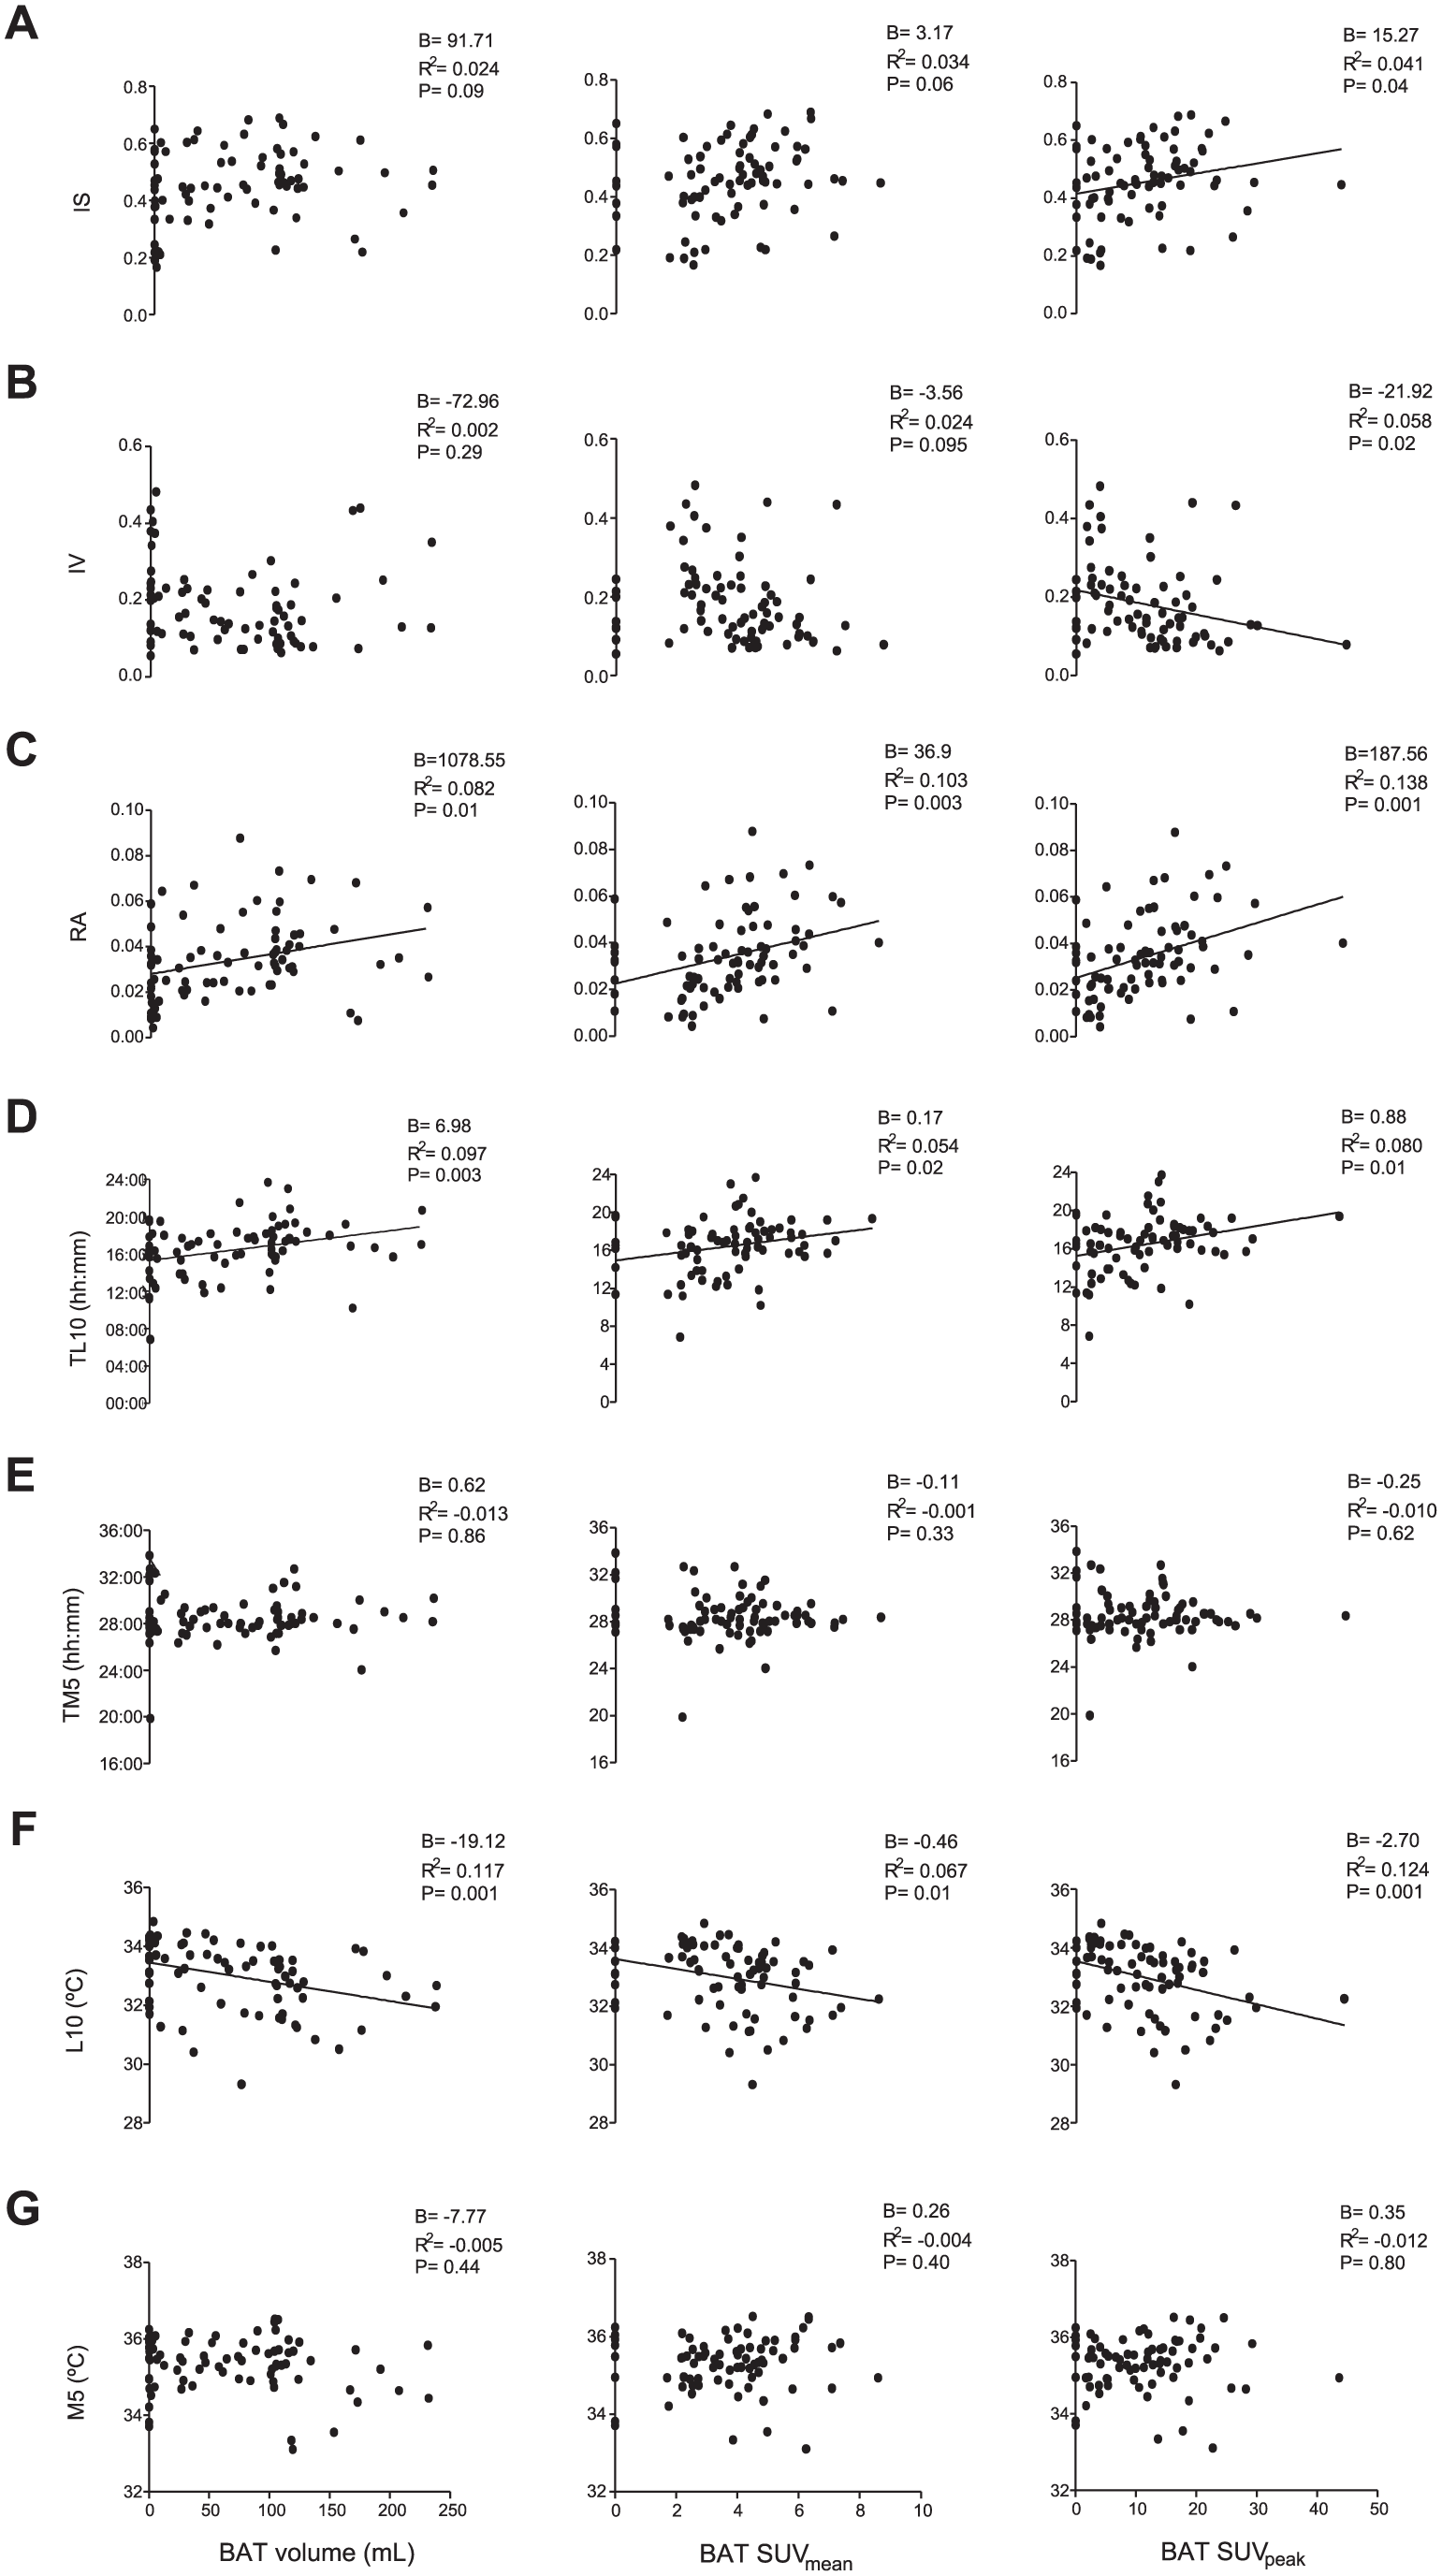
Association of distal skin temperature (DST) variables with brown adipose tissue (BAT) volume and standardized uptake values (mean and peak, N = 77, *as determined by simple linear regression). The nonstandardized B coefficient, adjusted R2, and p values are provided. IS = interday stability; IV = intraday variability; L10 = mean of the 10 consecutive hours with the lowest values and when they occurred (TL10); M5 = mean of the 5 consecutive hours with the highest values and when they occurred (TM5); RA = relative amplitude.
Association between distal skin temperature (DST) variables and brown adipose tissue (BAT) volume/standardized uptake value (SUV; mean and peak) after adjusting for potential confounders.
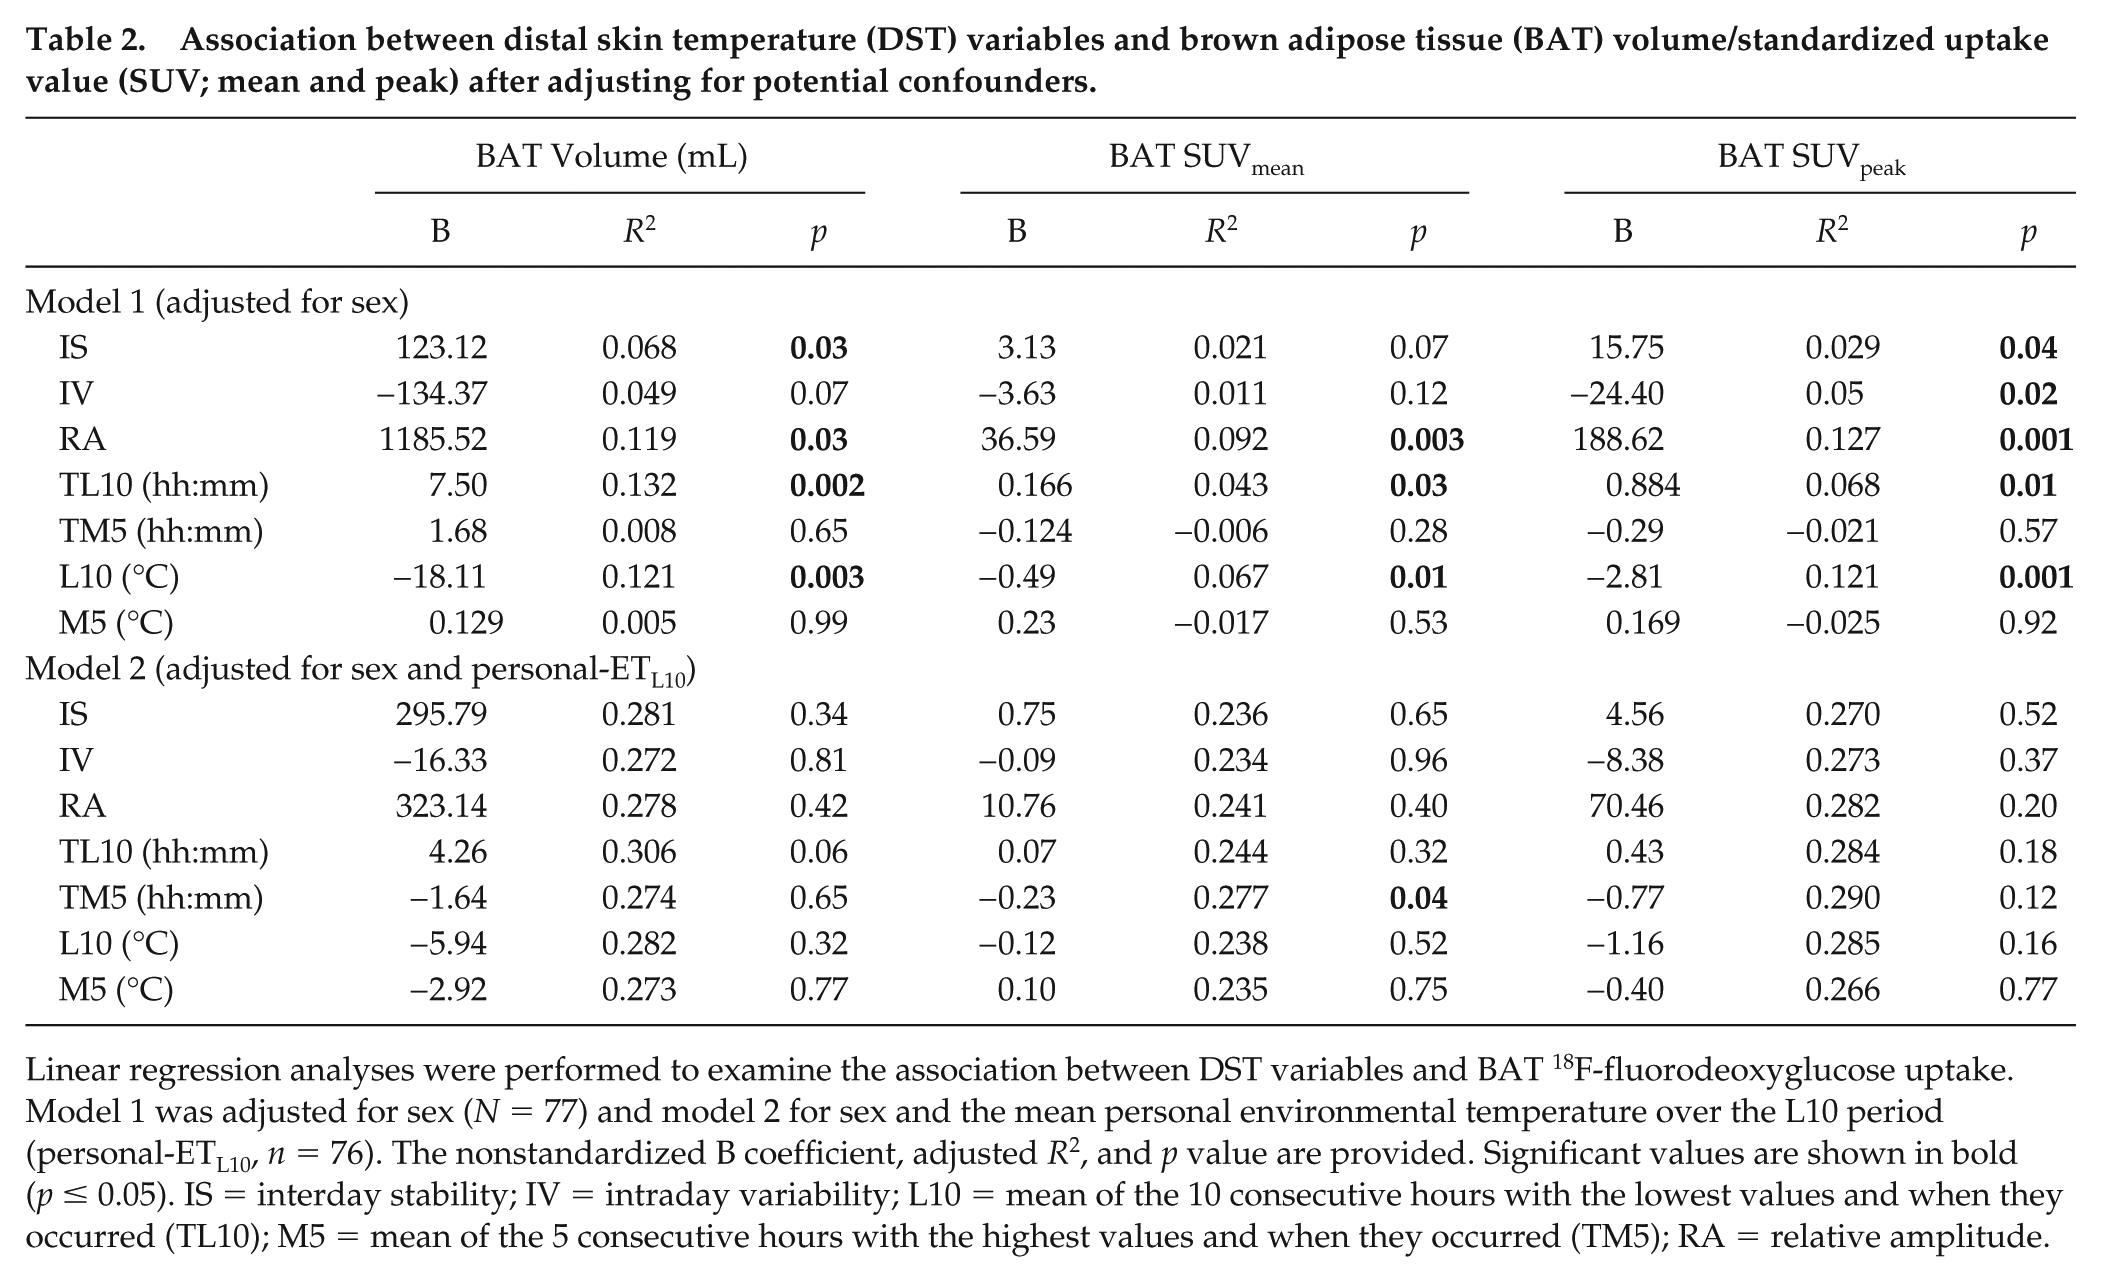
Linear regression analyses were performed to examine the association between DST variables and BAT 18F-fluorodeoxyglucose uptake. Model 1 was adjusted for sex (N = 77) and model 2 for sex and the mean personal environmental temperature over the L10 period (personal-ETL10, n = 76). The nonstandardized B coefficient, adjusted R2, and p value are provided. Significant values are shown in bold (p ≤ 0.05). IS = interday stability; IV = intraday variability; L10 = mean of the 10 consecutive hours with the lowest values and when they occurred (TL10); M5 = mean of the 5 consecutive hours with the highest values and when they occurred (TM5); RA = relative amplitude.
DST Variables and Daily Rhythms across BAT Volume and Activity Tertiles
Figure 3A and B shows the values for the DST variables and daily patterns with respect to BAT volume tertiles. Compared with the low BAT volume tertile members, subjects in the high BAT volume tertile showed greater IS and RA in their DST patterns, a lower L10, and a phase delay in TL10 (all p ≤ 0.011). In addition, the DST pattern was less fragmented (IV; p = 0.017). No significant differences were seen across tertiles with respect to M5 or TM5 (p > 0.017). Similar results were recorded for the DST variables and mean daily patterns with respect to BAT metabolic activity (BAT volume × SUVmean; Fig. 3D and E) and SUVpeak tertiles (Fig. 3G and H). However, RA was also different between the low and medium tertiles (p < 0.017), and no significant differences in TL10 were seen across the BAT SUVpeak tertiles (p > 0.017). It is noteworthy that the subjects exposed to the lowest personal-ET throughout the day and night (high BAT tertile) had approximately 3 to 5 times greater BAT volume, metabolic activity, and SUVpeak values than those exposed to the highest personal-ET (low BAT tertile; BAT volume >104.07 vs. 0-27.06 mL; BAT metabolic activity >474.36 vs. 0-90.63; BAT SUVpeak >14.1 vs. 0-5.38; see Fig. 3C, F, and I). No significant differences in BAT radiodensity or cardiometabolic profile (p > 0.05) were detected across the different BAT tertiles; these variables are therefore unlikely to influence these comparisons (data not shown).
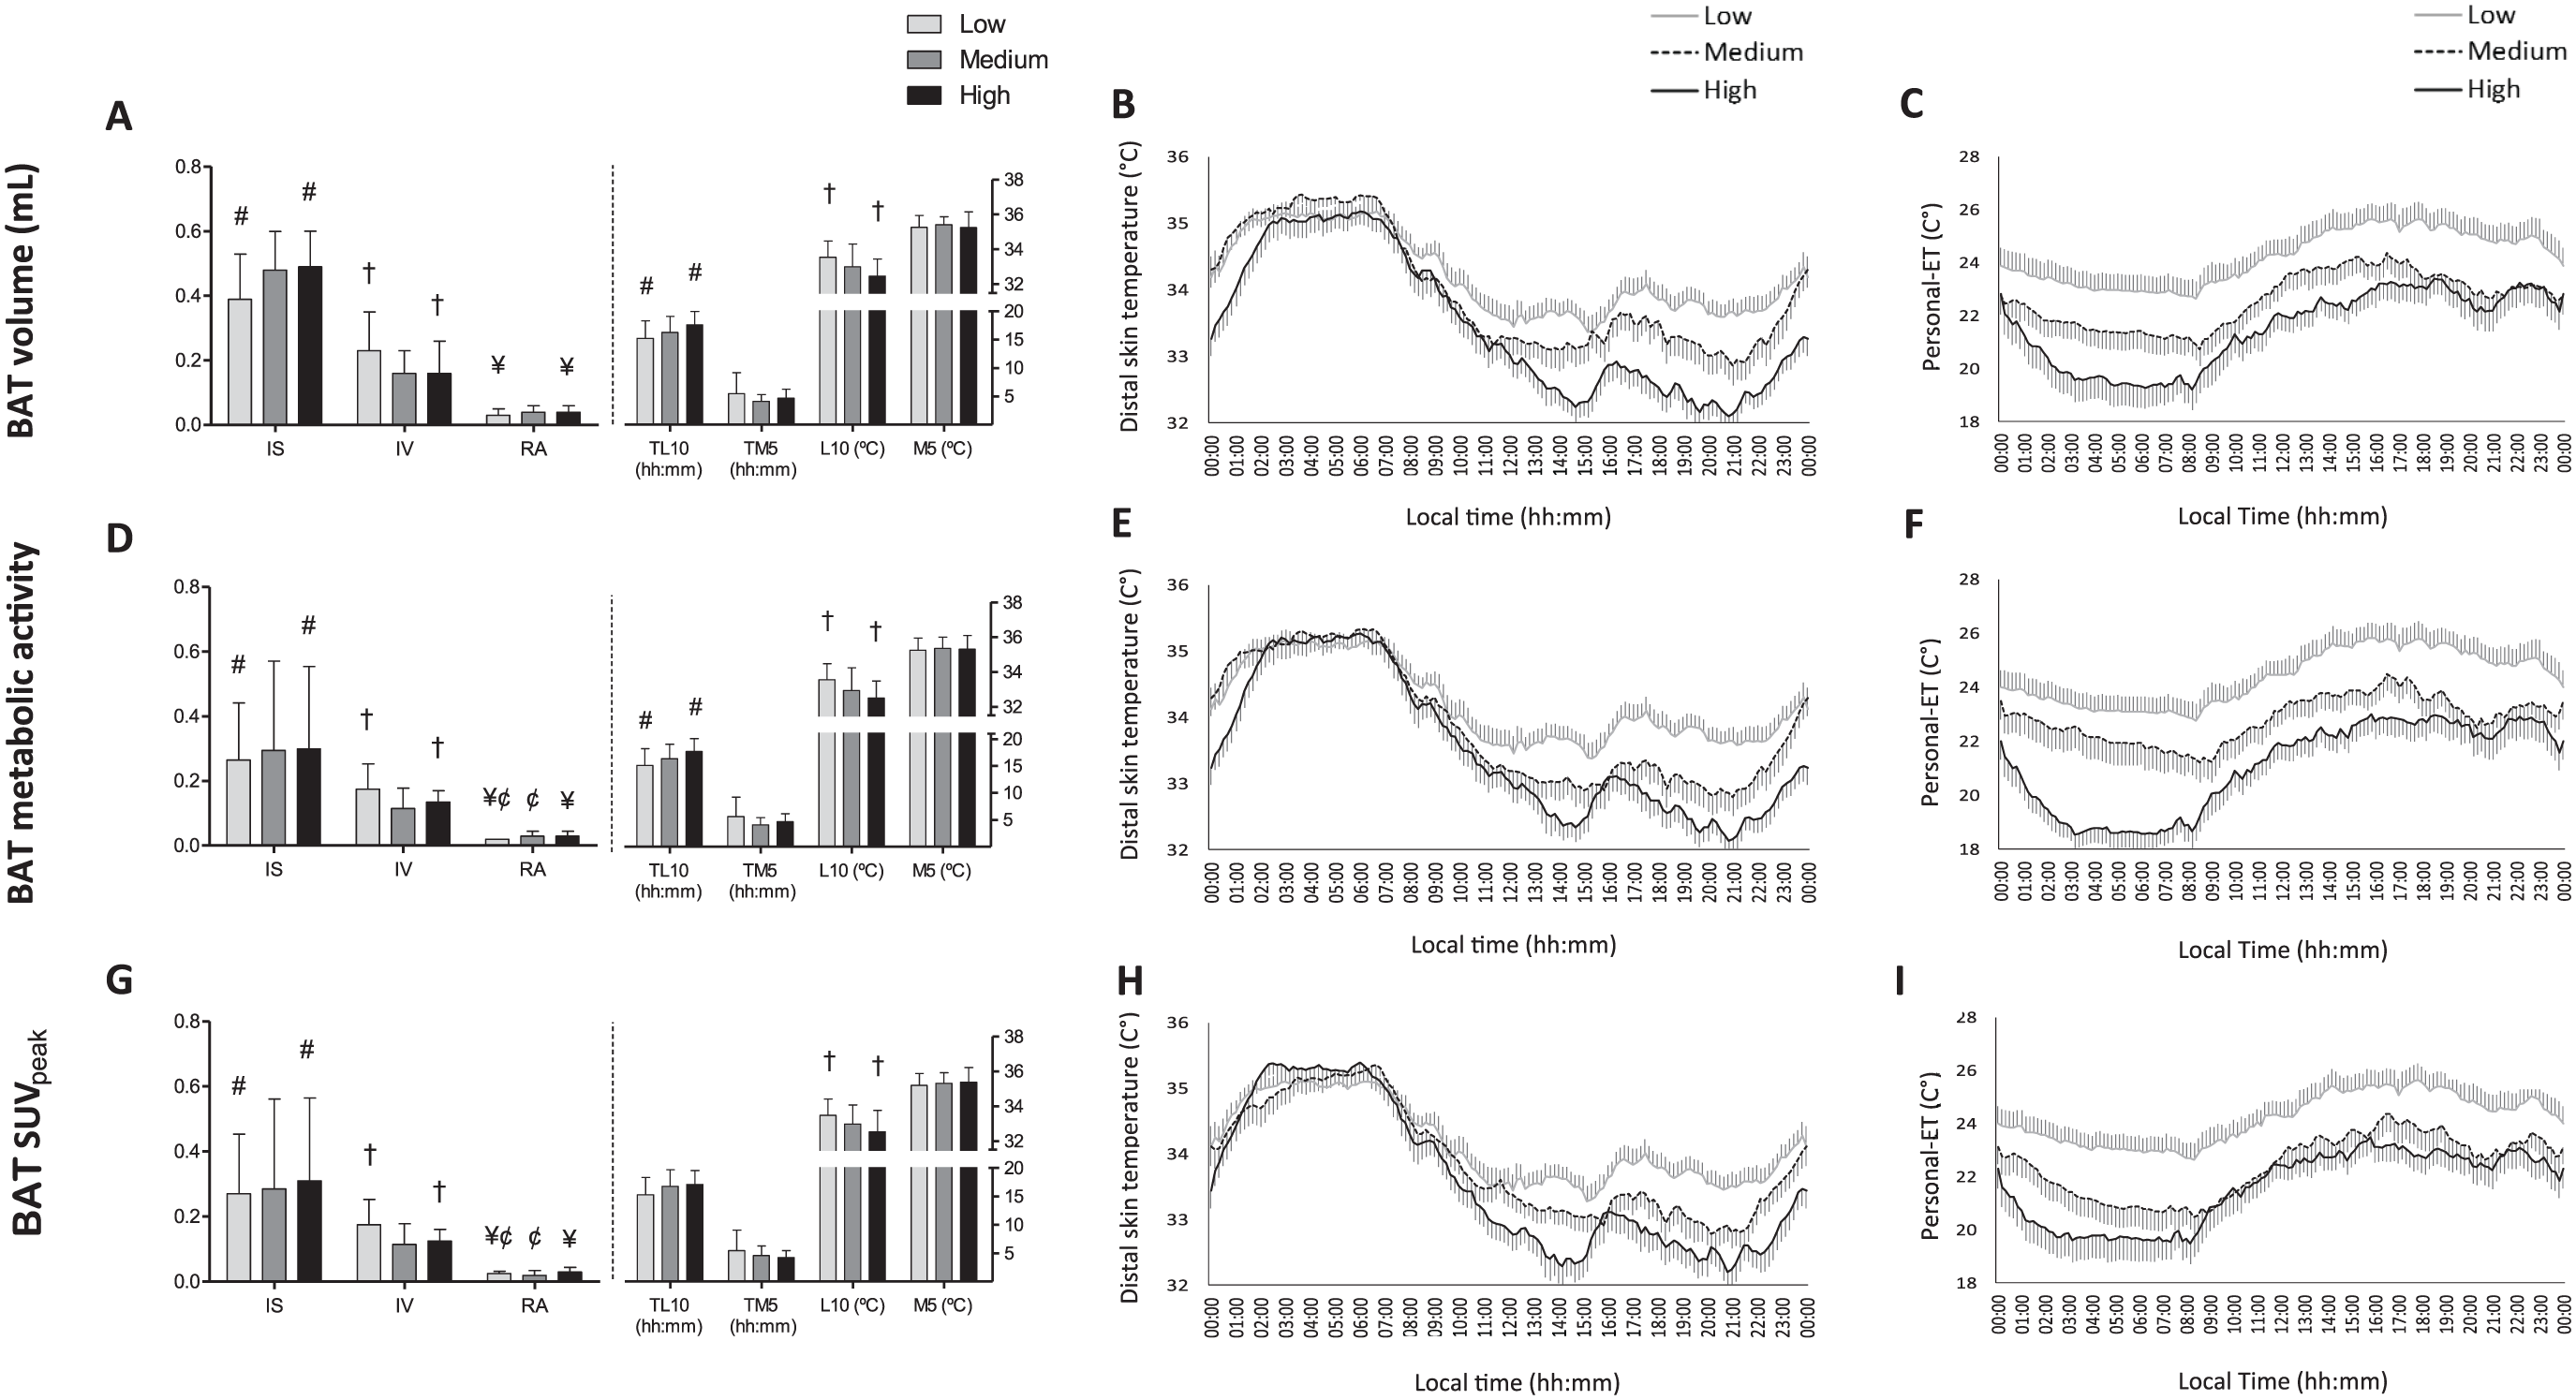
Distal skin temperature (DST) variables and personal environmental temperature (personal-ET) across tertiles for brown adipose tissue (BAT) volume, metabolic activity, and standardized uptake value (SUV) peak (N = 77). Mann-Whitney tests (exact significance) with Bonferroni correction (all p ≤ 0.0167) were used to compare DST variables across the tertiles for BAT volume (A), metabolic activity (D), and SUVpeak (G). The low, medium, and high tertiles comprised a total of 25, 26, and 26 subjects, respectively. These tertiles were distributed as BAT volume (low: 0-27.06 mL, medium: 27.06-104.07 mL, high: >104.07 mL), metabolic activity (low: 0-90.63, medium: 90.63-474.36, high: >474.36 V), and SUVpeak (low: 0-5.38, medium: 5.38-14.1 V, high: >14.1). Symbols show significant differences across tertiles. Panels B, E, and H show the DST mean daily pattern for the tertiles of BAT volume, metabolic activity, and SUVpeak, respectively. Similarly, panels C, F, and I show the personal-ET mean daily patterns for the tertiles of BAT volume, metabolic activity, and SUVpeak (n = 76). The low, medium, and high tertiles comprised a total of 25, 25, and 26 subjects, respectively. Data are mean ± standard error. IS = interday stability; IV = intraday variability; L10 = mean of the 10 consecutive hours with the lowest values and when they occurred (TL10); M5 = mean of the 5 consecutive hours with the highest values and when they occurred (TM5); RA = relative amplitude.
Association of DST Variables with Skeletal Muscles and Descending Aorta 18F-FDG Uptake
A positive association was detected between IV and the descending aorta SUVpeak (p = 0.01), even when analyses were adjusted for sex and personal-ETL10 (Table 3). No other associations were found.
Association of distal skin temperature (DST) variables with skeletal muscle and descending aorta 18F-FDG uptake (mean and peak standardized uptake value [SUV]) in young adults.
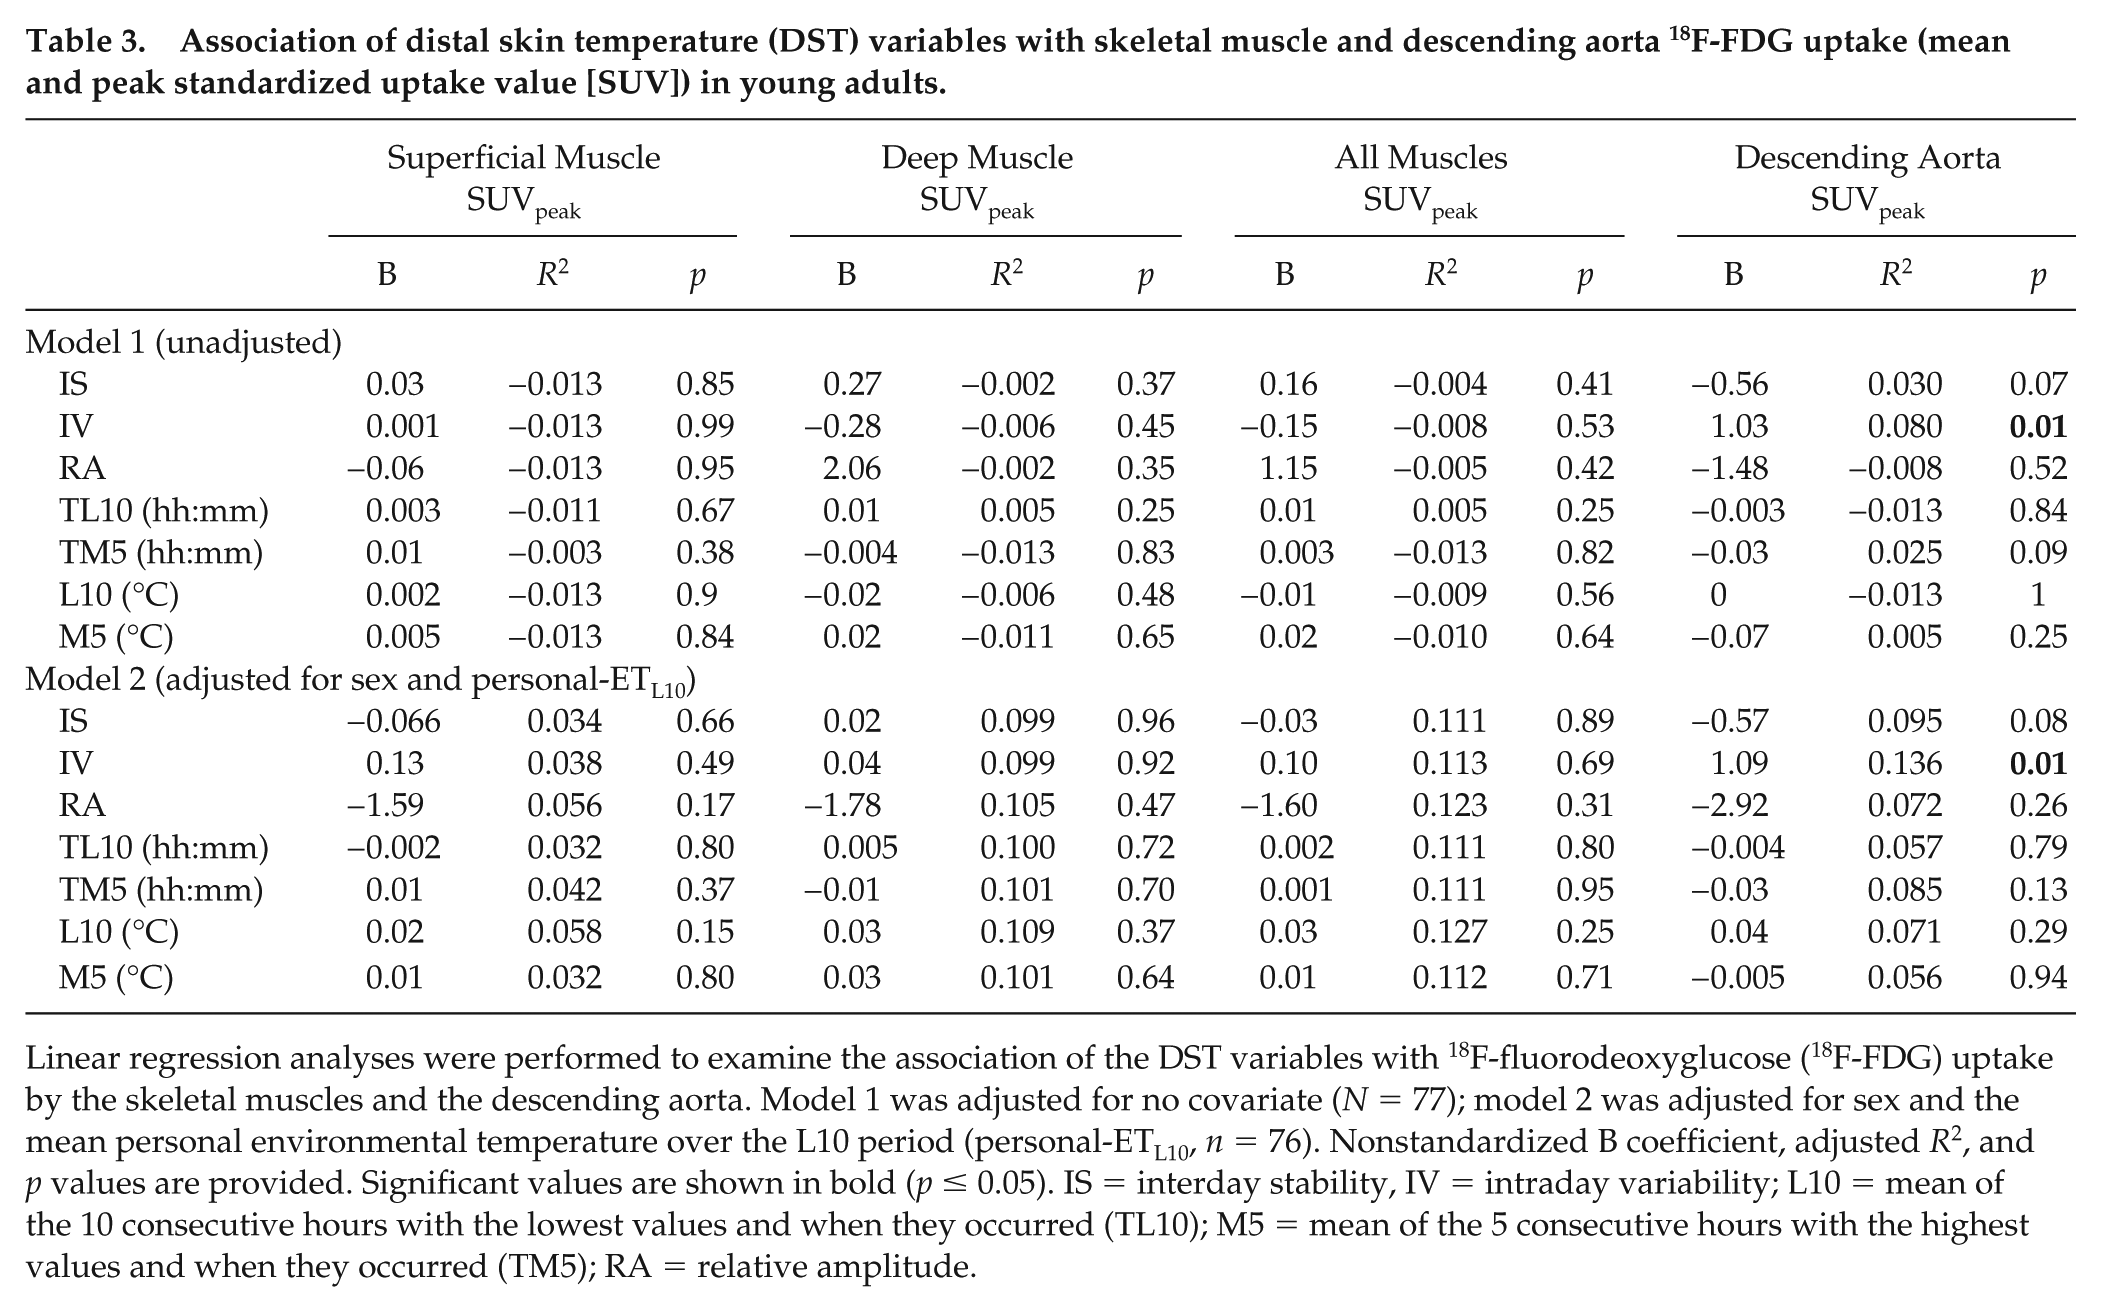
Linear regression analyses were performed to examine the association of the DST variables with 18F-fluorodeoxyglucose (18F-FDG) uptake by the skeletal muscles and the descending aorta. Model 1 was adjusted for no covariate (N = 77); model 2 was adjusted for sex and the mean personal environmental temperature over the L10 period (personal-ETL10, n = 76). Nonstandardized B coefficient, adjusted R2, andp values are provided. Significant values are shown in bold (p ≤ 0.05). IS = interday stability, IV = intraday variability; L10 = mean of the 10 consecutive hours with the lowest values and when they occurred (TL10); M5 = mean of the 5 consecutive hours with the highest values and when they occurred (TM5); RA = relative amplitude.
These findings remained unchanged when SUV was expressed with respect to lean body mass (SUVLBM) instead of total body mass (SUVBM; rendering BAT SUVmean and SUVpeak and skeletal muscle and descending aorta SUVpeak; data not shown). No significant association was detected between the time of the day when BAT was assessed and BAT 18F-FDG uptake (performed with all 133 subjects of the present cohort; see Suppl. Fig. S2).
Association of DST Variables with Body Composition and Cardiometabolic Profile
After adjustment for sex and personal-ETL10, IS and RA were inversely related to BMI, LMI, FMI, percentage body fat, and visceral adipose tissue (VAT) mass, whereas IV was directly related to these variables (all p ≤ 0.02; Table 4, model 2). In addition, L10 was directly associated with BMI, LMI, FMI, and VAT mass (all p ≤ 0.01).
Association of distal skin temperature (DST) variables with body composition.
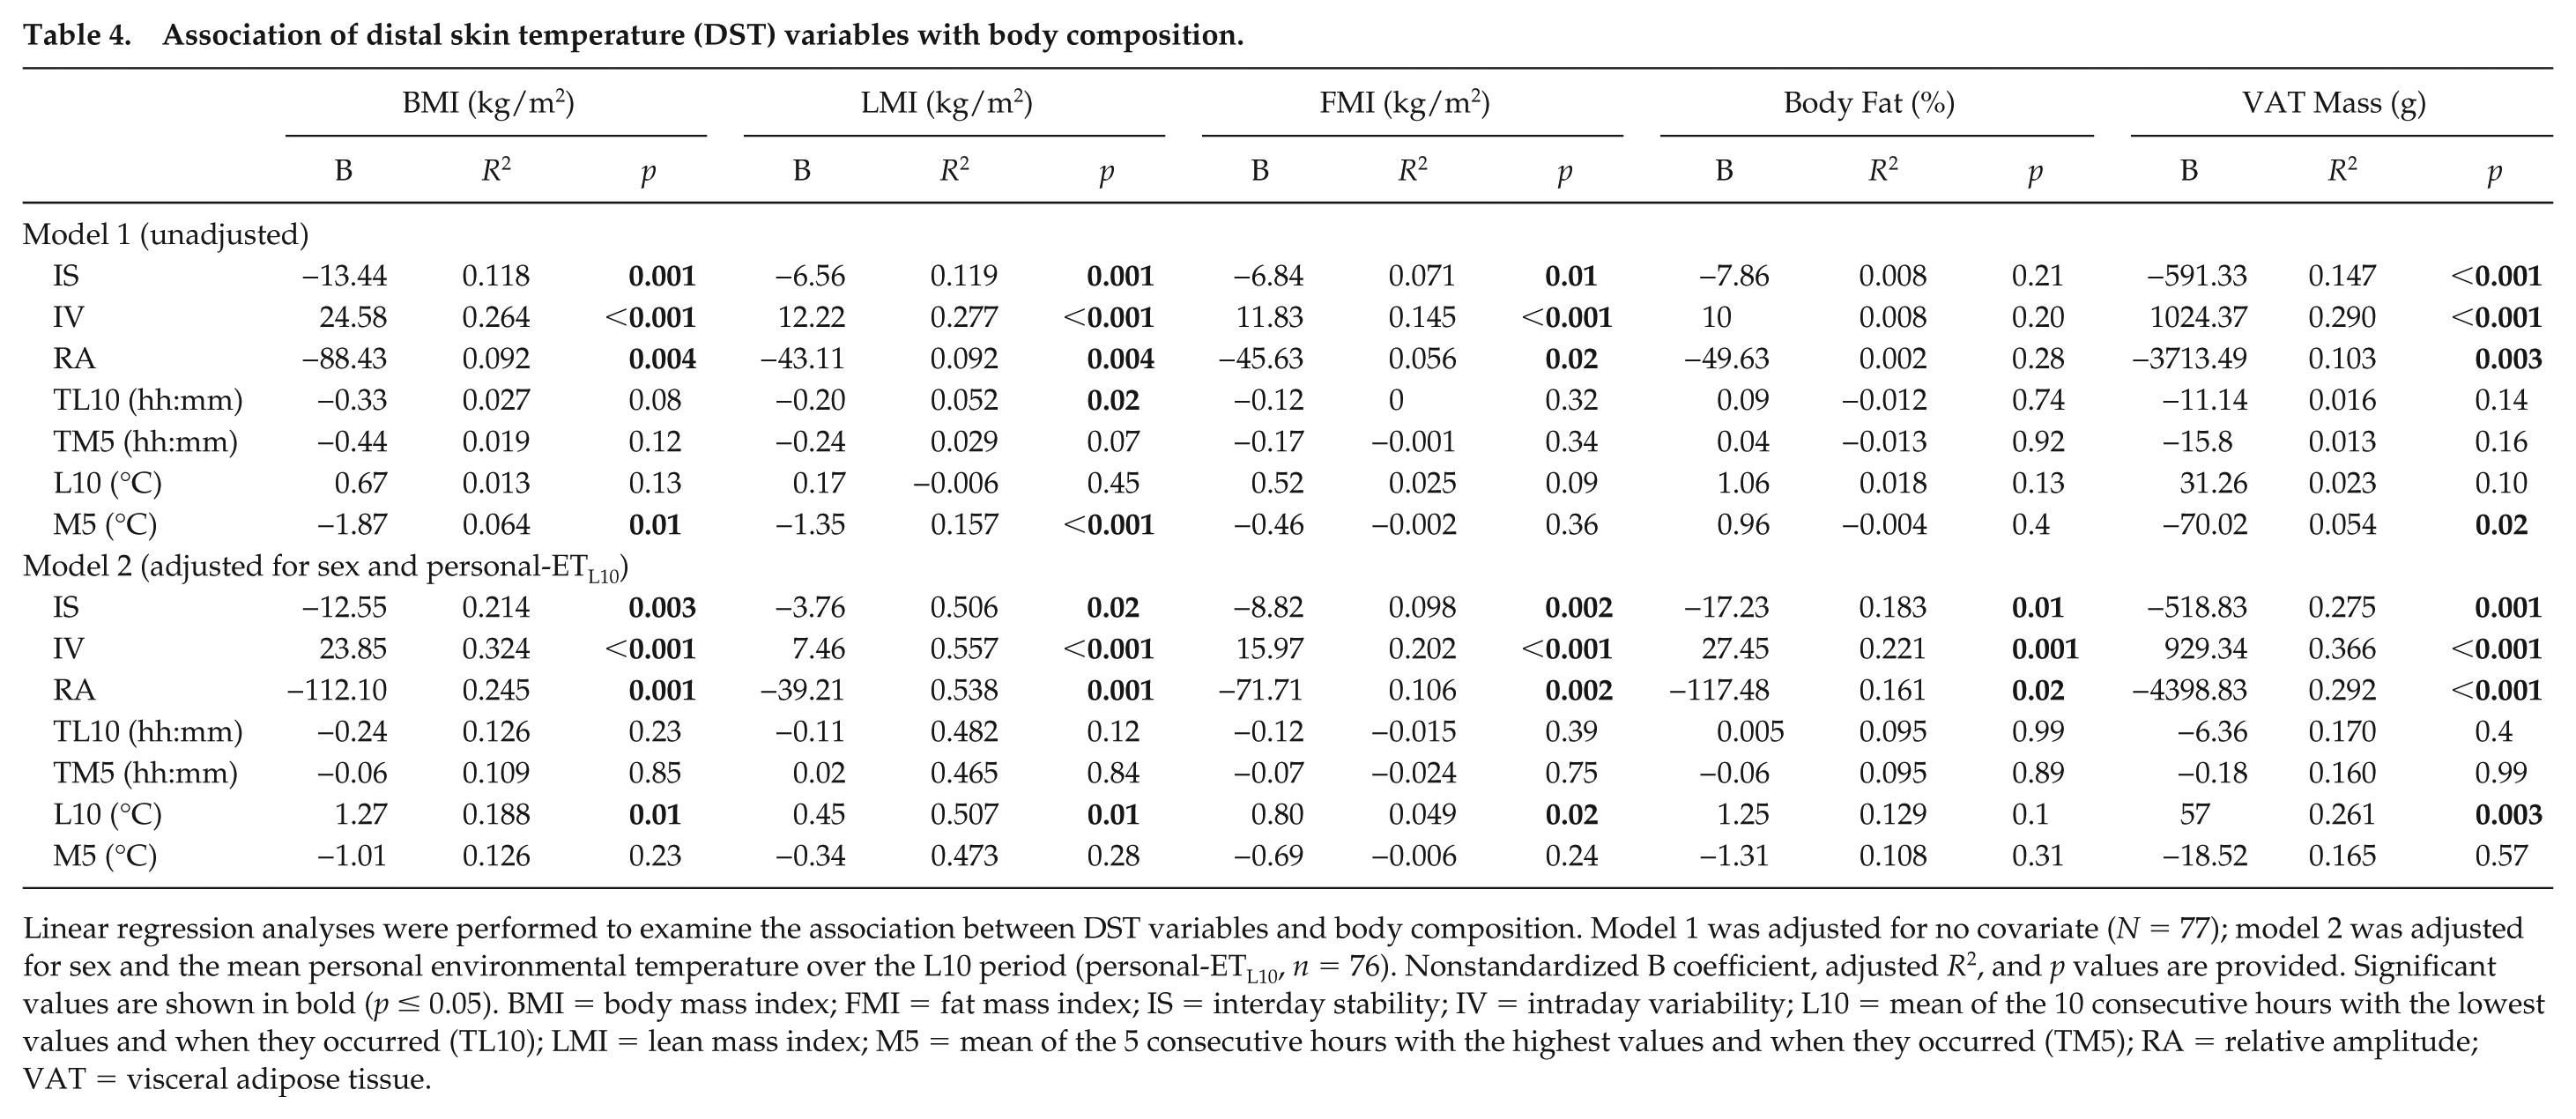
Linear regression analyses were performed to examine the association between DST variables and body composition. Model 1 was adjusted for no covariate (N = 77); model 2 was adjusted for sex and the mean personal environmental temperature over the L10 period (personal-ETL10, n = 76). Nonstandardized B coefficient, adjusted R2, and p values are provided. Significant values are shown in bold (p ≤ 0.05). BMI = body mass index; FMI = fat mass index; IS = interday stability; IV = intraday variability; L10 = mean of the 10 consecutive hours with the lowest values and when they occurred (TL10); LMI = lean mass index; M5 = mean of the 5 consecutive hours with the highest values and when they occurred (TM5); RA = relative amplitude; VAT = visceral adipose tissue.
After adjusting for sex and personal-ETL10, IS was inversely related (all p ≤ 0.05) to the concentrations of fasting glucose and triglycerides and to the systolic and diastolic blood pressure. RA was inversely related (all p ≤ 0.05) to the concentrations of fasting glucose, insulin, low-density lipoprotein cholesterol (LDL-C), the HOMA index, and diastolic blood pressure (Table 5, model 2). Further, IS was directly associated with cardiorespiratory fitness, and both IS and RA were directly associated with high-density lipoprotein cholesterol (all p < 0.05). In contrast, increasing IV was related to a poorer cardiometabolic profile, showing a direct association with the concentrations of fasting glucose, insulin, and LDL-C with the HOMA index and the systolic and diastolic pressure and an inverse relationship with cardiorespiratory fitness (all p ≤ 0.05, only in Table 5, model 2 analysis). It should be noted that a higher L10 was associated with a higher fasting glucose concentration and a higher diastolic blood pressure (all p ≤ 0.05).
Association between distal skin temperature (DST) variables and cardiometabolic profile.
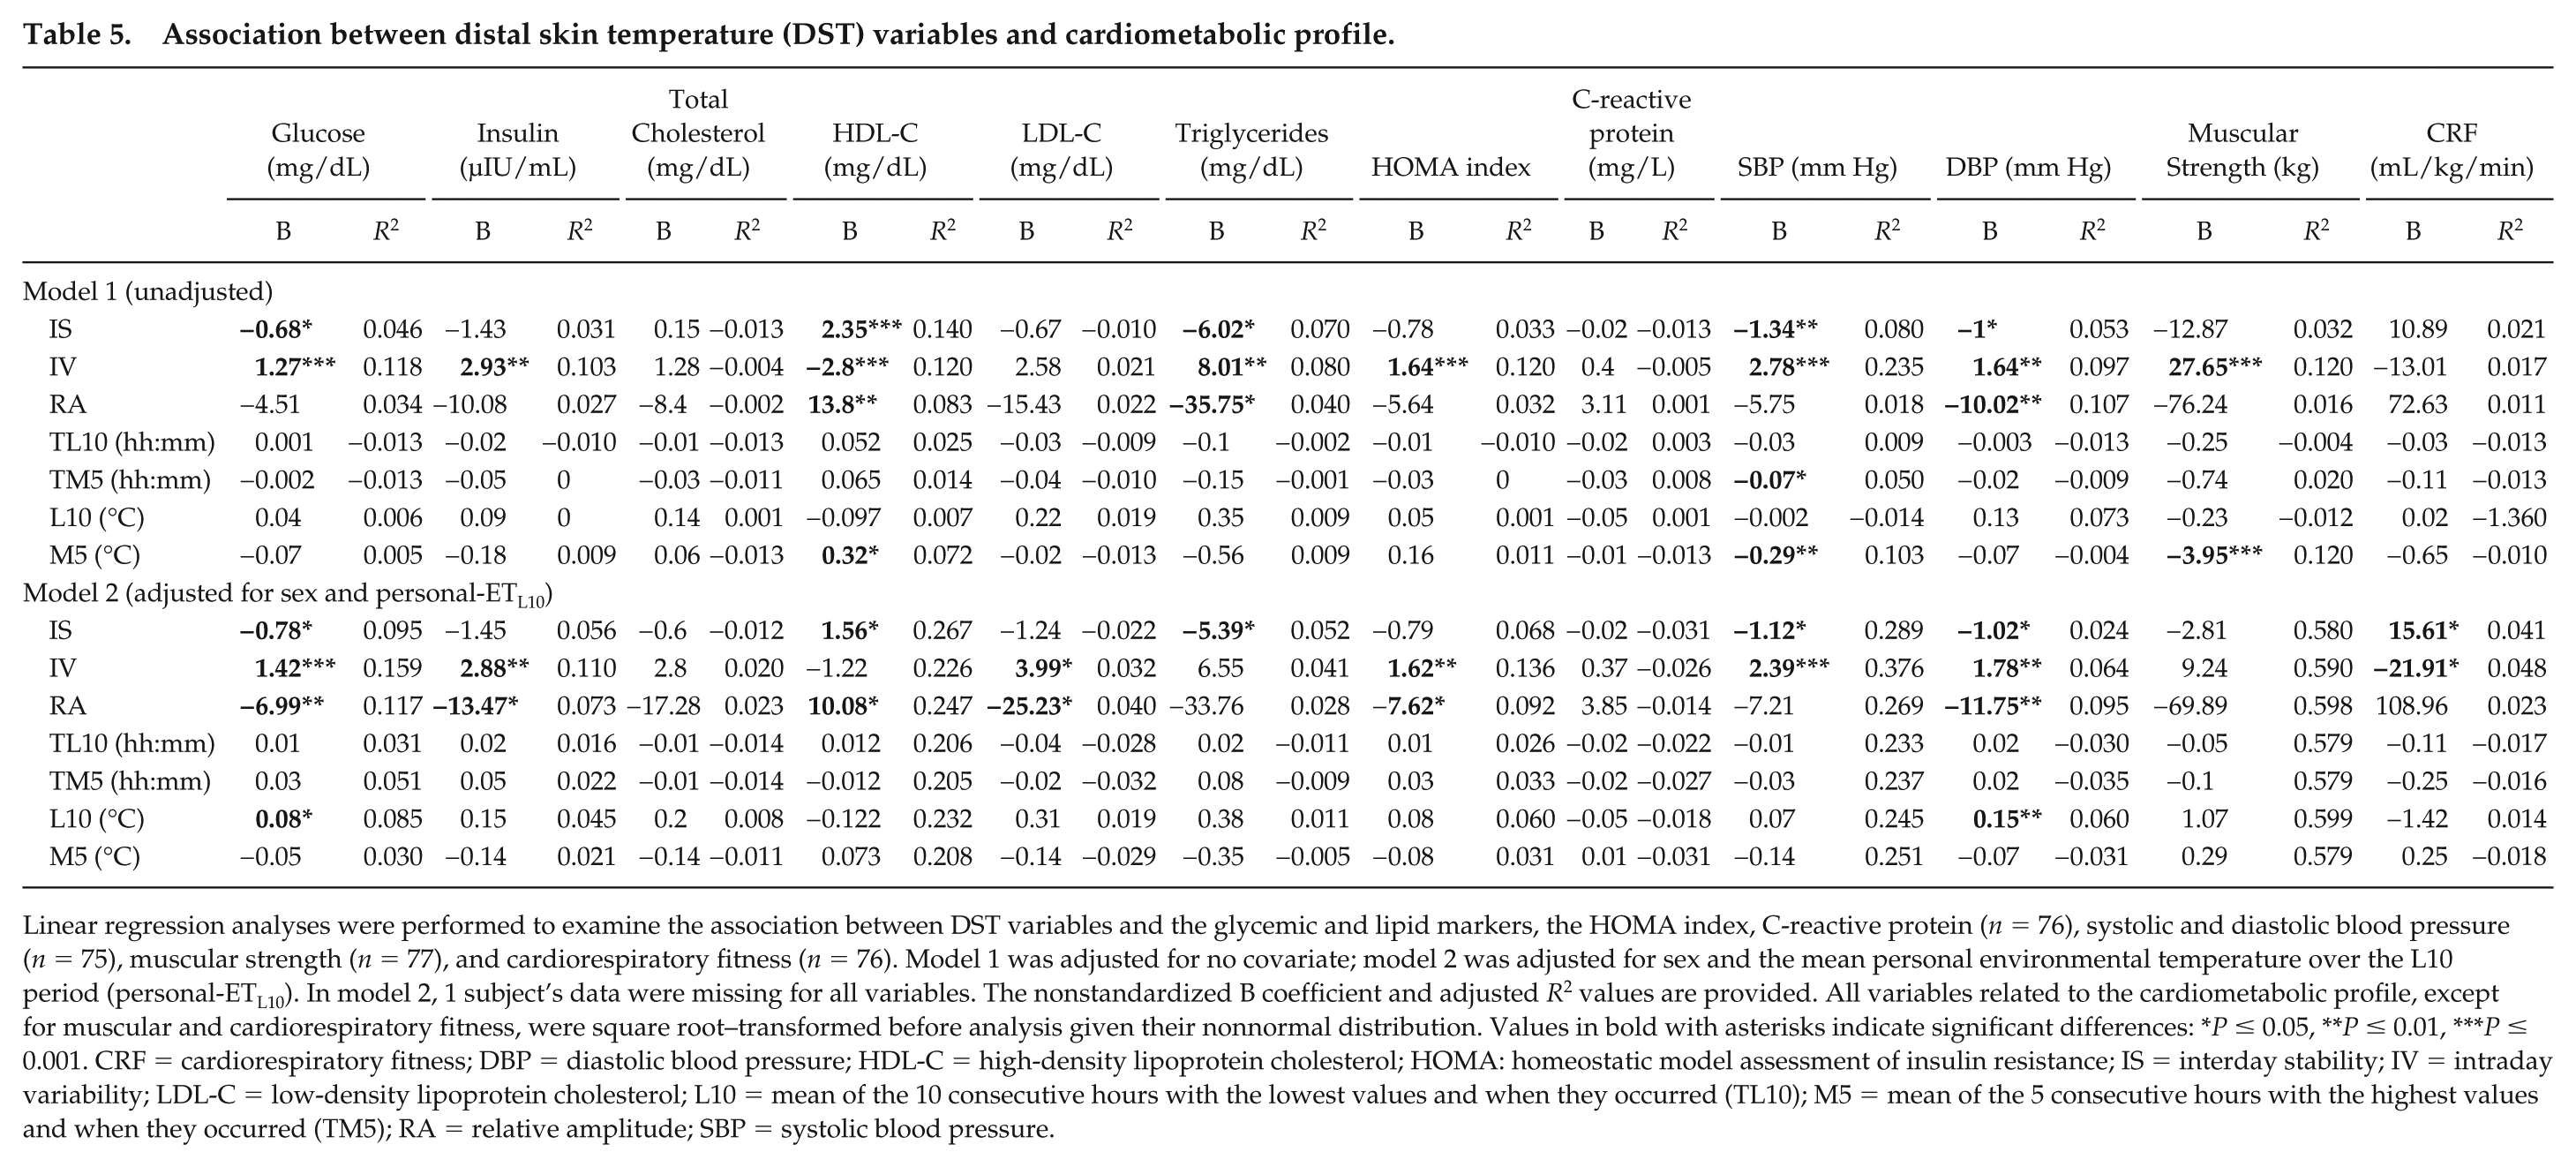
Linear regression analyses were performed to examine the association between DST variables and the glycemic and lipid markers, the HOMA index, C-reactive protein (n = 76), systolic and diastolic blood pressure (n = 75), muscular strength (n = 77), and cardiorespiratory fitness (n = 76). Model 1 was adjusted for no covariate; model 2 was adjusted for sex and the mean personal environmental temperature over the L10 period (personal-ETL10). In model 2, 1 subject’s data were missing for all variables. The nonstandardized B coefficient and adjusted R2 values are provided. All variables related to the cardiometabolic profile, except for muscular and cardiorespiratory fitness, were square root–transformed before analysis given their nonnormal distribution. Values in bold with asterisks indicate significant differences: *P ≤ 0.05, **P ≤ 0.01, ***P ≤ 0.001. CRF = cardiorespiratory fitness; DBP = diastolic blood pressure; HDL-C = high-density lipoprotein cholesterol; HOMA: homeostatic model assessment of insulin resistance; IS = interday stability; IV = intraday variability; LDL-C = low-density lipoprotein cholesterol; L10 = mean of the 10 consecutive hours with the lowest values and when they occurred (TL10); M5 = mean of the 5 consecutive hours with the highest values and when they occurred (TM5); RA = relative amplitude; SBP = systolic blood pressure.
Discussion
The present results show that a more flattened, fragmented, and less stable DST daily rhythm is associated with a lower BAT 18F-FDG uptake, although the variance these differences explain is relatively small (~5%-14%). However, these associations became nonsignificant after adjusting for sex and the habitual temperature to which subjects were exposed during the week that DST was measured. Taken together, these findings suggest that the relationship between the functioning of the circadian system (indirectly measured by the daily rhythm of DST) and BAT variables is masked by environmental and behavioral factors under free-living conditions. Importantly, the participants exposed to a colder personal-ET had a lower DST throughout the day and had a 3 to 5 times greater BAT volume and activity (high BAT tertile) compared with those who were exposed to a warmer personal-ET (low BAT tertile). A more flattened, fragmented, and less stable DST daily rhythm was also associated with a higher BMI and body fat accumulation and a poorer cardiometabolic profile, suggesting that chronodisruption may result in adverse health effects.
Despite the growing evidence suggesting the importance of proper circadian rhythmicity in the preservation of metabolic homeostasis, in humans, the interaction between the biological clock and the metabolic activity of BAT has only recently been addressed. Lee et al. (2016) reported that the thermogenic response of the BAT (measured by supraclavicular skin temperature profiling) was coupled with glycemic excursions in young healthy adults. Via in vivo and in vitro experiments, these authors were able to show that this circadian coupling was accompanied by changes in the expression of UCP1, GLUT4, and Rev-erb alpha. However, it should be noted that the supraclavicular skin temperature is only a proxy of BAT activity (Boon et al., 2014; van der Lans et al., 2016) and that it is influenced by body composition (Gatidis et al., 2016). Indeed, the supraclavicular fossa is surrounded by blood vessels, skeletal muscles, and lymph nodes (among others; Kellman et al., 1987). Consequently, changes in the supraclavicular skin temperature are more likely to be a response to blood perfusion than to BAT thermogenic activity. Clearly, more studies are needed to clarify the relationship between the biological clock and BAT function in humans. In line with Lee et al. (2016), the present results initially suggested a link between DST daily rhythm and BAT 18F-FDG uptake. In fact, those subjects who had a lower quality DST daily rhythm also had a lower 18F-FDG uptake (although only a small part of BAT 18F-FDG uptake variance was explained by DST variables). This would seem coherent since subjects with a disrupted circadian system (i.e., lower IS and RA, higher fragmentation, phase advance or delay)—a consequence of their social habits—would be more likely to have altered behavioral and physiological responses (Garaulet et al., 2010a, 2010b), which might extrapolate to BAT function.
However, when the analyses were adjusted for sex and personal-ETL10 or evaluation wave, the previous associations disappeared. The observed relationship between the DST daily rhythm and BAT volume and activity was therefore greatly influenced by the effect of the ambient temperature to which the participants were exposed. This is probably explained in that both physiological responses are sympathetically driven. The fact that this relationship is masked by environmental factors suggests that when searching for strategies to optimize BAT function and its potential health benefits, simply modifying human behavior (e.g., exposure to cold and modifying clothing) would be more efficient than designing strategies to exploit diurnal fluctuations (if they exist) in BAT activity. Accordingly, the subjects who were exposed to a lower personal-ET, during both the day and night, were those with the highest BAT volume, metabolic activity, and SUVpeak (high BAT tertile); indeed, they were 3 to 5 times those of the subjects in the low BAT tertile (see Fig. 3C, F, and I; Suppl. Table S1). In line with the present results, previous studies have shown that the day when the 18F-FDG–PET/CT scan is performed is related to BAT volume and activity (Bahler et al., 2016) and that environmental temperature and personal-ET are inversely related to these BAT measures (Au-yong et al., 2009; Martinez-Tellez et al., 2018; Ouellet et al., 2011). A better understanding of the mechanisms underlying the relationship between chronic exposure to cold and BAT function is needed. For instance, beyond the effect of seasonality, it might be possible that the subjects in the present low BAT tertile had a low tolerance to cold exposure and therefore would expose themselves to a higher personal-ET or use more strongly insulating clothing (i.e., relying more on their behavior for thermoregulation than on endogenous forms of heat production such as BAT thermogenesis). It may also be that the subjects with a DST daily rhythm of lower quality relied more on vasomotor responses, again suggesting that they are more behaviorally responsive and do not rely so much on thermogenesis. Future studies are warranted to examine the factors that influence chronic exposure to low temperatures and induce a higher reliance on thermogenic processes.
A temperature increase during the night phase was recorded, concordant with the reduction in core body temperature recorded at sleep onset (see Figs. 1 and 3; Kräuchi et al., 1999; Kräuchi and Wirz-Justice, 1994; Martinez-Nicolas et al., 2017; Sarabia et al., 2008). Earlier research in adult humans showed an increase in DST during the night to be associated with shortened sleep latency as well as an increase in sleep time and depth (Kräuchi et al., 1999; Raymann et al., 2007), demonstrating a link between the thermoregulatory and sleep centers (Glotzbach and Heller, 1976; Kumar and Kumar, 2004). Interestingly, the TM5 (an indicator of midsleep time point and sleep onset) of the present subjects showed a weak inverse association with BAT SUVmean, even after adjustment for sex, personal-ETL10, and body composition variables (data not shown). However, when analyses were performed to see whether the midsleep time point or chronotype of the subjects (assessed using the Munich Chronotype Questionnaire; see supplementary material) were related to the BAT volume, SUVmean, and SUVpeak, no association was found. In addition, DST showed an initial reduction followed by an increase during the postprandial state, which may be indicative of peripheral vasoconstriction and vasodilation (respectively) and the redistribution of blood flow to ensure proper nutrient digestion, absorption, and distribution (Martinez-Tellez et al., 2019). There was also a reduction in the DST after the participants woke up, in a manner of phase that was opposed to the increase in core temperature and morning heat production peak (Kräuchi and Wirz-Justice, 1994; Martinez-Tellez et al., 2019).
Current knowledge supports the hypothesis that the disruption of the circadian system is associated with obesity and altered metabolism, probably explained by the desynchronization of different organ- or pathway-specific circadian rhythms (Froy, 2010; Garaulet et al., 2010a, 2010b). Indeed, it has been shown that a disrupted DST daily rhythm is a predictor of a lower weight-loss effectiveness (Bandín et al., 2014) and that it is related to certain features of metabolic syndrome (Corbalán-Tutau et al., 2011). Accordingly, the present results show that a more flattened, more fragmented, and less stable DST daily rhythm is associated with a higher BMI, greater body fat accumulation (all p ≤ 0.03; Table 4), and a poorer cardiometabolic profile (see Table 5), even after adjusting for sex and personal-ET. It is also noteworthy that greater stability and lesser fragmentation showed an association with greater cardiorespiratory fitness (after adjustment for sex and personal-ETL10), a major predictor of cardiovascular health (Kodama, 2009). The fact that a reduction in L10 was related to lower fasting glucose concentrations and a lower diastolic blood pressure reinforces the idea that chronic exposure to colder temperatures might have health benefits (reducing the risk of type 2 diabetes and cardiovascular disease). The only previous experiment examining the relationship of DST daily patterns with obesity and cardiometabolic risk factors (Corbalán-Tutau et al., 2011) did not examine whether their results were independent of the personal-ET to which participants were exposed, generating a potential bias.
The skeletal muscles may also play a key role in nonshivering thermogenesis (Betz and Enerbäck, 2017; Palmer and Clegg, 2017) via the interaction between sarcolipin and the sarcoplasmic/endoplasmic reticulum calcium ATPase (SERCAs) enzymes. This may be especially important in large mammals (such as humans), in which BAT content is small in relation to body size. In the present work, no relationship was seen between the DST rhythm and skeletal muscle 18F-FDG uptake during cold exposure, but it should be remembered that this may not be the best way to indirectly assess nonshivering thermogenesis, which is influenced by muscle tension and shivering thermogenesis. Further, mild cold exposure is likely to predominantly promote the oxidative metabolism of fat (Acosta, Martinez-Tellez et al., 2018).
The present work suffers an inherent limitation of studies with a cross-sectional design: no causal relationships can be discerned. In addition, for logistic reasons, no control over how participants dressed during the DST measurements was enforced, and some of the associations found were weak and may have been influenced by the error generated by multiple comparisons. Further, given the highly radioactive nature of 18F-FDG–PET/CT scans, BAT rhythmicity was not assessed (only 1 measurement was made). It might therefore be argued that the present results are influenced by the cross-subject temporal variation in BAT 18F-FDG uptake. However, when it was examined whether BAT 18F-FDG uptake measures were related to the time of the day when they were made, no relationship was seen (see Suppl. Fig. S2). Despite being the most extensively used technique for measuring BAT activity, 18F-FDG–PET/CT scanning also has some limitations that might prevent cold-induced BAT metabolic activity from being accurately estimated; the method provides a measure of glucose metabolism while fatty acids are the main substrate for human brown adipocytes (Schilperoort et al., 2016). Whether the present findings will be reproduced when other radiotracers such as 15O-oxygen, 11C-acetate, or 18F-fluoro-6-thia-heptadecanoic acid are used to quantify BAT metabolism remains to be seen. Further studies investigating the relationship between BAT function and the circadian rhythm of a wider range of physiological markers not sympathetically driven or conditioned by the environmental temperature are warranted. Moreover, studies under well-controlled laboratory conditions, such as those using misalignment protocols (e.g., recurring non–24-h behavioral cycle) are needed to examine the relative contribution of the endogenous circadian cycle (e.g., DST daily rhythm) to BAT metabolic activity, independent of behavioral factors.
In conclusion, the possible relationship between circadian functioning (indirectly measured via the daily rhythm of DST) and BAT 18F-FDG uptake is masked by environmental and likely behavioral factors. The subjects exposed to the lowest personal-ET had the lowest DST throughout the day and had BAT volume and activity values 3 to 5 times those of subjects exposed to higher personal-ETs. Further studies examining which factors influence persons to seek chronic exposure to lower temperatures, and thus rely more strongly on thermogenic processes, are warranted.
Supplemental Material
Supplementary_Material_Final – Supplemental material for Relationship between the Daily Rhythm of Distal Skin Temperature and Brown Adipose Tissue 18F-FDG Uptake in Young Sedentary Adults
Supplemental material, Supplementary_Material_Final for Relationship between the Daily Rhythm of Distal Skin Temperature and Brown Adipose Tissue 18F-FDG Uptake in Young Sedentary Adults by Francisco M. Acosta, Borja Martinez-Tellez, Denis P. Blondin, François Haman, Patrick C. N. Rensen, Jose M. Llamas-Elvira, Antonio Martinez-Nicolas and Jonatan R. Ruiz in Journal of Biological Rhythms
Footnotes
Acknowledgements
We are grateful to Guillermo Delgado-Sánchez for assistance in the critical review of this article. This study was supported by the Spanish Ministry of Economy and Competitiveness via the Fondo de Investigación Sanitaria del Instituto de Salud Carlos III (PI13/01393, CIBERFES grant [CB16/10/00239] and 19899/GERM/15 [co-financed by FEDER]) and PTA-12264, Retos de la Sociedad (DEP2016-79512-R) and European Regional Development Funds (ERDF), the Spanish Ministry of Education (FPU13/04365 and FPU 15/04059), the Fundación Iberoamericana de Nutrición (FINUT), the Redes Temáticas de Investigación Cooperativa RETIC (Red SAMID RD16/0022 and RD16/0022), the AstraZeneca HealthCare Foundation, the University of Granada Plan Propio de Investigación 2016–Excellence actions: Unit of Excellence on Exercise and Health (UCEES), and Plan Propio de Investigación 2018, Programa Contratos-Puente, and the Junta de Andalucía, Consejería de Conocimiento, Investigación y Universidades (ERDF: SOMM17/6107/UGR). This study is part of a PhD thesis defended in the Biomedicine Doctoral Studies Programme of the University of Granada, Spain. Part of this study was presented as an oral communication at the 7th International Conference on the Physiology and Pharmacology of Temperature Regulation (PPTR, Split, Croatia, October 2018).
Authors’ Contributions
FAM, BM-T, JML-E, AM-N, and JRR designed the research; FAM and BM-T conducted the research; JML-E and JRR provided essential reagents and materials; FAM, BM-T, and AMN analyzed data or performed statistical analysis; FAM wrote the manuscript; FAM, BM-T, DPB, FH, PCNR, JML-E, AM-N, and JRR performed a critical review of the manuscript and provided scientific assistance; JRR had primary responsibility for final content.
Conflict of Interest Statement
The authors have no potential conflicts of interest with respect to the research, authorship, and/or publication of this article.
Notes
References
Supplementary Material
Please find the following supplemental material available below.
For Open Access articles published under a Creative Commons License, all supplemental material carries the same license as the article it is associated with.
For non-Open Access articles published, all supplemental material carries a non-exclusive license, and permission requests for re-use of supplemental material or any part of supplemental material shall be sent directly to the copyright owner as specified in the copyright notice associated with the article.