
Abstract
PAS domain–containing proteins can act as environmental sensors that capture external stimuli to allow coordination of organismal physiology with the outside world. These proteins permit diverse ligand binding and heterodimeric partnership, allowing for varied combinations of PAS-dependent protein-protein interactions and promoting crosstalk among signaling pathways. Previous studies report crosstalk between circadian clock proteins and the aryl hydrocarbon receptor (AhR). Activated AhR forms a heterodimer with the circadian clock protein Bmal1 and thereby functionally inhibits CLOCK/Bmal1 activity. If physiological activation of AhR through naturally occurring, endogenous ligands inhibits clock function, it seems plausible to hypothesize that decreased AhR expression releases AhR-induced inhibition of circadian rhythms. Because both AhR and the clock are important regulators of glucose metabolism, it follows that decreased AhR will also alter metabolic function. To test this hypothesis, rhythms of behavior, metabolic outputs, and circadian and metabolic gene expression were measured in AhR-deficient mice. Genetic depletion of AhR enhanced behavioral responses to changes in the light-dark cycle, increased rhythmic amplitude of circadian clock genes in the liver, and altered rhythms of glucose and insulin. This study provides evidence of AhR-induced inhibition that influences circadian rhythm amplitude.
The circadian timing system provides a mechanism to coordinate endogenous physiological processes such as the sleep-wake cycle, locomotion, feeding, and temperature with the cyclic changes of the external environment (Cuninkova and Brown, 2008; Ralph et al., 1990; Rutter et al., 2002). Circadian rhythms are generated by core clock genes that form transcriptional and translational feedback loops, controlling their own mRNA and protein levels. Specifically, the Per, Arnt, Sim (PAS)-containing proteins Circadian locomotor output cycles kaput (Clock) and brain muscle aryl hydrocarbon receptor nuclear translocator-like (Bmal1) form a heterodimer and bind to enhancer-box (E-box) regions upstream of the PAS domain–containing clock genes Period 1 (Per1), Period 2 (Per2), and Period 3 (Per3) and two Cryptochrome (Cry) genes: Cryptochrome 1 (Cry1) and Cryptochrome 2 (Hastings et al., 1999; Shearman et al., 1997; Sun et al., 1997; Tei et al., 1997). Per and Cry proteins form a complex in the cytoplasm that translocates back into the nucleus to inhibit Clock and Bmal1 transcription (Hardin et al., 1990; Jin et al., 1999; Lee et al., 2001).
PAS domain–containing proteins commonly function as environmental sensors whose downstream signals are communicated through gene transcription (Chilov et al., 2001; Gu et al., 2000; McIntosh et al., 2010; Moffett et al., 1997; Woods and Whitelaw, 2002). The aryl hydrocarbon receptor (AhR) is a PAS domain protein that has long been recognized for its integral regulation of xenobiotic metabolism. Moreover, physiological activation of AhR appears to underlie its integration with the circadian clock and key metabolic pathways (Kewley et al., 2004; Mukai and Tischkau, 2007). The PAS domain, characteristic of both AhR and several circadian clock proteins, acts as an interactive surface for protein-protein interaction and, in the case of AhR, functions as the binding surface for various ligands that can be endogenous, naturally occurring, and/or anthropogenic (Gu et al., 2000; McGuire et al., 2001; Reisz-Porszasz et al., 1994). PAS domain–containing proteins bind a variety of ligands and are capable of forming diverse heterodimers, allowing for varied combinations of protein-protein interactions with other PAS domain–containing proteins. This allows AhR to interact with other PAS-containing proteins extrinsic to the canonical pathway, enhancing the possibility of activation of myriad signaling pathways (Gu et al., 2000).
Interactions between AhR and the circadian clock are reciprocal. AhR expression is diurnally regulated by Clock/Bmal1 interactions through an E-box DNA binding region within the AhR promoter (Garrison and Denison, 2000; Huang et al., 2002; Richardson et al., 1998; Zhang et al., 2009). AhR transcripts are rhythmic, as is its sensitivity to activation by the canonical agonist 2,3,7,8-Tetrachlorodibenzodioxin (TCDD) (Huang et al., 2002; Mukai et al., 2008; Richardson et al., 1998; Shimba and Watabe, 2009). AhR target genes Cytochrome P450, family 1, member 1A (Cyp1A1) and Cytochrome P450, family 1, subfamily B (Cyp1B1), although expressed at low levels under basal conditions, have a small diurnal expression pattern that is increased during the day, supporting a relationship between the circadian clock and AhR activation (Ko et al., 1996; Mukai et al., 2008).
AhR also directly interacts with the core circadian clock. In the canonical signaling pathway, activated AhR forms a heterodimer with the protein aryl hydrocarbon receptor nuclear translocator (Arnt), which has similar sequence homology to the clock protein Bmal1 (Takahata et al., 1998). However, activated AhR can also heterodimerize with the clock protein, Bmal1 (Hogenesch et al., 1997; Xu et al., 2010). The AhR/Bmal1 heterodimer disrupts normal Clock/Bmal1 binding to the Per1 promoter, resulting in inhibition of Per1 transcription and dampened Per1 rhythmicity in the liver (Xu et al., 2010; Jaeger and Tischkau, 2016). Furthermore, activation of AhR by various ligands, including those derived as photoproducts of tryptophan, can influence clock function (Heath-Pagliuso et al., 1998; Helferich and Denison, 1991; Huang et al., 2002; Mukai et al., 2008; Mukai and Tischkau, 2007; Richardson et al., 1998).
In addition to tryptophan compounds, many AhR ligands are present within the diet, including indole metabolites from cruciferous plants and flavonoids found in fruits and vegetables (Denison and Nagy, 2003). The presence of AhR and its physiological activation of AhR at specific times of day by exposure to dietary AhR agonists may provide a constant inhibition of the circadian clock. This study was designed to examine how decreased AhR expression and/or activation may alter central and peripheral circadian activities. If activation of AhR inhibits clock function, then decreased levels of AhR, using mice genetically deficient in AhR, should enhance clock function. Because the clock is tightly linked to metabolism, alterations in rhythmicity in AhR-deficient mice may also be reflected in changes in clock-regulated metabolic function. This study shows that decreased AhR expression influenced the behavioral response to changes in the light-dark cycle, altered the acrophase (time of peak expression) of glucose and insulin rhythms, and enhanced the amplitude of circadian gene expression. This study provides supportive evidence of the integrated role of AhR in circadian rhythm amplitude and homeostasis.
Materials and Methods
Animals
Animal protocols were approved by Southern Illinois University School of Medicine’s Institutional Animal Care and Use Committee. AhR+/− and WT c57Bl6/J littermates were bred in house from AhR+/−/AhR+/− crosses; these mice have been backcrossed onto the C57Bl6/J background for more than 10 generations (Bradfield strain [Schmidt et al., 1996]) and reared on a 12/12-h light-dark cycle with lights-on at 0700 h. Animals were housed 3 to 4 per cage (30 × 19 × 12.5 cm) within light-tight chambers with circulating air, temperature maintained at 21 °C, and humidity of 44%. Mice used for activity monitoring were individually housed within the chambers. All animals had free access to water and normal chow diet (LabDiet Rodent 5001) (10% fat) unless otherwise stated. Since AhR–/– mice have several developmental defects including liver abnormalities, AhR+/− mice were used.
Experimental Design
At 6 weeks of age, wild-type (WT) and AhR+/− mice (n = 21 mice/genotype) were entrained, synchronizing their endogenous rhythm with the exogenous light cycle, to a control light schedule of 12/12-h light-dark cycles for 2 weeks at a light intensity of 400 lux, where lights were on starting at 2200 h. Mice were randomly assigned to the acute insulin stimulation (see supplemental data) or time course sample collection. Mice were exposed to 15 weeks of control light conditions following the entrainment period. For time course sample collection, 18 mice from each group (wild-type, AhR+/−) were sacrificed by cervical dislocation for tissue collection at 6 time points across a 24-h period (n = 3 mice per time point; 18 mice per genotype). Mice were sacrificed at specific zeitgeber times (ZT) where ZT0 is defined as time of lights-on and ZT12 represents time of lights-off. Sacrifice was performed with lights-on at ZT0, ZT4, ZT8, and ZT12 and lights-off at ZT16 and ZT20 (Suppl. Fig. S1). Sacrifice for time points that occur during the dark phase was performed under dim red light. Tissues were processed as outlined below for each procedure.
Activity Monitoring
To examine behavior, an additional group of wild-type (n = 14) and AhR+/− mice (n = 8) were individually housed in cages fitted with infrared activity detectors (Respironics Mini-Mitter Motion Detector Ref. 130-0065-AA; Mini-Mitter, Bend, OR). To assess endogenous rhythmicity and to determine behavioral responses to altered light schedules, activity monitoring data were collected for 2 weeks on control 12/12-h light-dark cycles, 2 weeks on 6-h phase advance in the timing of lights-off, 2 weeks on 6-h phase delay in lights-off, 2 weeks in constant darkness, and 2 weeks in constant light (Suppl. Fig. S3). ActiView software was used to collect activity data into 10-min bins; threshold was set to 5 counts per minute. Tau, the time to complete 1 cycle of rhythm, was analyzed using the Periodogram chi-square method within the Clocklab software (Actimetrics, Evanston, IL). Average activity during lights-on and lights-off was calculated from actogram counts per minute during the control light-dark schedule. Activity onset (the start of activity) and activity offset (the time of activity termination) were determined by Clocklab software, and time of day was recorded. Actograms are double-plotted with a percentile distribution.
Immunoblotting
Total cellular protein from liver tissue was homogenized in Tissue Protein Extraction Reagent (T-PER; Thermo Scientific) with protease inhibitors (Protease Inhibitor Mini Tablets, EDTA-Free; Pierce) (Protease Inhibitors Cocktail 2-3; Sigma, St. Louis, MO). Total protein (40 µg) was separated on a 10% gel using SDS-PAGE and transferred to a nitrocellulose membrane (Bio-Rad, Hercules, CA). Membranes were immunoblotted overnight at 4 °C with antibodies for AhR (1:500; Santa Cruz, Dallas, TX), Per2 (1:1000; Alpha Diagnostics, San Antonio, TX), and β-Actin (1:4.000; Sigma-Aldrich, St. Louis, MO). Following 1 h of incubation at room temperature with a species-specific secondary antibody, images were taken by a LI-COR Bioscience (Lincoln, NE) system and densitometry was performed using Quantity One software (Bio-Rad, Hercules, CA).
Insulin ELISA and Triglyceride Assay
Immediately following cervical dislocation, whole blood was collected from heart, centrifuged at 367 × g for 20 min to separate plasma, and kept at −80 °C. An Ultra Sensitive Mouse Insulin ELISA Kit from Crystal Chem Inc. (Downer’s Grove, IL) was used according to the manufacturer’s instructions to measure insulin concentrations from ad libitum fed mouse serum collected every 4 h. Briefly, horseradish peroxidase (POD)–conjugated anti-insulin antibody/mouse insulin complex was detected by 3,3′,5,5′-tetramethylbenzidine (TBM) substrate solution. Insulin concentration was determined from the standard curve of absorbance versus standard insulin concentrations.
Total serum triglycerides from serum collected every 4 h from the time course were measured using a triglyceride (glycerol phosphate oxidase) (liquid) reagent set from Pointe Scientific Inc. (Canton, MI) according to the manufacturer’s instructions. Colorimetry assay intensity at a wavelength of 500 nm following incubation of 1:101 plasma:reagent at 37 °C for 5 min was directly proportional to total serum triglyceride levels.
Real-Time qPCR
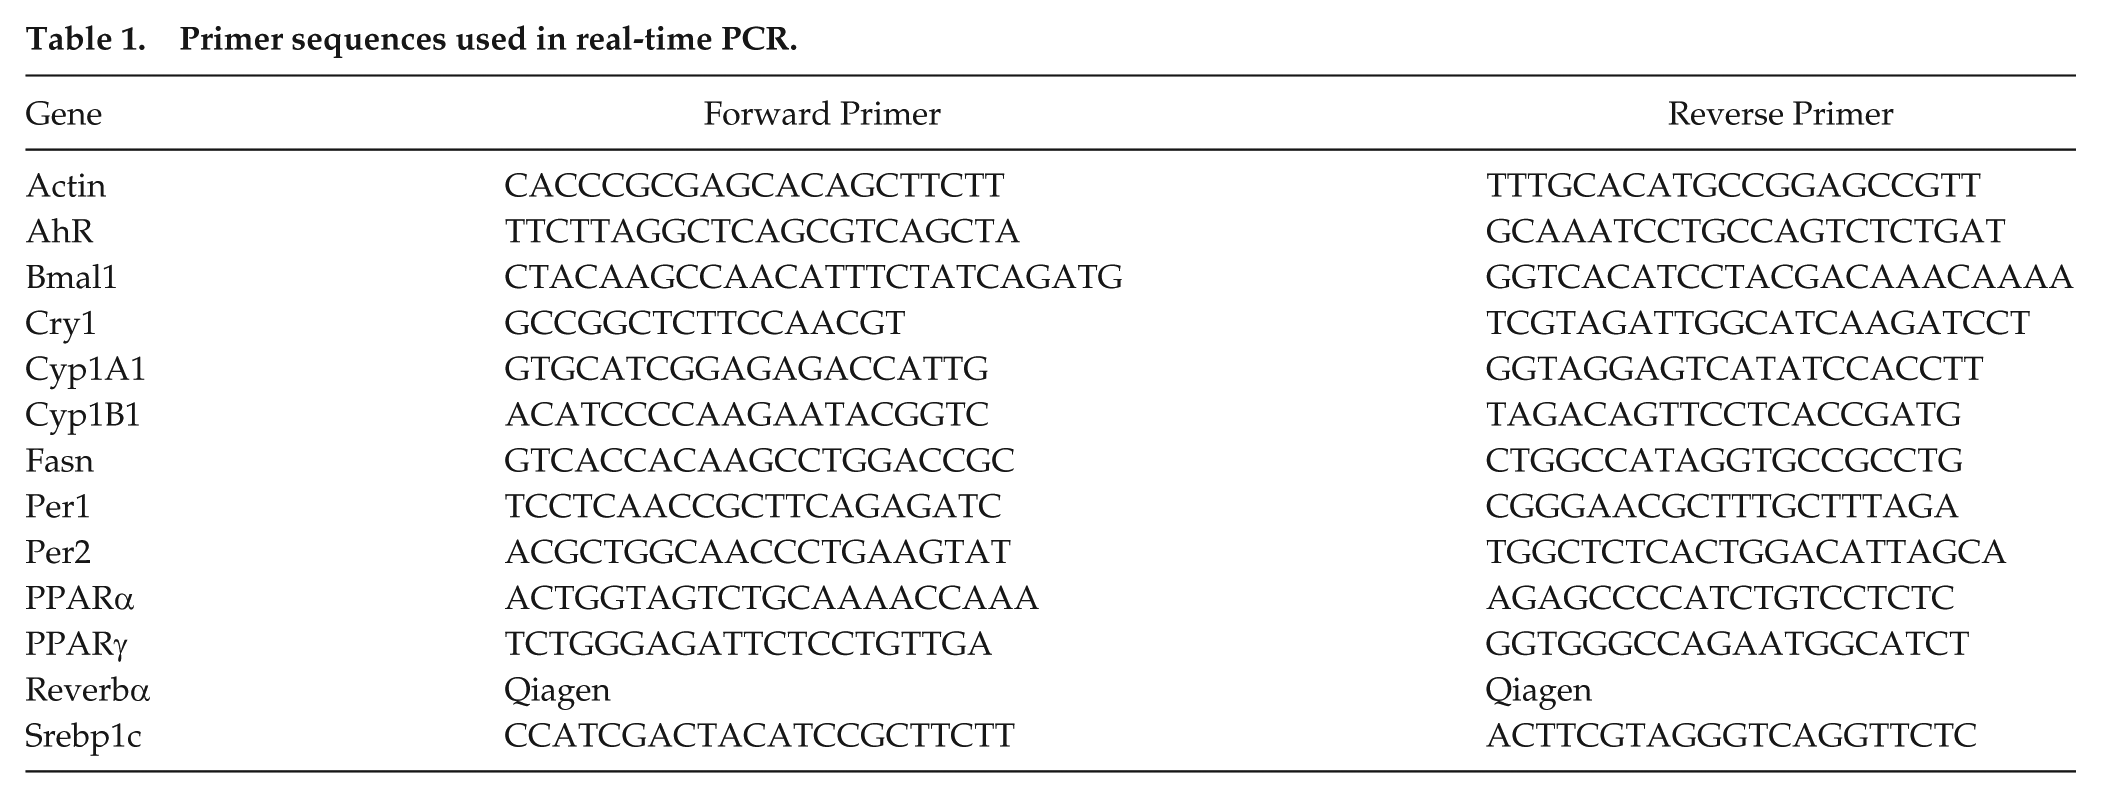
Liver or SCN tissue was snap frozen in liquid nitrogen and stored at −80 °C. TRI-Reagent (Sigma) was used to extract total RNA from liver tissue according to the manufacturer’s instructions. Complementary DNA was synthesized using random primers (Promega; Madison, WI) and reverse transcriptase (Promega). Quantitative polymerase chain reaction (qPCR) was performed using Fast SYBR Green Master Mix (Applied Biosystems; Foster City, CA) in a StepOnePlus Real-Time PCR System (Applied Biosystems). Data were analyzed by StepOne Software v2.1 (Applied Biosystems). Each sample was normalized with β-actin and compared with ZT0 in WT mice, which was set to the value 1. WT and AhR+/− samples for an individual gene were run on the same PCR plate for internal consistency. Each experiment included a negative reverse transcriptase and a negative RNA control. Primer sequences of circadian clock and metabolic genes are listed in Table 1.
Primer sequences used in real-time PCR.
Statistical Analysis
For rhythmic data, 2-way ANOVAs were performed to examine mean differences among independent variables, genotype (2 levels), and time of day (2 levels for Western blot data, 6 levels for PCR data, 24 levels for LD activity data, 10 levels for activity changes in responses to phase shift). The Fisher least significant differences (LSD) post hoc analysis was used to determine statistical significance between genotypes in comparison to the second dependent variable (time of day for PCR and LD activity, days to re-entrain for the re-entrainment experiments). To further investigate rhythmic data, cosinor analysis was performed in RStudio (Version 0.99.484). Cosinor analysis fits rhythmic data with a known period to a smooth line using the least squares regression method. Once the data are fit to a smooth line, amplitude, acrophase, and mesor can be calculated (Refinetti et al., 2007). For activity data, each animal was considered separately; for PCR data, all samples were pooled prior to performing the cosinor analysis. In the case where the only variable is genotype, Student t test was used. In all cases, p < 0.05 was considered significant. Values for significant rhythmicity are listed as amplitude p values (Table 2). Sample variance is represented as ± SEM.
Cosinor analysis.
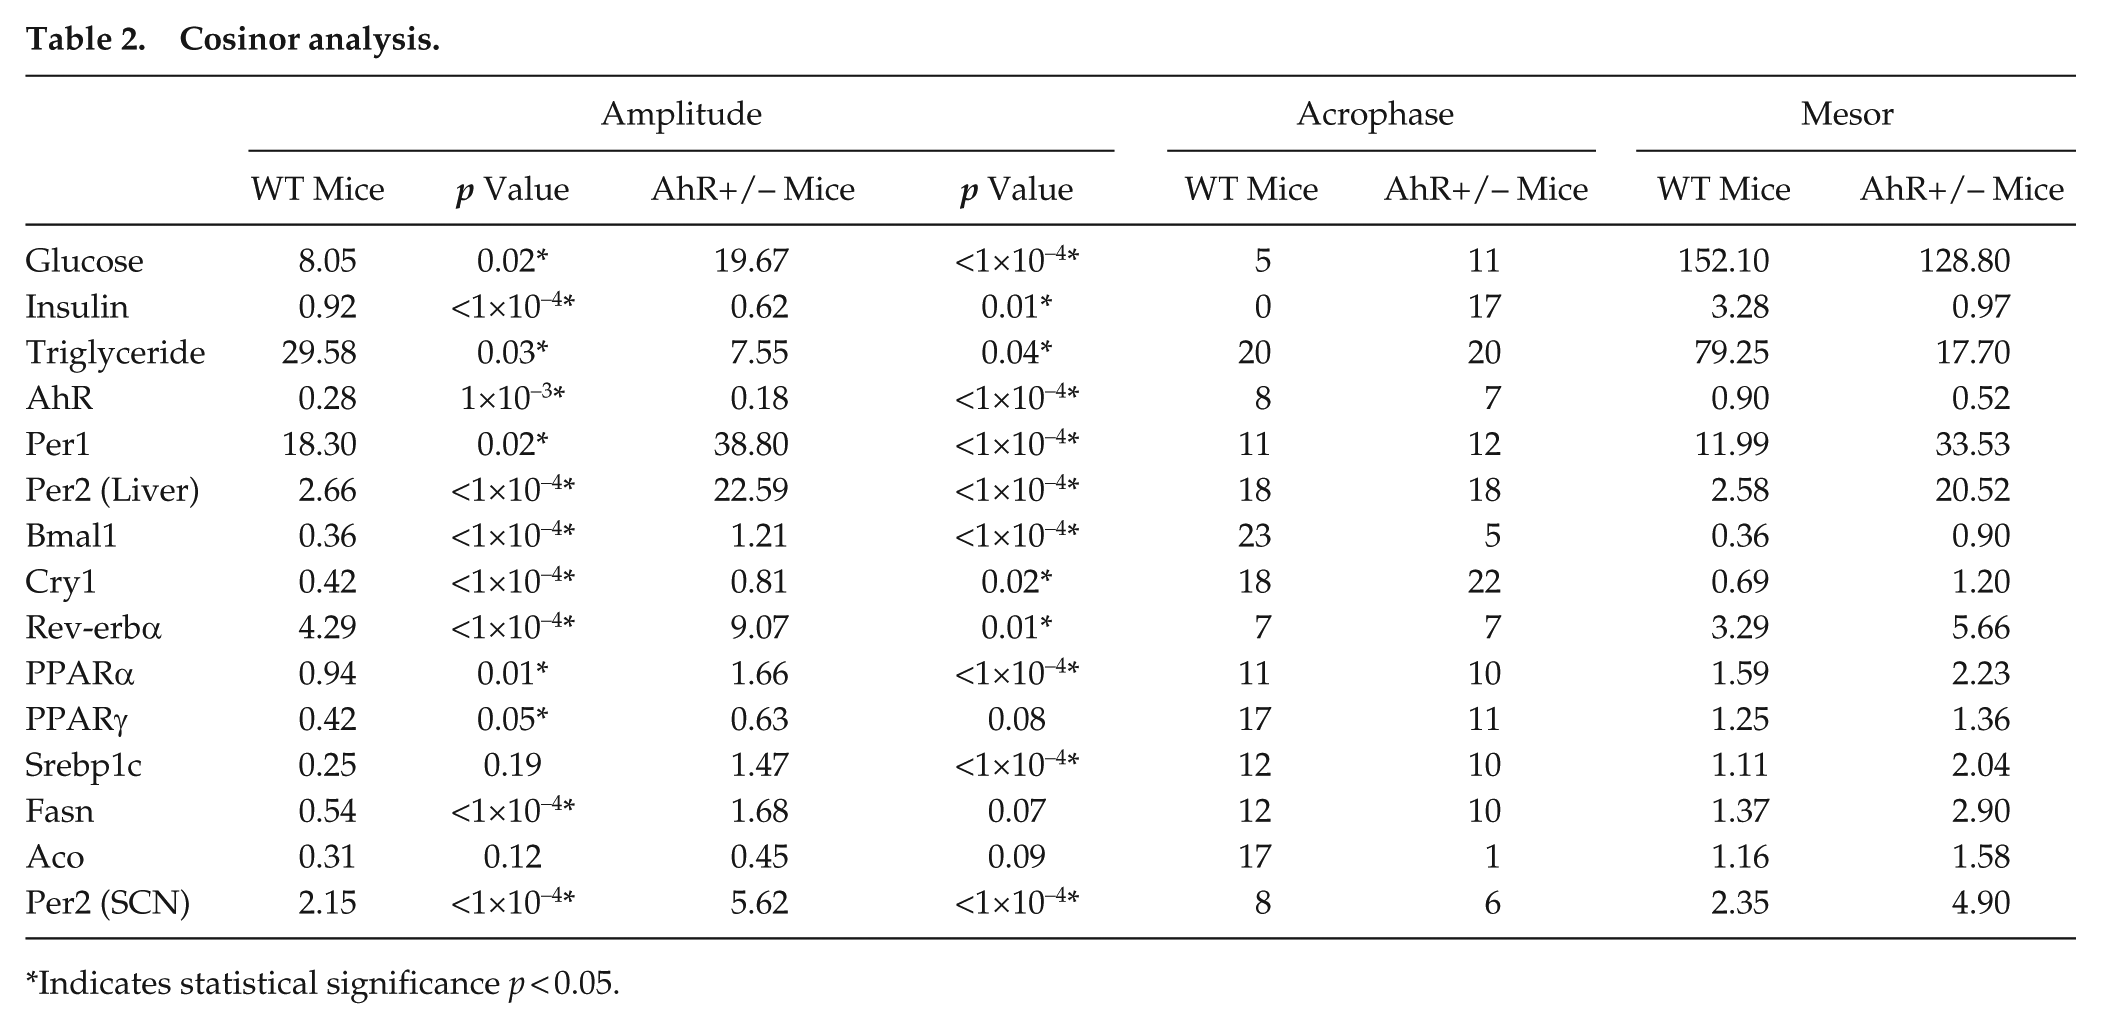
Indicates statistical significance p < 0.05.
Results
AhR+/− Mice Have Reduced AhR and AhR Target Gene Expression
To confirm genotype differences, AhR and AhR target genes Cyp1A1 and Cyp1B1 were measured in the liver of WT and AhR+/− mice. Expression of 1 allele of the AhR gene resulted in an average 50% reduction of AhR mRNA expression in the liver (*p < 0.05, t test, Fig. 1A) (Table 2). AhR mRNA was rhythmically expressed with peak levels occurring at ZT8 in WT mice and ZT7 in AhR+/− mice, according to cosinor analysis (Fig. 1B, Table 2). Two-way ANOVA showed no interaction effect, but main effects were observed for genotype and time of day. AhR protein was decreased by at least 50% in AhR+/− mice (Fig. 1C). For AhR protein, there was no interaction effect between time of day and genotype. AhR protein was suppressed in AhR+/− mice compared with WT regardless of time of day. AhR protein was significantly elevated at ZT12 compared with ZT0 in WT mice; however, no differences between ZT0 and ZT12 were observed in AhR+/− mice (Fig. 1C). Average expression of AhR target genes, Cyp1a1 and Cyp1b1 in liver, measured every 4 h, was significantly reduced in AhR+/− mice (Fig. 1, D and E).
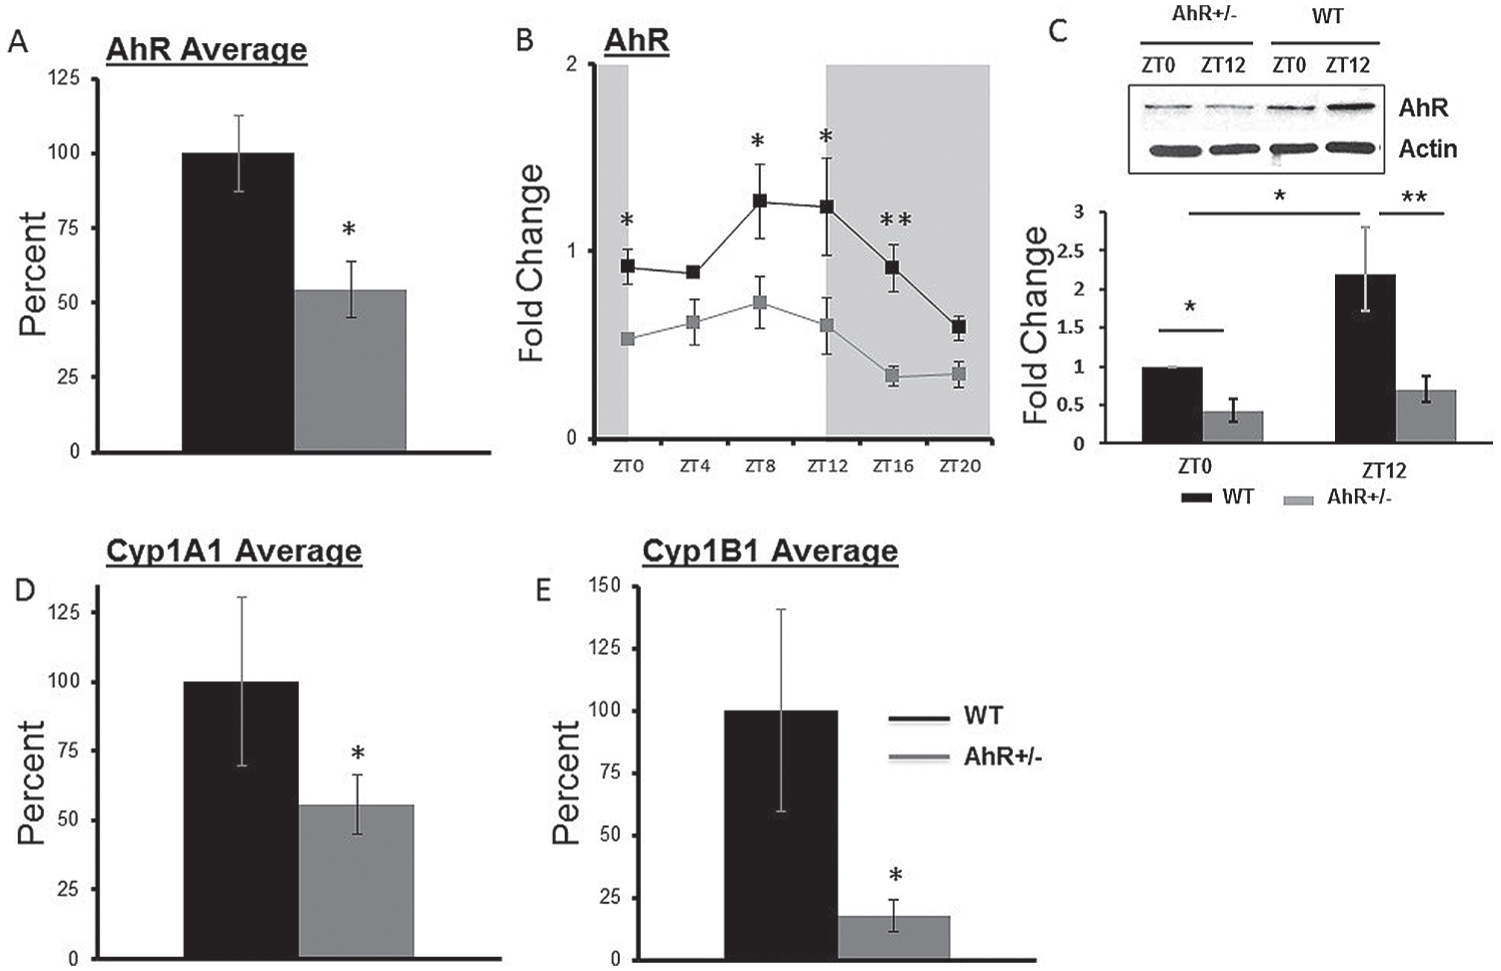
AhR+/− mice have reduced AhR and AhR target gene expression. Liver samples were collected at 4-h intervals; mRNA and protein were analyzed by quantitative PCR and immunoblot, respectively. Data are represented as mean ± SEM (n = 18, 3 per time point). (A) Combined AhR transcript levels in AhR+/− mice compared with WT (*p < 0.05, t test). (B) Diurnal patterns of AhR transcripts: *p < 0.05 and **p < 0.01 between genotypes at the indicated time by 2-way ANOVA with Fisher LSD post hoc analysis. (C) Representative Western blot for AhR with β-actin as a loading control and quantitation below (n = 4): *p < 0.05 and **p < 0.01 indicate statistical significance by 2-way ANOVA with Fisher post hoc analysis. There was no interaction effect between genotype and time of day. (D, E) Transcript levels for AhR target genes Cyp1a1 (t test, *p < 0.05) and Cyp1B1 (*p < 0.05) were reduced in AhR+/− mice.
AhR-deficient Mice Have an Enhanced Response to Light Phase Shifts
Light, the most potent zeitgeber, entrains circadian rhythms to the illumination conditions in the external environment and is arguably the most potent signal to reset the central circadian clock. To determine if AhR status altered the responsiveness of the central clock to light, activity of WT and AhR+/− mice was compared in response to altered light-dark conditions. Representative actograms show activity as determined by infrared detection in WT and AhR+/− mice under LD conditions, after 6-h phase shifts, in DD and in LL (Fig. 2A and Suppl. Fig. S6). Quantitation of LD activity into hourly bins indicates that AhR+/− mice have a small, yet significant increase in activity 3 h before and 2 h after lights-off. Two-way ANOVA revealed an interaction effect between genotype and time of day (Fig. 2B). Following a 6-h advance in lights-off time, AhR+/− mice re-entrained to the new light schedule more quickly than WT mice (Fig. 2, A and C), as determined from analysis of activity onset before and after the phase shift. Additionally, the re-entrainment period in response to a 6-h phase delay was significantly shortened in AhR+/− mice (Fig. 2, A and D), as determined from activity offset before and after the phase shift. In both cases, there was an interaction effect between genotype and time of activity onset during the transition period. The free-running tau under constant darkness was not different between genotypes (WT = 23.96, AhR+/− = 23.98). Under constant light, AhR+/− mice displayed a longer tau than WT animals (25.34 vs. 25.54, *p < 0.05) (Fig. 2A; Suppl. Fig. S6). AhR+/− mice displayed enhanced activity and ability to adapt to changes in the light-dark schedule.
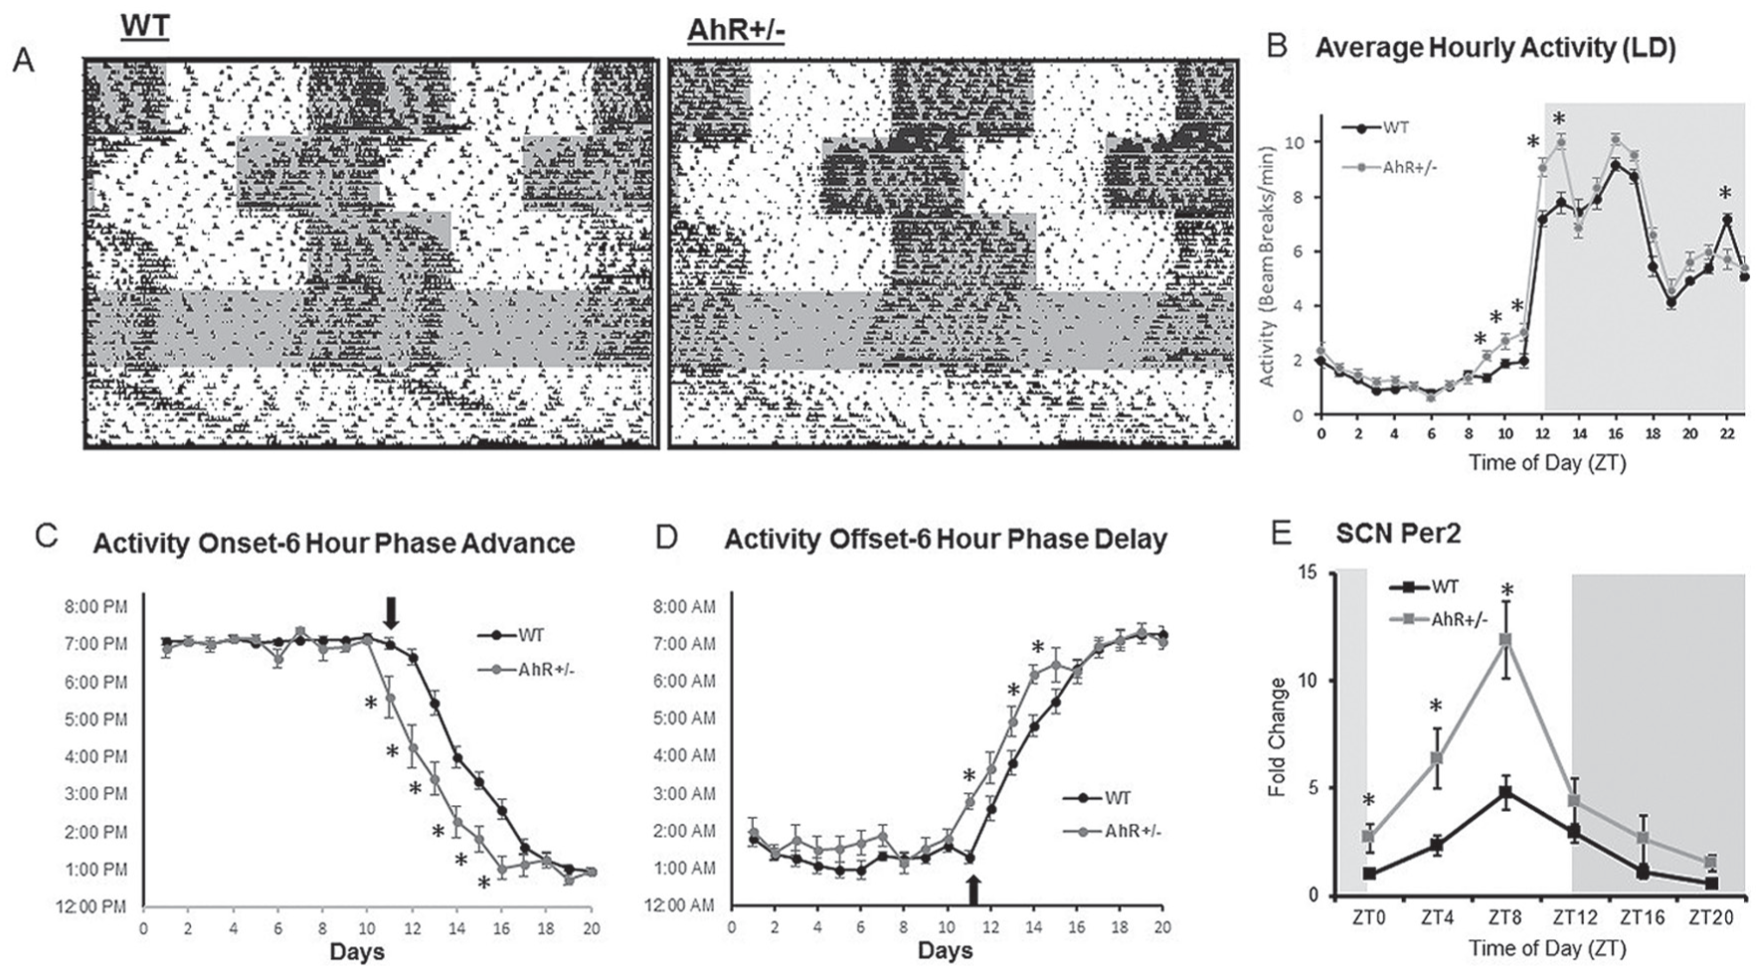
AhR+/− mice have an enhanced response to light phase shifts. Infrared beam detection was used to analyze behavioral responses to altered light-dark schedules. (A) Activity of WT and AhR+/− mice during 2 weeks of light-dark, 2 weeks of phase advance, 2 weeks of phase delay, constant darkness, and constant light are shown in representative actograms. (B) Total lights-on and lights-off activity during the 2-week 12/12-h light-dark cycle was averaged from actogram beam breaks per minute. (C and D) Activity onset and offset were calculated from actograms and Clocklab software. The arrow represents the day of the light shift. Data are represented as mean ± SEM. n = 8-14 per genotype. Averaged activity, onset, and offset are analyzed by 2-way ANOVA with Fisher LSD post hoc analysis (*p < 0.05 between genotypes). An interaction effect was observed between genotype and average activity, activity onset, and activity offset. (E) Per2 transcripts in the SCN. Two-way ANOVA revealed no interaction effect; however, there were main effects of both genotype and time of day (p < 0.03). *Significant (p < 0.05) differences determined by Fisher post hoc analysis. n = 18, 3 per time point.
Per2 transcripts were measured in the SCN from AhR+/− and WT mice as a surrogate for the status of the molecular clock (Fig. 2E). Two-way ANOVA revealed no interaction effect between genotype and time of day. There were main effects of both genotype and time of day, which demonstrates that overall levels of Per2 transcripts are higher in the AhR+/− mice; post hoc analysis indicates that Per2 was significantly elevated during the day in AhR+/− mice. Cosinor analysis demonstrates that Per2 is rhythmic in both AhR+/− and WT mice, but the amplitude of the oscillation is increased from 2.15 in the WT to 5.62 in the AhR+/− mice (Table 2). Acrophase is shifted slightly earlier in the AhR+/− mice.
AhR+/− Mice Have Altered Rhythmicity of Metabolic Outputs
To determine the effect of AhR status on the rhythm of metabolic outputs, we measured glucose, insulin, and triglycerides every 4 h in WT and AhR+/− mice. Determined by cosinor analysis, peak levels of fed serum glucose occur at ZT5 in WT mice. However, the glucose acrophase was shifted to ZT11 in AhR+/− mice. Two-way ANOVA revealed no interaction effect between genotype and time of day. There was a main effect of genotype. Similar to glucose, the acrophase of insulin was shifted in AhR+/− mice (Table 2). For insulin, there was an interaction effect (p < 0.05) of genotype and time of day. Importantly, glucose and insulin rhythms, which are known to parallel each other, maintained their synchronization in AhR+/− mice (Fig. 3, A and B). The acrophase for serum triglycerides was similar in WT and AhR+/− mice (Table 2). Two-way ANOVA revealed an interaction (p < 0.05) between genotype and time of day. Averaged serum glucose, insulin, and triglyceride levels measured across a 24-h period were decreased in AhR+/− mice (Fig. 3, A-F) (Table 2). Additionally, AhR+/− mice had a significant decrease in adipose cell diameter reflecting the inhibitory role of AhR in adipose differentiation (Fig. 3G) (Shimba et al., 2001). For the adipocyte frequency distribution, there was an interaction between genotype and size (p < 0.05). Genotype differences in weight, kilocalorie intake, fasting glucose, H&E staining, glucose and insulin tolerance testing, and acute insulin simulation were similar to previous results (Suppl. Figs. S4 and S5) (Xu et al., 2015).
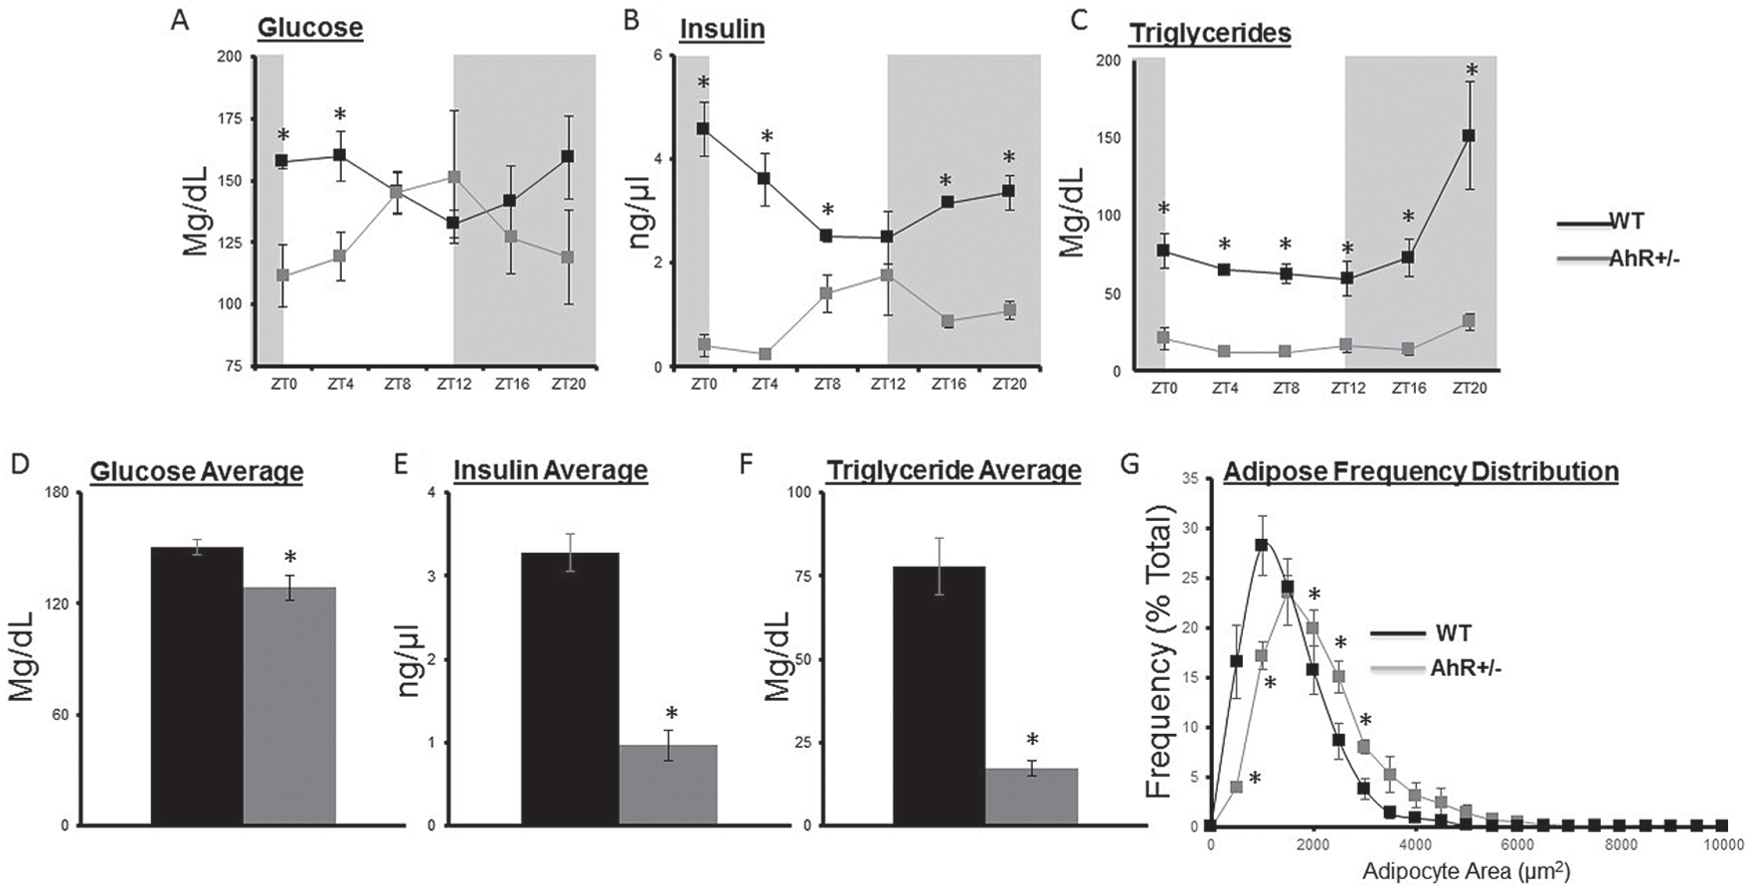
AhR+/− mice have altered glucose, insulin rhythms, and triglyceride. (A) Blood glucose samples were obtained from tail vein at each ZT and analyzed by a True Track blood glucose meter (Ayala et al., 2010). Blood samples collected at the time of sacrifice were used to determine rhythmic levels of (B) insulin, analyzed by ELISA, and (C) triglycerides. Overall averages indicate reduced levels of (D) glucose, (E) insulin, and (F) triglycerides in AhR+/− mice. (G) Adipocyte area, determined by adipose frequency distribution, was reduced in AhR+/− mice. Data are represented as mean ± SEM (n = 18, 3 per time point). Data are analyzed by 2-way ANOVA and cosinor analysis: *p < 0.05 between genotypes using Fisher LSD post hoc analysis (A-C, G) and Student t test (D-F), *p < 0.05. Two-way ANOVA indicates an interaction effect between genotype and time of day for insulin and triglycerides (p < 0.05) but not for glucose.
AhR+/− Mice Have Altered Levels of Circadian and Metabolic Genes
To determine the effect of AhR status on the robustness of transcript rhythms, we compared clock genes, nuclear receptors, and metabolic genes in WT and AhR+/− mice. Molecular components of the primary clock gene feedback loop—Per1, Per2, Bmal1, and Cry1—were measured every 4 h. The amplitudes of core clock gene rhythms were enhanced in AhR+/− mice (Fig. 4, Table 2). Two-way ANOVA revealed no interaction effects but showed significant main effects of time of day and genotype for each of these clock genes, suggesting that the increased amplitudes are significant. To demonstrate that changes in transcript amplitude were accompanied by changes in protein, immunoblot analysis of Per2 was performed at ZT0 and ZT12. Both WT and AhR+/− mice showed increased immunoreactivity for Per2 protein at ZT12 compared with ZT0 (Fig. 4E). Similar to the transcript data, there was no interaction effect, but main effects for time of day and genotype were observed. In concordance with the changes in mRNA, Per2 protein levels were significantly higher in the AhR+/− mice compared with WT at ZT12.
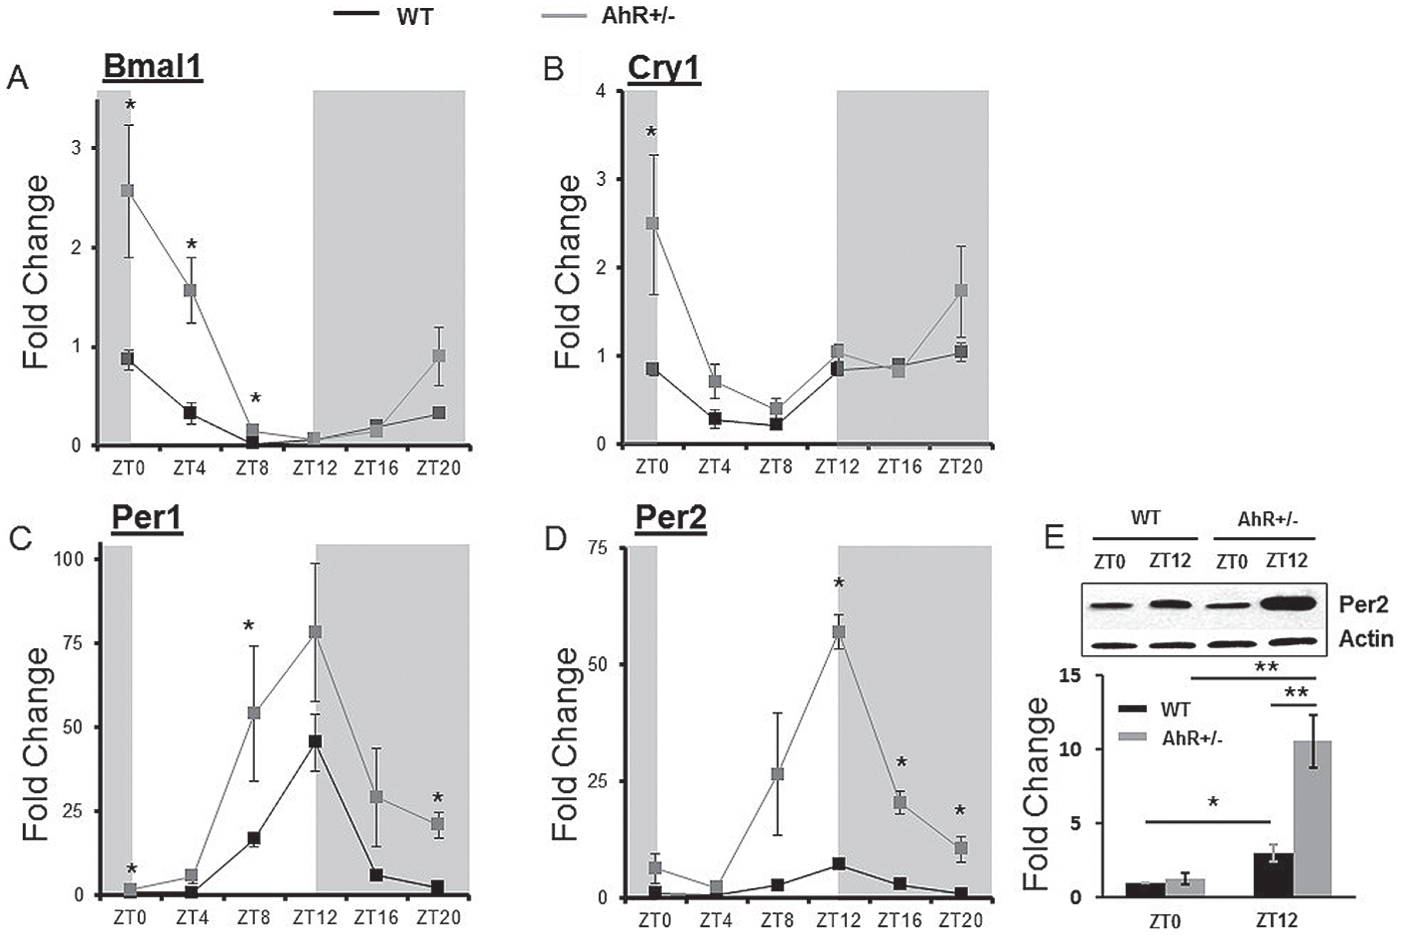
AhR deficiency enhances clock gene rhythmicity. Liver samples were collected at each ZT followed by RNA extraction and cDNA synthesis. Quantitative PCR was used to measure mRNA levels of clock genes. (A) Bmal1 (ANOVA, p = 0.004), (B) Cry1 (ANOVA, p = 0.082), (C) Per1 (ANOVA, p = 0.375), and (D) Per2 (ANOVA, p = 7.2×10⁻⁵) were measured in WT and AhR+/− mice. (E) Per2 protein was assessed by Western blot in liver samples from ZT0 and ZT12, representative blot with β-actin as a loading control; bar graph shows quantitation of all blots. Data are represented as mean ± SEM. n = 18 total, 3 per time point for RNA analysis. n = 4 per time point for protein analysis. Data are analyzed by 2-way ANOVA with Fisher post hoc analysis and cosinor analysis (*p < 0.05). In all cases there was no interaction effect between genotype and time of day, but main effects for both genotype and time of day were observed (p < 0.05).
To examine circadian clock gene outputs, we measured the clock-controlled nuclear receptor Nuclear receptor subfamily 1, group D, member 1 (Rev-erbα). The amplitude of the Rev-erbα rhythm was enhanced in AhR+/− mice (Fig. 5A) (Table 2). Lipid metabolism genes Sterol regulatory element-binding transcription factor 1c (Srebp1c), Fatty acid synthase (Fasn), and Acyl-CoA oxidase (Aco) were altered by AhR deficiency (Fig. 5, B-D) (Table 2). Fasn and Aco were significantly enhanced at ZTs during the lights-on period (Fig. 5, C and D). Taken together, a reduction in AhR expression enhanced mRNA levels of circadian clock genes Per1, Per2, Bmal1, and Cry1 and the clock-controlled nuclear receptor Rev-erbα and altered lipid metabolism genes Srebp1c, Fasn, and Aco in the liver.
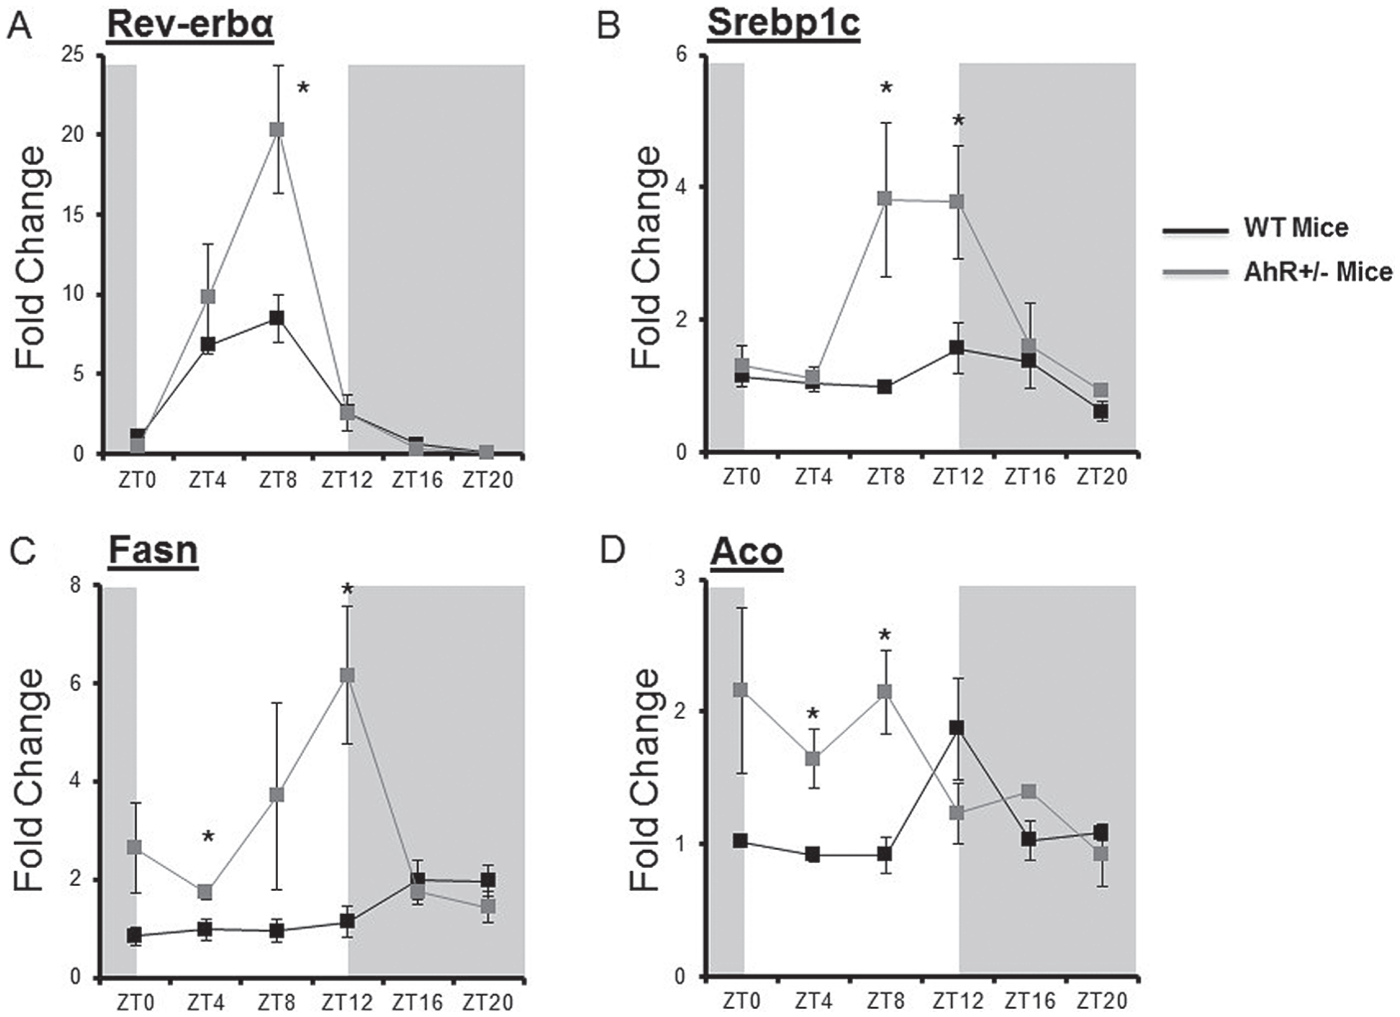
AhR deficiency alters clock-controlled target genes. Quantitative PCR was used to measure mRNA levels of nuclear receptors. (A) Rev-erbα, (B) Srebp1c, (C) Fasn, and (D) Aco were measured in WT and AhR+/− mice. Data are represented as mean ± SEM. n = 18, 3 per ZT. Data were analyzed by 2-way ANOVA with Fisher post hoc test and cosinor analysis.*p < 0.05 indicates differences between genotypes. In all cases, there was an interaction effect between genotype and time of day (p < 0.05).
Discussion
AhR+/− mice have an enhanced ability to respond to alterations in the light-dark cycle, which is accompanied by increased amplitude of molecular rhythms in gene expression. Light, the most potent zeitgeber, acts on the SCN through glutamatergic neurotransmission and cAMP-response element (CRE)–dependent signaling (Ding et al., 1997; Tischkau et al., 2000). Phase shifts in response to nocturnal light require phosphorylation of CRE-binding protein (CREB) and enhanced CRE-dependent Per1 transcription in the SCN (Tischkau et al., 2003). AhR activation represses light-induced phase shifting and inhibits Per1 transcription (Xu et al., 2013). Thus, the enhanced responsiveness to changes in the timing of the light schedule observed in the AhR-deficient mice is likely caused by removal of the AhR-dependent inhibition of Per1.
To further examine rhythms of metabolic outputs, glucose and insulin were measured every 4 h. Cosinor analysis revealed that the amplitude of the glucose rhythm was 19.67 in AhR+/− mice and 8.05 in WT mice (Table 2). Because each measurement represented an individual animal, all data points were pooled prior to cosinor analysis, preventing subsequent statistical analysis of these data. However, a greater than 2-fold change in the serum glucose rhythm amplitude seems relevant and is supported by the 2-way ANOVA. No changes were observed in the amplitude of the insulin rhythm. Serum insulin levels were significantly decreased in AhR+/− mice at every time point except ZT12, which is consistent with previous reports of superior insulin sensitivity in these mice (Wang et al., 2011). Rhythmic expressions of glucose and insulin were inverted in AhR+/− mice compared with WT mice (Fig. 3, A and B). Rhythms in blood glucose levels are dependent on the SCN, rhythmic control of food intake, glycogen breakdown to glucose, epinephrine, and several steroid hormones. The SCN influences basal glucose concentrations through autonomic signals to the liver, which indicate time of day, to prepare for activity and anticipate feeding (Abrahamson et al., 2001; Fujii et al., 1989; Kalsbeek et al., 2008). Additionally, the SCN has direct connections to the pancreas, where it regulates rhythmic production of glucagon by alpha cells, enhancing glycogenolysis (Buijs et al., 2001; Gagliardino et al., 1978; Hansen and Johansen, 1970; Ruiter et al., 2003; Tiedgen and Seitz, 1980; Ueyama et al., 1999; Yamamoto et al., 1987). Thus, blood glucose levels are a cumulative output of the circadian clock, food intake, glucagon, corticosterone, and other hormones. Direct neural connections exist between the SCN and pancreas that regulate the rhythmic release of insulin by β-cells (Buijs et al., 2001; Ueyama et al., 1999). Additionally, pancreatic islet physiology is regulated by circadian rhythms, and pancreatic β-cell islets contain self-sustained circadian oscillations of core clock genes (Marcheva et al., 2010). Although food intake was not measured, a previous study demonstrated that drinking behavior is similar to the activity measured in this study (Mukai et al., 2008).
Disruption or alteration of any of the contributing factors that control the rhythmic expression of glucose and insulin could explain the inverse relationship between WT and AhR+/− mice. Because the SCN strongly influences activity, feeding, glucagon production, and rhythmic hormone production, the altered glucose and insulin rhythms in AhR+/− mice may have resulted from altered SCN outputs. Considering that AhR status influenced SCN-dependent responses to changes in the light-dark cycle, altered acrophase of glucose and insulin rhythms and insulin target genes may be reflective of changes in SCN output (Fig. 3, A and B). The amplitude of the Per2 rhythm in the SCN is enhanced in AhR+/− mice. Glucose and insulin rhythms may also reflect changes in feeding behavior between the genotypes. However, our previous work measuring circadian drinking behavior, which is associated with feeding, in AhR-deficient mice (AhR–/–) indicated no difference in patterns of drinking behavior between wild-type and AhR-deficient mice (Mukai et al., 2008; Spiteri, 1982).
Transcriptional profiles from livers of WT and AhR–/– mice previously reported that AhR status alone alters gene expression independent of AhR activation by exogenous agonists such as TCDD (Tijet et al., 2006). Additionally, low-dose AhR activation inhibits Per1, Bmal1, and Rev-erbα in liver, Per1 in isolated bone marrow cells, and Bmal1 in ovary (Garrett and Gasiewicz, 2006; Sato et al., 2008; Xu et al., 2010; Tischkau et al., 2011). To further determine rhythmic differences between WT and AhR+/− mice, mRNA levels of circadian clock and metabolic genes were measured in liver. Under normal conditions, Bmal1 influences its own expression through Per/Cry-induced inhibition of Clock/Bmal1 activity. After ligand binding, activated AhR can form a heterodimer with Bmal1. This AhR/Bmal1 heterodimer disrupts the normal Clock/Bmal1 activation of downstream target genes, which then feedback to regulate Bmal1 (Xu et al., 2010; Jaeger and Tischkau, 2016). The presence of AhR in WT mice exposes them to potential low-level activation of AhR as a consequence of AhR ligands from tryptophan photoproducts and dietary compounds (Denison and Nagy, 2003; Heath-Pagliuso et al., 1998; Helferich and Denison, 1991; Ralph et al., 1990). Constitutive AhR activation would result in inhibition of Clock/Bmal1-regulated transcription. Decreased AhR expression in AhR+/− mice would release AhR-induced inhibition of Clock/Bmal1 activity, resulting in increased clock gene expression (Figs. 4 and 5, Table 2) (Jaeger and Tischkau, 2016).
Circadian clock proteins and the environmental sensor AhR have similar PAS domain structure allowing for protein-protein interactions and crosstalk between circadian rhythms and AhR signaling. This study was designed to test the hypothesis that AhR+/− mice have altered circadian rhythmicity in behavior, metabolic outputs, and circadian clock and metabolic gene expression. AhR+/− mice displayed enhanced sensitivity to changes in the light-dark cycle and altered rhythms of core clock genes and metabolic outputs. This suggests that AhR plays an important role in the circadian clock and clock-derived rhythmic outputs. The presence of AhR exposes mice to AhR activation by a variety of AhR ligands present under normal light-dark conditions and feeding, resulting in a reduction in the amplitude of circadian and metabolic gene rhythms, potentially through inhibition of Clock/Bmal1-mediated transcription (Xu et al., 2010). Genetic manipulation to reduce AhR levels may release the AhR-induced inhibition and, thereby, enhance the robustness of the circadian rhythm. This study provides supportive evidence of the integration of AhR with circadian rhythms and metabolism, where its activation under homeostatic conditions influences circadian rhythm amplitude.
Footnotes
Acknowledgements
We gratefully acknowledge Steve Verhulst, PhD, and Albert Botchway, PhD, for guidance on statistical analysis. This study was funded by a National Institute of Environmental Health Sciences grant (ES017774) to S.A.T.
Notes
References
Supplementary Material
Please find the following supplemental material available below.
For Open Access articles published under a Creative Commons License, all supplemental material carries the same license as the article it is associated with.
For non-Open Access articles published, all supplemental material carries a non-exclusive license, and permission requests for re-use of supplemental material or any part of supplemental material shall be sent directly to the copyright owner as specified in the copyright notice associated with the article.