
Abstract
In mammals, an endogenous clock located in the suprachiasmatic nucleus (SCN) of the brain regulates the circadian rhythms of physiological and behavioral activities. The SCN is composed of about 20,000 neurons that are autonomous oscillators with nonidentical intrinsic periods ranging from 22 h to 28 h. These neurons are coupled through neurotransmitters and synchronized to form a network, which produces a robust circadian rhythm of a uniform period. The neurons, which are the nodes in the network, are known to be heterogeneous in their characteristics, which is reflected in different phenotypes and different functionality. This heterogeneous nature of the nodes of the network leads to the question as to whether the structure of the SCN network is assortative or disassortative. Thus far, the disassortativity of the SCN network has not been assessed and neither have its effects on the collective behaviors of the SCN neurons. In the present study, we build a directed SCN network composed of hundreds of neurons for a single slice using the method of transfer entropy, based on the experimental data. Then, we measured the synchronization degree as well as the disassortativity coefficient of the network structure (calculated by either the out-degrees or the in-degrees of the nodes) and found that the network of the SCN is a disassortative network. Furthermore, a positive relationship is observed between the synchronization degree and disassortativity of the network, which is confirmed by simulations of our modeling. Our finding suggests that the disassortativity of the network structure plays a role in the synchronization between SCN neurons; that is, the synchronization degree increases with the increase of the disassortativity, which implies that a more heterogeneous coupling in the network of the SCN is important for proper function of the SCN.
Introduction
Circadian or daily rhythms are observed in physiological and behavioral activities of living beings on earth. In mammals, circadian rhythms are regulated by an endogenous clock, which is located in the suprachiasmatic nucleus (SCN) above the optic chiasm of the brain (Diekman and Forger, 2009; Welsh et al., 2010; Diekman et al., 2013). The SCN not only functions as a calibrator (i.e., it synchronizes the bodily rhythms to the natural 24-h light-dark cycle) but also acts as a time giver (i.e., it outputs robust endogenous circadian rhythms to the body under constant darkness; Evans et al., 2013). Surprisingly, when the SCN is removed from the brain, the SCN in vitro remains to show robust circadian rhythms for several days (Yamaguchi et al., 2003).
The circadian rhythms originate from genetic feedback loops in individual neurons of the SCN (Gonze et al., 2005). This makes these neurons autonomous oscillators that have intrinsic periods ranging from 22 h to 28 h (Welsh et al., 1995; Honma et al., 2004; Webb et al., 2009). These nonidentical SCN neurons are coupled and synchronized through neurotransmitters, enabling the formation of an SCN network (Albus et al., 2005; Aton et al., 2005; Morin, 2007). The degree of synchronization between neurons in the network determines the strength of the circadian rhythms. If the neurons are closely synchronized, a robust rhythm of the SCN network is observed (Ohta et al., 2005), and if the neurons are less synchronized, the rhythm of the SCN network is weaker. Weak circadian rhythms are observed in special conditions (Bernard et al., 2007), such as in aging (Farajnia et al., 2014), under constant light (Ohta et al., 2005), or after the application of tetrodotoxin (TTX) in vitro (Yamaguchi et al., 2003; Abel et al., 2016).
To understand how the neurons synchronize or desynchronize, it is necessary to better understand the structure of the SCN network (Kori and Mikhailov, 2004; Vasalou et al., 2009; Welsh et al., 2010; Bodenstein et al., 2012; Hafner et al., 2012; Abel et al., 2016). Although the exact network topology is unknown so far, the SCN network is thought to be heterogeneous and can be roughly divided into 2 functional subnetworks: a ventrolateral subnetwork (VL) containing about 25% SCN neurons and a dorsomedial subnetwork (DM) composed of the remaining 75% SCN neurons (Lee et al., 2003; Rohling et al., 2011; Gu et al., 2012; Gu et al., 2014). The properties of the VL and DM neurons differ. The VL neurons are thought to be directly sensitive to the light information from the retina and relay this information to the DM neurons (Rohling et al., 2011). In addition, the DM neurons run faster than the VL neurons (Noguchi et al., 2004). The neurotransmitters involved in synchronization within both subnetworks also differ. In particular, the VL neurons produce vasoactive intestinal peptide (VIP), and DM neurons secrete arginine vasopressin (AVP; Aton et al., 2005; Morin, 2007). The neurotransmitter involved in the direct communication between these 2 subnetworks is predominantly gamma-aminobutyric acid (Albus et al., 2005), which may either act excitatory or inhibitory (Choi et al., 2008; DeWoskin et al., 2015) and through this action regulate the release of VIP or AVP. There are also reports of direct effects of VIP throughout the SCN (Mazuski et al., 2018). All of these complex heterogeneous interactions ultimately lead to more or less synchronization between the neurons. Furthermore, the synapses from the VL to the DM are much denser than from the DM to the VL (Welsh et al., 2010), and the most highly connected neurons are found in the VL (McBride and Petzold, 2018). After a jet lag, the VL is synchronized immediately to the new environment, and the DM gradually adjusts to the local time of the new environment in several days (Albus et al., 2005; Rohling et al., 2011). These experiments suggest that there are more links from the VL to the DM than from the DM to the VL.
A network can be heterogeneous in many aspects. Besides the heterogeneity of the nodes, the network structure can also be more or less heterogeneous. Recently, to explore the functional network structure, a pioneering work applied the method of the maximal information coefficient statistic to time series from individual SCN slices (Abel et al., 2016). Within each single slice, hundreds of neurons were identified by single-cell bioluminescence recordings that lasted more than 10 days. During the process of resynchronization between the SCN neurons (for a brief introduction of the experiment, please see the Data Description subsection in the Methods section), for each slice, a network composed of hundreds of neuronal nodes was defined. The neural network architectures appeared to be small-world networks, which are characterized by a short average path length, a large clustering coefficient, and node degrees that satisfy an exponential distribution. Another study also showed the presence of a small-world network architecture in the SCN, implicating that the network structure of the SCN is heterogeneous in the node degree of the neuronal nodes (Vasalou et al., 2009).
Another network property that did not get any attention until now in the circadian field is whether the network is assortative or disassortative (Newman, 2002, 2003). In an assortative network, nodes preferably connect to other nodes with the same node degree (number of incoming or outgoing connections), while in a disassortative network, nodes prefer to connect to nodes that have a different node degree (Noldus and Mieghem, 2015). The disassortativity coefficient signifies the heterogeneity in degree correlations between nodes in a network. Most biological networks seem to be of a disassortative nature (Newman, 2002, 2003); that is, nodes with higher node degrees tend to connect to nodes with lower node degrees and vice versa. This has a direct relation to the robustness of a network, as high-degree nodes are less connected to each other, and as one high-degree node would fail in a disassortative network, it would have a high impact on the connectivity of this network (Noldus and Mieghem, 2015). However, it has also been shown that a disassortative network structure enhances controllability of the network (Takemoto and Akutsu, 2016). Thus far, no studies have looked for disassortativity in the SCN network structure as well as for the role of this disassortativity in the collective behaviors of the SCN neurons, such as their synchronization.
In the present study, we build directed SCN networks using the method of transfer entropy (Newman, 2003) for each slice based on the published experimental data from Abel et al. (2016). For these networks, we determined the synchronization degree and the disassortativity coefficient of the network structure and calculated the correlation between the disassortativity of the network structure and the synchronization degree. Finally, to identify the causality between the synchronization and the disassortativity, an SCN network model was built, in which single neurons were described by Poincaré oscillators and the network structure was the same as that obtained from the experimental data.
Methods
Data Description
The data sets for our present work can be downloaded freely from the website https://github.com/JohnAbel/scn-resynchronization-data-2016 (Abel et al., 2016). Five whole SCN mouse explants were removed from the brain in vitro, each of which contained hundreds of neurons. Bioluminescence values of PERIOD2::Luciferase (PER2::LUC) were recorded each hour, and individual neurons could be identified. During the experiments, several days after the removal of the explants from the brain, TTX was applied to the whole tissue explants for 6 days to block intercellular coupling between neurons. Then, TTX was washed out, recovering the coupling and thus dividing the whole recording into 3 stages, which we will call the pre-TTX stage, a during-TTX stage, and a post-TTX stage (Fig. 1). For more details of the experiment, please see Abel et al. (2016).
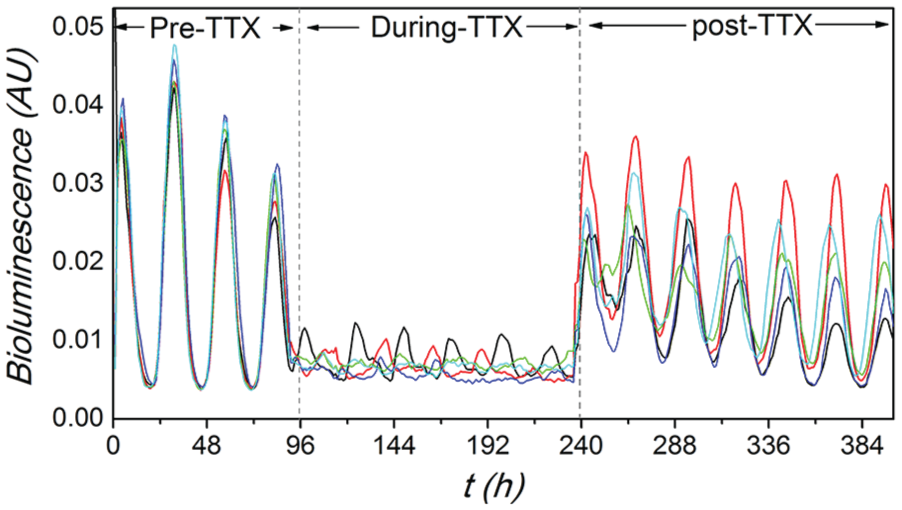
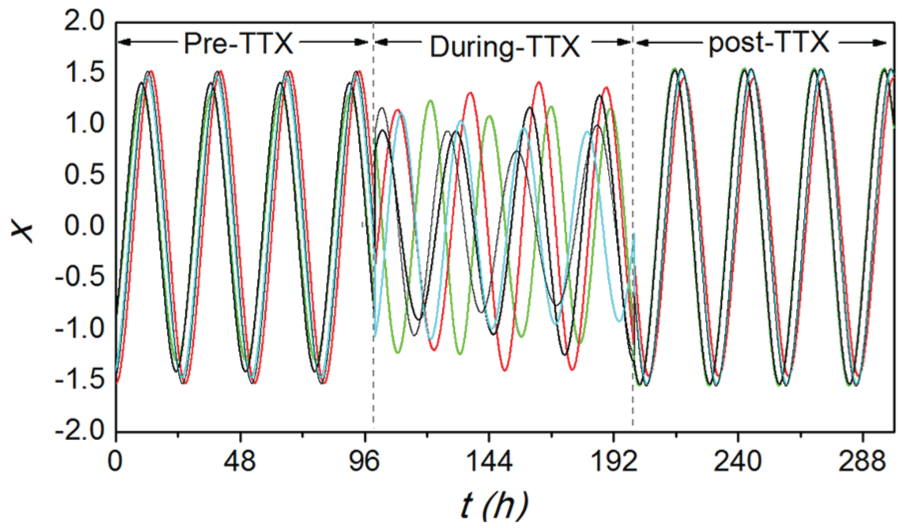
Neuronal time series from 5 randomly selected neurons. Recorded PER2::LUC traces of 5 randomly selected neurons taken from slice 1, showing their temporal evolutions in 3 different conditions. The stages of pre-tetrodotoxin (pre-TTX), during-TTX, and post-TTX represent the stage before the application of TTX, during the application of TTX, and after the washout of TTX, respectively. It is evident that the synchronization is lost during TTX treatment.
Transfer Entropy
In the present study, the network is built using the method of transfer entropy (Newman, 2003) for each stage of each slice (i.e., this gives 3 × 5 = 15 networks). A matrix T is introduced to represent the transfer entropy between each of the 2 nodes. The element
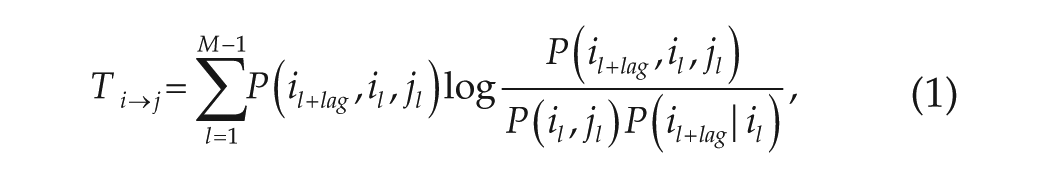
where
The steps for the construction of the network are as follows. Step 1: If
Poincaré Model
For the modeling simulations, single neurons are mimicked by Poincaré oscillators, while the network structure is the same as obtained from the experimental data by the method of transfer entropy. The Poincaré model is a generic model for an oscillating neuron, which contains both the phase and amplitude information (Abraham et al., 2010; Gu et al., 2016). The networked Poincaré model is composed of
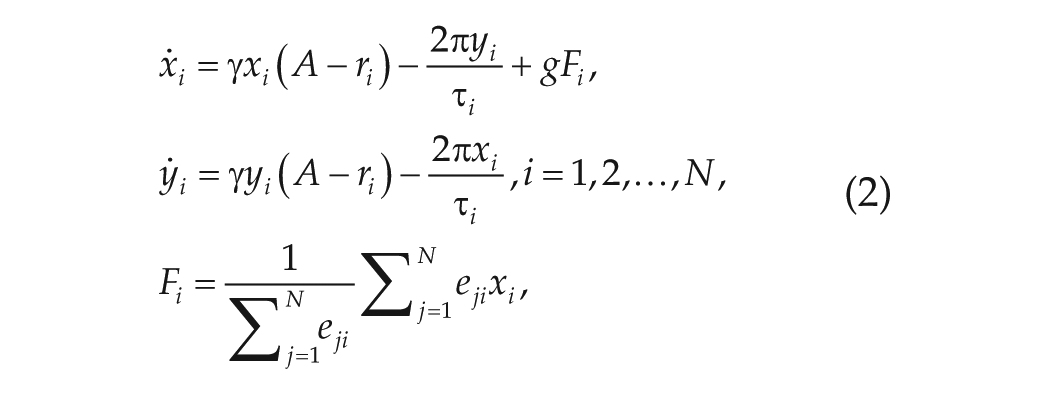
where

The values of the parameters are set as in Abraham et al. (2010),
Synchronization Degree, Heterogeneity of Node Degree, and Disassortativity Coefficient
The key parameters that we will investigate are the synchronization degree
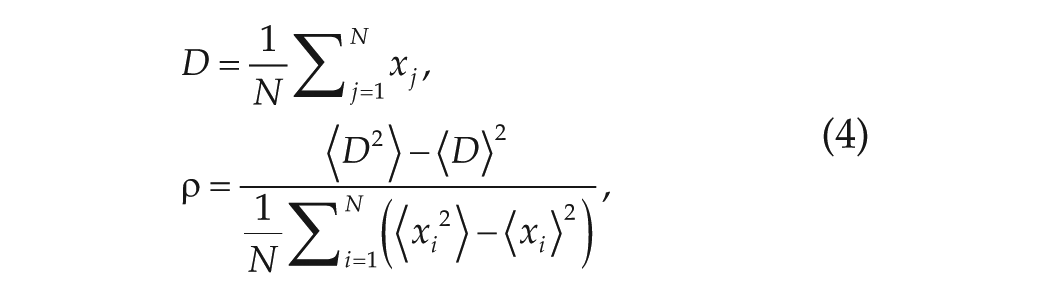
where
To assess the heterogeneity of the node degrees in the networks that were constructed from the experimental data, we looked at the average node degrees and the node degrees of the hubs (the top 10% highly connected nodes) in the network, and we determined for each network the node degree distribution for the in-degrees and the out-degrees. The in-degree of a node is defined as the number of incoming connections to that node, while its out-degree is defined as the number of outgoing connections from that node.
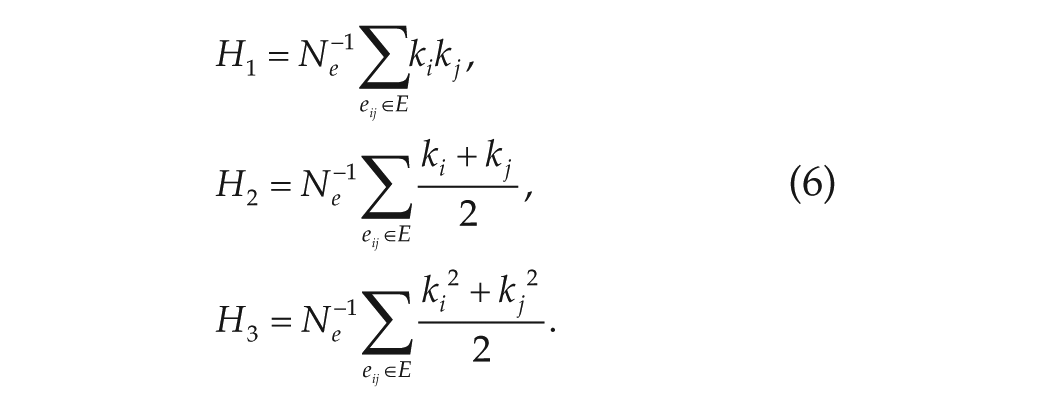
Finally, we take the disassortativity coefficient to be the opposite value to the assortativity coefficient defined in the method of Newman (2002) as follows:

where
Results
Experimental Data
Figure 1 shows recorded PER2::LUC traces of 5 randomly selected neurons taken from slice 1, showing their temporal evolutions. Consistent with Abel et al. (2016), the circadian rhythms are robust in the individual neuronal oscillators, and the neurons are synchronized well in the stage of pre-TTX and post-TTX, whereas we observe weak circadian rhythms of individual neurons as well as poor synchronization between neurons during TTX.
To quantitatively examine synchronization between the neurons, the synchronization degree
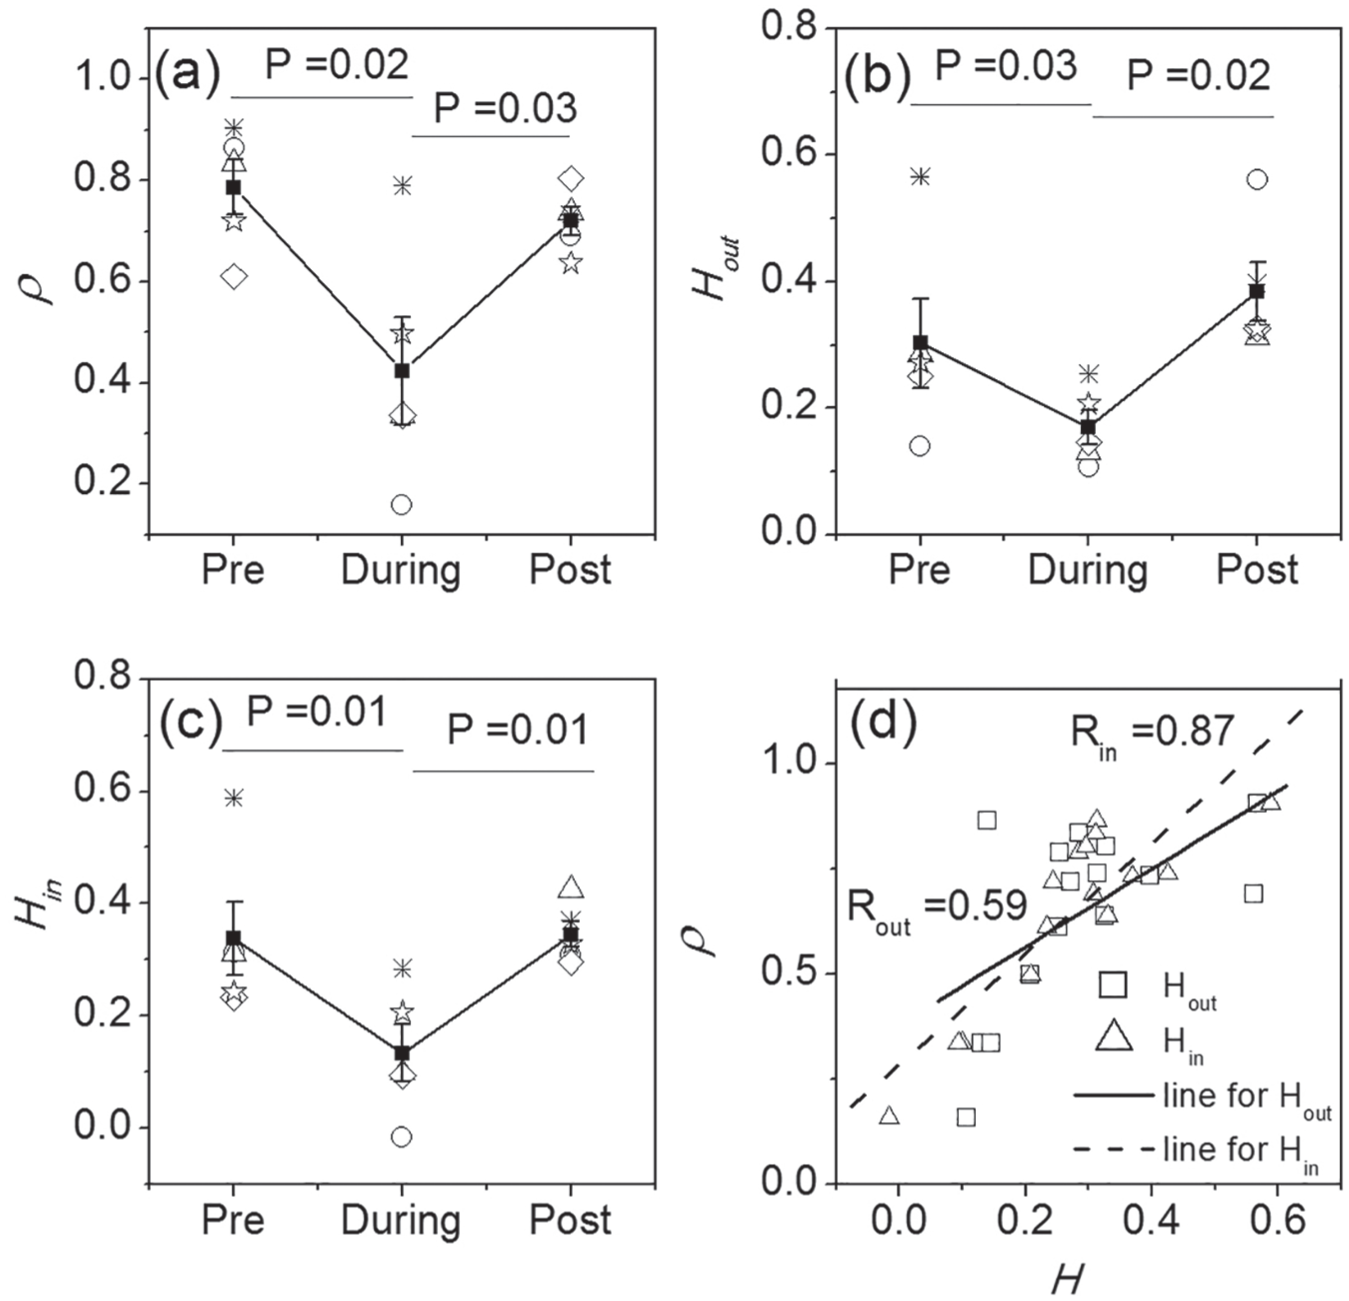
Quantitative results from the experimental data. The comparison of synchronization degree
Next, a directed SCN network is built for each stage of each slice using the method of transfer entropy (the rules for the construction of the network are shown in the Methods section). Note that the number of neuronal nodes in the networks is the same for the 3 stages of 1 slice. We assessed the heterogeneity of the node-degree distribution for the different networks and found that the average node degree (K,
We also assessed distributions of the node degrees for both the in-degrees and the out-degrees and found power-law distributions for all stages. However, the scaling exponents of the pre-TTX and post-TTX stages differed significantly from the scaling exponents during TTX application. Based on the out-degree, the exponent of during-TTX
Finally, the disassortativity degrees
The coemergence of the reduction of the degree of synchronization and of the disassortativity coefficient during TTX suggests that the synchronization and the disassortativity are correlated. Thus, we examined the relationship between the synchronization degree
Model Simulations
To examine whether there is a causal interaction between disassortativity and synchronization, a Poincaré model for the SCN network is built, in which the network structure for each stage of each slice is the same as obtained from the experimental data. Thus, the only difference between the models of the different stages is the network structure. The simulation results of the Poincaré model (Fig. 3) are in accordance with Figure 1. In particular, the neuronal oscillators are synchronized and show robust circadian rhythms in the stage of pre-TTX and post-TTX, whereas they lose synchronization and the neuronal amplitudes decrease during-TTX. Thus, we show that this model accurately describes the data.
Temporal evolutions for 5 randomly selected neurons from simulations of the Poincaré model. This figure corresponds to Figure 1. The network topology for the stage of pre-tetrodotoxin (pre-TTX), during-TTX, and post-TTX is the same as the network topology for these 3 stages within 1 slice in Figure 1, respectively.
Next, we examine the causal dependence of the synchronization degree on the disassortativity coefficient of the network based on the Poincaré model (Fig. 4). Consistent with Figure 2a, the synchronization degree
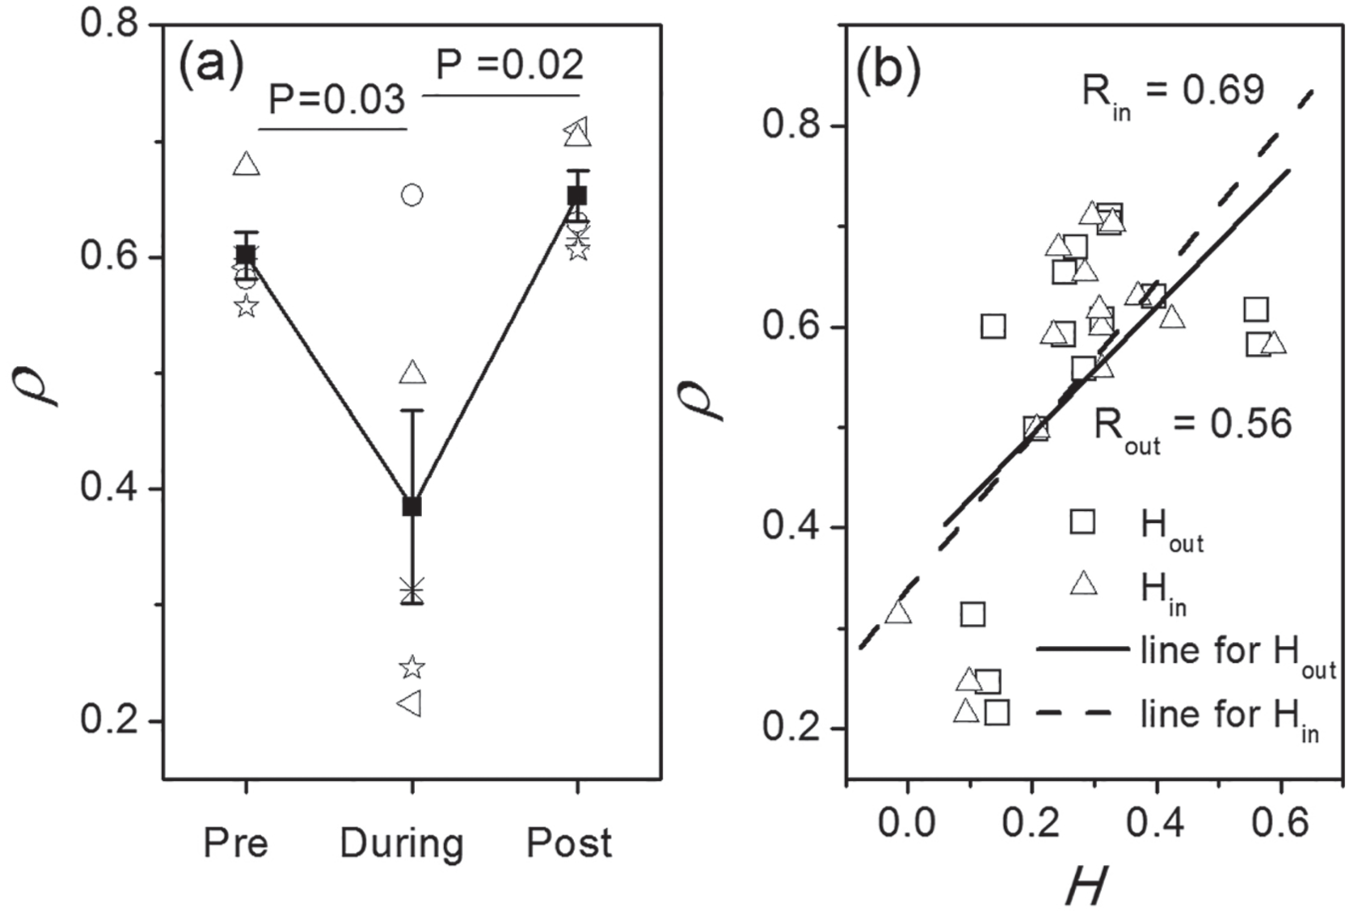
Numerical results from the Poincaré model. Synchronization degree
Discussion
The network structure for the SCN slice has been investigated in previous studies (Vasalou et al., 2009; Abel et al., 2016; McBride and Petzold, 2018), but the disassortativity of the network structure has not been examined. Here, based on the method of transfer entropy, which is used for short nonstationary time series, we defined a directed network structure and calculated the synchronization degree of the neurons as well as the disassortativity coefficient of the network structure. We found there is a positive relationship between the synchronization degree and the disassortativity coefficient. A model was built to examine the causality between the synchronization and the disassortativity. Based on this model, we confirmed that the increase of disassortativity of the network structure leads to the increase of the synchronization degree between the neurons, thereby affecting SCN functionality.
We found that all networks followed a power-law degree distribution with a scaling exponent <2. This suggests that the networks contain the small-world network characteristic (Seyed-Allaei et al., 2006). This finding is consistent with previous studies in which the network of the SCN was suggested to be heterogeneous in the node degree (Vasalou et al., 2009; Hafner et al., 2012; Gu and Yang, 2016). Previous studies found that the more heterogeneous scale-free network gave a higher amplitude rhythm than the less heterogeneous small-world network and the random network architectures (Hafner et al., 2012; Gu and Yang, 2016), suggesting a greater influence on the synchronization between the neurons. Although there are differences between the pre- and post-TTX stages and the during-TTX stage, it is hard to tell which of the networks is more heterogeneous in their node degree, as they all seem to be scale-free and show small-world characteristics.
We are aware of the fact that it is statistically difficult to prove that a network is scale-free based on a few hundred nodes (De Vico Fallani et al., 2014; Broido and Clauset, 2019), but unfortunately, experimentally derived data from brain studies are restrained by the experimental procedures. This limitation stemming from these data acquisition procedures prompts one to be cautious in stating that a network is or is not a proper scale-free network. However, our disassortativity results do show that when the network structure tends to become more scale-free-like, the synchronization between the neurons increases, which is an important characteristic for SCN function.
Vasalou et al. (2009) showed that a small-world network required fewer connections to obtain the same functionality of the SCN network, compared with a regular network, which is coherent with our findings. It is also interesting to note that the relationship between the disassortativity of the network and the degree of synchronization has also been found previously in networks of beta cells obtained from pancreatic tissue slices (Stozer et al., 2013; Gosak et al., 2015; Gosak et al., 2018).
There are some differences in the distribution of node degree between previous studies and our current study. The distribution of node degree was suggested to be an exponential form, and the maximal node degree is about 40 in the undirected SCN network (Abel et al., 2016). McBride and Petzold (2018) reported that the maximal in-degree is 8 and the maximal out-degree is 18. These differences may be due to the application of different methods, the maximal node degree, and whether the SCN network being a connected network.
It can be observed that in our simulations, the amplitude of the neuronal oscillators did not drop as drastically as in the experimental data during the application of TTX. This may be due to the fact that we used only the network architecture to examine the difference between the different states in our models. In reality, TTX disturbs neuronal communication completely, which may lead to a much lower amplitude of the individual neurons. But what was enlightening was that apparently the network architecture in the TTX-stage was sufficiently different from the other stages to highlight the change in synchronization.
The heterogeneity and disassortativity coemerge in technological and biological networks (Newman, 2002, 2003). For instance, the disassortativity coefficient for the network of protein interactions is 0.156, for the metabolic network is 0.24, for the neural network of the nematode Caenorhabditis elegans is 0.226, for the marine food web is 0.263, and for the freshwater food web is 0.326 (Newman, 2003). All of these 5 networks are heterogenous networks because of the scale-free distribution of the node degree. The disassortativity coefficients for the SCN network observed in this study are close to these disassortativity coefficients, ranging from 0.13 to 0.38 for the average values for the different stages.
As the exact relation between the heterogeneity in node degree of the SCN network and the disassortativity of the network must still be investigated, the disassortativity coefficient can be useful to assess the synchronization state of the SCN network. The finding that the synchronization between the neurons in the network and the disassortativity of the network are related also shows that higher heterogeneity in the degree correlations in the SCN network increases the synchrony between the neurons in the network. This suggests that the way the different neurons are connected affects the function of the SCN.
Supplemental Material
Supplementary_materials_clear – Supplemental material for Disassortative Network Structure Improves the Synchronization between Neurons in the Suprachiasmatic Nucleus
Supplemental material, Supplementary_materials_clear for Disassortative Network Structure Improves the Synchronization between Neurons in the Suprachiasmatic Nucleus by Changgui Gu, Xiangwei Gu, Ping Wang, Henggang Ren, Tongfeng Weng, Huijie Yang and Jos H. T. Rohling in Journal of Biological Rhythms
Footnotes
Acknowledgements
This research was supported by the National Natural Science Foundation of China under grants 11875042, 11505114, and 11805128 and the Program for Professor of Special Appointment (Oriental Scholars) at Shanghai Institutions of Higher Learning under grants QD2015016 (C. Gu) and D-USST02 (H. Yang).
Conflict of Interest Statement
The authors have no potential conflicts of interest with respect to the research, authorship, and/or publication of this article.
Notes
References
Supplementary Material
Please find the following supplemental material available below.
For Open Access articles published under a Creative Commons License, all supplemental material carries the same license as the article it is associated with.
For non-Open Access articles published, all supplemental material carries a non-exclusive license, and permission requests for re-use of supplemental material or any part of supplemental material shall be sent directly to the copyright owner as specified in the copyright notice associated with the article.