
Abstract
Nighttime melatonin suppression is the most commonly used method to indirectly quantify acute nonvisual light effects. Since light is the principal zeitgeber in humans, there is a need to assess its strength during daytime as well. This is especially important since humans evolved under natural daylight but now often spend their time indoors under artificial light, resulting in a different quality and quantity of light. We tested whether the pupillary light response (PLR) could be used as a marker for nonvisual light effects during daytime. We also recorded the wake electroencephalogram to objectively determine changes in daytime sleepiness between different illuminance levels and/or spectral compositions of light. In total, 72 participants visited the laboratory 4 times for 3-h light exposures. All participants underwent a dim-light condition and either 3 metameric daytime light exposures with different spectral compositions of polychromatic white light (100 photopic lux, peak wavelengths at 435 nm or 480 nm, enriched with longer wavelengths of light) or 3 different illuminances (200, 600, and 1200 photopic lux) with 1 metameric lighting condition (peak wavelength at 435 nm or 480 nm; 24 participants each). The results show that the PLR was sensitive to both spectral differences between metameric lighting conditions and different illuminances in a dose-responsive manner, depending on melanopic irradiance. Objective sleepiness was significantly reduced, depending on melanopic irradiance, at low illuminance (100 lux) and showed fewer differences at higher illuminance. Since many people are exposed to such low illuminance for most of their day—living in biological darkness—our results imply that optimizing the light spectrum could be important to improve daytime alertness. Our results suggest the PLR as a noninvasive physiological marker for ambient light exposure effects during daytime. These findings may be applied to assess light-dependent zeitgeber strength and evaluate lighting improvements at workplaces, schools, hospitals, and homes.
Keywords
Introduction
Light enables vision by activating different pho-topigments in the retina of the eye. The photopigments of rods and cones provide most of the light information for vision. In addition, recent studies have shown that a third photopigment melanopsin, which is expressed by intrinsically photosensitive retinal ganglion cells (ipRGCs; Berson et al., 2002; Hattar et al., 2002), substantially contributes to brightness and contrast discrimination in humans (Allen et al., 2017; Schmidt et al., 2014; Spitschan et al., 2014). Light is also the strongest zeitgeber for the circadian timekeeping system in humans. All light information via rods, cones, and ipRGCs is weighted, integrated, and projected via melanopsin-dependent projections to many brain areas and indirectly to the rest of the body (Lucas et al., 2012). Two main projections of the ipRGCs are connections to the suprachiasmatic nucleus (SCN) and the olivary pretectal nucleus (OPN). The SCN is the central biological clock in the brain (Stephan and Zucker, 1972) and synchronizes circadian rhythms throughout the body, and the OPN regulates the pupil’s response to light. There is strong evidence for many other light-dependent effects via ipRGCs in humans, such as modulation of mood, alertness, cognition, and sleep (Cajochen et al., 2005; Lockley et al., 2006; Münch et al., 2006; Vandewalle et al., 2006; Vandewalle et al., 2011; Vandewalle et al., 2009). Recent animal studies have shown that learning and mood can be directly affected via ipRGC-dependent pathways (LeGates et al., 2012), even without activation of the SCN (Fernandez et al., 2018).
Currently, the most commonly used method to assess acute and circadian light-dependent biological functions is to measure melatonin concentrations in the evening/night (Brainard et al., 2001; Lewy and Sack, 1989; Thapan et al., 2001). However, there is no reliable method to assess ambient light effects during the daytime. This is crucial, since many biological functions are well known to oscillate during a 24-h day, which implies that nighttime measurements of light-dependent responses are most likely different from those of daytime responses, as was shown, for example, for objective alertness in the wake electroencephalogram (EEG; Rahman et al., 2014) and for the effects of daytime light exposure on sleep (Wams et al., 2017). Spectral irradiance weighted for the ipRGC-dependent photopigment melanopsin has been termed melanopic lux (Lucas et al., 2014). We and others showed that there is a dose-response relationship between melatonin suppression and the melanopic lux of different lighting conditions (Nowozin et al., 2017; Prayag et al., 2019; SSL-erate Report et al., 2014). The application of melanopic lux has facilitated comparisons of biological effects between different lighting conditions because it quantifies the melanopsin-weighted potential of any light source. Current regulations of the International Commission on Illumination (CIE) have very recently introduced a new metric, called melanopic irradiance, with similar assumptions to assess photoreceptor-weighted irradiance of a given lighting (CIE, 2018). In the current study, we report both metrics. Even with such a tool to assess the potential of ambient lighting to activate ipRGCs in humans, a marker is still needed to evaluate physiological light effects during the daytime that also integrates the temporal dynamics of light exposure.
One of the most used proxies to assess acute responses to light is alertness, which is regulated by the integration of circadian, sleep-dependent, and other aspects (for a review, see Cajochen, 2007). A great portion of the alerting effects by light during the evening/night has been found concomitant with light-induced melatonin suppression (Cajochen et al., 2011; Cajochen et al., 2000; Chellappa et al., 2011; Lockley et al., 2006), even though some studies found that light at night can also increase alertness or cognitive performance without affecting the melatonin profile (Rahman et al., 2011; Regente et al., 2017). During the day, when people are usually synchronized to the light-dark cycle and melatonin is not secreted, the possible alerting effects of light are less clear. Some studies showed alerting effects by light during the day (Kaida et al., 2006; Phipps-Nelson et al., 2003; Rahman et al., 2014; Revell et al., 2006; Ruger et al., 2006; Sahin et al., 2014; Smolders et al., 2012; Vandewalle et al., 2006; Viola et al., 2008), while others did not (Borragán et al., 2017; Daurat et al., 1993; Lafrance et al., 1998; Leproult et al., 2001; Lok et al., 2018; Segal et al., 2016; Smolders et al., 2018). These different findings during the daytime may be partially due to differences in the exact timing and characteristics of light exposures, the methods of measuring sleepiness, or the use of prior sleep restriction (Phipps-Nelson et al., 2003). The conflicting results emphasize a need for more evidence on how daytime light exposure can affect daytime sleepiness and ultimately people’s health, which was also emphasized by a Cochrane report in 2018 (Pachito et al., 2018). The authors of that report concluded that there may be an alerting effect of bright light in daytime workers but that this finding is supported by only low-quality evidence.
Because neuronal ipRGC-dependent projections are shared between different nonvisual effects of light, for example, projections to the SCN and to the OPN as was shown in rodents (Hattar et al., 2006), we were interested in the pupillary light response (PLR) and its possible application as a marker to determine the effects of ambient lighting on nonvisual functions (e.g., sleepiness). The PLR has long been a target for research. In 1958, Loewenfeld wrote a historical review about the PLR in animals and reported that in humans, the pupillary activity in constant darkness changed throughout the wake episode, so that the sleepier the participants were, the smaller the pupil size became (Lowenstein and Loewenfeld, 1964). Apart from pupil size fluctuations as a result of sleepiness, it has been shown that the transient pupil response to light is mostly mediated by rods and cones, while the sustained pupil response to light (i.e., delayed redilation after light offset) is mostly mediated by melanopsin (Gamlin et al., 2007; Gooley et al., 2012; Kawasaki and Kardon, 2007; Lucas et al., 2014; Park et al., 2011; Zele et al., 2011). A study by Gamlin et al. showed that by blocking rods and cones in nonhuman primates, the sustained pupil response was largest after light exposure, with a peak wavelength at the maximal sensitivity of ipRGCs, following the sensitivity curve of melanopsin with a peak at 482 nm (Gamlin et al., 2007). Several attempts were made to physiologically isolate the photoreceptor contributions, especially the contribution from ipRGCs (for a review, see Rukmini et al., 2019). An action spectrum of the pupil response revealed peak sensitivity also around 480 nm in rod and coneless mice (Lucas et al., 2001) and in humans (Bouma, 1962; Gamlin et al., 2007), further indicating the melanopsin-driven impact on the pupil response to short-wavelength light stimuli. A study by Park et al. (2011) investigated different light intensities and the sustained pupil response by using chromatic pupillometry. They found the greatest sensitivity to light at around 480 nm and 6 s after a light stimulus of 1-s duration. Since then, other studies have confirmed and expanded these findings (Münch et al., 2012; Zele et al., 2011).
The aim of the current study was to evaluate acute physiological responses to daytime light exposure in humans to find a sensitive biological marker. Light exposures were placed around noon, because at this time, any phase-shifting effects of light are expected to be small in entrained participants (Khalsa et al., 2003) and any sleep inertia effects would have faded (Jewett et al., 1999). The lighting conditions consisted of polychromatic white-light sources with different spectral compositions that were designed to have metameric properties (except that they differed somewhat in the amount of cone excitation) and different intensities. Metameric light conditions have received a lot of attention in the past in the fields of color and vision science (Wyszecki and Stiles, 2000) but have only recently become of interest in chronobiology, because they can be used to change the impact on nonvisual functions without changing the appearance (i.e., color or glare) of the lighting (Allen et al., 2018). We investigated a range of intensities between 100 and 1200 photopic lux. We chose 100 lux as our low illuminance condition since previous work indicated that this is the approximate illuminance to which people in urban environments are habitually exposed for most of the day (Espiritu et al., 1994; Nowozin et al., 2018; Savides et al., 1986; Scheuermaier et al., 2010). Based on current knowledge, we hypothesized that metameric lighting with a peak wavelength close to the peak sensitivity of melanopsin (480 nm) would result in a greater alertness enhancement and have a larger effect on the sustained pupil response than lighting with a peak wavelength at 435 nm. We further hypothesized that these 2 outcome variables would follow a dose-response curve depending on melanopic lux.
Methods
Participants
Participants were recruited via announcements on flyers or student websites at local universities. Potential candidates completed 5 screening questionnaires, and if they matched the criteria were invited for a medical screening and interview. A total of 72 participants were included in the study (24 male, 48 female; age: 24.4 ± 2.7 years; body mass index: 22.6 ± 2.5; mean ± SD). They had to be healthy, without color vision deficiency (Ishihara Test for Color Blindness; Ishihara, 1918), have normal (corrected) vision (Freiburg Visual Acuity Test; Bach, 1996), and be without psychiatric or sleep disorders. Only nonsmokers who were not taking any medication (except for oral contraceptives) were included, and participants were not allowed to drink coffee immediately before or during the sessions. Exclusion criteria were travels across more than 1 time zone within the past 3 months or night-shift work within the past 8 weeks. All participants gave oral and written informed consent. The study was approved by the local ethical committee of Charité University Medicine Berlin (Berlin, Germany, protocol number EA4/163/15). The screening questionnaires consisted of a general entrance questionnaire, the Pittsburgh Sleep Questionnaire Index (criteria: ≤5, i.e., good sleep quality; Buysse et al., 1989), the Morningness-Eveningness Questionnaire (criteria: 31-69, i.e., moderate morning type–moderate evening type; Horne and Östberg, 1976), the Munich Chronotype Questionnaire (criteria: 2-5, i.e., moderate early type–moderate late type; Roenneberg et al., 2003), and the Seasonal Pattern Assessment Questionnaire (criteria: ≤11, i.e., no problems due to changes brought on by different seasons; Rosenthal et al., 1984). See Supplementary Table S1 for the mean scores on the questionnaires.
Study Design
All participants were instructed to maintain regular habitual bedtime and wake time with a sleep episode of approximately 8 h and self-selected target bedtime and wake time (±30 min) for 1 week prior to the first laboratory visit and throughout the experiment. Bedtime and wake time were controlled by actigraphy (Motion Watches 8; CamNtech, Cambridge, UK) and sleep diaries (habitual bedtime 2331 ± 0034 h; habitual wake time 0732 ± 0045 h; mean ± SD). After the screening visit, each participant came to the laboratory 4 times, separated by 4 days (see Fig. 1; except for 9 participants who had visits that were only 3 days apart due to planning issues). The study had a mixed within-between-subject design (see below). On laboratory days, participants woke up at home and were instructed to immediately put on dark goggles. They arrived at the laboratory no later than 1 h after habitual wake time. Electrodes were applied to measure the EEG, eye movements via electrooculogram, and muscle activity via electromyogram. Then, participants were seated at a table facing the experimental light source (≈50-cm distance). The experiment started 2.5 h after wake time, with 50 min of baseline measurements (subjective sleepiness and wake EEG) in dim light (DL; <5 lx) including a dark adaptation (0 lx) of 10 min before the first (dark adapted) pupil measurement. This was followed by 3 h of 1 out of 4 different light exposures, including the control condition in DL (<5 lx). During the 3 h of light exposure, measurements were taken every hour (subjective sleepiness, wake EEG, and pupil recordings), starting 20 min after light onset. Each participant was seated in a separate private room during the experiment with no other light exposure than the experimental light or DL (<5 lx). Compliance was ensured by an assistant either present in the room or in the adjacent room and connected via audiophone and video.
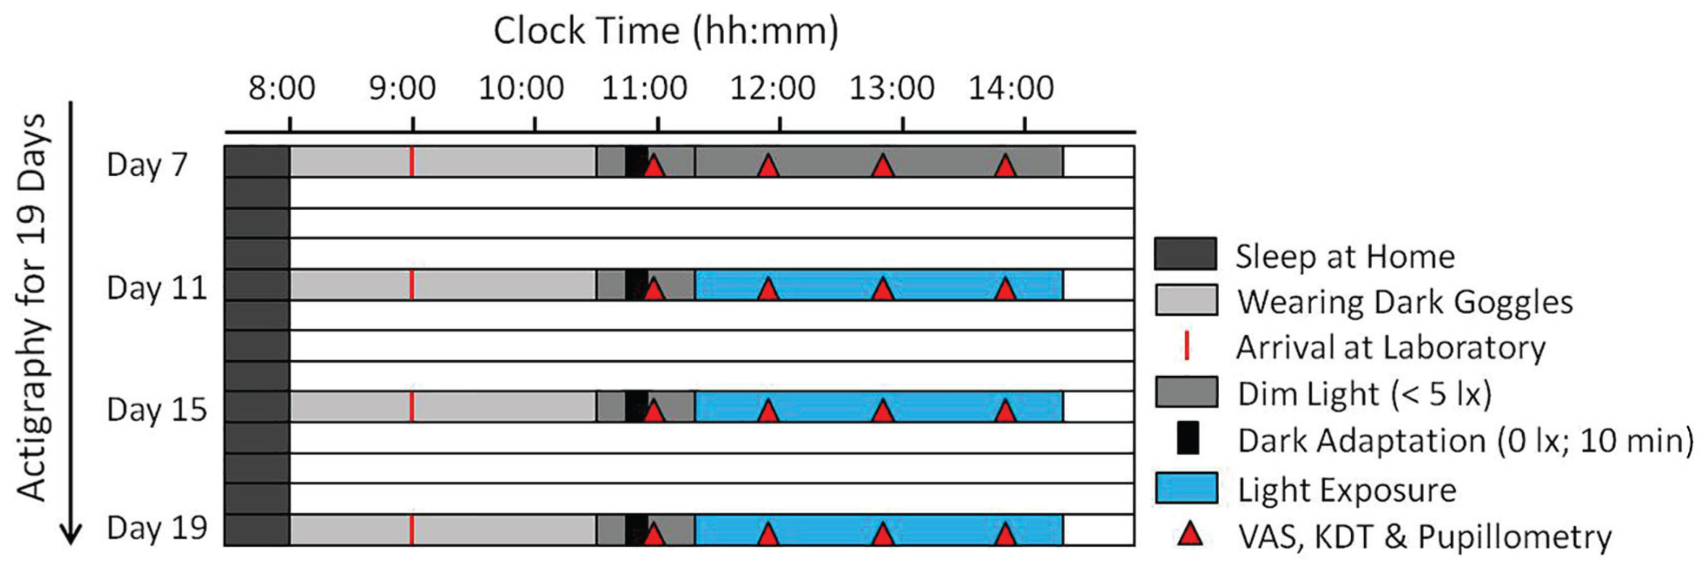
Study design. Participants kept regular bedtimes for 7 days preceding the laboratory visits (controlled by actigraphy; example for habitual wake time at 0800 h). During 4 laboratory visits, each participant was exposed to 1 of 3 different 3-h light exposures including a control condition in dim light (DL; randomized order; 4 days apart). Participants slept at home and arrived at the laboratory while wearing dark goggles 1 h after waking up. Electroencephalogram (EEG) electrodes were applied while participants still wore dark goggles. Participants then remained in DL for 50 min (i.e., baseline). Each test session included the Visual Analogue Scale (VAS) for subjective sleepiness, the Karolinska Drowsiness Test (KDT) in the wake-EEG (5 min closed eyes and 5 min open eyes), and pupillometry (35-s recordings; see Fig. 2).
Subjective and Objective Sleepiness
Participants rated their subjective sleepiness on a visual analogue scale (VAS; Lee et al., 1991). Objective sleepiness was assessed with the wake EEG via the Karolinska Drowsiness Test (KDT; Akerstedt and Gillberg, 1990). Each KDT consisted of a 5-min closed-eyes condition followed by 5-min open-eyes condition, during which participants had to refrain from moving and blinking to the best of their ability. The EEG recordings were performed with 8 derivations (F3, F4, C3, C4, P3, P4, O1, and O2) using a Rembrandt system (Monet 24-CPU hardware, TMS International, Enschede, the Netherlands; and Rembrandt 7.5 software, Medcare Automation, Amsterdam, the Netherlands). Here, we report results from 1 frontal (F3), central (C3), parietal (P3), and occipital (O1) derivation. The recordings were low-pass filtered (70 Hz) and high-pass filtered (0.3 Hz). After study completion, the EEG data were exported from the Rembrandt software and resampled at 256 Hz. Artifacts (movements and blinking) were removed semimanually with the EEG MATLAB toolbox (The MathWorks, Inc., Natick, MA), and all recordings were subjected to spectral analysis by applying a fast Fourier transformation in the range between 0.5 and 128.0 Hz with a resolution of 0.5 Hz. Here, we report data in the frequency range between 0.5 and 25.0 Hz. EEG power density for different frequency ranges was analyzed, and in addition, for each KDT, the Alpha Attenuation Test index (AAT index) was calculated. The AAT index is defined as the power density in the EEG alpha range (8-13 Hz) expressed as the ratio of closed eyes and open eyes. The AAT index has been previously validated as a measure of objective sleepiness, for which a higher AAT index indicates less sleepiness/greater objective alertness (Stampi et al., 1995).
Pupillometry
Pupil recordings were performed with a customized portable handheld device (NeuroLight, IDMED, Marseille, France) mono-ocularly (right eye), while the second eye was closed and covered by the participant’s hand. All pupil recordings were performed on nondilated pupils. Each recording lasted 35 s with a sampling frequency of 67 Hz. Each recording started with 3 s in complete darkness preceding a 1-s light pulse (pulse 1: 56 cd/m2), which was followed by 15 s in darkness. Then, there was another 1-s light pulse (pulse 2: 170 cd/m2) and again 15 s in complete darkness (see Fig. 2b for the spectrum of the 1-s light pulses). The pupil size during the first 0.25 s in darkness directly preceding the light pulses was averaged and defined as the baseline pupil size (BL; 100%). All pupil variables were expressed as relative pupil sizes (i.e., as a percentage of the BL pupil size). Two parameters were determined after each light pulse (Fig. 2a): the maximum contraction amplitude (CA) and the postillumination pupil response (PIPR). The maximum CA represents the relative pupil size with the greatest contraction of the pupil in response to the light stimulus. It is expressed as the difference between the BL pupil size and the maximum constricted relative pupil size. The PIPR was defined as the postillumination CA, expressed as the difference between the BL pupil size and the relative pupil size 6 s after the light pulse. To further minimize interindividual differences, both the maximum CA and the PIPR during the 3-h light exposures were expressed relative to the dark adapted pupil size (the first measurement was taken directly after a 10-min dark adaptation at the start of each study visit). The pupil measurements were performed hourly, after the KDTs.
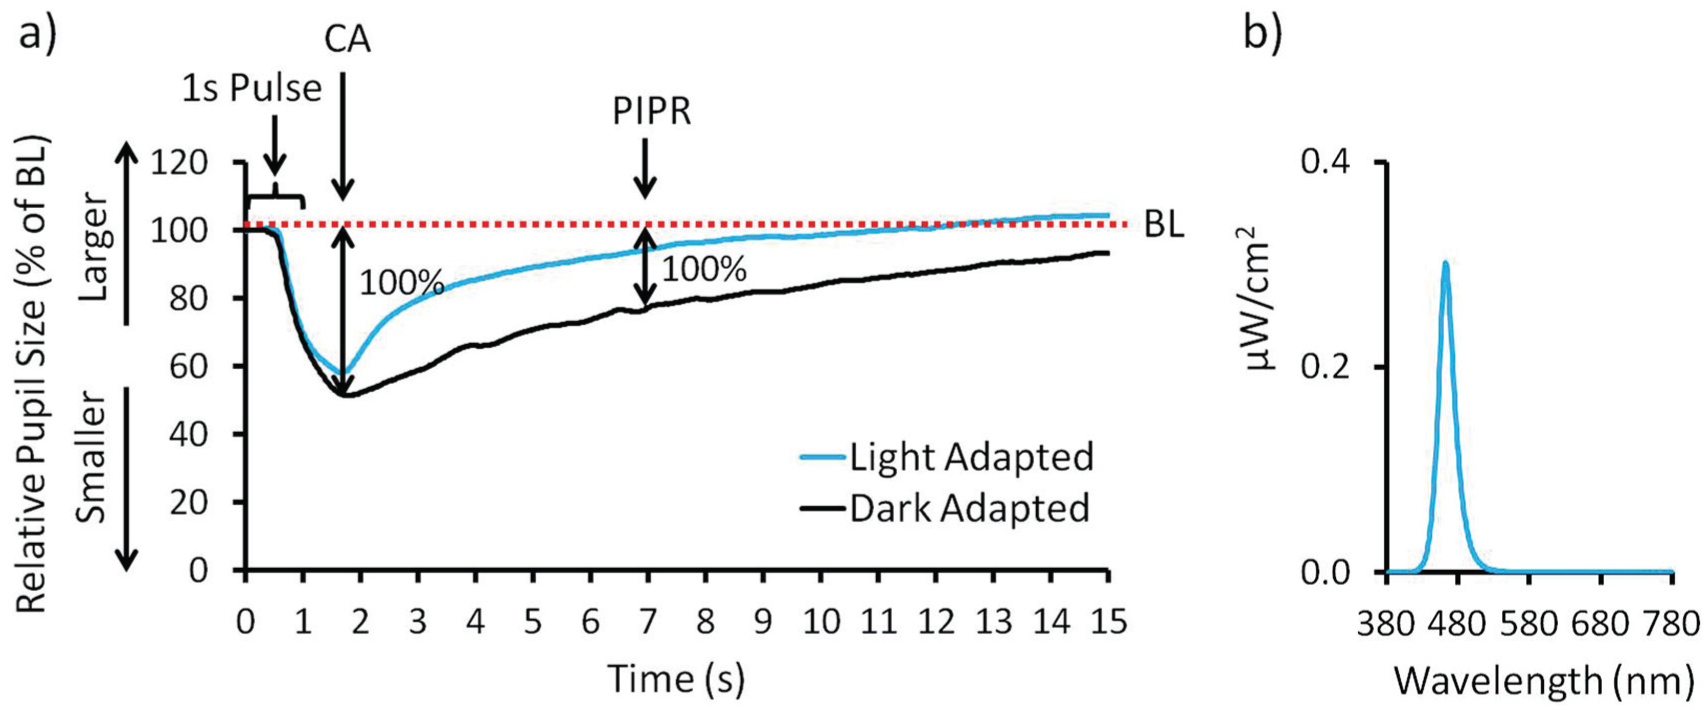
Variables pupillometry. (a) Example of 1 pupil recording. After 3 s in darkness (of which the last 0.25 s constitute baseline pupil size [BL]), participants were exposed to a 1-s light pulse. Pupil size is indicated as relative pupil size (pupil size/BL × 100). The maximum contraction amplitude (CA) is defined as the difference between the BL (dotted line) and the smallest relative pupil size. The postillumination pupil response (PIPR) is defined as the difference between the BL pupil size and the relative pupil size 6 s after offset of the 1-s light pulse. Both the maximum CA and the PIPR of light-adapted eyes (during the 3-h light exposure; gray line) were then expressed relative to the dark adapted pupil size (following a 10-min dark adaptation, black line; maximal response of 100 %). (b) Spectral power distribution of the 1-s light pulse.
Lighting Conditions
When designing the study, we intended to have visually indistinguishable polychromatic white-light sources with different spectral melanopic potentials (high vs. low). This was achieved by choosing 2 different peaks in the shorter-wavelength portion of the visible light spectrum, with one peak close to 480 nm and one peak around 435 nm. The lighting condition with a peak at 435 nm was called low-mel, since a peak at this wavelength is supposed to activate melanopsin less than the lighting condition with a peak at 480 nm, which was called high-mel. All lighting conditions were enriched with longer wavelengths of polychromatic lighting to achieve similar color temperatures and visually comfortable polychromatic white-lighting conditions, which differed in spectral power distribution (Fig. 3). The study was executed with a mixed within-between-subject design and had 2 different light exposure protocols:
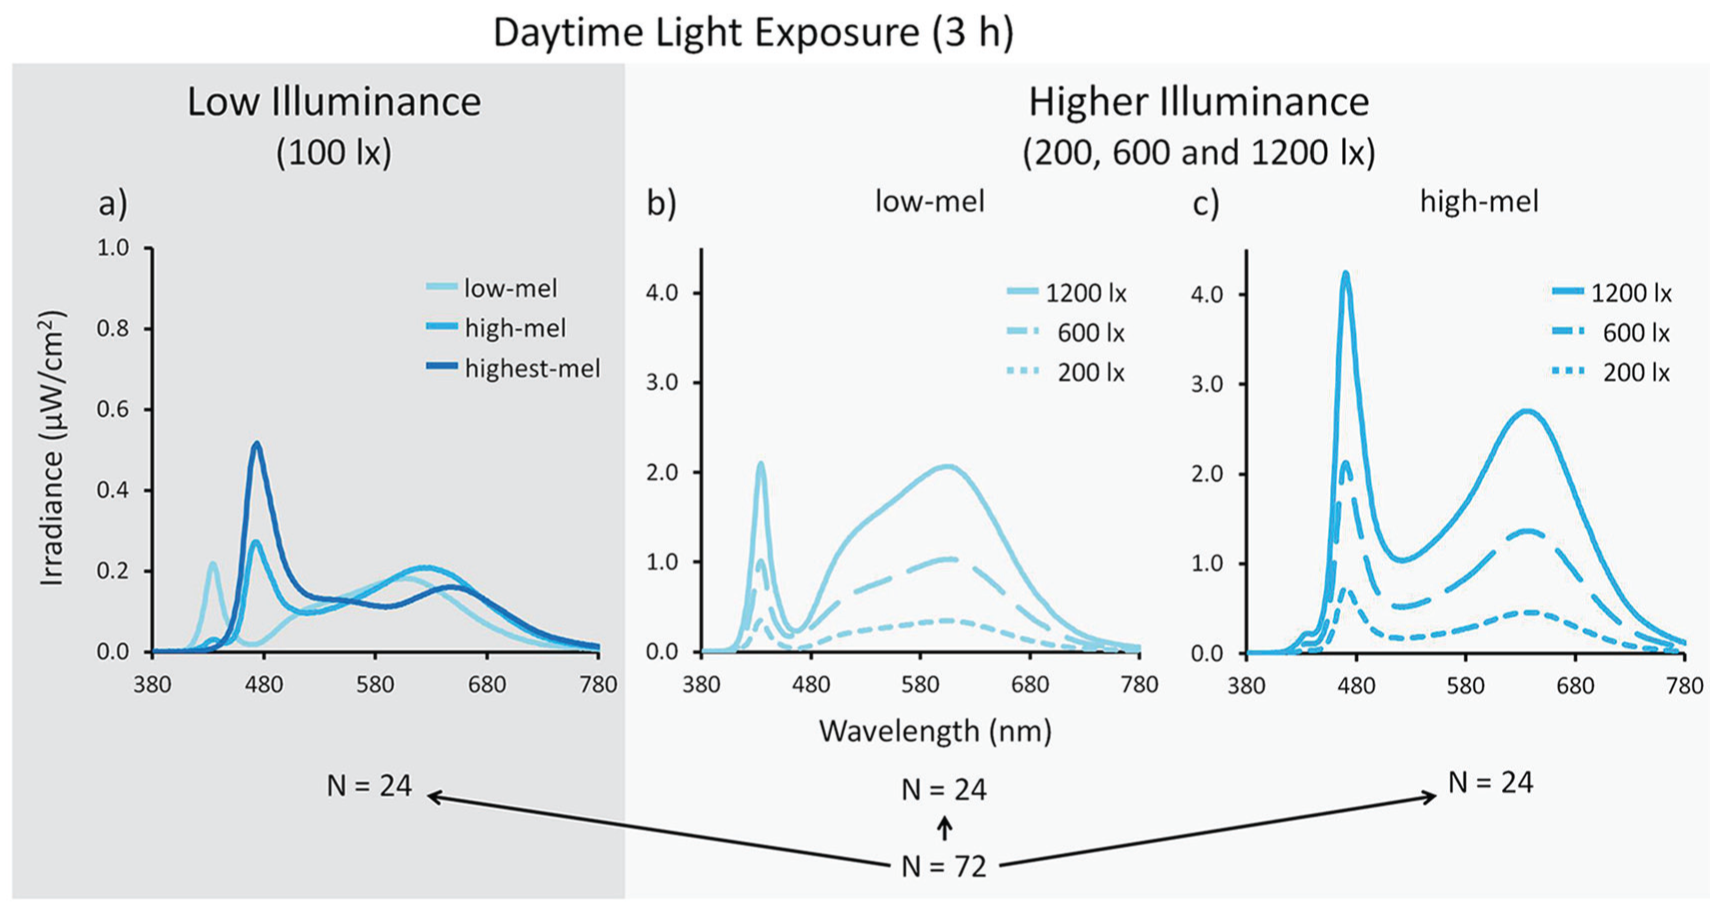
Spectral power distributions of metameric light exposure conditions. The 3-h light exposure conditions were divided into 2 main light exposure protocols: low illuminance (100 photopic lux; dark gray panel) and higher illuminance (200, 600 or 1200 photopic lux; light gray panel). (a) Twenty-four participants were exposed to low illuminance with different spectral compositions during the 4 visits (1 of which was a control dim light [DL] condition). The different conditions were: low-mel = metameric lighting condition with a peak wavelength at 435 nm enriched with longer-wavelength light; high-mel = metameric lighting condition with a peak at 480 nm enriched with longer-wavelength light; highest-mel = metameric lighting condition with a peak at 480 nm but with a smaller portion of long-wavelength light. (b, c) The higher illuminance group of 48 participants were exposed to different photopic lux intensities (including a control DL condition) and were subdivided into 2 groups of 24 participants. Each of these groups received 1 metameric lighting condition, either (b) low-mel or (c) high-mel, at different photopic lux intensities.
In the first light protocol (performed between March and May 2016), 24 participants (out of 72) were exposed to 3 different metameric light exposures of relatively low illuminance (low illuminance group; Fig. 3a; Table 1) and 1 control light exposure in DL (<5 lx). The 3 metameric lighting conditions were identical in photopic lux and color temperature (100 photopic lux; 3500 K) but differed in peak wavelength and enrichment with longer-wavelength polychromatic light. One metamer had a peak wavelength at 435 nm enriched with longer-wavelength polychromatic lighting (hereinafter called low-mel), the second metamer had a peak wavelength at 480 nm enriched with longer-wavelength polychromatic lighting (hereinafter called high-mel), and a third metamer also had a peak wavelength at 480 nm but was less enriched with longer-wavelength polychromatic lighting (hereinafter called highest-mel).
Light Characteristics.
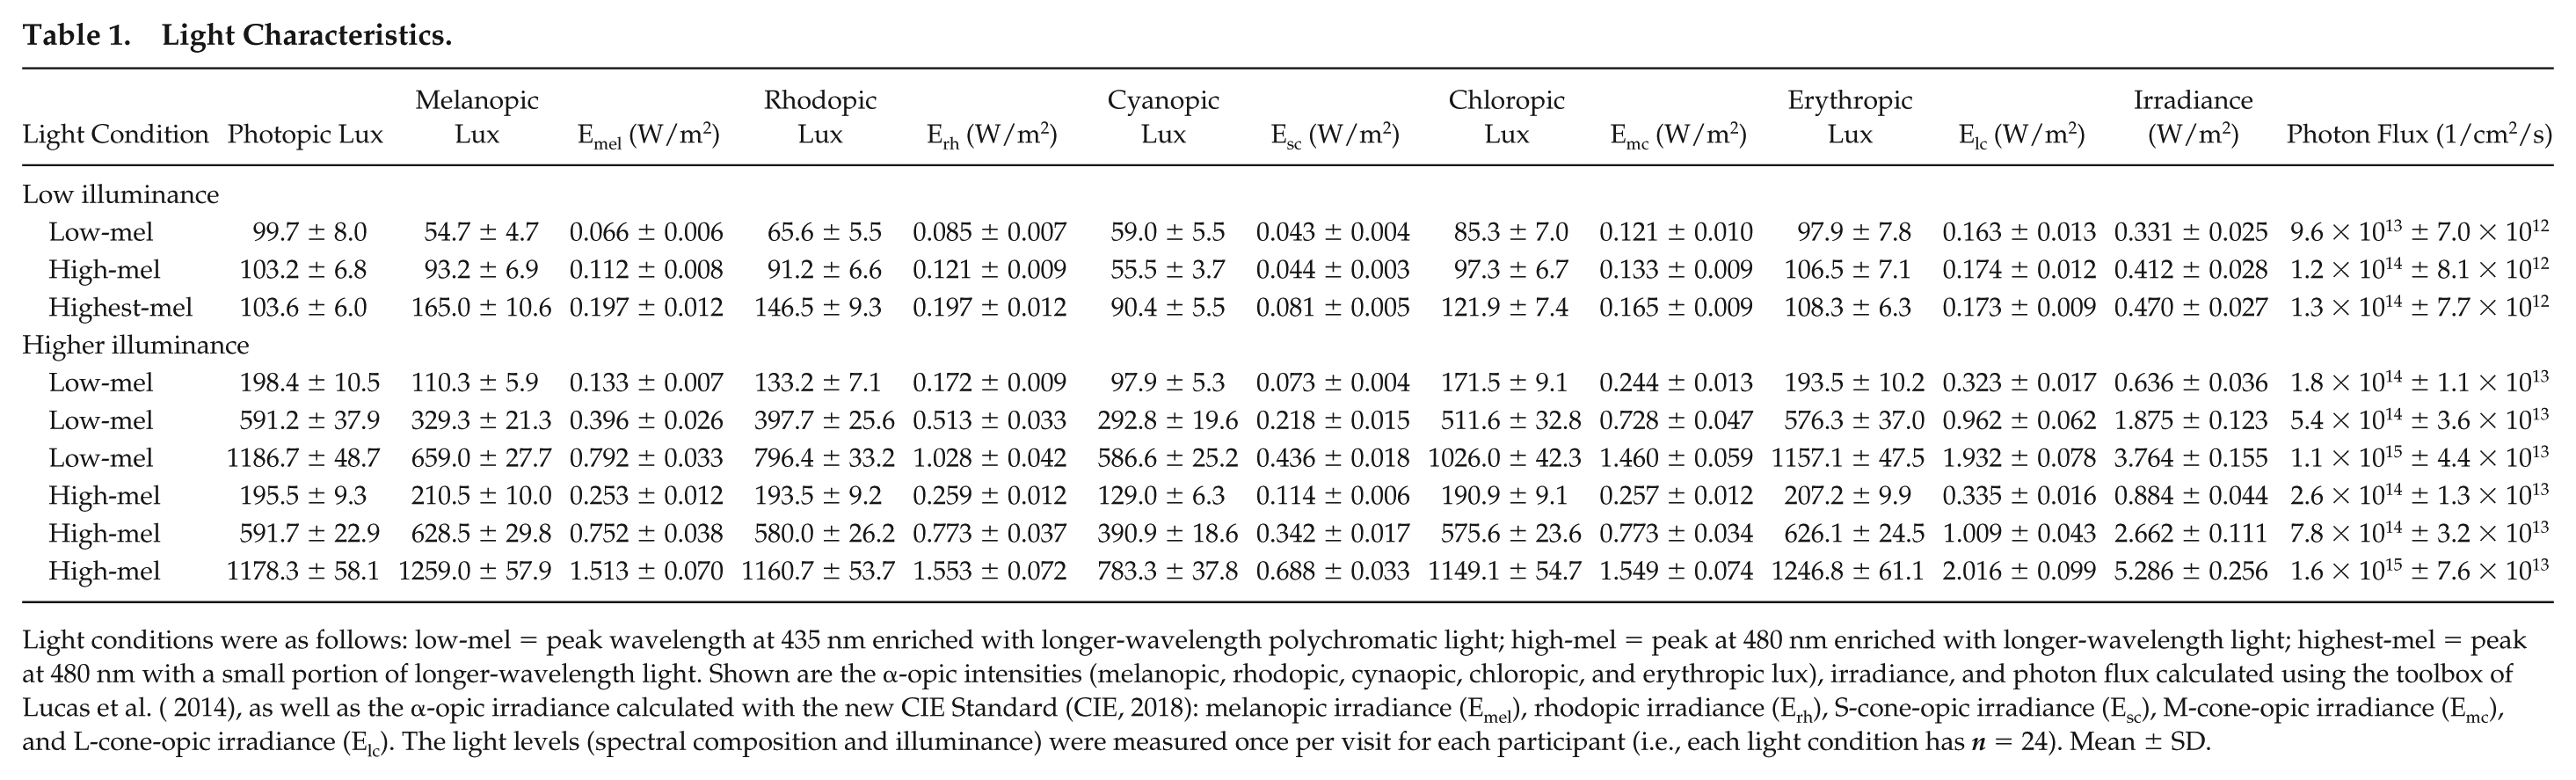
Light conditions were as follows: low-mel = peak wavelength at 435 nm enriched with longer-wavelength polychromatic light; high-mel = peak at 480 nm enriched with longer-wavelength light; highest-mel = peak at 480 nm with a small portion of longer-wavelength light. Shown are the α-opic intensities (melanopic, rhodopic, cynaopic, chloropic, and erythropic lux), irradiance, and photon flux calculated using the toolbox of Lucas et al. ( 2014), as well as the α-opic irradiance calculated with the new CIE Standard (CIE, 2018): melanopic irradiance (Emel), rhodopic irradiance (Erh), S-cone-opic irradiance (Esc), M-cone-opic irradiance (Emc), and L-cone-opic irradiance (Elc). The light levels (spectral composition and illuminance) were measured once per visit for each participant (i.e., each light condition has n = 24). Mean ± SD.
In the second light protocol (performed between October 2016 and May 2017), 48 participants (out of 72) were exposed to higher illuminance (higher illuminance group; Fig. 3b, c; Table 1). They were subdivided into 2 groups of 24 participants. Each subgroup of 24 participants received only 1 of the metameric lighting conditions (either low-mel or high-mel) at 3 different intensities (200, 600, and 1200 photopic lux) as well as a control condition in DL.
The order of light exposure conditions was randomized for all participants. All settings were identical, with the participants seated facing the light source (≈50-cm distance). The light sources consisted of 6 light-emitting diode (LED) light panels installed against the wall (each panel was 55 × 55 cm and contained 80 LED lamps; see the supplement for more details). The lamps for this study were produced by Vossloh-Schwabe GmbH (Urbach, Germany). The different metameric conditions were set before the start of the study by changing the input of the different LED modules and concomitantly measuring the light intensity with a spectrometer (Specbos 1201, Jeti, Jena, Germany). The measurements were taken at the eye level of a seated study assistant (in the exact position and distance to the light source as participants), until the desired lighting condition was achieved. The setting of the LED modules was then saved for each metameric condition and could be switched on/off via a tablet application throughout the study (Live Link, Trilux GmbH, Ansbach, Germany). The light exposure was measured once per visit directly after light onset with a spectrometer, at eye level in a vertical angle of gaze. DL was provided by a standing luminaire with a halogen bulb (polychromatic white light) and was controlled by means of a lux meter (Showtec, Digital Luxmeter). The exact experimental light intensities were chosen based on melanopic lux, in order to have approximately twice as much melanopic lux for the high melanopic condition when compared with the low melanopic condition. By the time this article was peer reviewed, the new CIE standard on ipRGC metrics was published (CIE, 2018) and all results are also shown using this new CIE standard. We also calculated the contrasts between all lighting conditions for the α-opic irradiances per photoreceptor (see Suppl. Table S2; Spitschan et al., 2015). In addition, we calculated the scotopic retinal illuminance (scotopic trolands) of our lighting conditions (according to Aguilar and Stiles, 1954; Wyszecki and Stiles, 2000; see Suppl. Table S3).
Statistical Analysis
All statistics were performed in IBM SPSS Statistics for Windows, version 23.0. (IBM Corp., Armonk, NY), and the results of the 2 lighting protocols were analyzed separately (i.e., the results for the low illuminance group and the higher illuminance group). First, all measurements on each visit were expressed relative to the baseline session in DL of that visit (i.e., darkness for pupillometry). For the low illuminance group, mixed linear models were performed with fixed factors “LIGHT SPECTRUM” (i.e., DL, low-mel, high-mel, and highest-mel) and “DURATION” (i.e., 20 min, 1 h 20 min, and 2 h 20 min after light onset) and the random factor “PARTICIPANT.” For the higher illuminance group, mixed linear models were performed with the fixed factors “LIGHT SPECTRUM” (i.e., DL, low-mel, and high-mel), “INTENSITY” (i.e., 5, 200, 600, and 1200 lx), and “DURATION” (i.e., 20 min, 1 h 20 min, and 2 h 20 min after light onset) and the random factor “PARTICIPANT.” These mixed linear models were performed on subjective sleepiness, each 0.5-Hz bin of the wake EEG data (0.5-25 Hz; in all derivations separately), the AAT index (in all derivations separately), and pupillometry (which additionally included the fixed factor “PULSE”; pulse 1 and pulse 2). For the EEG data, mixed linear models were initially performed that included all derivations in one model, with the additional factor “DERIVATION.” However, since “DERIVATION” showed no significant interactions, each derivation was subsequently analyzed in a separate model. The results of those separate models per derivation are reported in this article. All post hoc tests were corrected for multiple comparisons by the least significance difference test. Effect sizes were calculated with Cohen’s d. Correlations between pupillometry and subjective as well as objective sleepiness (AAT index) were performed using Spearman’s correlations, since the data were not normally distributed. Gender was initially included as a covariate but was omitted in all analyses since it was not significant for any of the variables (p > 0.05).
Results
Baseline
Each visit started with a baseline session in DL (for 50 min). These baseline sessions were compared to determine any differences preceding the light exposure. At baseline (prior to light exposure), there were a few significant differences: in the low illuminance group, the AAT index showed greater alertness prior to the low-mel condition compared with the high-mel and the highest-mel conditions (in all derivations; p < 0.002). In the low illuminance group, there were no significant differences at baseline sessions for subjective sleepiness, EEG spectrum, or pupillometry.
In the higher illuminance group, subjective sleepiness was at baseline lower prior to the low-mel condition compared with the high-mel condition (p < 0.005) and lower prior to 1200 lx compared with DL, 200 lx, or 600 lx (p < 0.038). There were no significant baseline session differences for the AAT index or the EEG spectrum. Pupillometry showed that the maximum CA did not differ in the baseline session prior to different light spectra but was smaller prior to 200 lx compared with 600 and 1200 lx (only after pulse 1; p < 0.033). The PIPR in the baseline session was smaller prior to the low-mel condition compared with the high-mel condition (after both pulses; p < 0.008) but did not differ prior to different light intensities. To adjust for these differences during the baseline sessions prior to light exposure, all results during the 3-h light exposures were expressed relative to the respective baseline sessions.
Subjective Sleepiness
Subjective Sleepiness in Low Illuminance
In low illuminance (100 photopic lux; n = 24), subjective sleepiness showed no significant effect of light spectrum (F3,76 = 0.317, p = 0.813; main effect of “LIGHT SPECTRUM”; Fig. 4a), and there was no significant difference between the 3 time points during the 3-h light exposures (F2,187 = 1.971, p = 0.142; main effect of “DURATION”) nor a significant interaction between these factors (F6,187 = 0.104, p = 0.996; “LIGHT SPECTRUM” × “DURATION”). When the light conditions were compared at each single time point, there were also no significant effects of light spectrum (p > 0.780).
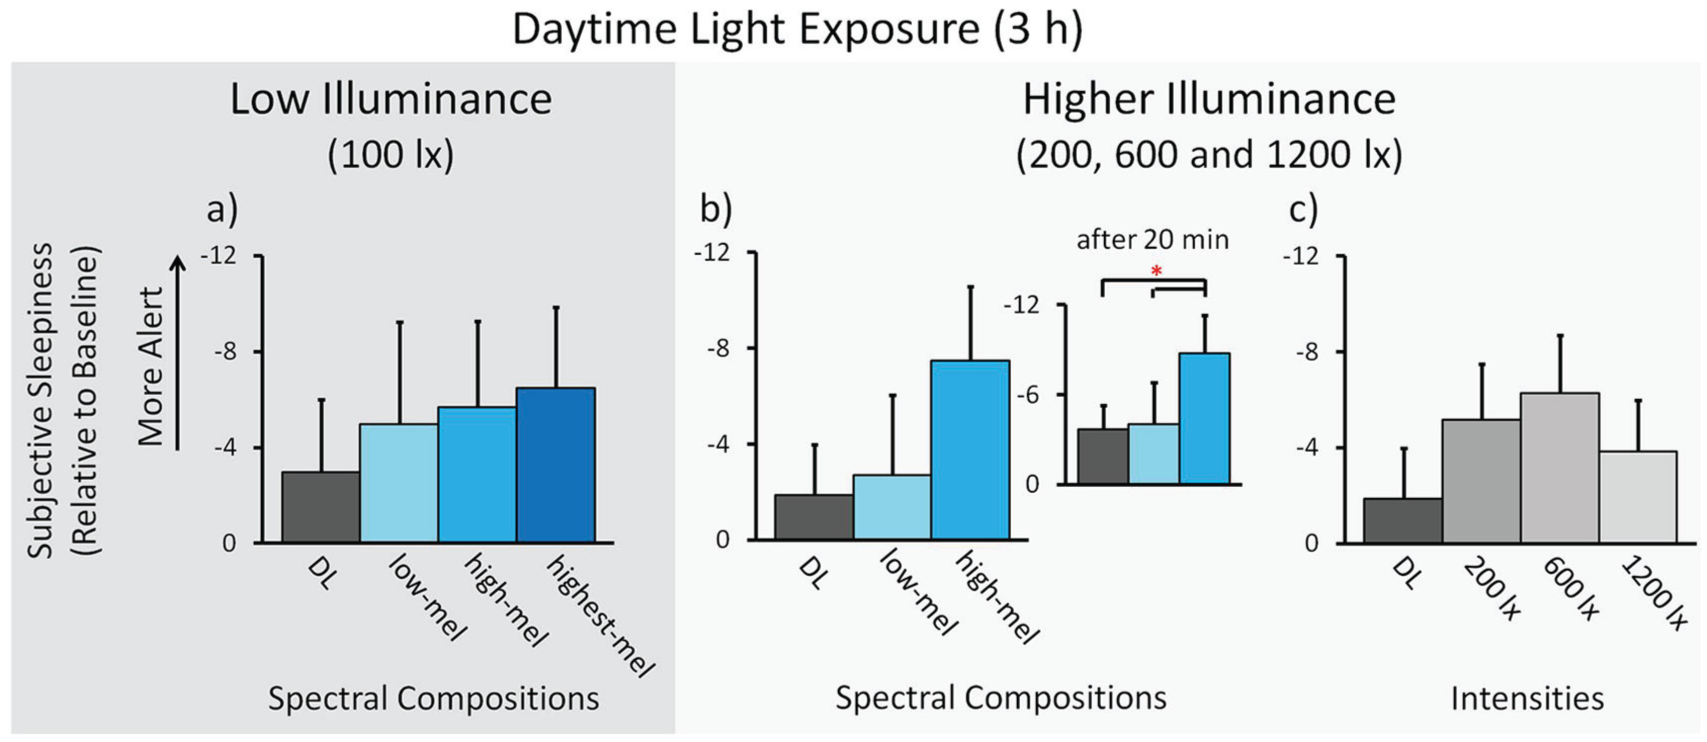
Subjective sleepiness. Results for low illuminance; n = 24: (a) Means across participants per spectral light composition (± SEM). Results for higher illuminance; n = 48: (b) Means across participants per spectral light composition. Inlay: The effect 20 min after the start of light exposure. (c) Means across participants for different light intensities. * p < 0.05. See Figure 3 and the text for a description of the light conditions.
Subjective Sleepiness in Higher Illuminance
In higher illuminance (200, 600, and 1200 photopic lux; n = 48), subjective sleepiness showed no significant effects of light spectrum (F1,107 = 2.682, p = 0.104; main effect of “LIGHT SPECTRUM”; Fig. 4b), and there was no significant effect of light intensity during the 3-h light exposure (F2,154 = 0.666, p = 0.515; main effect of “INTENSITY”; Fig. 4c). There was a significant difference between the 3 time points during the light exposure (F2,370 = 6.273, p = 0.002; main effect of “DURATION”), such that participants rated themselves sleepier over time (significantly sleepier after 2 h 20 min and 1 h 20 min, compared with 20 min after light onset, p < 0.003).
In a next step, the different lighting conditions were compared for each time point separately. This showed an acute alerting effect at the first time point (i.e., 20 min after light onset), with a significant effect of light spectrum (F1,81 = 4.137, p = 0.045; main effect of “LIGHT SPECTRUM”; Fig. 4b inlay). Post hoc analysis showed that participants rated themselves less sleepy in the high-mel compared with the low-mel condition (p = 0.045, Cohen’s d = −0.358) or DL (p = 0.022, d = −0.428). During the next 2 h, there was no significant effect of light spectrum (at 1 h 20 min: F1,86 = 2.910, p = 0.092; at 2 h 20 min: F1,109 = 0.715, p = 0.400; main effect of “LIGHT SPECTRUM”). There was no significant effect of light intensity at any of the single time points (p > 0.117) and no significant interactions (over the 3 h, nor at any single time point; p > 0.274).
Objective Sleepiness
Objective sleepiness was measured in the wake EEG by analyzing the power density in the frequency range from 0.5 to 25 Hz and specifically in the EEG alpha frequency range by means of the AAT index (see the Methods section).
AAT Index
AAT Index in Low Illuminance
In low illuminance (100 photopic lux), the AAT index showed a significant effect of light spectrum during the 3-h light exposures. Figure 3 shows the results of only the frontal derivation, since all other derivations showed similar results (F3: F3,72 = 5.452, p = 0.002, Fig. 5a; C3: F3,74 = 5.838, p = 0.001; P3: F3,75 = 5.065, p = 0.003; O1: F3,73 = 3.465, p = 0.020; main effect of “LIGHT SPECTRUM”). Post hoc analysis showed in all derivations that participants were more alert in the highest-mel lighting condition compared with low-mel and DL (p < 0.013, d = between 0.364 and 0.815) as well as more alert in the high-mel condition compared with low-mel and DL (p < 0.045, d = between 0.440 and 0.662). There was a significant difference between the 3 time points during the light exposure in all derivations (F3: F2,186 = 6.572, p = 0.002; C3: F2,188 = 5.641, p = 0.004; P3: F2,189 = 5.645, p = 0.004; O1: F2,188 = 4.352, p = 0.014; main effect of “DURATION”), such that participants became sleepier over time (significantly sleepier after 2 h 20 min compared with 20 min or 1 h 20 min after light onset, p < 0.011). There were no significant interactions in any of the derivations (“LIGHT SPECTRUM” × “DURATION”; p > 0.184).
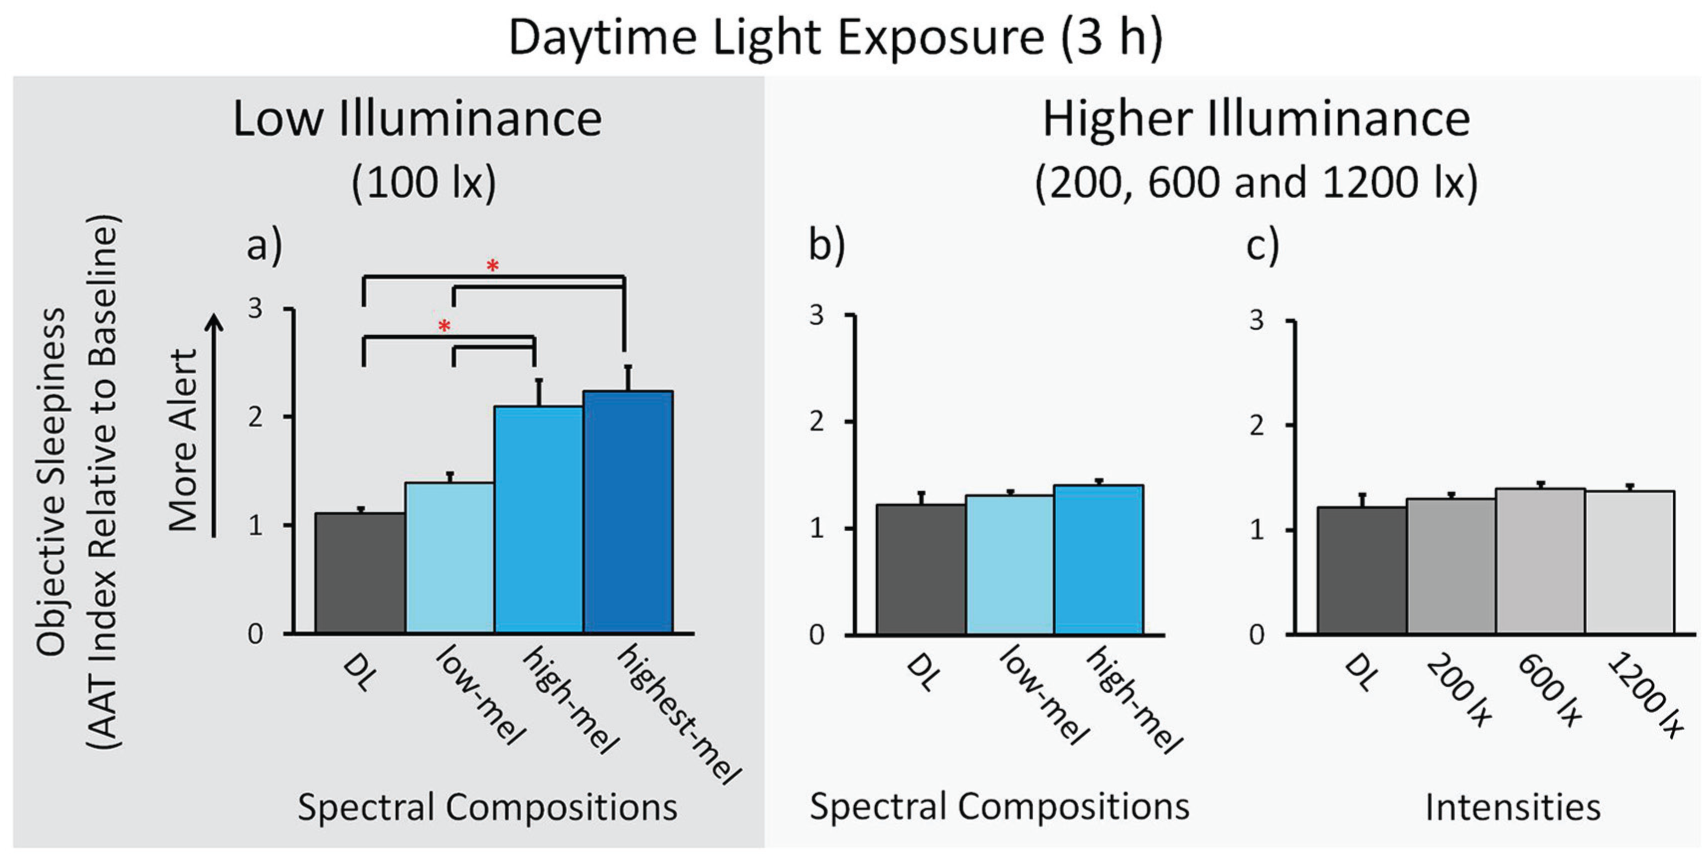
Objective sleepiness (electroencephalogram [EEG]-derived Alpha Attenuation Test index). The AAT index in the frontal derivation of the wake EEG. Results for low illuminance; n = 24: (a) Means across participants per spectral light composition (± SEM). Results for higher illuminance; n = 48: (b) Means across participants per spectral light composition. (c) Means across participants for different light intensities. * p < 0.05. See Figure 3 and the text for a description of the light conditions.
AAT Index in Higher Illuminance
In higher illuminance (200, 600, and 1200 photopic lux), the AAT index showed no significant effect of light spectrum during the 3-h light exposure in any of the derivations (F3: F1,99 = 0.118, p = 0.732, Fig. 5b; C3: F1,85 = 0.009, p = 0.924; P3: F1,56 = 0.064, p = 0.801; O1: F1,82 = 2.920, p = 0.091; main effect of “LIGHT SPECTRUM”) and no significant effect of light intensity (F3: F2,125 = 0.295, p = 0.745, Fig. 5c; C3: F2,134 = 0.256, p = 0.774; P3: F2,138 = 0.087, p = 0.917; O1: F2,132 = 0.099, p = 0.906; main effect of “INTENSITY”). There was a significant difference between the 3 time points during the light exposure in the derivations C3 and P3 but no significant difference in F3 and O1 (F3: F2,341 = 2.797, p = 0.062; C3: F2,351 = 3.976, p = 0.020; P3: F2,356 = 4.454, p = 0.012; O1: F2,340 = 0.388, p = 0.679; main effect of “DURATION”), such that participants became sleepier over time (in C3 and P3 significantly sleepier after 2 h 20 min and 1 h 20 min compared with 20 min after light onset, p < 0.007). There were no significant interactions in any of the derivations (p > 0.421).
Wake EEG Spectrum from 0.5 to 25 Hz
Wake EEG in Low Illuminance
In low illuminance (100 photopic lux), the wake EEG (0.5-25 Hz; open eyes) showed a significant effect of light spectrum during the 3-h light exposure in all derivations for the 0.5-Hz bins of the EEG alpha and sigma frequency ranges (F3: 7.5-13.5 Hz, Fig. 6a; C3: 7.5-12.5, Fig. 6b; P3: 8.0-17.0 Hz and 21.0-23.5 Hz, Fig. 6c; O1: 8.5-14.5 Hz, Fig. 6d; main effect of “LIGHT SPECTRUM”; p < 0.05). Post hoc analysis showed lower EEG power density in the high-mel and highest-mel conditions compared with low-mel or DL for the alpha frequency range in all derivations and additionally the sigma frequency range in P3 (p < 0.05, d = between −0.361 and −0.887; Fig. 6a-d; Table 2). There was a significant difference between the 3 time points during the light exposure in all derivations for the 0.5-Hz bins of certain frequency ranges (F3: 4.0-8.5 Hz and 12.5-24.5 Hz; C3: 3.5-8.5 Hz and 12.5-18.5 Hz; P3: 2.5-9.0 Hz and 12.5-21.5 Hz; O1: 3.5-8.5 Hz and 12.5-25.0 Hz; main effect of “DURATION”; p < 0.05), such that EEG power density was increased over time for the theta, sigma, and beta frequency ranges (p < 0.05). There were no significant interactions in any of the derivations (p > 0.05).
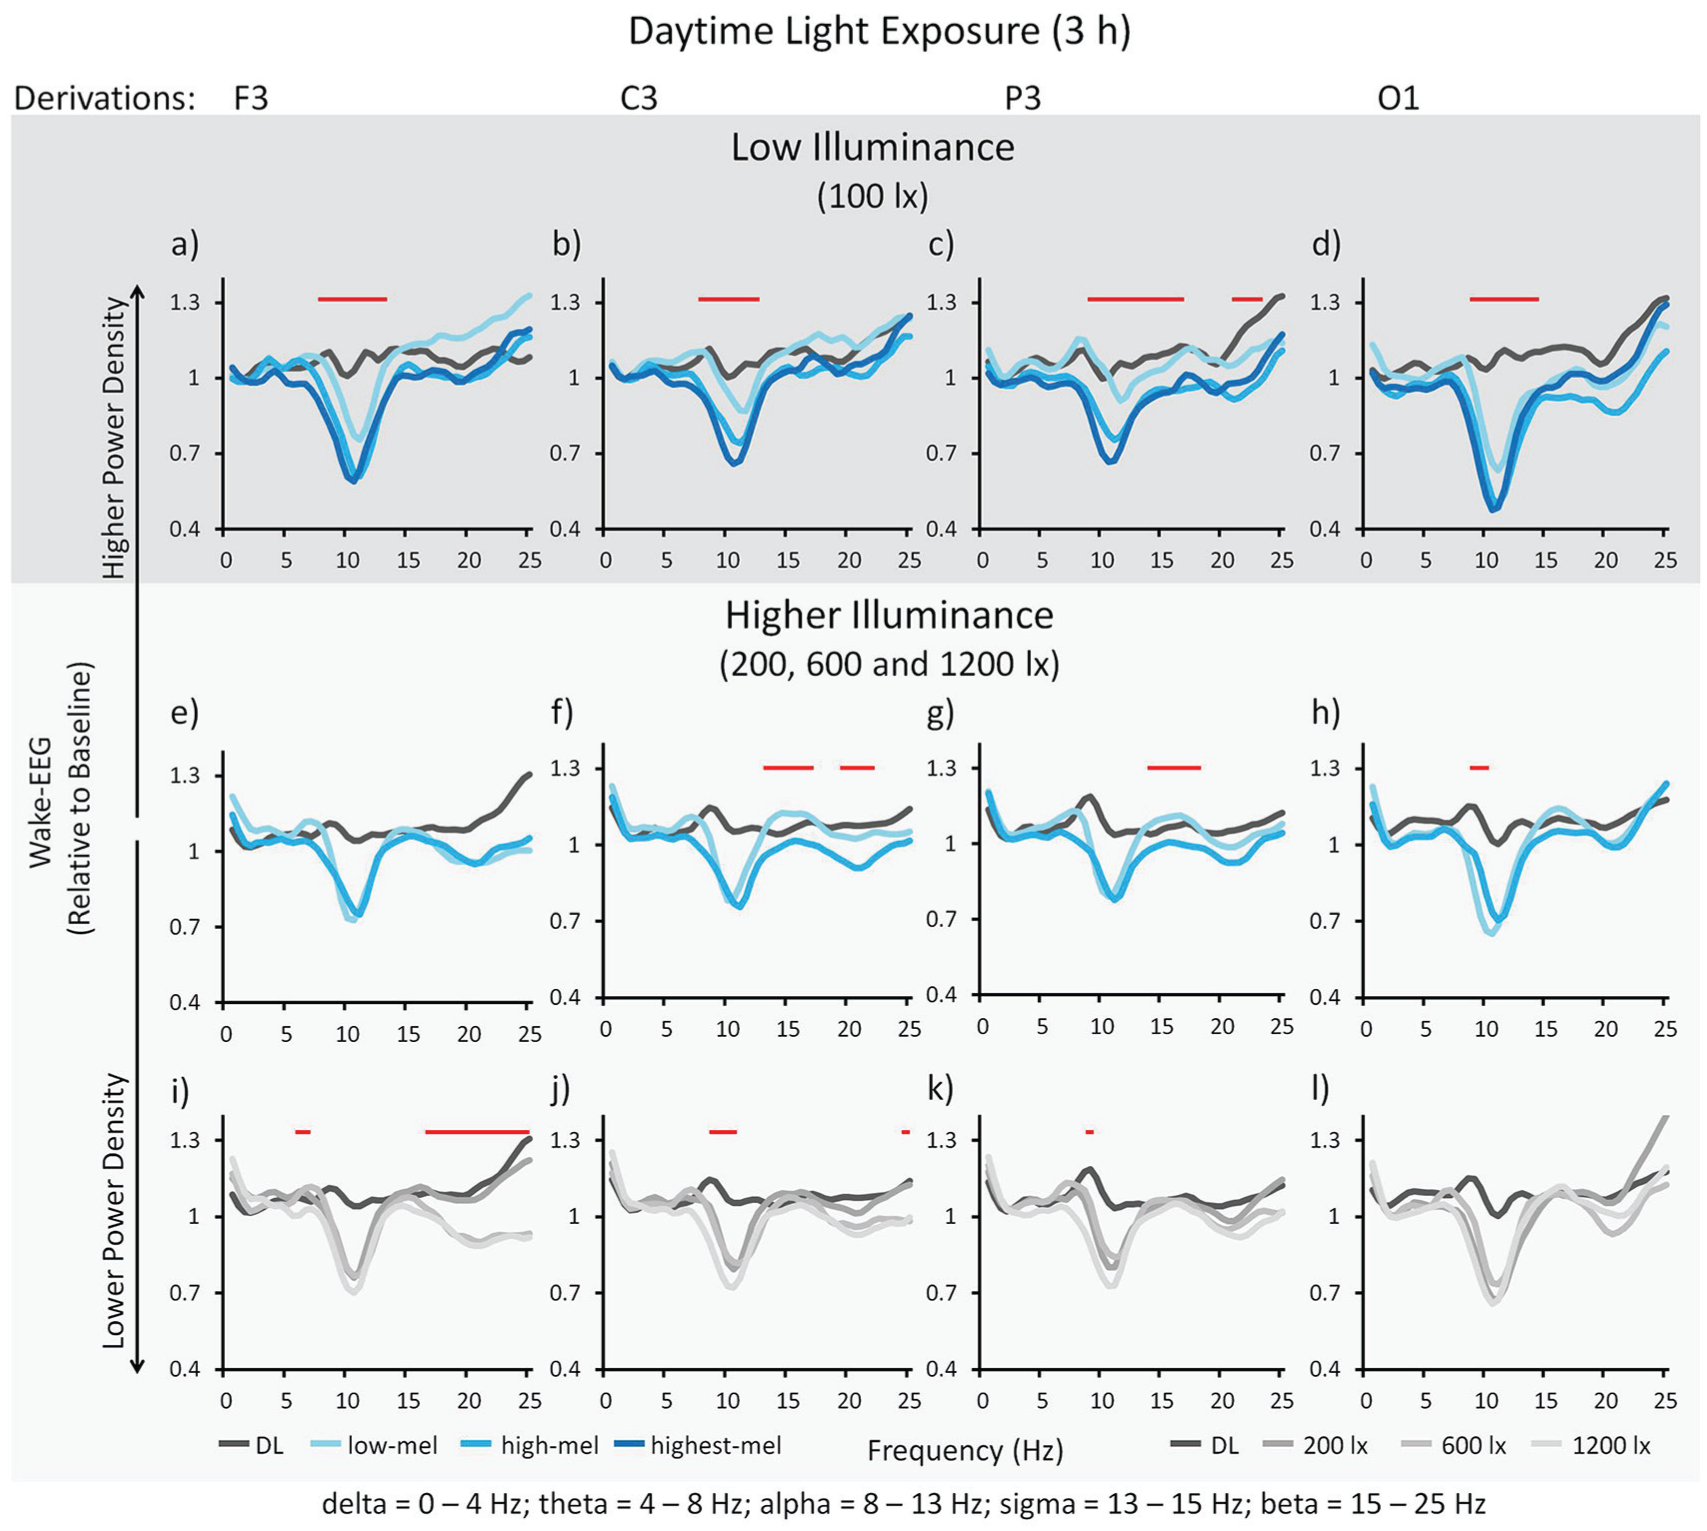
Wake electroencephalogram (0 -25 Hz; all derivations) in open eyes. Delta 0 to 4 Hz; theta 4 to 8 Hz; alpha 8 to 13 Hz; sigma 13 to 15 Hz; beta 15 to 25 Hz. Results for low illuminance; n = 24: Means across participants per spectral light composition (a-d). Significant main effects of spectral composition for all derivations: (a) in F3 for 7.5 to 13.5 Hz, (b) in C3 for 7.5 to 12.5 Hz, (c) in P3 for 8.0 to 17.0 Hz as well as 21.0 to 23.5 Hz, and (d) in O1 for 8.5 to 14.5 Hz. Results for higher illuminance; n = 48: Means across participants per spectral light composition (e-h). Significant main effects of spectral composition for all derivations except F3: (e) F3 ns, (f) in C3 for 13.0 to 17.5 Hz as well as 19.5 to 22.0 Hz, (g) in P3 for 13.5 to 18.0 Hz, and (h) in O1 for 9.0 to 10.5 Hz. Means across participants for different light intensities (i-l). Significant main effects of photopic intensity for all derivations: (i) in F3 for 5.5 to 6.5 Hz as well as 16.0 to 25.0 Hz, (j) in C3 for 8.5 to 10.5 Hz as well as 24.5 to 25.0 Hz, (k) in P3 for 9.0 to 9.5 Hz and (l) not in O1. Horizontal straight lines indicate the 0.5-Hz bins with a significant main effect for spectral composition or intensity (p < 0.05). See Figure 3 for a description of the light conditions and Table 2 for post-hoc comparisons.
Wake electroencephalogram: post hoc analyses.
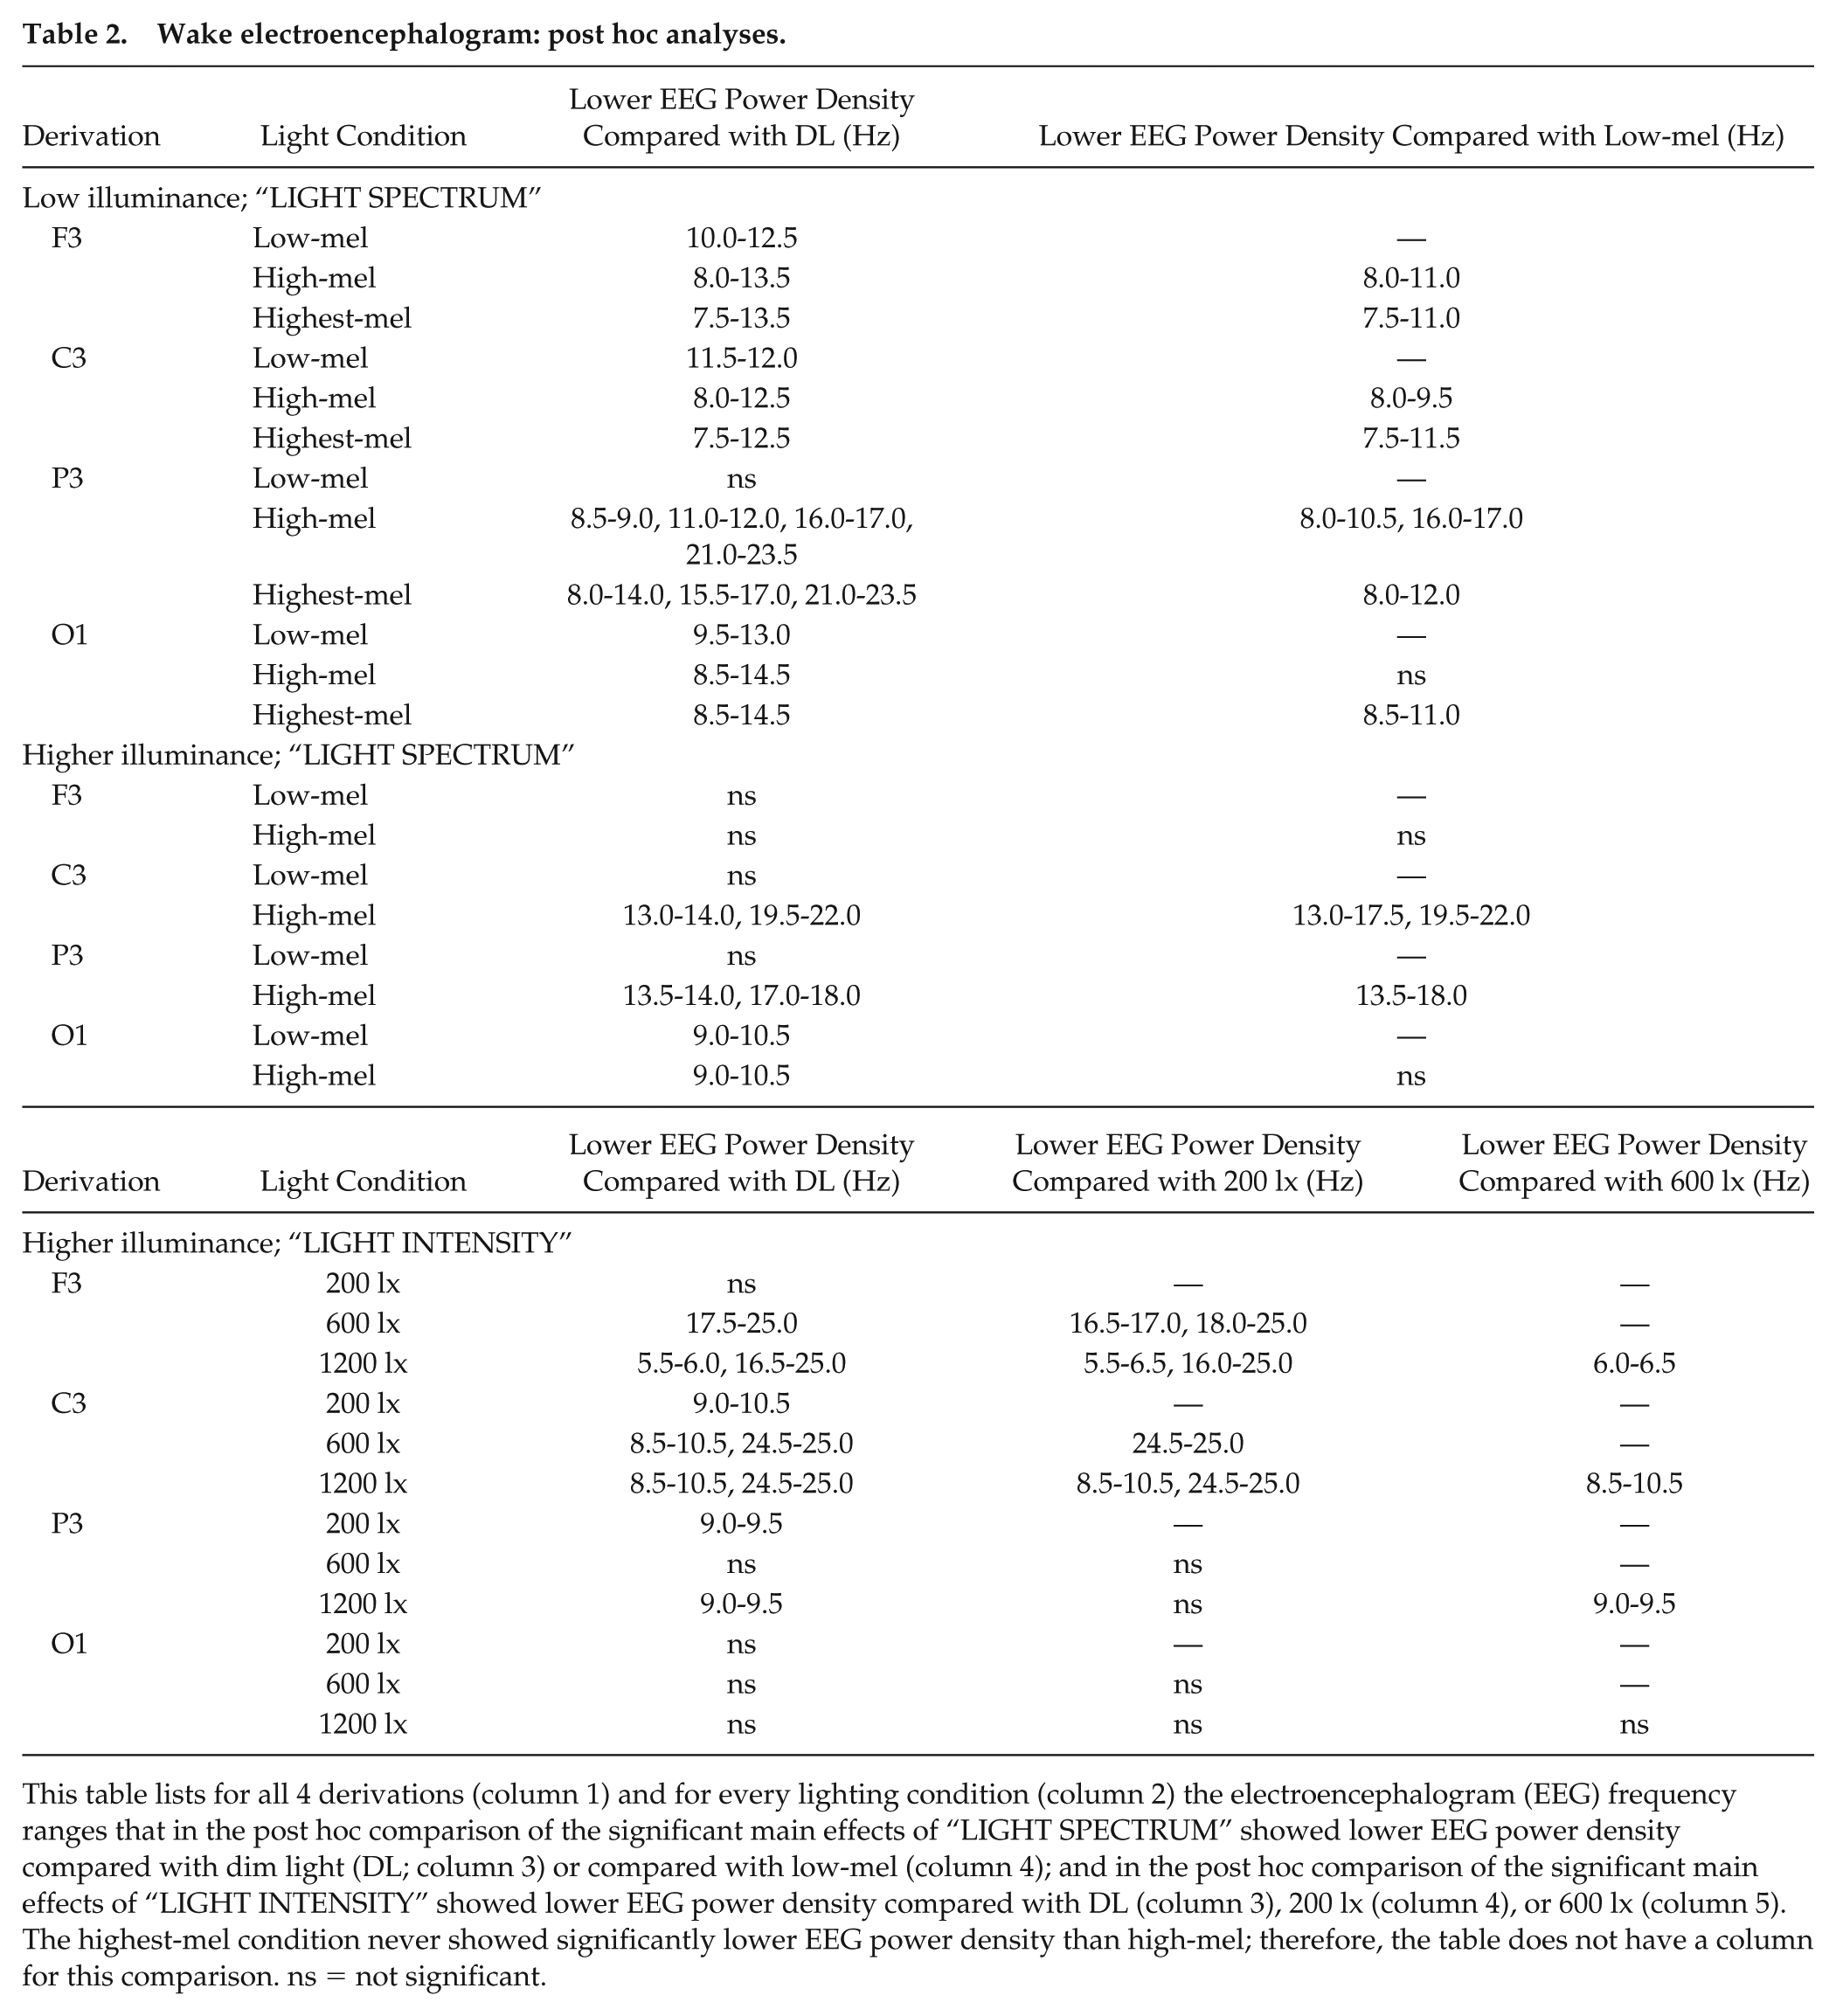
This table lists for all 4 derivations (column 1) and for every lighting condition (column 2) the electroencephalogram (EEG) frequency ranges that in the post hoc comparison of the significant main effects of “LIGHT SPECTRUM” showed lower EEG power density compared with dim light (DL; column 3) or compared with low-mel (column 4); and in the post hoc comparison of the significant main effects of “LIGHT INTENSITY” showed lower EEG power density compared with DL (column 3), 200 lx (column 4), or 600 lx (column 5). The highest-mel condition never showed significantly lower EEG power density than high-mel; therefore, the table does not have a column for this comparison. ns = not significant.
Wake EEG in Higher Illuminance
In higher illuminance (200, 600, and 1200 photopic lux), the wake EEG (0.5-25 Hz; open eyes) showed a significant effect of light spectrum during the 3-h light exposure in all derivations, except for F3, for the 0.5-Hz bins of certain frequency ranges (F3: ns, Fig. 6e; C3: 13.0-17.5 and 19.5-22.0 Hz, Fig. 6f; P3: 13.5-18.0 Hz, Fig. 6g; O1: 9.0-10.5 Hz, Fig. 6h; main effect of “LIGHT SPECTRUM”; p < 0.05). Post hoc analysis showed lower EEG power density in the high-mel condition compared with low-mel or DL for 0.5-Hz bins in the alpha, sigma, and beta frequency ranges (p < 0.05, d = between −0.353 and −0.896; Fig. 6e-h; Table 2). There was a significant effect of light intensity during the 3-h light exposure in all derivations, except for O1, for the 0.5-Hz bins of certain frequency ranges (F3: 5.5-6.5 Hz and 16.0-25.0 Hz, Fig. 6i; C3: 8.5-10.5 and 24.5-25.0 Hz, Fig. 6j; P3: 9.0-9.5 Hz, Fig. 6k; O1: ns, Fig. 6l; main effect of “INTENSITY”; p < 0.05). Post hoc analysis showed lower EEG power density for higher light intensities (600 and 1200 lx) compared with lower light intensities (200 lx) for the theta, alpha, sigma, and beta frequency ranges (p < 0.05, d = between −0.295 and −0.916; Fig. 6i-l; Table 2). There was a significant difference between the 3 time points during the light exposure in all derivations for the 0.5-Hz bins of certain frequency ranges (F3: 0.5-25.0 Hz; C3: 0.5-10.5 Hz and 11.5-25.0 Hz; P3: 0.5-2.0 Hz and 3.0-25.0 Hz; O1: 0.5-25.0 Hz; main effect of “DURATION”; p < 0.05), such that power density was increased over time for the entire 0.5- to 25-Hz frequency range (p < 0.05). There were no significant interactions in any of the derivations (p > 0.05).
Pupillometry
In this study, the maximum CA and PIPR were used to determine statistically the differences of the pupil responses between lighting conditions. In Figure 7, we show the tracings of the average relative pupil size for all lighting conditions (expressed relative to the dark adapted pupil).
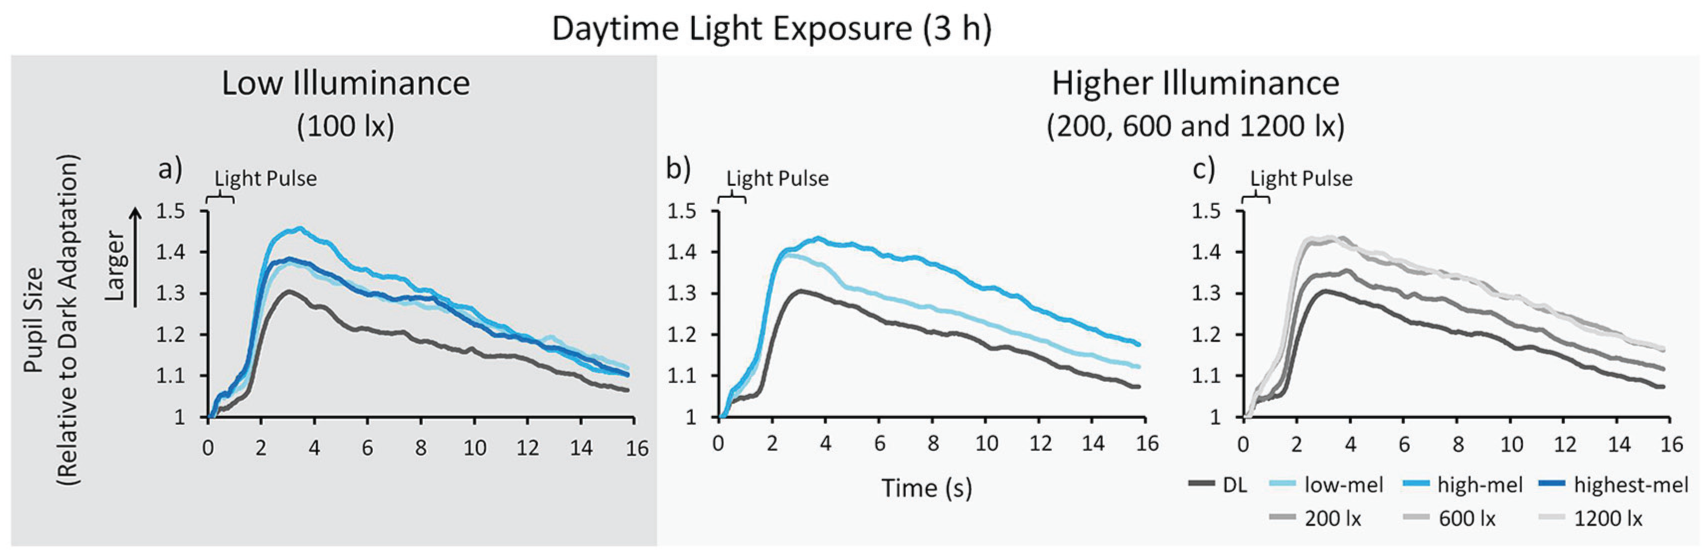
Pupil tracings. Shown here are the approximately 15 s following the 1-s light pulse (averaged over both light pulses). Results for low illuminance; n = 24: (a) Means across participants per spectral light composition. Results for higher illuminance; n = 48: (b) Means across participants per spectral light composition. (c) Means across participants for different light intensities. Please note: larger relative pupil sizes indicate a smaller maximum contraction amplitude and postillumination pupil response. See Figure 3 and the text for a description of the light conditions.
Maximum CA and PIPR
Maximum CA and PIPR in Low Illuminance
In low illuminance (100 photopic lux), the maximum CA and the PIPR of the PLR showed a significant effect of light spectrum during the 3-h light exposure (maximum CA: F3,255 = 15.759, p < 0.001; Fig. 8a; PIPR: F3,263 = 26.348, p < 0.001; Fig. 8d; main effect of “LIGHT SPECTRUM”). Post hoc analysis showed that the maximum CA and the PIPR were smaller (i.e., a smaller contraction and a faster redilation) in all light conditions compared with DL (p < 0.006, d = between −0.227 and −0.875) and were smaller in highest-mel and high-mel compared with low-mel (p < 0.030, d = between −0.206 and −0.232; Fig. 8a,d). There was no significant difference between the 3 time points during the light exposure (maximum CA: F2,255 = 0.060, p = 0.942; PIPR: F2,263 = 0.139, p = 0.870; main effect of “DURATION”). There was a significant difference between the 2 different light pulses (maximum CA: F1,279 = 400.491, p < 0.001; PIPR: F1,285 = 116.067, p < 0.001; main effect of “PULSE”). Post hoc analysis showed that the maximum CA and PIPR were smaller (i.e., a smaller contraction and a faster redilation) after the less intense light pulse 1 than after the brighter light pulse 2. There were no significant interactions (p > 0.115).
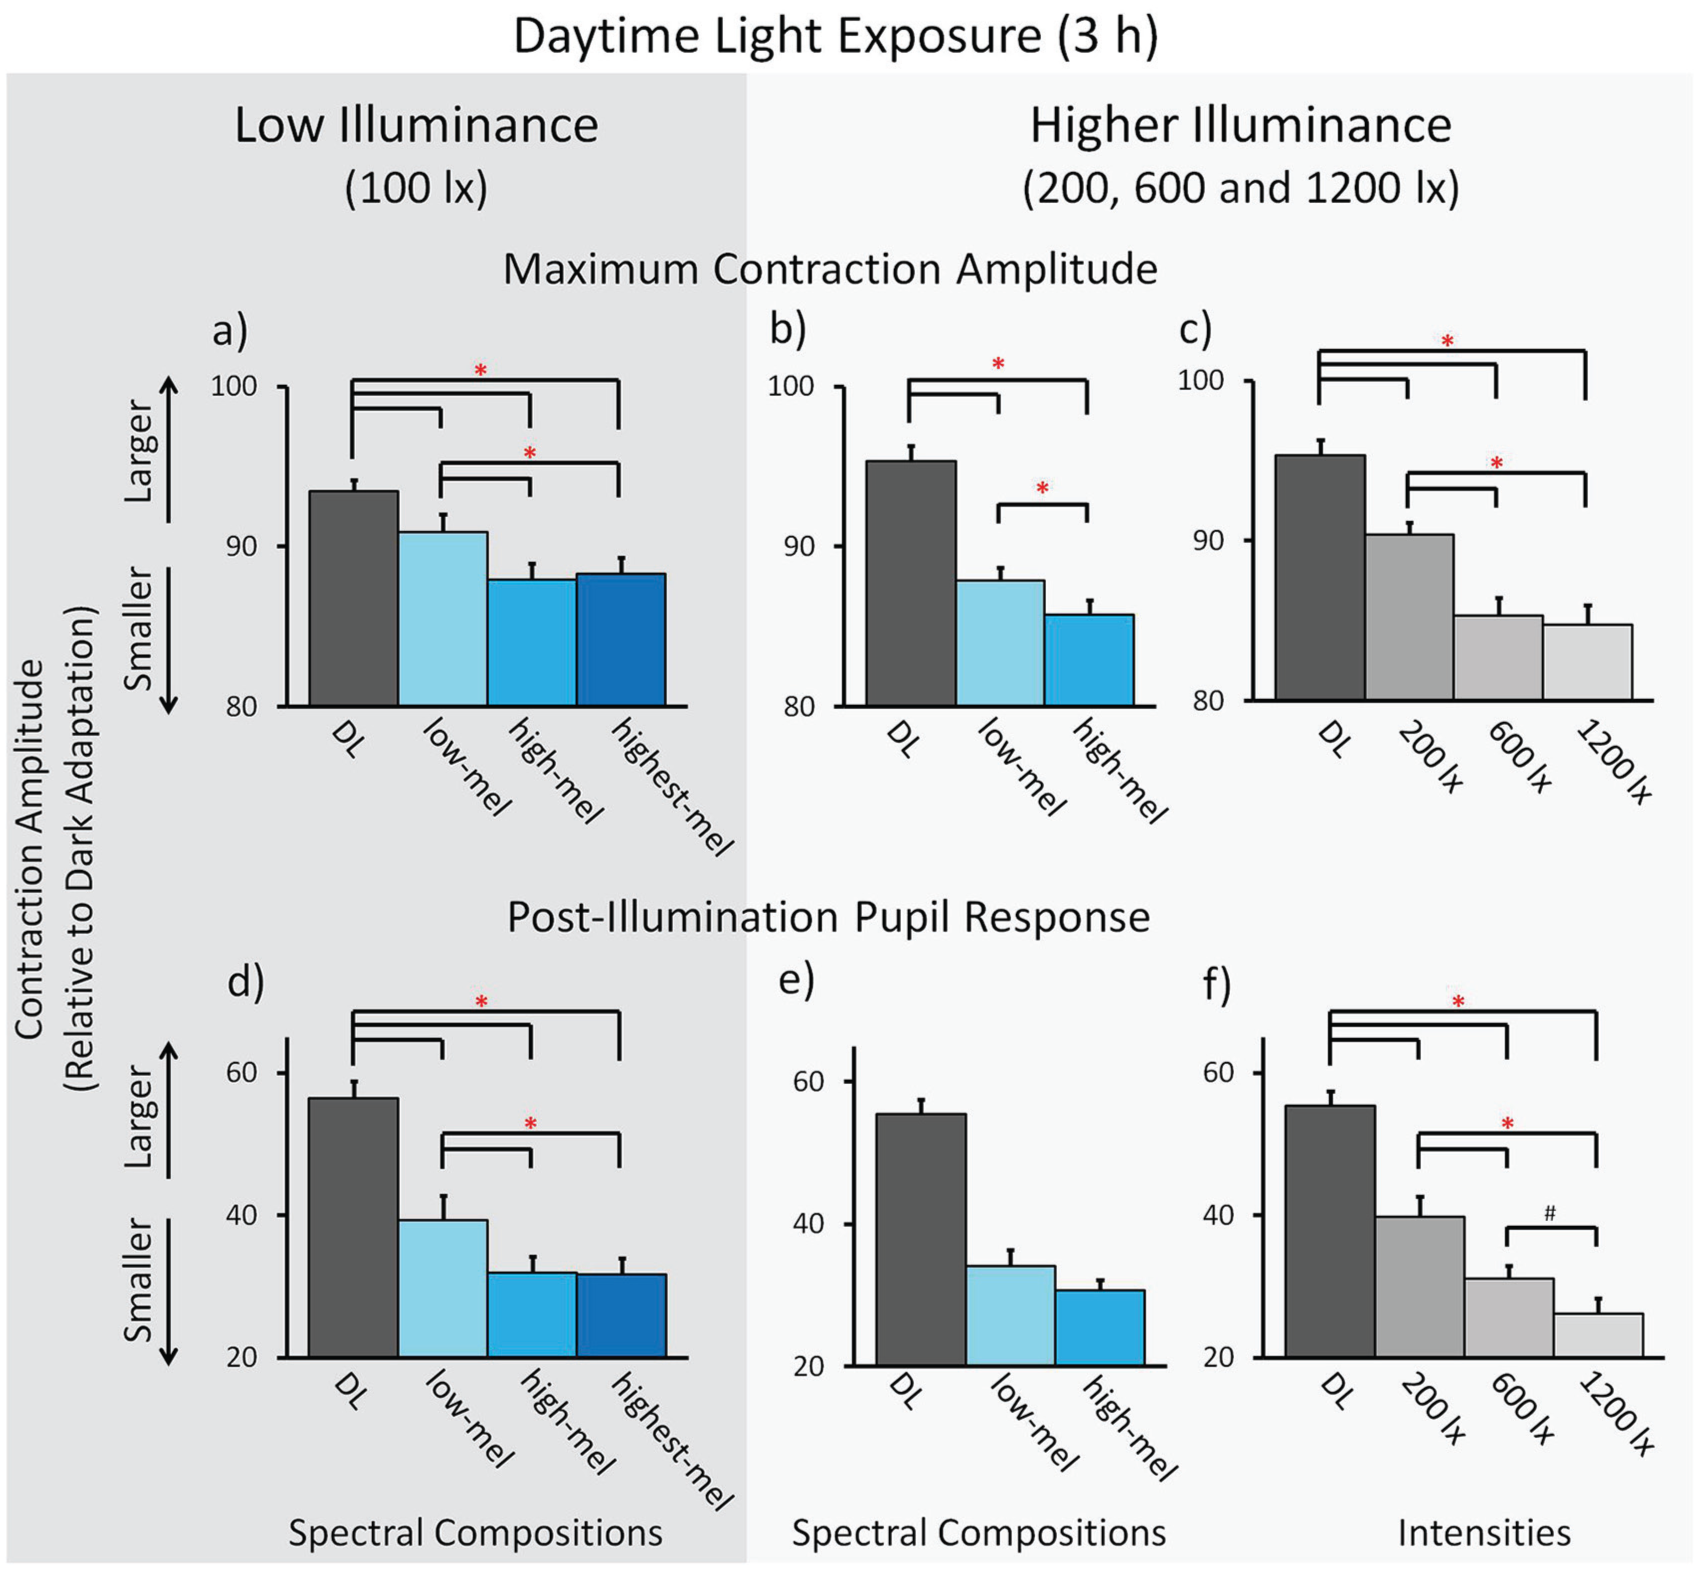
Pupillometry: Maximum contraction amplitude (CA) and postillumination pupil response (PIPR). Results for low illuminance; n = 24 (a, d): Means across participants per spectral light composition for (a) the maximum CA, and (d) the PIPR (± SEM). Results for higher illuminance; n = 48: Means across participants per spectral light composition for (b) the maximum CA and (e) the PIPR. Means across participants for different light intensities for (c) the maximum CA and (f) the PIPR. * p < 0.05. # p < 0.10. See Figure 3 and the text for a description of the light conditions.
Maximum CA and PIPR in Higher Illuminance
In higher illuminance (200, 600, and 1200 photopic lux), the maximum CA showed a significant effect of light spectrum during the 3-h light exposure (F1,438 = 5.490, p = 0.020; main effect of “LIGHT SPECTRUM”; Fig. 8b), but the PIPR did not (F1,190 = 2.375, p = 0.125; Fig. 8e). Post hoc analysis showed that the maximum CA was smaller (i.e., a smaller contraction) in all lighting conditions compared with DL (p < 0.001, d = between −0.446 and −0.528) and was smaller in the high-mel compared with low-mel condition (p = 0.020, d = −0.119; Fig. 8b). There was a significant effect of light intensity during the 3-h light exposure for the maximum CA and the PIPR (maximum CA: F2,527 = 17.678, p < 0.001; PIPR: F2,523 = 11.937, p < 0.001; Fig. 8c,f; main effect of “INTENSITY”). Post hoc analysis showed that the maximum CA and the PIPR were smaller (i.e., a smaller contraction and a faster redilation) in all light intensities compared with DL (p < 0.001, d = between −0.333 and −0.825), as well as smaller in 600 and 1200 lx compared with 200 lx (p < 0.002, d = between −0.215 and −0.324). The PIPR was slightly smaller in 1200 lx compared with 600 lx, but the difference did not reach statistical significance (p = 0.097, d = −0.145). There was no significant difference between the 3 time points during the light exposure for the maximum CA or the PIPR (maximum CA: F2,526 = 1.678, p = 0.188; PIPR: F2,524 = 2.807, p = 0.061; main effect of “DURATION”). There was a significant difference between the 2 different light pulses for the maximum CA and the PIPR (maximum CA: F1,574 = 410.735, p < 0.001; PIPR: F1,574 = 387.778, p < 0.001; main effect of “PULSE”). Post hoc analysis showed that the maximum CA and PIPR were smaller (i.e., a smaller contraction and a faster redilation) after pulse 1 than after pulse 2. There were no significant interactions (p > 0.384).
Correlations of Pupillometry (PIPR) versus Subjective (VAS) and Objective Sleepiness (AAT Index)
Significant negative correlations were found between the PIPR and subjective sleepiness such that a larger PIPR was associated with lower subjective sleepiness (in low illuminance: p = 0.043, r = −0.416, Fig. 9a; in higher illuminance: p = 0.041, r = −0.419, Fig. 9b). These correlations were found for the PIPR after the first (less bright) light pulse and only in the high-mel light condition. There was no significant association between lower objective sleepiness and a larger PIPR after the second (brighter) light pulse (in low illuminance: F3, p = 0.074, r = 0.379, Fig. 9c; in higher illuminance: F3, p = 0.079, r = 0.366, Fig. 9d; Spearman’s rho; n = 24).
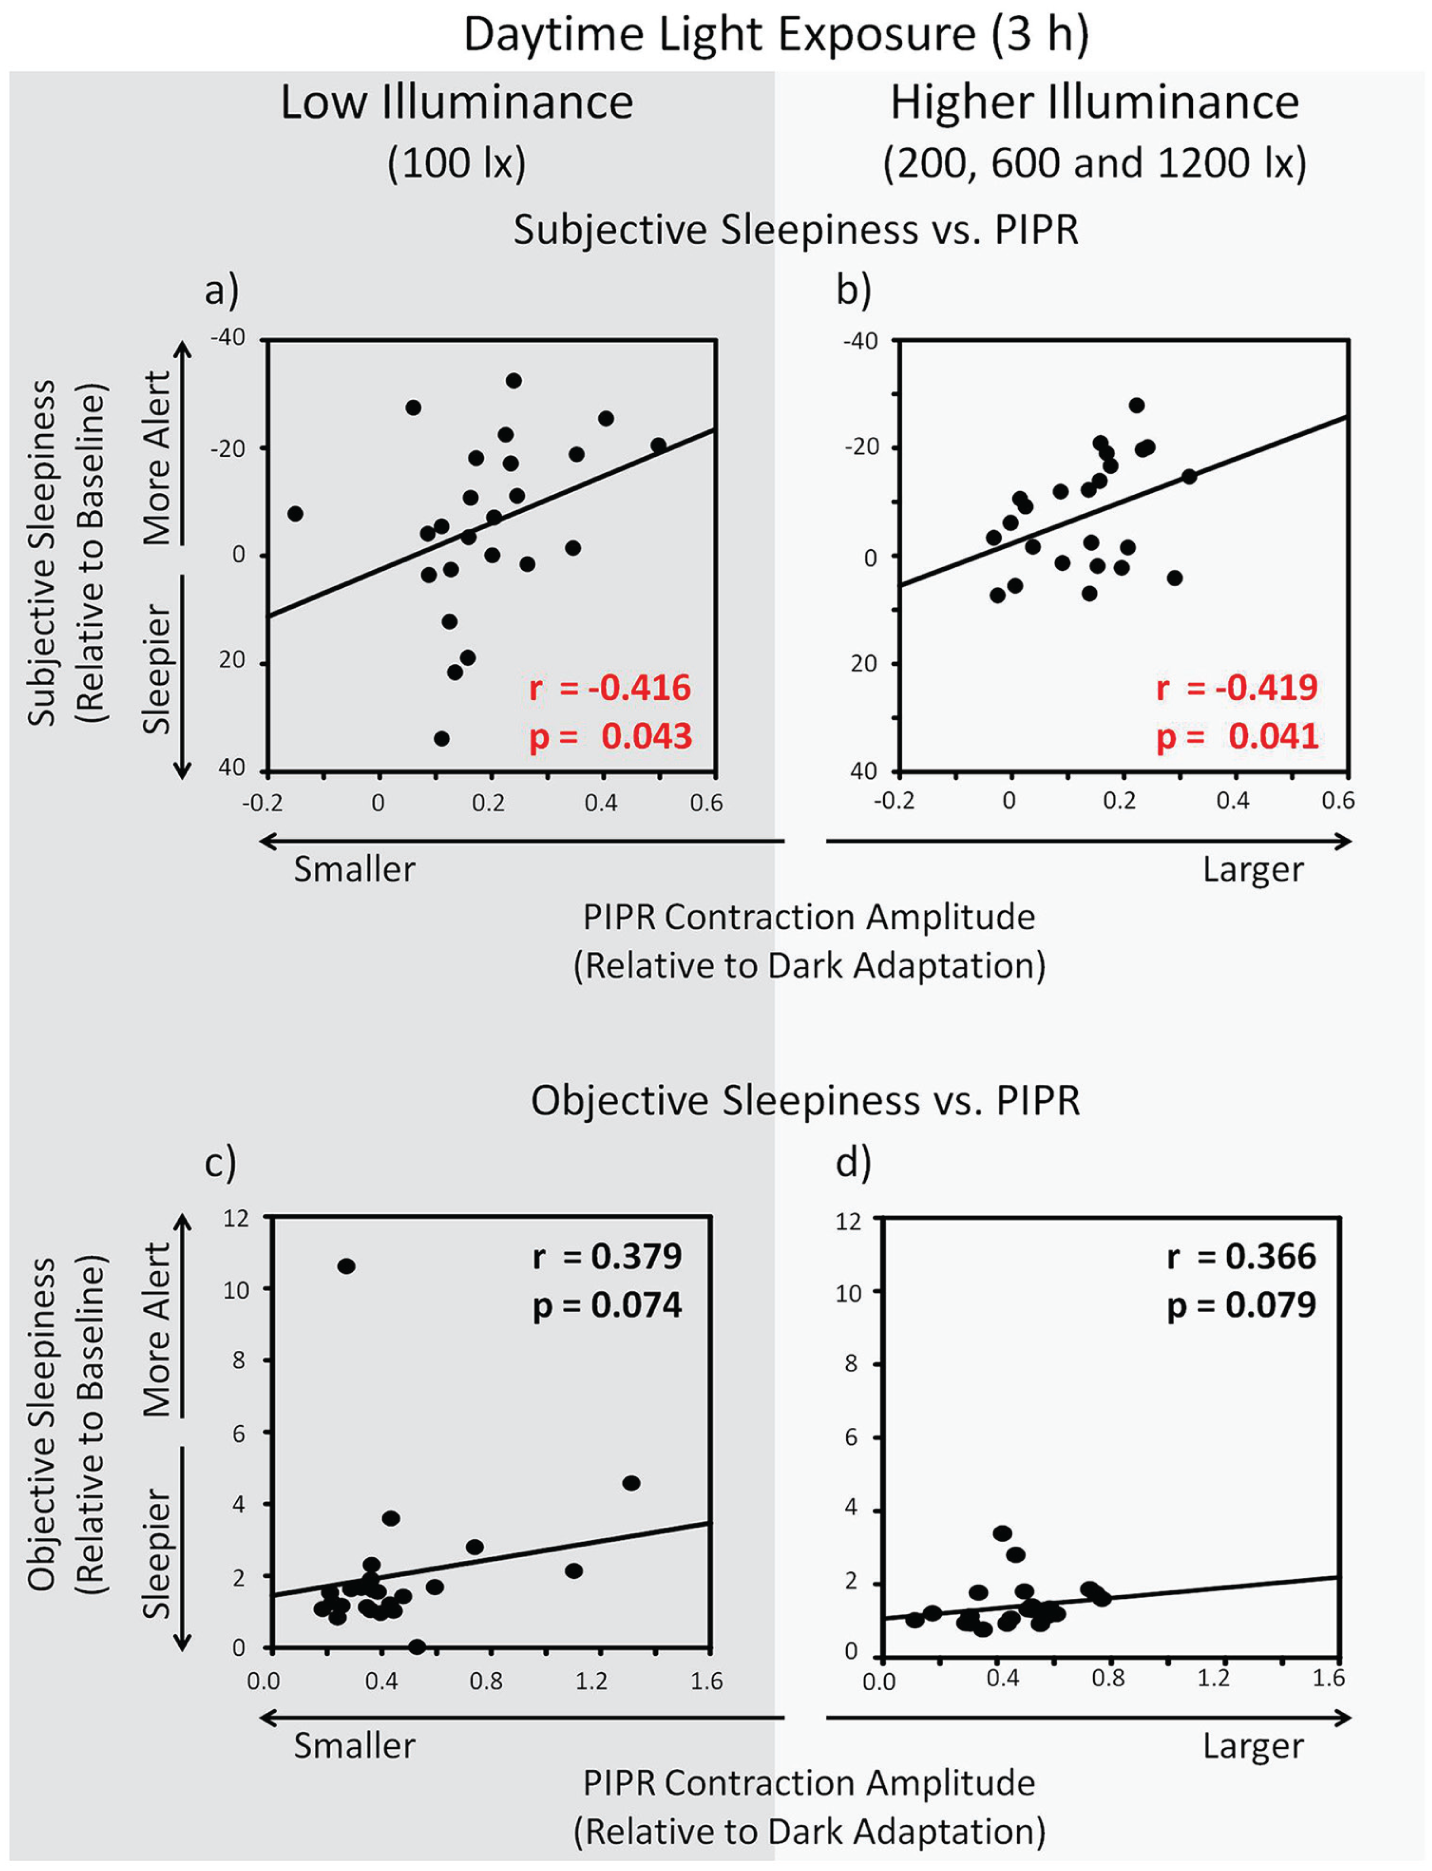
Correlations pupillometry (postillumination pupil response; PIPR) versus subjective (visual analogue scale) and objective sleepiness (Alpha Attenuation Test index). Results for low illuminance in the high-mel light condition; n = 24 (a, c): A larger PIPR correlated (a) significantly with reduced subjective sleepiness but (c) not significantly with objective sleepiness. Results for higher illuminance in the high-mel light condition; n = 24 (b, d): A larger PIPR correlated (b) significantly with reduced subjective sleepiness but (d) not significantly with objective sleepiness. See downright and upright corners of the panels for r and p values (Spearman’s rho). Depicted is objective sleepiness in the frontal derivation, but similar trends were also found in central and parietal derivations.
Dose-response Curves
For subjective and objective sleepiness versus melanopic irradiance, there was no significant dose-response relationship (data did not converge; subjective sleepiness p = 0.915; objective sleepiness p = 0.483).
The pupil recordings of the 48 participants in the higher illuminance group were used to create a dose-response curve for the maximum CA and the PIPR (on z-transformed data; Fig. 10a-d). For this analysis, the light conditions were expressed both as melanopic lux by using the tool box from Lucas et al. (2014) as well as melanopic irradiance by using the new CIE standard (CIE, 2018). The maximum CA and the PIPR were averaged over all participants and over all 3 time points per melanopic lux condition (since there were no significant effects of duration), and a sigmoidal curve was fitted to the data on log10-transformed melanopic lux values as well as on log10-transformed melanopic irradiance (using SigmaPlot version 11.0, Systat Software Inc., San Jose, CA):
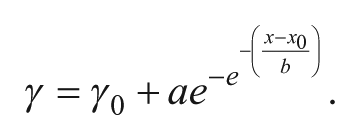
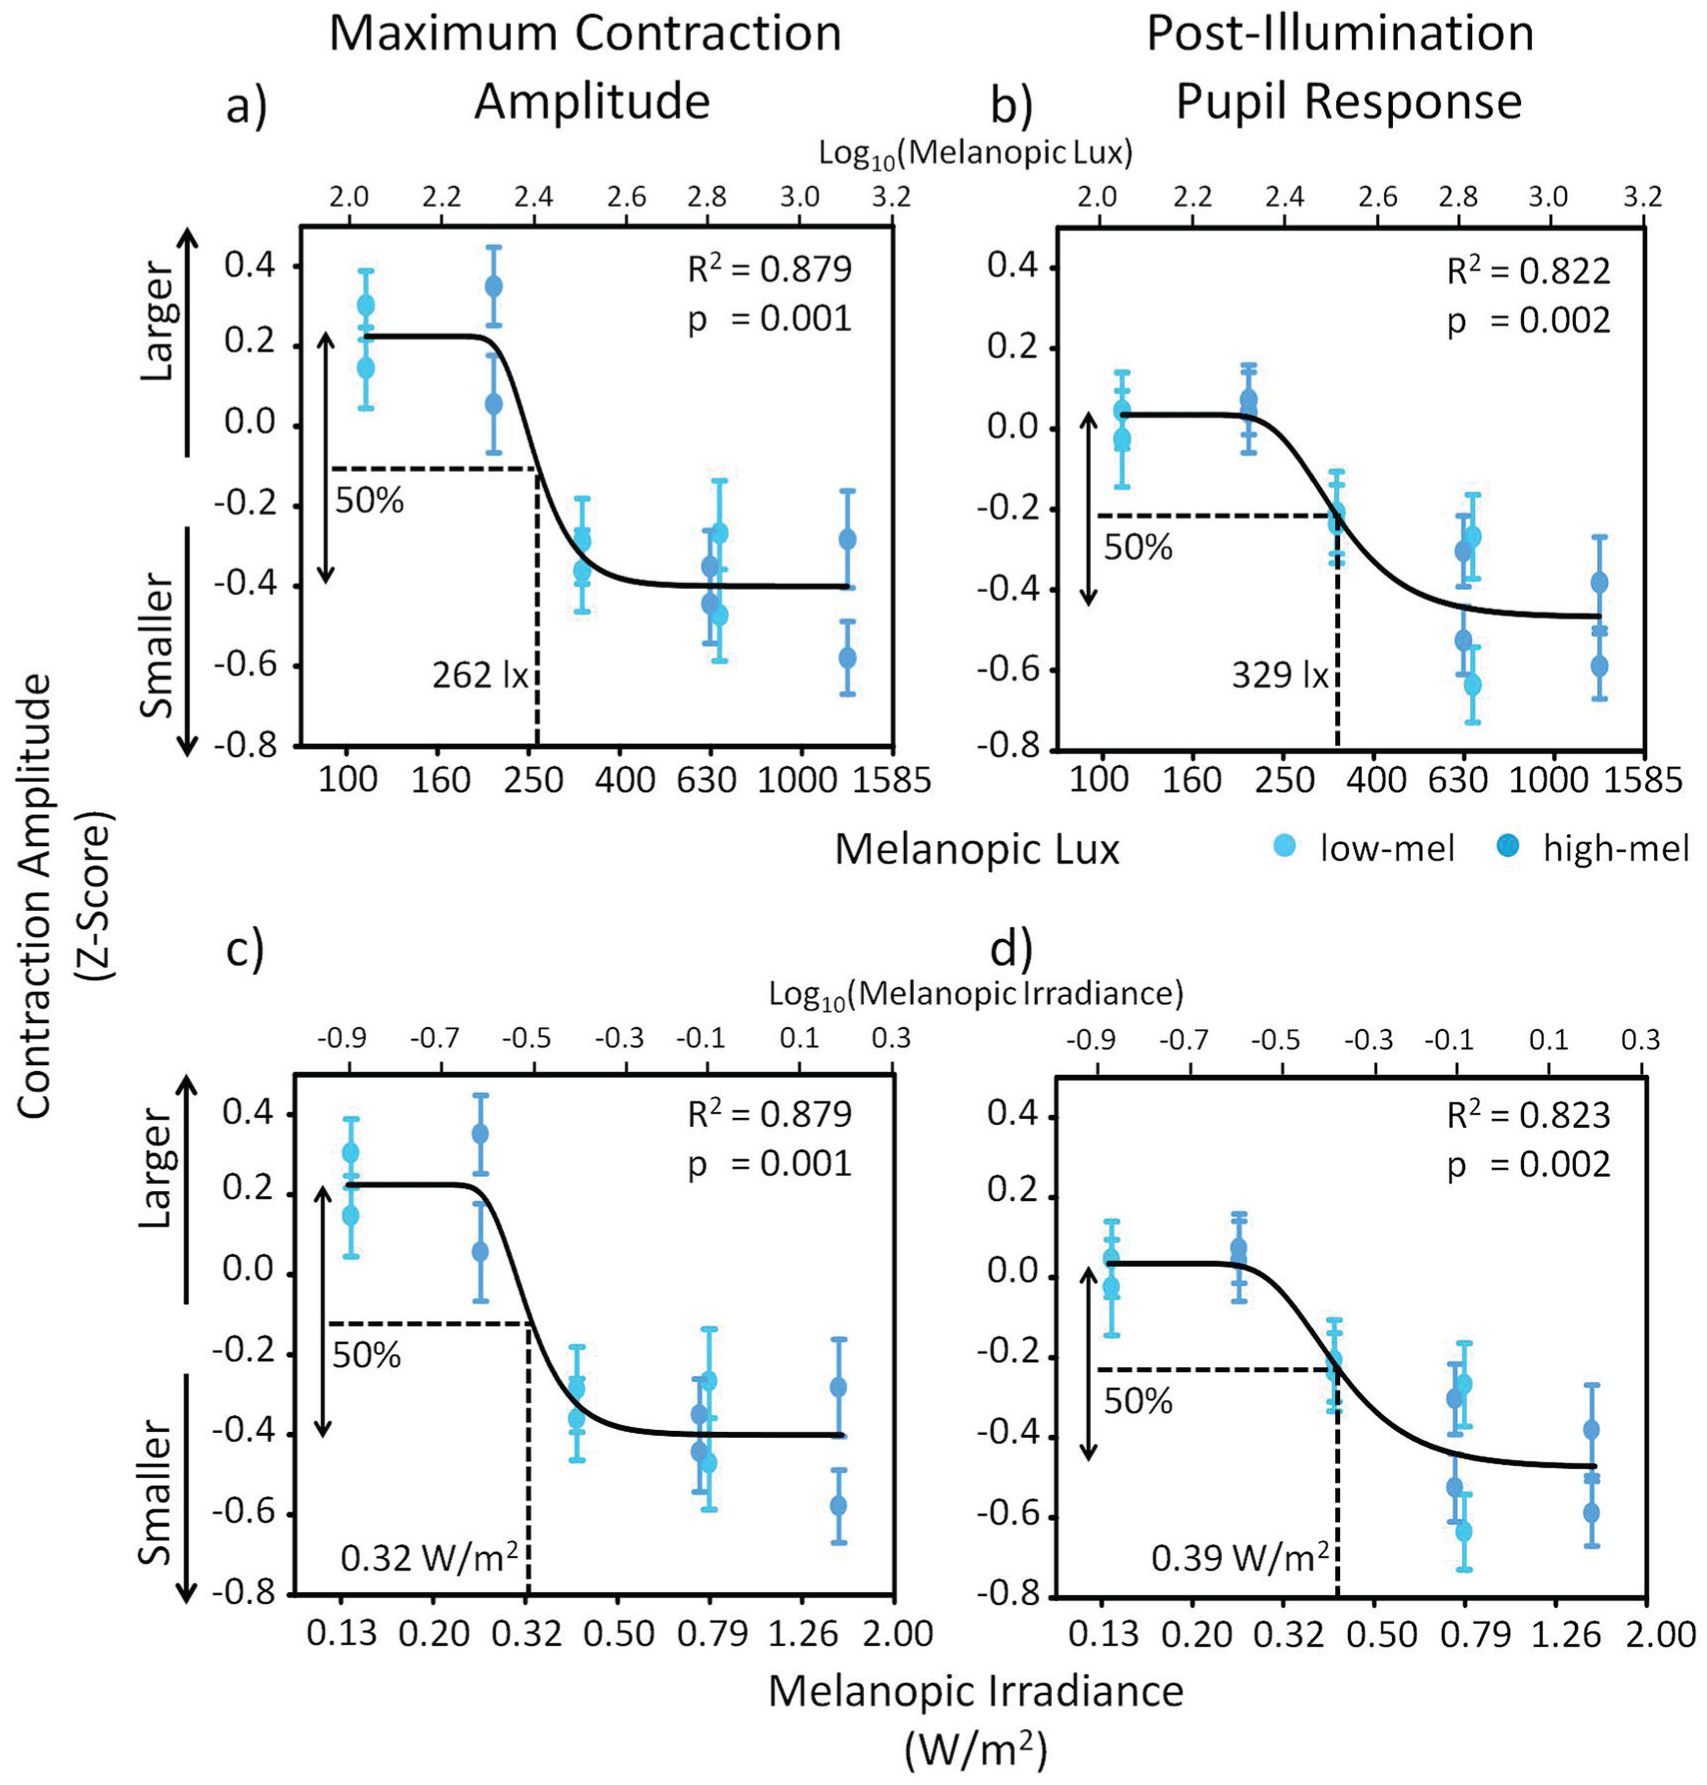
Dose-response Curve for pupillometry versus melanopic lux and irradiance. Dose-response curve in the higher illuminance group (n = 48) for melanopic lux versus (a) the maximum contraction amplitude (CA; z-scores) and (b) the postillumination pupil response (PIPR; z-scores) and for melanopic irradiance versus (c) the maximum CA and (d) the PIPR. The lower x-axis shows absolute melanopic lux or melanopic irradiance, whereas the upper x-axis shows the same values as log10-transformed values. Curve fitting was done with the log10-transformed values. Dotted lines indicate the light intensity or irradiance that induced 50% of the effect (E50; the arrows indicate 100% of the effect). All dose-response curves reached significance (see upright corner of each panel for exact R2 and p values). The pair of data points at each melanopic lux value represent the pupil response to the 2 different light pulses. The 2 spectral lighting conditions are represented by circles (low-mel) and squares (high-mel). See Figure 3 and the text for a description of the light conditions. Means ± SEM.
The dose-response curves using melanopic lux (Fig. 10a,b) had almost identical R2 and p values as the dose-response curves using melanopic irradiance (Fig. 10c,d). For the maximum CA versus melanopic lux, there was a statistically significant fit (p = 0.001; Fig. 10a) with an R2 of 0.879, and the amount of light needed to induce 50% of the maximal effect (E50) was 262 melanopic lux (melanopic irradiance: 0.32 W/m2). For the PIPR versus melanopic lux, there was also a statistically significant fit (p = 0.002; Fig. 10b) with an R2 of 0.822. The amount of light needed to induce 50% of the maximal effect (E50) was 329 melanopic lux (melanopic irradiance: 0.39 W/m2). Dose-response curves for all other α-opic intensities and α-opic irradiances can be found in the supplemental material (Suppl. Figs. S1 and S2). The maximum CA showed significant fits for all α-opics with similar R2 values as for melanopic lux or melanopic irradiance, but the PIPR showed smaller R2 values as compared with melanopic lux or melanopic irradiance.
Discussion
We used 2 physiological measures (the wake EEG and the PLR) to evaluate biological differences to different daytime lighting conditions in 72 young participants. We found that daytime light exposure in well-rested individuals significantly decreased objective sleepiness (in the wake EEG), while showing only a significant reduction in subjective sleepiness shortly after light onset. The metameric lighting condition with a peak wavelength closer to the maximum sensitivity of melanopsin induced the largest alerting response. This reduction of objective sleepiness depending on the light spectra was seen most clearly in low illuminance lighting. The PLRs (both the maximum CA and PIPR) were also sensitive to melanopic irradiance differences of ambient light exposure during the daytime, depending on both the spectrum and light intensity.
To our knowledge, the current study is the first to investigate metameric lighting conditions of different spectral compositions and different intensities together in one study design while also including multiple alertness measures. For subjective alertness, the acute effects of different metameric lighting conditions were limited to the first 20 min of light exposure. Even though we had a relatively large sample size (N = 72), we found medium effect sizes for comparisons of subjective sleepiness, which may indicate large interindividual variability of subjective sleepiness perception. The results of some previous studies are ambiguous. Some found a reduction of subjective sleepiness with daytime light exposures (Kaida et al., 2006; Phipps-Nelson et al., 2003; Revell et al., 2006; Smolders et al., 2012; Vandewalle et al., 2006; Viola et al., 2008), while others did not (Borragán et al., 2017; Daurat et al., 1993; Lafrance et al., 1998; Lok et al., 2018; Rahman et al., 2014; Sahin et al., 2014; Segal et al., 2016). Two recent studies aimed to find dose-dependent relationships between polychromatic light intensity and subjective sleepiness during the daytime but found either no such relationship (as we did in our study) or only a very weak association (Lok et al., 2018; Smolders et al., 2018).
Most studies on light and daytime sleepiness included subjective sleepiness as a marker of nonvisual light effects, and only a few studies also included objective physiological measures of sleepiness. Vandewalle and colleagues (2006) showed in a functional magnetic resonance imaging study that daytime bright-light exposure can enhance responses in the posterior thalamus, which are correlated with improved subjective alertness. There are other studies in which heart rate, cortisol levels, slow eye movements, or blinking were used as proxies for objective measures of alertness (Huiberts et al., 2017; Leproult et al., 2001; Lok et al., 2018; Ruger et al., 2006; Smolders et al., 2018; Smolders et al., 2012; Te Kulve et al., 2018; Te Kulve et al., 2017). We investigated the effect of light on objective sleepiness in the wake EEG. The number of studies with comparable wake EEG data during the daytime is even smaller (Badia et al., 1991; Daurat et al., 1993; Kaida et al., 2006; Prayag et al., 2019; Rahman et al., 2014; Sahin et al., 2014) than the number of studies for subjective sleepiness. This may be because the assessment and analysis of wake EEG data are demanding as well as labor and cost intensive. Most of these studies (Daurat et al., 1993; Kaida et al., 2006; Prayag et al., 2019; Rahman et al., 2014; Sahin et al., 2014), but not all (Badia et al., 1991), showed greater alerting effects in the wake EEG with monochromatic or polychromatic lighting conditions of higher color temperature during the daytime. These alerting effects were mainly found for the EEG alpha activity.
We also found the most clear differences between metameric lighting conditions in the EEG alpha frequency range. In all 4 derivations (frontal, central, parietal, and occipital), we found significant reductions in EEG alpha activity (with open eyes) and an increased AAT index (i.e., higher objective alertness) in the low illuminance conditions. These effects were sensitive to the different metameric lighting conditions, which differed in the peak wavelength of light, especially in the low illuminance conditions. The reduction of EEG alpha activity was stronger with metamers where the peak wavelength was closer to 480 nm compared with a visually similar polychromatic white-light condition with a peak wavelength at 435 nm. In the higher illuminance group, the light conditions also reduced EEG alpha activity compared with the DL condition, but there were no differences in EEG alpha activity or the AAT index between light conditions that differed in peak wavelength. No dose-response relationship was found between subjective or objective sleepiness and melanopic irradiance.
Although our lighting conditions were designed to have metameric properties (visually indistinguishable, with similar color temperature and luminance), they were not full metamers because the amount of cone excitation slightly differed. Full metameric lighting conditions for the human eye are difficult to produce, although a recent study came close (Allen et al., 2018). One bias of our study could be that by increasing shorter wavelengths of light, we also increased the portion of longer-wavelength light, even though we aimed to keep it the same between the light conditions of different metamers. We demonstrated this by calculating the contrasts between the different lighting conditions for each of the photoreceptors (see Suppl. Table S2). This might be a limitation of our study since there is some evidence that light of longer wavelengths can have an alerting effect (Sahin and Figueiro, 2013; Sahin et al., 2014). Therefore, the alerting effects of light that we saw, especially at higher intensities compared with lower intensities, might also be partially conveyed by light of longer wavelengths. Since there is a large overlap between the sensitivity curves of rod and melanopsin photoreceptors, our results might be influenced by different rod contributions. However, when we calculated the scotopic retinal illuminances of our lighting conditions (Suppl. Table S3), all were within or above the rod saturation threshold (as shown by Adelson, 1982; Aguilar and Stiles, 1954). Thus, we can assume that our results were mainly driven by mixed cone and melanopsin effects.
In the current study, we investigated the impact of light on sleepiness during the late morning until the early afternoon. This time window is of particular interest since previous work has indicated that light exposure at this time may have a stabilizing effect on the internal rhythm and could make it less prone to adverse light exposure in the evening (Münch et al., 2017). We included a range of light intensities including brighter light levels, similar to the bright light that most studies used to investigate daytime alerting effects. We were also interested in testing the low light intensity levels (100 photopic lux) because previous work in a naturalistic setting had shown that people in urban environments are exposed to remarkably low illuminance levels during the day (Savides et al., 1986). Many people spend most of their time indoors, where they are exposed to light levels that are often a hundred times lower than the natural light exposure outside in which humans have evolved. In fact, we (Nowozin et al., 2018) and others have shown that in modern society, people often spend between 60% and 90% of their time in light levels below 100 lx (Espiritu et al., 1994; Savides et al., 1986; Scheuermaier et al., 2010), so that they are practically living in biological darkness. This is also about the illuminance level that reaches the eye when general recommendation for offices are adopted, which often suggest about 300 lx measured at a horizontal plane surface (DIN EN 12464-1). Our results indicate that increasing light intensity to bright-light levels may not necessarily have the largest impact on alertness but that especially under low light levels, many people could benefit from changes in the spectral characteristics of light (i.e., spectral tuning). This may also be of interest for the current discussion on abolishing daylight saving time in the European Union. If daylight saving time would no longer be used and the summertime would be applied all year round, then sunrise would occur later during the winter (around 0900 h in Berlin at the end of December). This would mean that many people go to work or school without daylight, spend their day in low indoor light levels, and then go back home again without daylight.
We also found some differences between metameric lighting conditions under higher illuminance. Apart from EEG alpha activity, there were also significant differences between different metameric light conditions for the EEG sigma and beta ranges. Lighting with a peak wavelength closer to 480 nm reduced the EEG sigma and beta activity in the parietal derivations under low and higher illuminance (also in the central derivation in higher illuminance). In the frontal derivations, the 2 highest illuminance conditions (600 and 1200 photopic lux) significantly reduced EEG beta activity compared with DL and the 200 lx condition. Since we already had differences for some subjective and objective sleepiness measures at baseline, we may have had smaller effects of metameric lighting conditions if the baseline values were the same. Nevertheless, the results clearly demonstrate daytime effects of different lighting conditions on EEG brain activity.
We found significant differences in the PLR between different metameric lighting conditions and light intensities. When the light intensity was expressed in melanopic lux, the maximum CA and the PIPR showed a dose-response relationship, with the smallest physiological responses at the highest melanopic lux conditions. This was in fact the opposite of what we had expected. We had hypothesized that the pupil would respond more strongly and would be slower to redilate in lighting conditions with a peak wavelength closer to 480 nm or to light of higher intensities. But although this may be the case in dark adapted pupils (Park et al., 2011), our pupil recordings were performed during 3 h of light exposure (i.e., under light-adapted conditions). It has been shown that in short-wavelength light-adapted pupils, the constriction after a short-wavelength light pulse was smaller (Park et al., 2011). Therefore, our results could be explained by the fact that the pupil behaves differently when light adapted than when dark adapted. Indeed, another study showed that in the dark-adapted pupil, light of a higher irradiance increased the maximum CA and PIPR, while in the light-adapted pupil, a higher irradiance reduced the maximum CA and PIPR (Joyce et al., 2016). This is in accordance with previous studies in which it was shown that there is a strong S-cone input to the PLR, which opposes the sustained redilation response in humans (Cao et al., 2015; Spitschan et al., 2014). Based on those previous results, we show that during the daytime, melanopic lux in different light conditions determines the PLR. We are aware that there is a large interindividual variability in the magnitude of pupil responses. Therefore, we expressed all pupil sizes not only to the 0.25 s in preceding darkness but also relative to the dark-adapted pupil response, which enhanced the contrast between lighting conditions across participants. This might be a way the PLR could be used as a marker for biological effects of ambient light exposure. Our protocol did have the limitation that participants were in darkness for 3 s before each light pulse so that the pupil response was not exactly measured against the metameric background but rather some seconds after preexposure to metameric light conditions. The differences in pupil size during the 3 s in darkness after preexposure to the respective lighting condition could have affected the evoked pupil response to the light pulse. Supplemental Figure S3 shows the absolute pupil sizes (in mm) at the start of the 3 s in darkness. Even though one could argue that our findings are the result of differences in absolute pupil size after the preexposure to different lighting conditions, we are confident that the PLR (both maximum CA and PIPR) reflect “full” responses after differential melanopic activation. Because if we would assume that our results were solely driven by the absolute pupil size after preexposure to different lighting conditions, then we would not have been able to find differences in the relative pupil sizes (i.e., the relative changes to baseline pupil size, in darkness). Analyzing these relative changes minimized the influence of preexisting pupil sizes and the impact of dark-adapted responses. Another limitation of our study is that with the current pupil measurement protocol, we are not able to completely isolate the different photoreceptor contributions to the physiological pupil responses, as was recently shown by others (McAdams et al., 2018; Rukmini et al., 2019). However, a methodological comparison revealed comparable results for the PIPR and this different method, called silent substitution (Estevez and Spekreijse, 1982; Spitschan and Woelders, 2018; Tsujimura et al., 2010).
We also found correlations between the PLR and subjective sleepiness. However, these correlations were rather small and became significant only in the light exposure condition with a peak wavelength at 480 nm, which may again indicate a common melanopsin-dependent pathway between these 2 nonvisual functions.
In conclusion, this study shows that the PLR can be used as a marker of daytime ambient light exposure and that it depends on melanopic lux/melanopic irradiance in a dose-responsive manner. We show that increasing light exposure to bright-light levels of more than 1000 lux may not necessarily reduce sleepiness during the daytime. The clearest effect of light intensity on objective sleepiness was found in a reduction of EEG beta activity in frontal derivations. In the low illuminance conditions, objective sleepiness could be reduced by changing the peak wavelength of light (both still in the shorter-wavelength range of the visible light spectrum), with the largest alerting effect when the peak wavelength of light was close to the peak sensitivity of melanopsin (i.e., 480 nm). Our results show that the PLR may be used as a relatively noninvasive physiological marker, which is sensitive enough to distinguish between metameric polychromatic white-lighting conditions. Combined, these findings may have implications for the general public by providing recommendations on how to improve lighting in offices, schools, hospitals, or homes.
Supplemental Material
de_Zeeuw_et_al_Supplement_clean_080519 – Supplemental material for Living in Biological Darkness: Objective Sleepiness and the Pupillary Light Responses Are Affected by Different Metameric Lighting Conditions during Daytime
Supplemental material, de_Zeeuw_et_al_Supplement_clean_080519 for Living in Biological Darkness: Objective Sleepiness and the Pupillary Light Responses Are Affected by Different Metameric Lighting Conditions during Daytime by Jan de Zeeuw, Alexandra Papakonstantinou, Claudia Nowozin, Sophia Stotz, Mandy Zaleska, Sven Hädel, Frederik Bes, Mirjam Münch and Dieter Kunz in Journal of Biological Rhythms
Footnotes
Acknowledgements
We would like to thank Drs. Katharina Grohme and Carolin Schäfer for the medical screening of the participants. We thank Theresa Fox for her help in performing the study. We thank Laura Binte and Lisa Guggemos for their help with study procedures. We thank Dr. M. Spitschan for his advice on the assessment of photoreceptor contrast and scotopic retinal illuminance. This study was funded by the German Federal Ministry of Education and Research (OLIVE-Project; FKZ: 13N13162) and Intellux GmbH, Berlin, Germany.
Author Contributions
The experiment was performed at the Clinic for Sleep & Chronomedicine in the St. Hedwig-Hospital, Berlin, Germany. J.Z., S.H., F.B., M.M., and D.K. designed the experiment; J.Z., A.P., C.N., S.S., M.Z., and M.M. performed the study; J.Z, A.P., M.Z., and M.M. analyzed the data; J.Z. prepared the figures; J.Z. drafted the article; all authors edited and reviewed the article, and all authors approved the final version.
Conflict of Interest Statement
The authors have no potential conflicts of interest with respect to the research, authorship, and/or publication of this article.
Notes
References
Supplementary Material
Please find the following supplemental material available below.
For Open Access articles published under a Creative Commons License, all supplemental material carries the same license as the article it is associated with.
For non-Open Access articles published, all supplemental material carries a non-exclusive license, and permission requests for re-use of supplemental material or any part of supplemental material shall be sent directly to the copyright owner as specified in the copyright notice associated with the article.