
Abstract
Broad-spectrum light applied during the night has been shown to affect alertness in a dose-dependent manner. The goal of this experiment was to investigate whether a similar relationship could be established for light exposure during daytime. Fifty healthy participants were subjected to a paradigm (0730-1730 h) in which they were intermittently exposed to 1.5 h of dim light (<10 lux) and 1 h of experimental light (24-2000 lux). The same intensity of experimental light was used throughout the day, resulting in groups of 10 subjects per intensity. Alertness was assessed with subjective and multiple objective measures. A significant effect of time of day was found in all parameters of alertness (p < 0.05). Significant dose-response relationships between light intensity and alertness during the day could be determined in a few of the parameters of alertness at some times of the day; however, none survived correction for multiple testing. We conclude that artificial light applied during daytime at intensities up to 2000 lux does not elicit significant improvements in alertness in non-sleep-deprived subjects.
Light is known to elicit both image-forming and non-image-forming (NIF) responses. One of these NIF responses is improved alertness, which so far has been established especially during the night (Cajochen, 2007; Cajochen et al., 2011, 2005, 2000; Chellappa et al., 2013; Lavoie et al., 2003; Najjar et al., 2014; Van Der Lely et al., 2015). Humans are diurnal, with optimal psychological and physiological performance during daytime (Cajochen et al., 2003; Dijk et al., 1992; Hull et al., 2003). Alertness is known to affect many functions, such as performance, psychological and physiological well-being, caloric intake, and pain sensitivity (Alexandre et al., 2017; Curcio et al., 2001; Figueiro et al., 2015; Pardi et al., 2016). Thus, displaying optimal alertness is beneficial in many facets of everyday life (Alexandre et al., 2017; Cajochen et al., 2003; Dijk et al., 1992; Figueiro et al., 2015; Hull et al., 2003). It is essential to measure such NIF responses during the day, because it is unclear whether daytime effects of light on alertness are similar to nighttime effects (a full discussion of daytime effects of light on alertness can be found in this issue, see Lok et al., 2018; Cajochen et al., 2003; Dijk et al., 1992; Hull et al., 2003, Souman et al., 2018; Daurat et al., 1993), and because positive effects of daytime light exposure on other NIF responses (such as sleep, health, mood, and mental disorders) have been reported (Dijk et al., 1991; Figueiro et al., 2017; Graw et al., 1999; Wams et al., 2017). The aim of this study was to determine dose-response relationships between several measures of alertness and broad-spectrum light exposure at different times of day. To increase accuracy, alertness was assessed with a multimeasure approach, in which subjective sleepiness (measured with the Karolinska Sleepiness Scale; Åkerstedt and Gillberg, 1990), performance on the Go-NoGo task (Barry et al., 2014), and various physiological correlates of alertness (such as skin temperature [Kräuchi et al., 1999] and blink measurements [Caffier et al., 2003]) were taken into account (Cajochen, 2007; Kaida et al., 2006; Posner and Rafal, 1987; Putilov et al., 2012; Rosekind et al., 1995; Wright et al., 2002; Zhou et al., 2012).
Materials and Methods
Subjects
Participants were 50 healthy, non-sleep-deprived subjects (25 female, 25 male) between the ages of 20 and 30 years (average ± SEM, 23.02 ± 0.29 years). All participants gave written informed consent and received financial compensation for participation. The study protocol, screening questionnaires, and consent forms were approved by the medical ethics committee of the University Medical Center Groningen (NL54128.042) and were in agreement with the Declaration of Helsinki (2013).
The participants’ health was assessed via an in-house developed general health questionnaire. As an indication of sleep timing, chronotype was assessed via the Münich Chronotype Questionnaire (Roenneberg et al., 2003). To determine baseline sleep quality, participants completed the Pittsburgh Sleep Quality Index (PSQI) (Buysse et al., 1989). Participants reported no health problems, were intermediate chronotypes (MSFsc [midpoint of sleep on work-free days, sleep-corrected] between 3.88 and 6.17; average ± SEM, 4.80 ± 0.08), and did not report more than mild sleep problems (PSQI <12; average ± SEM, 4.06 ± 0.31). Exclusion criteria were (1) chronic medical condition or the need for sleep medication, (2) shift work 3 months before participation, (3) having traveled over multiple time zones within 2 months before participation, (4) smoking, (5) moderate to high levels of caffeine intake (>4 cups per day), (6) excessive use of alcohol (>3 consumptions per day), (7) use of recreational drugs in the last year, (8) a body mass index outside the range of 18 to 27 or a body weight of less than 36 kg, or (9) inability to complete the Ishihara color blindness test (Ishihara, 1972) without errors upon arrival. The estimated average ± SEM of caffeine intake per day was 0.85 ± 0.12 cups per day for the included participants.
Protocol
Subjects arrived at the human isolation facility of the University of Groningen the evening before the experimental day and remained in their individual rooms in dim light (DL). Computers were covered with blue light-blocking foil and set to minimal intensity. Both the spectral composition and illuminance of experimental light (EL) were measured at the start of the experiment for every individual and included the amount of light coming from the computer screen. A practice test session was performed in which participants were monitored, to verify sufficient understanding of the tasks. After completion, individuals were equipped with DS1922L Ibuttons (Thermochron, Baulkham Hills, NSW, Australia) for measuring skin temperature on the right and left clavicles, middle fingers, and ankles. Participants were instructed to go to bed at 2330 h and were awakened the next morning at 0730 h under dim light conditions (i.e., <10 lux). During the rest of the day, participants were exposed to 4 consecutive cycles of 1.5 h of DL followed by 1 h of EL (10 h in total; see Fig. 1). Participants were subjected to 1 h of EL because according to the literature, effects of light on alertness can be present after only 30 min of light exposure (Cajochen et al., 2005; Chellappa et al., 2011). DL exposure of 1.5 h was chosen to allow for a return to baseline alertness after each hour of EL exposure. During every cycle, 2 test sessions were performed in DL (18 and 78 min after onset of DL) and 2 test sessions were performed in EL (18 and 48 min after onset of EL).
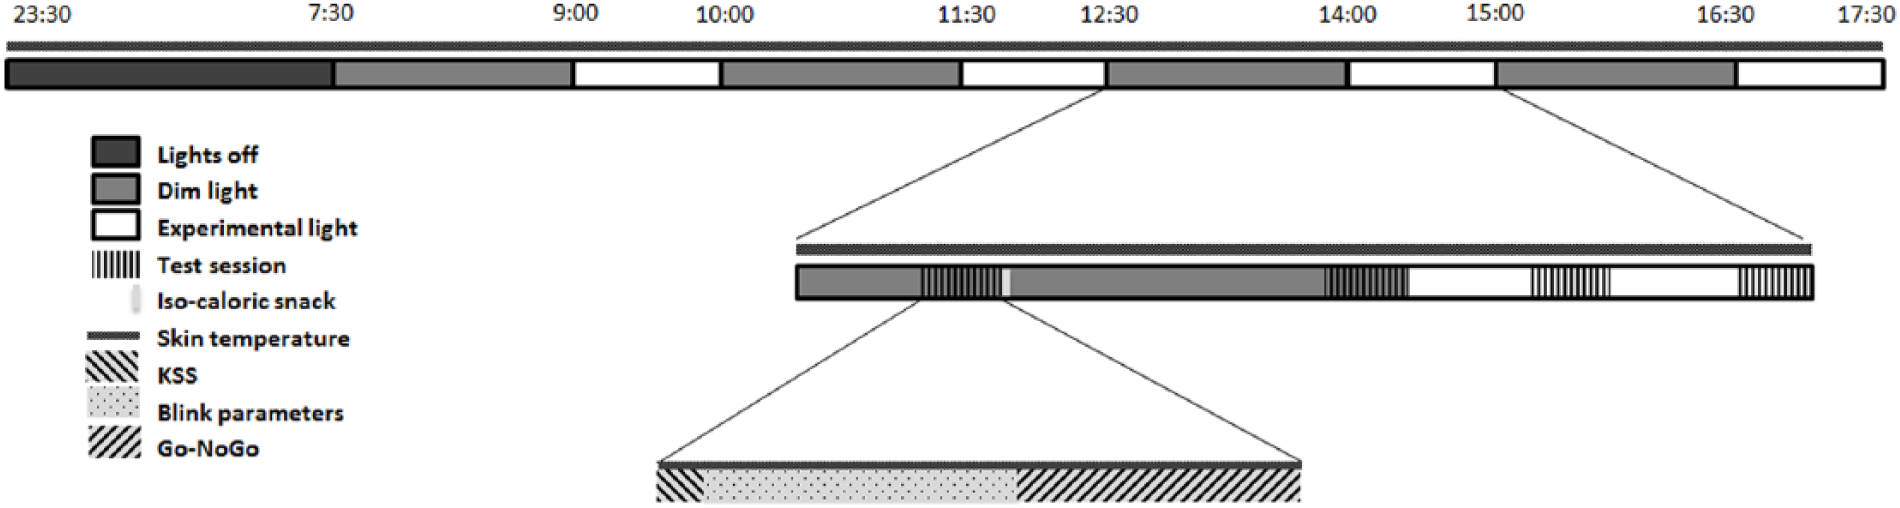
Schematic representation of the experimental design. Dim light exposure lasted for 90 min, experimental light for 60 min. Isocaloric snacks were provided after each first test session in dim light. KSS = Karolinska Sleepiness Scale.
A test session consisted of participants completing the Karolinska Sleepiness Scale (Åkerstedt and Gillberg, 1990), followed by a 6-min eye blink recording. During this task, subjects had to remain seated as still as possible and focus on a fixation mark, while wearing glasses fitted with an infrared emitting diode and photosensitive diode. Differences in infrared reflectance between the eyelid and eyeball were used to determine several blink parameters (Caffier et al., 2003). Thereafter, participants completed a 5-min auditory Go-NoGo task (performed in Visual Studio 2015; Microsoft, Redmond, WA) to assess executive control (Barry et al., 2014). Skin temperature was measured throughout the experiment at a sampling frequency of 60 sec. Isocaloric snacks were provided 30 min after each DL onset. Estimation of basal metabolic rate (BMR) was used to calculate caloric value of the snack as follows:
Light Exposure
Polychromatic white DL (<10 lux) was provided via ceiling-mounted Philips fluorescent tube lights (see Suppl. Fig. S1 and Suppl. Table S1 for spectral composition and illuminance values). EL was delivered by a portable polychromatic white light source, consisting of a modified Philips Energy Up light (HF3419/02; Philips, Drachten, the Netherlands) in which 2 white light-emitting diodes (LEDs) were replaced with blue LEDs. This was necessary to ensure sufficient stimulation of all photoreceptor classes. The EL lamp was placed on the desk in front of the participants at a distance of 20 cm. Intensities were chosen to span the full range of the dose-response curve of alertness-enhancing effects of light, based on nighttime and daytime data (Hommes and Giménez, 2015). Intensities were therefore set to 24, 74, 222, 666, or 2000 photopic lux corresponding to 21, 67, 219, 642, and 1933 melanopic lux (Lucas et al., 2014) (Suppl. Table S1). Each participant was exposed to 1 single intensity setting throughout the 4 EL blocks on the experimental day. Because each subject participated for only 1 day, the experiment followed a within- (time of day) and between- (intensity) subjects design (10 subjects per intensity). The intensities of EL were evenly distributed over gender and day of the week (Monday through Friday). The experiment was conducted between May and September 2016, and local time is expressed as GMT+2 (thus using daylight savings time).
Data Preprocessing: Blink Parameters
Signals from the photosensitive diode of the blink-measuring glasses were stored on a computer at a sampling frequency of 200 Hz. Analyses were based on previously described methods (Caffier et al., 2003). Blink parameters were determined using the native MATLAB R2015b Signal Processing Toolbox function “findpeaks” (The MathWorks, Natick, MA). Blink frequency (defined as the number of peaks per minute), blink duration, closing time, reopening time, and total time that the eyelid was fully closed were assessed. Blinks were characterized by differences in infrared reflectance between the opened and closed eyelid, recognized by a U-shaped infrared reflectance peak over time. Blink duration was determined as follows: A baseline reflectance value was calculated for each blink, consisting of the average reflectance of the completely opened eye during a time window of 500 msec, before the signal amplitude reached 10% of the amplitude of the reflectance peak. Linear regression lines were fitted to both sides of the inverted U-shaped blink form. Blink duration (milliseconds) was then determined as the time difference between the baseline-crossings of both regression lines. The timing of the intersection of both regression lines was considered as the timing of peak reflectance (i.e., full closure of the eyelid). Eyelid closing and reopening time was then determined by calculating the time interval between the timing of peak reflectance and the closing and reopening (i.e., 10% deviations from baseline) of the eyelids. The total time that the eyelid was fully closed was determined as the time during which the signal remained higher than 90% of peak amplitude (Caffier et al., 2003). Eyelid closures not fulfilling the following criteria were excluded: (1) a blink duration of 50 to 500 msec; (2) a closing time less than 150 msec; (3) a reopening time more than 150 msec (Caffier et al., 2003); this was done to exclude nonblink closures (Stern, 1984; Stern et al., 1994). The first and last 30 sec of each 6-min measurement were omitted from analysis, to exclude possible noise from filling in the questionnaire or anticipation of the end of task. Decreased blink frequency, blink duration, eyelid closure time, the total time that the eyelid was closed, and eyelid reopening time have been shown to be related to an increase in alertness (Caffier et al., 2003).
Data Preprocessing: Go-NoGo
Tests were performed on an HP Compaq 8200 Elite Convertible Minitower PC with KB-0316 keyboard. For every individual, errors of omission were defined as response latencies greater than the average of all test sessions plus 2 standard deviations, anticipation errors as response latencies shorter than the average of all test sessions minus 2 standard deviations, and commission errors as responding to nontarget stimuli. Other parameters of interest were median reaction time (RT), average RT, the average of the 10% fastest and 10% slowest RTs, and the average RT in the first and last minute of the 5-min test. A decrease in RT and/or omissions, commissions, or anticipation indicated an increase in alertness.
Data Preprocessing: Skin Temperature
Skin temperature data were collected using iButton temperature loggers (DS1922L; Thermochron) (60-sec sampling interval, 0.0625 °C resolution, 0.5 °C accuracy). Outliers with absolute consecutive temperature change exceeding 2 °C were omitted. Distal skin temperature was calculated as the average temperature of fingers and ankles. Proximal skin temperature was determined as the average temperature of both clavicles. The distal-proximal gradient (DPG) was calculated as the distal minus proximal skin temperature (Kräuchi et al., 1997). For construction of dose-response curves, the distal and proximal skin temperature and DPG were calculated as the average of 18 data points (i.e., 18 min) immediately prior to the start of each test session. Higher proximal and lower distal skin temperature and larger DPG are associated with higher alertness.
Statistics
Mixed linear models were constructed in RStudio (version 1.0.136; R Consortium) for each alertness parameter, with that parameter as the dependent variable. Independent variables were time of day and light intensity. Fixed effects consisted of time of day (as categorical variable), intensity condition, and the interaction term. To control for between-subject variation, subject identity (ID) was included as a random effect. Sigmoidal curves were fitted to the data obtained in each test session separately in order to determine dose-response relationships. To this end, an adapted version of the Naka-Rushton equation (Hut et al., 2008; Rushton, 1966) was used, with Y
Results
Linear model analysis revealed that there were no significant differences in age (F1,48 = 2.37, p = 0.13), MSFsc (F1,48 = 0.07, p = 0.79), PSQI score (F1,48 = 0.11, p = 0.74), and caffeine intake (F1,48 = 0.53, p = 0.47) between the subjects in the different EL intensity groups.
The time courses of subjective sleepiness score, median reaction time, blink duration, and DPG all indicated a pattern over time of day independent of DL or EL light exposure (Fig. 2). Time of day was found to be significant in subjective sleepiness score (χ² = 111.7, p < 10−15, n = 50, df = 15), reaction time (χ2 = 60.5, p < 10−6, n = 50, df = 15), blink duration (χ2 = 32.5, p < 0.006, n = 50, df = 15), and DPG (χ2 = 648.3, p < 10−15, n = 50, df = 15). A significant interaction between time of day and light intensity was found in subjective sleepiness score (χ2 = 90.5, p < 0.007, n = 50, df = 60) and DPG (χ2 = 172.8, p < 10−13, n = 50, df = 15).
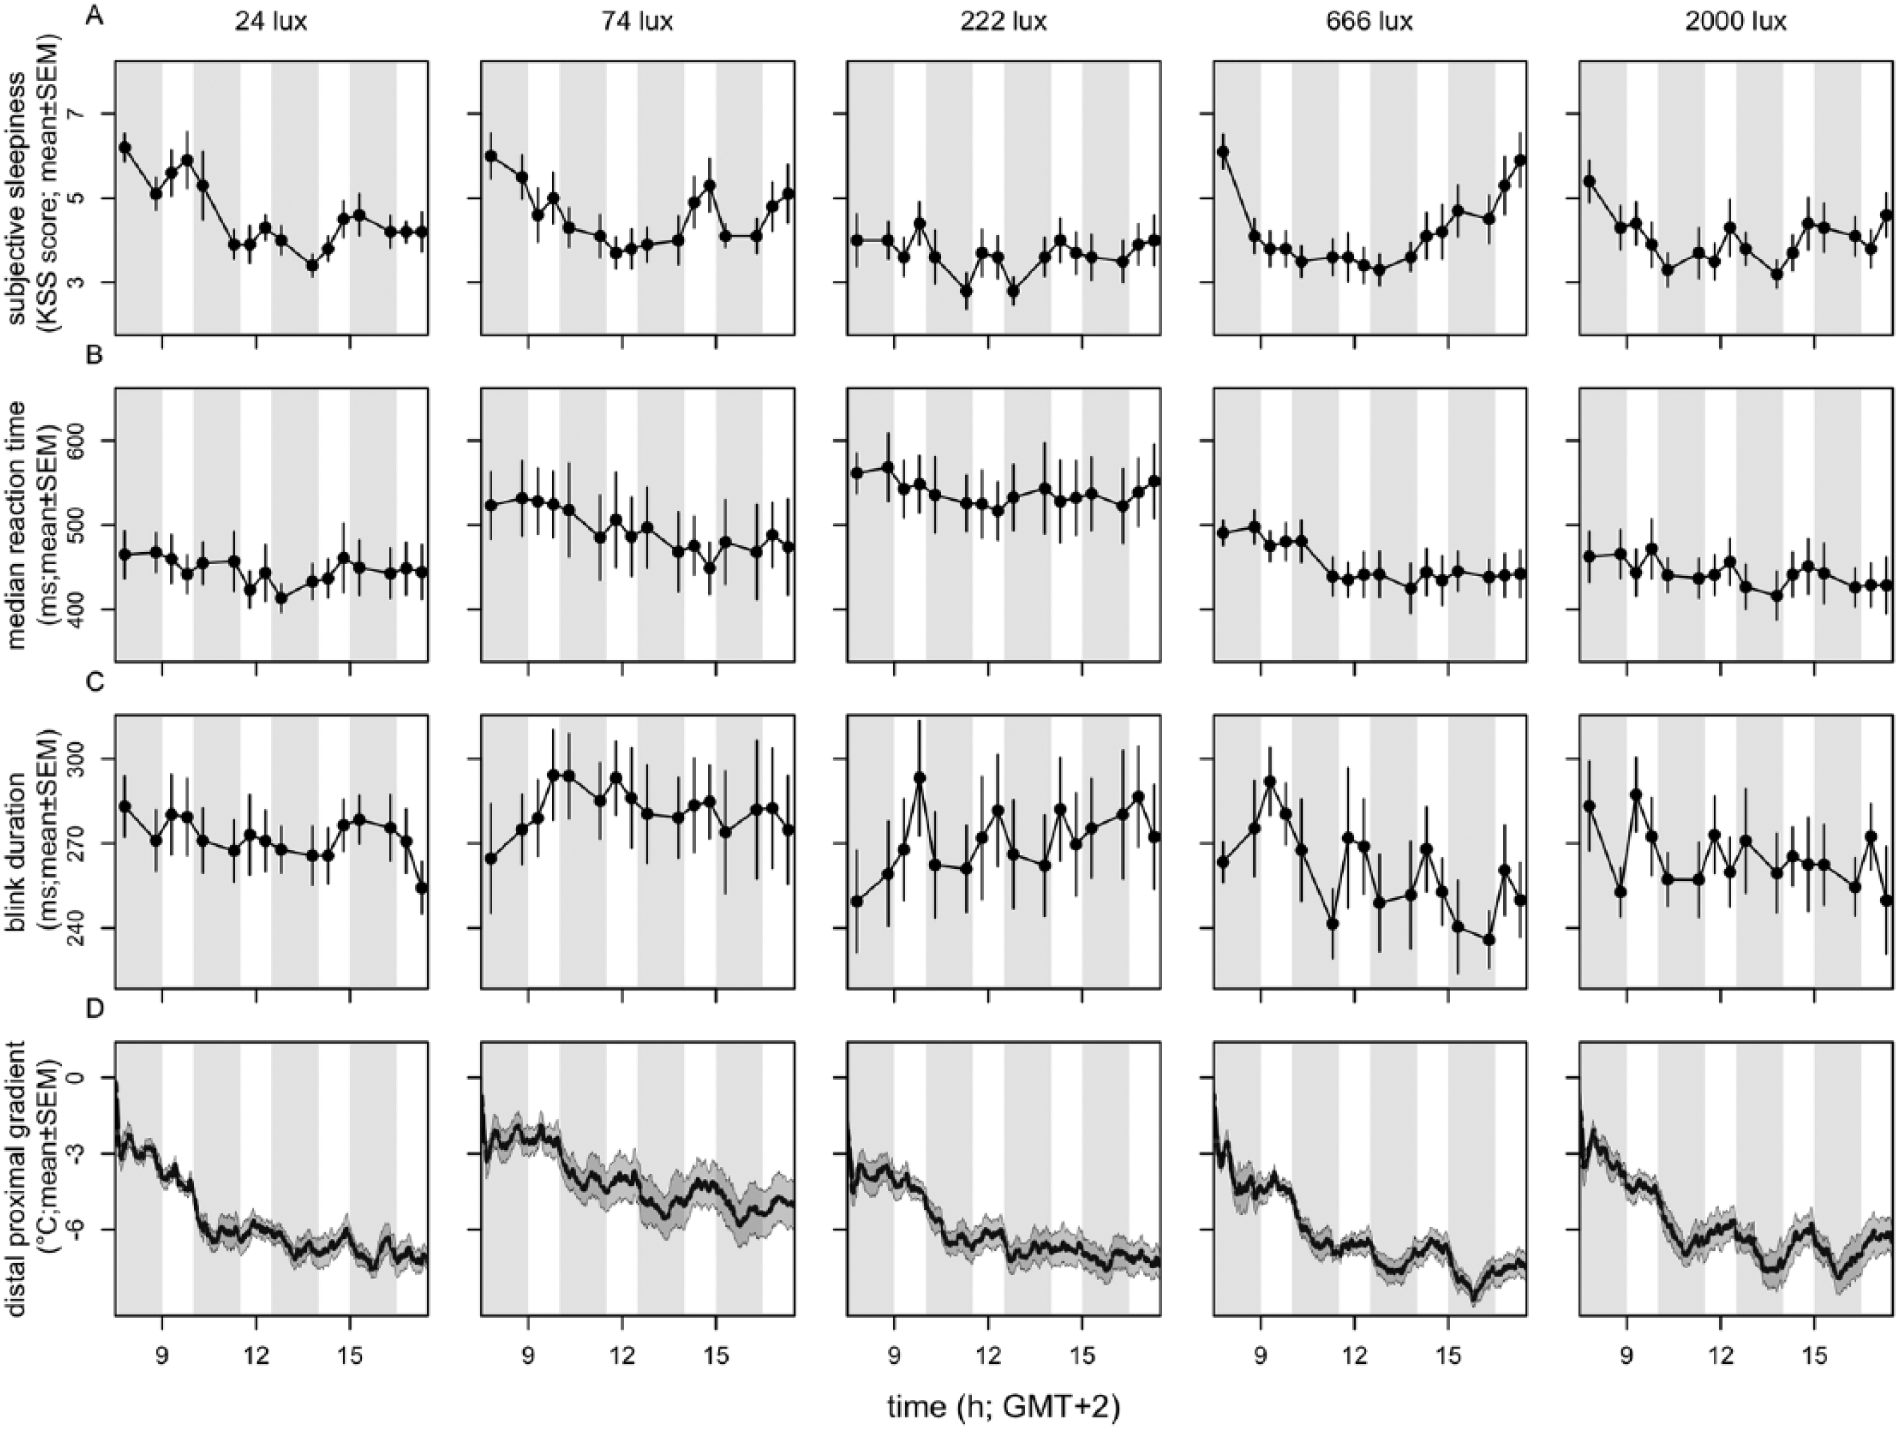
Time course of parameters of alertness. Depicted are (A) subjective alertness, (B) median reaction time, (C) blink duration, and (D) distal-proximal gradient. n = 10 per intensity group. Data represent mean ± SEM. Timing of DL and EL is indicated by the gray- and white-shaded areas, respectively.
Significant effects of time of day were also established for other direct and indirect measurements of alertness. The time course of the 10% fastest and slowest reaction times, average overall reaction time, average reaction time in the first and last minute of the task, blink frequency, eyelid closing and reopening time, total time that the eyelid was closed, and proximal and distal skin temperature are shown in Supplemental Figures S2 through S4. In the Go-NoGo test, too few errors of anticipation, omission, and commission were made to allow for further statistical analyses.
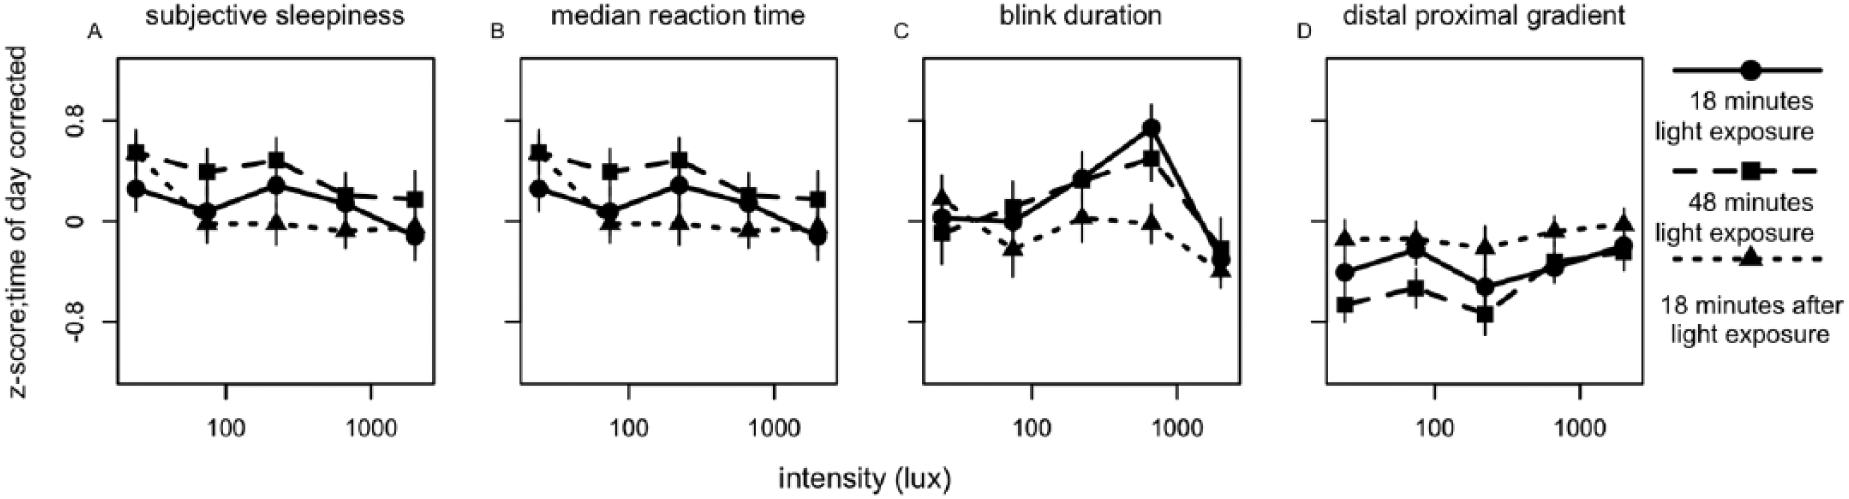
To reveal short-term light-exposure effects independent of long-term trends, time of day patterns were eliminated as follows. For each individual, a linear interpolation was calculated between the last data point in DL before EL was turned on of 1 block and the last point in DL before EL was turned on in the next block (Suppl. Fig. S5). This linear interpolation was interpreted to follow the long-term change in alertness over time, including circadian regulation of alertness. The vertical distance of every data point relative to the linear interpolation was then determined. This procedure served as a correction for time of day for all parameters of alertness. For the last test session, the slope of the interpolation from the previous session was assumed, as no DL data points were available after termination of the last EL episode. Data were normalized by z-transformation at the level of participant ID to eliminate between-subject variation. The various correlates of alertness were plotted against EL intensities (photopic lux). When tested for dose-response relationships between EL intensity and alertness parameters, light intensity was not found to significantly contribute to subjective sleepiness score, reaction time, blink duration, or DPG (Fig. 3, Suppl. Table S2). At 1518 h, a significant dose-response relationship was found between photopic lux and blink frequency (F4,46 = 3.06, p < 0.04) (Fig. 4, Suppl. Table S3), with fewer blinks occurring with increasing light intensity. When we corrected for multiple testing using the Bonferroni correction, none of the fitted curves constructed for 10% fastest and 10% slowest reaction times, overall average reaction time, average reaction time in the first and last minute, eyelid closing and reopening time, total time that the eyelid was closed, or proximal and distal skin temperature revealed a significant contribution of light intensity at any time of day (Suppl. Figs. S6-S8, Suppl. Table S3).
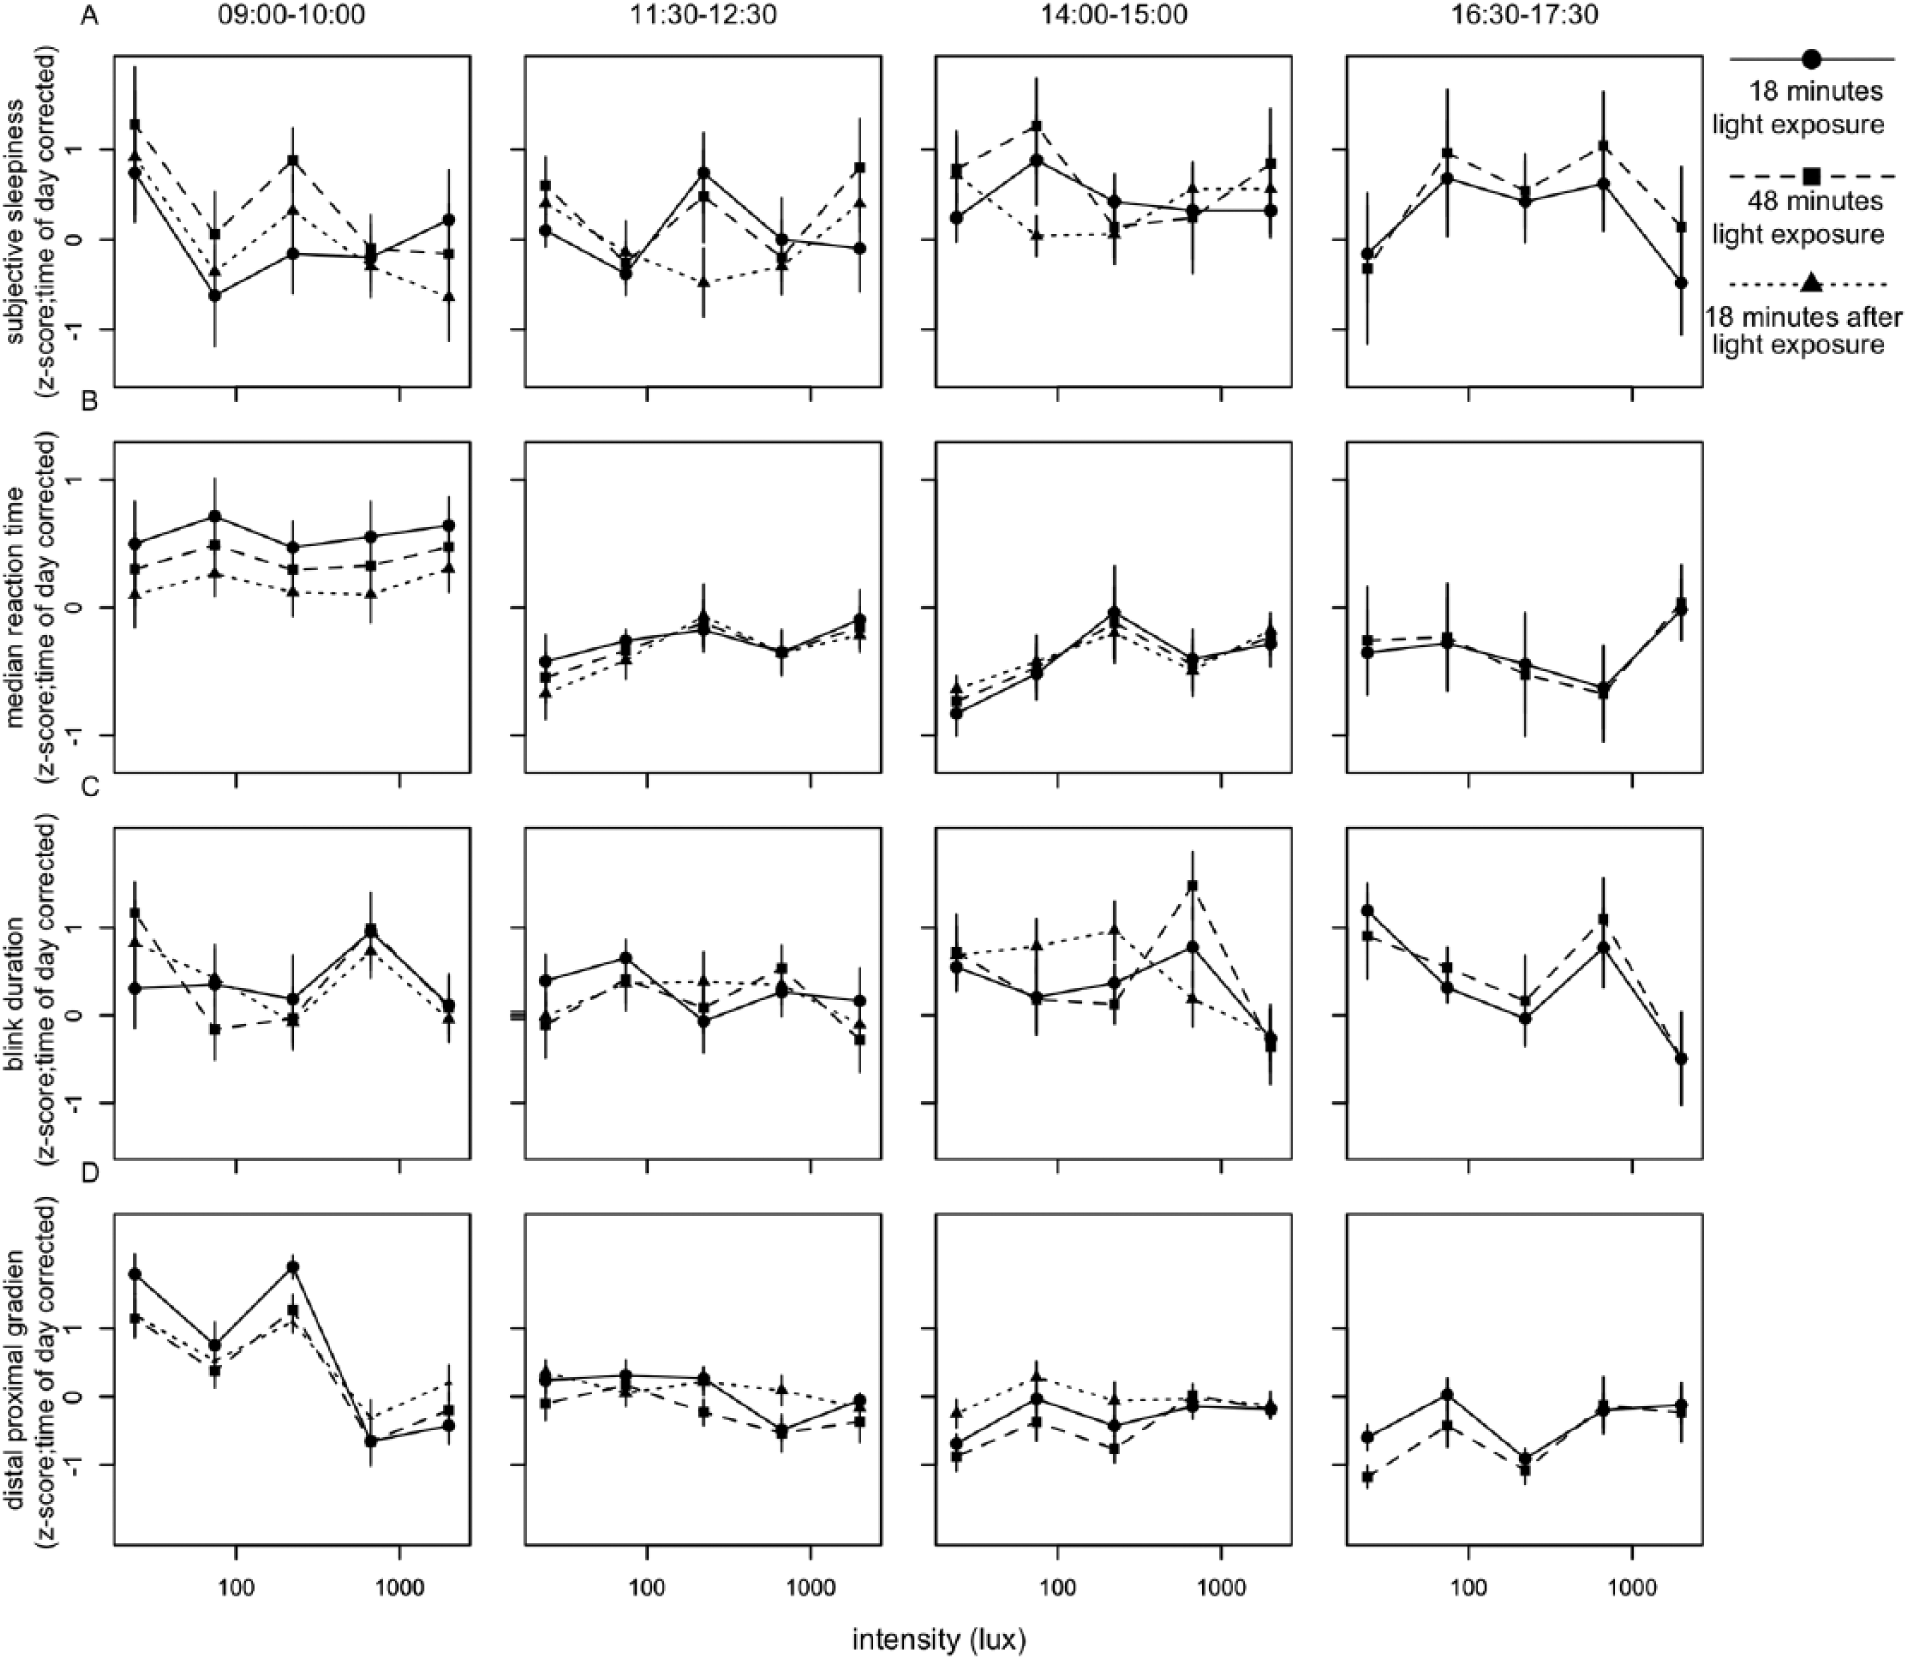
Relationships between illuminance (lux) and parameters of alertness. Presented are (A) subjective alertness, (B) median reaction time, (C) blink duration, and (D) distal proximal gradient. All values were z-transformed and corrected for time of day effects. Data represent mean ± SEM. Circles with solid lines represent data collected after 18 min of EL exposure, squares with dashed lines follow data collected after 48 min of EL exposure, and triangles with dotted lines represent data collected 18 min after EL was turned off. Other correlates of alertness are shown in Suppl. Figs. S5-S7.
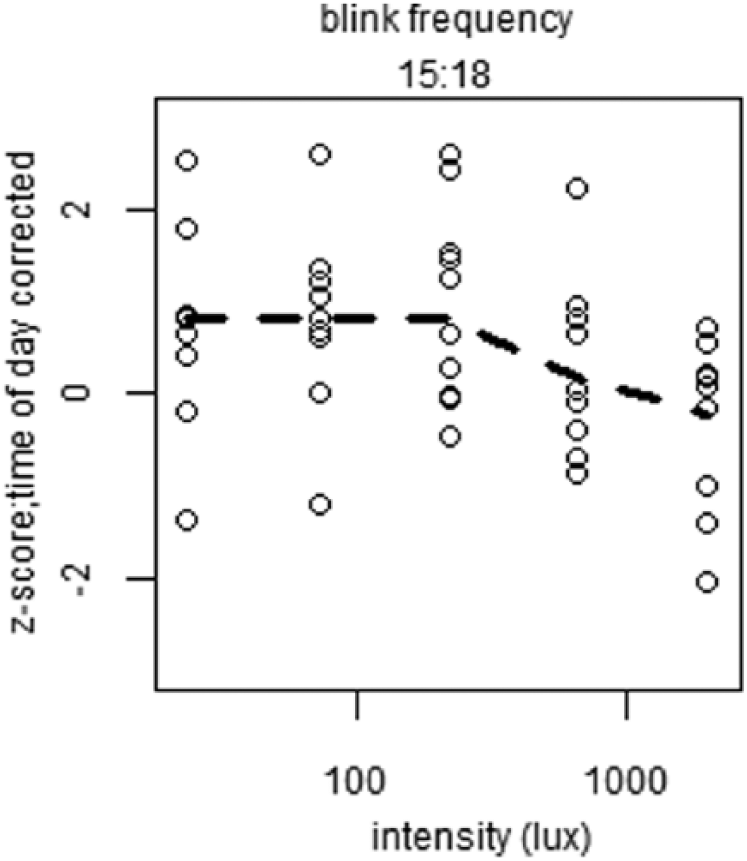
Plots of significant dose-response relationships between illuminance (lux) and parameters of alertness. Depicted is blink frequency at indicated time of day. All values were z-transformed, corrected for time of day effects, and averaged over time of day. Open circles indicate individual data points, and dashed lines represent the calculated fit of the dose-response curve.
Because values were corrected for time of day, 1 composite score per individual could be calculated (irrespective of time of day) by averaging the 4 time points over the day within a subject after 18 min and 48 min of light exposure and 3 time points over the day 18 min after the light was turned off (Fig. 5). A significant dose-response relationship was found between light intensity and sleepiness (F4,45 = 3.10, p = 0.036) 18 min after the light had been turned off, with decreased sleepiness when intensity increased. Saturation seemed to appear at a light intensity of 75 lux (Figs. 5 and 6). Median reaction time, blink duration, and DPG did not show significant dose-dependent changes (Fig. 5, Suppl. Table S4). A significant dose-response relationship was observed after 18 min of light exposure in eyelid closure time (Fig. 6) (F4,45 = 3.25, p = 0.030), reflecting slower closure times as light intensity increased. When correcting for multiple testing with the Bonferroni correction, none of the fits passed the significance threshold (αcorrected = 0.02). None of the fits of other parameters of alertness (10% fastest and 10% slowest reaction times, overall average reaction time, average reaction time in the first minute, blink frequency, eyelid reopening time, total time that the eyelid was closed, proximal and distal skin temperature) reached significance (Suppl. Figs. S9-S11, Suppl. Table S4).
Relationships between illuminance (lux) and parameters of alertness. Presented are (A) subjective alertness, (B) median reaction time, (C) blink duration, and (D) distal-proximal gradient. All values were z-transformed, corrected for time of day effects, and averaged over time of day. Data represent mean ± SEM; parameter values and significance levels of dose-response curve fits are in Suppl. Table S4. Circles with solid lines represent data collected after 18 min of EL exposure, squares with dashed lines follow data collected after 48 min EL exposure, and triangles with dotted lines represent data collected 18 min after EL was turned off. Other correlates of alertness are shown in Suppl. Figs. S8-S10.
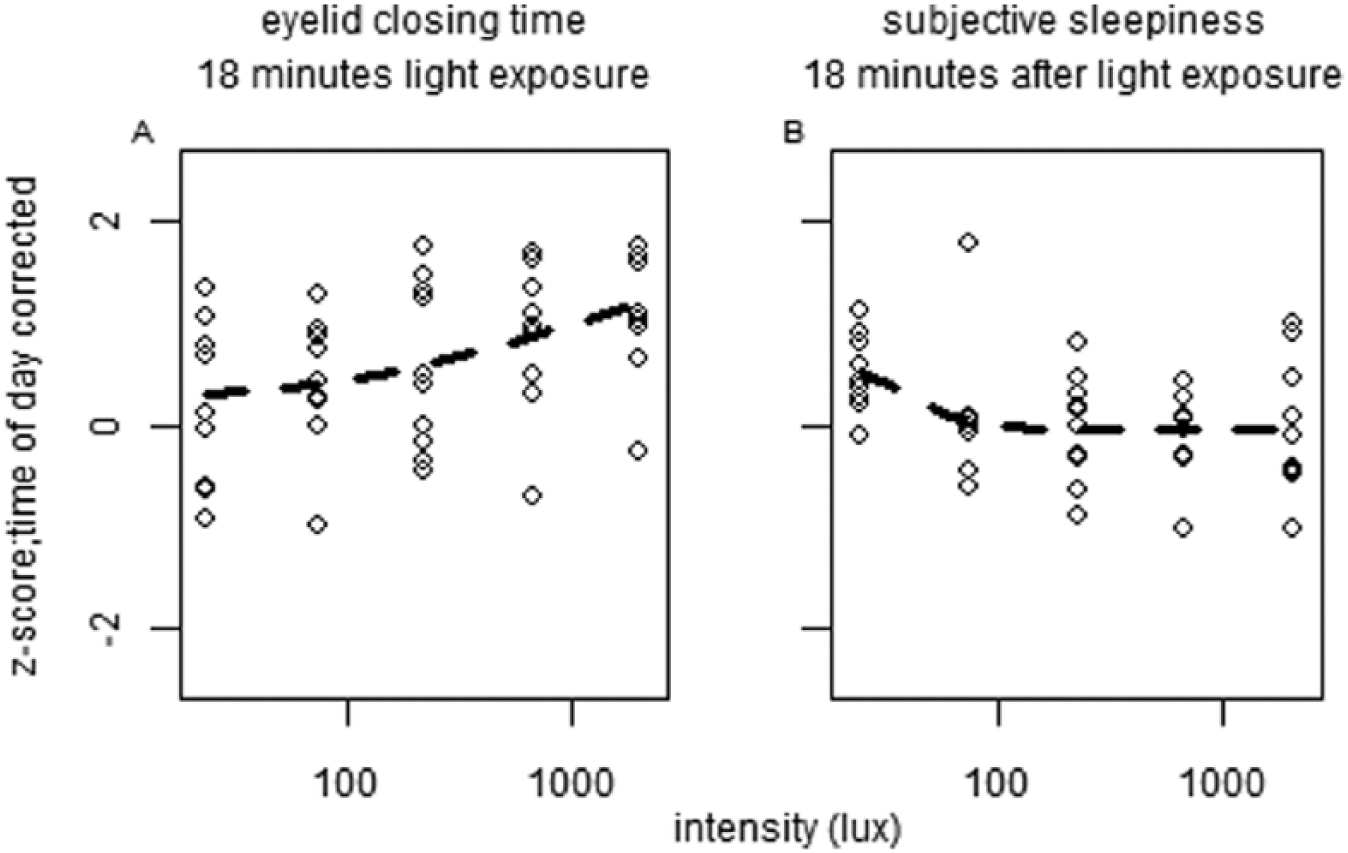
Plots of dose-response relationships between illuminance (lux) and parameters of alertness. Shown are (A) averaged eyelid closing time and (B) sleepiness after different times of light exposure. All values were z-transformed, corrected for time of day effects, and averaged over time of day. Dose-response curve parameter values and significance levels can be found in Suppl. Table S4. Open circles indicate individual data points, and dashed lines represent the calculated fit of the dose-response curve.
Discussion
The goal of this experiment was to determine dose-response curves for several measures of alertness in response to polychromatic white light during daytime. Our results show that although a few correlates of alertness have significant dose-response relationships at certain times of day, no such relationships were observed at other times of day. Moreover, multiple other objective and subjective correlates did not show dose-dependent changes in response to light during any time of day. In fact, effects of light on alertness were found to be small, if present at all. Therefore, the dose-response relationship between light and subjective and objective correlates of alertness at night (Cajochen et al., 2000) could not be confirmed during daytime.
With the many tests performed, it is possible that the few significant correlations occurred by chance. Correcting for multiple testing requires independent testing, and it is plausible that multiple correlates of alertness are not independent. Therefore, such a correction (e.g., the Bonferroni correction) is too conservative, leading to a high rate of false negatives. Hence, if it is assumed that all significant dose-response relationships indeed depict the true dose-response relationship, then it should be noted that subjective alertness displays a relationship in the same direction as established during the night (Cajochen et al., 2000), in which improved alertness occurred with increasing light intensities. Noteworthy is the fact that saturation of this response during daytime seems to appear at a light intensity of 75 lux, while saturation at night starts at a light intensity of approximately 110 lux (Cajochen et al., 2000). The circadian system is thought to be more sensitive to light at night; therefore, saturation of daytime subjective alertness at a lower light intensity might imply that the phase response relationship between light and alertness may differ from that known for light and phase shifts of the circadian pacemaker (Khalsa et al., 2003). Eyelid closing time showed decreased alertness or increased sleepiness at higher light intensities. This lack of consistency, combined with the fact that the majority of parameters at most times of the day do not show a significant dose-dependent relationship with light intensity, suggests that effects of light on alertness during daytime are very small, if present at all. This interpretation of the data is supported by a study in which 60 subjects were exposed to light at similar intensities as used here (20-2000 lux) (Smolders et al. 2018). Although those investigators used a different experimental design and different measures of alertness, their results also indicate that effects of broad-spectrum white light on alertness are not present during daytime. Most important, those authors concluded that there is no dose-response relationship between broad-spectrum light intensity and alertness during daytime.
The 2 process model of sleep-wake regulation indicates that sleep pressure is high during the evening hours, since homeostatic sleep pressure increases only with elapsed time awake (Daan et al., 1984). However, “sleepiness” receives additional circadian influence when the circadian system promotes wakefulness toward the end of the waking period (Daan et al., 1984; Dijk and Czeisler, 1994). Because the drive for wakefulness and corresponding alertness levels, influenced by both processes, is relatively unresponsive to light exposure during daytime, as our results suggest, it is possible that a ceiling effect of alertness is present at that time. Indeed, light has been shown to increase alertness during the day in mildly sleep-deprived or mentally fatigued individuals (Phipps-Nelson et al., 2003; Smolders and de Kort, 2014). On the other side of the spectrum, chronic sleep deprivation may compromise the system too severely beyond recovery. Therefore, an inverted U-shaped relationship between alerting effects of light and the level of fatigue may be expected.
In contrast, other studies have indicated improvements in alertness in response to light during daytime in well-rested individuals (Ruger et al., 2005; Sahin et al., 2014; Smolders et al., 2012; Viola et al., 2008). Methodological differences among these reports complicate comparisons between studies with positive, neutral, mixed, or negative results (Lok et al., 2018). In these studies, large variations in terms of spectra and intensities exist between light devices used. Differences in spectral composition of broad-band white light might cause large differences in alertness due to opposing contributions of different cone types to NIF responses in the human retina (Spitschan et al., 2014; Woelders et al., 2018). In addition, duration of light exposure and time of day vary between studies, as well as subject inclusion criteria, sample sizes, and experimental protocols; some investigators implemented sleep restriction or deprivation and others did not. Control conditions, often consisting of “dim light,” vary as well, with studies reporting conditions of less than 1 lux and others using 200 lux (Chang et al., 2013; Smolders et al., 2012). Other factors complicating comparison are photoperiodic effects on NIF responses, such that time of year may play a role. Indeed, greater effects of artificial light have been reported under short photoperiods in both hamsters (Glickman et al., 2012) and humans (Higuchi et al., 2007). Effects of previous light history on light sensitivity might also affect NIF responses, with reports showing more melatonin suppression after lower levels of previous light exposure (Hébert et al., 2002) and adaptation to 2 weeks of blue-filtered light exposure reflected in normalizing of the response of melatonin suppression to a light pulse (Giménez et al., 2014). Even if time of year is the same, differences in entrainment may compromise light-triggered responses. In this study, we did not collect actigraphy data before the in-laboratory part of the experiment, and we therefore cannot be absolutely sure that all subjects were entrained in the same way. However, we did select on chronotype (MSFsc), which has been shown to correlate well with the clock phase marker dim light melatonin onset (Kantermann et al., 2015). Other individual differences might complicate matters even further. In responses to monochromatic light, Vandewalle and colleagues (2006) found significant improvements in subjective alertness during daytime, a finding which was correlated to posterior thalamic responses only in individuals who showed an alerting response to light. Since inclusion criteria were the same for all participants, this indicates that there are individual differences in light sensitivity, such that some individuals respond to light whereas others do not (Vandewalle et al., 2006). Interindividual differences in genetic makeup may account for these differences in light sensitivity, which might be explained partly by polymorphisms in the PER3 clock gene (Chellappa et al., 2014). Another factor that may explain these interindividual differences is the interindividual variation in locus coeruleus activity, which could affect both baseline alertness and alerting effects of light (Wood et al., 2017). Individual differences in melanopsin signaling have also been reported to affect NIF responses (van der Meijden et al., 2016). Together, these studies suggest that there is individual variation in light sensitivity that might influence NIF responses such as alerting effects of light. During daytime, when the circadian system is relatively insensitive to light, individual differences in light sensitivity might contribute significantly to a lack of light response compared with nighttime, when the circadian system promotes sleep.
Rhythmicity of the circadian system could underlie differences in alerting effects of light between night and day. Several physiological factors are under circadian control, of which one is pineal melatonin secretion. Melatonin secretion peaks during the night and is virtually absent during the day (Moore, 1996). Nighttime exposure to both polychromatic white and monochromatic blue light has been shown to improve alertness while at the same time suppress melatonin (Badia et al., 1991; Chellappa et al., 2011; Figueiro et al., 2016; Myers and Badia, 1993; Perrin et al., 2004; Ruger et al., 2005). Correlations between melatonin suppression and subjective and objective measures of alertness have been demonstrated (Cajochen, 2007; Lockley et al., 2006). However, some studies did not find effects of melatonin suppression on subjective sleepiness (Rahman et al., 2017), and other studies induced alerting effects without suppressing melatonin (Figueiro et al., 2015; Van de Werken et al., 2013) or found alerting effects of light at times of day when melatonin is absent (Phipps-Nelson et al., 2003; Ruger et al., 2005). It has been shown that daytime administration of superpharmacological levels of exogenous melatonin may induce sleepiness (Cajochen et al., 1997). A partial causal role of melatonin suppression in mediating the alerting effects of light (Lieberman et al., 1985; Myers and Badia, 1993) might explain our findings that daytime light exposure does not result in increased alertness because there is no melatonin production during daytime. Alternatively, the sensitivity to alerting effects of light need not necessarily be directly related to melatonin suppression but may also be under direct circadian control such that light is less effective in inducing alertness during clock phases corresponding to the active period.
In summary, several factors that could affect results of experiments investigating NIF effects of light are usually not taken into account. These factors may have contributed either to previously reported positive results or to the current lack of effect. This may indicate that alerting effects of light during daytime can occur only under highly specific or controlled circumstances and possibly only in certain individuals, which would limit practical applications. The number of experiments reporting positive effects of polychromatic white light on alertness during daytime are limited, as are the studies reporting negative results (Lok et al., 2018). The possibility that some of these results might be chance observations should not be neglected, given all factors provided above. A publication bias toward experiments reporting positive effects of light and alertness may exist, since negative results are usually less often published.
Our results suggest a pattern in both subjective and objective parameters of alertness over the course of the day, with relatively low levels of subjective alertness upon awakening, relatively high levels in the (early) afternoon, and a decrease in alertness toward the end of the day. This finding was unaffected by the light interventions. A similar pattern has been shown in several studies (Ekstedt et al., 2009; Eriksen, 2005). In a recent field study with a large sample size (n = 431), Åkerstedt and colleagues (2017) showed similar patterns of subjective alertness over the course of the day as we report here, although no light-based interventions were applied in that study. These findings support the notion that patterns of subjective alertness over the course of the day are independent of light manipulation.
In conclusion, our results indicate that 1-h polychromatic white light pulses administered at different times of day do not improve alertness in a dose-dependent manner in well-rested individuals. Whatever the underlying mechanism, we conclude that the alerting effect of light during the day is much smaller than during the night, if present at all.
Supplemental Material
Supplementary_information_White_light_during_daytime_does_not_improve_alertness_in_well-rested_individuals – Supplemental material for White Light During Daytime Does Not Improve Alertness in Well-rested Individuals
Supplemental material, Supplementary_information_White_light_during_daytime_does_not_improve_alertness_in_well-rested_individuals for White Light During Daytime Does Not Improve Alertness in Well-rested Individuals by Renske Lok, Tom Woelders, Marijke C. M. Gordijn, Roelof A. Hut and Domien G. M. Beersma in Journal of Biological Rhythms
Footnotes
Acknowledgements
The authors thank student Dick Ameln for his efforts in designing and constructing the glasses that were used to measure blink-parameters and student Nina Ranchor for her assistance in collection of the data. This research was funded by the University of Groningen Campus Fryslân (Grant No. 01110939; cofinanced by Philips Drachten and Provincie Fryslân).
Conflict of Interest Statement
The authors have declared the following potential conflict of interest with respect to the research, authorship, and/or publication of this article: Philips Drachten has made an in-kind contribution to the experiment. Dr. Gordijn reports receiving consultancy fees from Philips Consumer Lifestyle, not related to the submitted work.
Notes
References
Supplementary Material
Please find the following supplemental material available below.
For Open Access articles published under a Creative Commons License, all supplemental material carries the same license as the article it is associated with.
For non-Open Access articles published, all supplemental material carries a non-exclusive license, and permission requests for re-use of supplemental material or any part of supplemental material shall be sent directly to the copyright owner as specified in the copyright notice associated with the article.