
Abstract
The adult circadian clock in the suprachiasmatic nucleus (SCN) of the hypothalamus is resilient to glucocorticoids (GCs). The fetal rodent SCN resembles that of the adult in its organization of GC-sensitive peripheral tissues. We tested the hypothesis that the fetal SCN clock is sensitive to changes in GC levels. Maternal GCs must pass through the placenta to reach the fetal SCN. We show that the maternal but not the fetal part of the placenta harbors the autonomous circadian clock, which is reset by dexamethasone (DEX) and rhythmically expresses Hsd11b2. The results suggest the presence of a mechanism for rhythmic GC passage through the placental barrier, which is adjusted according to actual GC levels. GC receptors are expressed rhythmically in the laser-dissected fetal SCN samples. We demonstrate that hypothalamic explants containing the SCN of the mPer2 Luc mouse prepared at embryonic day (E)15 spontaneously develop rhythmicity within several days of culture, with dynamics varying among fetuses from the same litter. Culturing these explants in media enriched with DEX accelerates the development. At E17, treatment of the explants with DEX induces phase advances and phase delays of the rhythms depending on the timing of treatments, and the shifts are completely blocked by the GC receptor antagonist, mifepristone. The DEX-induced phase-response curve differs from that induced by the vehicle. The fetal SCN is sensitive to GCs in vivo because DEX administration to pregnant rats acutely downregulates c-fos expression specifically in the laser-dissected fetal SCN. Our results provide evidence that the rodent fetal SCN clock may respond to changes in GC levels.
Circadian rhythms are an evolutionary adaptation to synchronize the body with daily changes in environmental conditions. In mammals, rhythms are driven by clocks that develop gradually during the perinatal period (Sumová et al., 2012). The disruption of maternal rhythms affects the synchronization of the circadian clocks in offspring, predisposing them to distinct diseases later during life (Davis and Gorski, 1985, 1988; Landgraf et al., 2015; Mendez et al., 2016; Reppert and Schwartz, 1986; Varcoe et al., 2016). Therefore, an understanding of the maternal signals received by fetal clocks is of utmost importance.
Circadian clocks operate at the cellular level by employing a set of clock genes that are rhythmically expressed based on transcription-translation feedback loops (Takahashi et al., 2008). In adults, the principal circadian oscillator in the suprachiasmatic nucleus (SCN) of the hypothalamus receives information about environmental light from the retina (Klein et al., 1991; Moore and Eichler, 1972) and synchronizes cellular clocks in other organs and tissues via multiple signals (reviewed in Dibner et al., 2010; Schibler et al., 2015). During pregnancy, fetal clocks receive information about environmental changes via rhythmic maternal signals passing through the placenta. The mechanism of entrainment and the development of the fetal clock in the SCN are not well understood (Sumová and Čečmanová, 2018). In all rodents studied to date, the morphological maturation of the SCN occurs gradually, with dynamics relative to the length of their gestational periods: approximately 20 days in mice and 22 days in rats. Neurogenesis is completed during the third week of pregnancy, but the synapses are gradually formed only afterwards, with the process is completed postnatally (reviewed in Bedont and Blackshaw, 2015; Landgraf et al., 2014). Rhythmic clock gene expression within the SCN is detected before birth. At the single-cell level, the first rhythms in clock-driven bioluminescence were observed in organotypic cultures of the SCN explanted from transgenic mPer2 Luc mice at embryonic day E15.5 (Carmona-Alcocer et al., 2018). At the SCN tissue level, the in vivo rhythms were detected later during prenatal stages, namely, at E17 in mice (Shimomura et al., 2001) and at E20 in rats (Houdek and Sumová, 2014). The amplitudes of these rhythms increased further during the postnatal period (Sládek et al., 2004).
The SCN of adult animals is resilient to glucocorticoids (GCs) (Balsalobre et al., 2000; Rosenfeld et al., 1988; Tahara et al., 2015), but the effects of GCs on the immature fetal SCN clock have not been studied. GC receptors are found in fetal tissues, such as the brain, liver, gut, and lungs, and GCs play an important role in the development and maturation of these tissues (reviewed in Seckl, 2001). GCs are rhythmically released into the maternal bloodstream, peaking at the beginning of the active phase (Cheifetz, 1971). The levels of GCs that reach the fetus are precisely regulated because their excess or shortage has a negative developmental effect and can lead to serious diseases in adulthood (Edwards et al., 1993; Nyirenda et al., 1998; Seckl, 1997). This protective role is played by the placenta, which represents an interface between the maternal and fetal tissues and supports the fetus in terms of nutrients and hormones. The placenta regulates the amount of GC that reaches the fetus via the enzyme 11β-hydroxysteroid dehydrogenase (HSD2), which catalyzes the conversion of metabolically active corticosterone into inactive 11-dehydrocorticosterone (Burton and Waddell, 1999; Yang, 1997).
The goal of this study was to test a novel hypothesis that the fetal SCN clock responds to maternal GCs that entrain the clock according to rhythmic changes in their levels. By definition, entrainment of the circadian clock requires adjusting its period and phase according to an external rhythmic cue (Pittendrigh, 1992). The presence of GC receptors in the fetal SCN and the mechanism of rhythmic GC signaling to the fetal tissue are the basic prerequisites for testing the hypothesis. Therefore, first we examined whether the placenta harbors an autonomous clock that can temporally adjust the placental barrier according to actual GC levels and supply the fetus with GC rhythmically, and whether the fetal SCN expresses GC receptors. Then, we used a combination of in vitro and in vivo approaches to assess the effects of the synthetic GC analog dexamethasone (DEX) on the fetal SCN clock. Our results support the hypothesis of the potential role of GCs in entrainment of the fetal SCN clock.
Materials and Methods
Animals
Adult male and female mPer2 Luc mice (strain B6.129S6-Per2tm1Jt/J, JAX, USA; a colony is maintained at the Institute of Physiology, the Czech Academy of Sciences) and Wistar rats (Institute of Physiology, the Czech Academy of Sciences) were housed individually under a 12-12 h LD cycle (lights were on between 0700 h and 1900 h) in a temperature-controlled facility at 23°C ± 2°C, with free access to food and water. Vaginal smears from females were inspected to determine the estrous cycle phase. On the night of proestrus, females were mated with males. The next morning was defined as day 0 of embryonic development (E0) when the vaginal smears were sperm-positive. The gestational period lasts 21 to 22 days in rats and 20 days in mice; therefore, E19 in rats roughly corresponds to E17 in mice.
All experiments were approved by the Animal Care and Use Committee of the Institute of Physiology and were performed in accordance with the Animal Protection Law of the Czech Republic, as well as the European Community Council directives 86/609/EEC. All efforts were made to ameliorate animal suffering.
Procedures Used in the In Vivo Experiments
For the detection of daily gene expression profiles, pregnant Wistar rats at gestational age E19 were sacrificed under deep anesthesia at 3-h intervals over a 24-h period. Anesthesia was given via intramuscular injections of a mixture of ketamine (Vétoquinol, s.r.o., Czech Republic; 120 mg/kg) and xylazine (Bioveta a.s., Czech Republic; 12 mg/kg). Time was expressed as zeitgeber time (ZT): ZT0 corresponded to lights on, and ZT12 to lights off. Fetuses were sacrificed by rapid decapitation, with 5 fetal heads and 5 placentas collected at each time point for gene expression using RT-qPCR.
To detect the presence of GC receptors in the mouse fetal SCN, 3 fetuses of a mPer2 Luc mouse at gestational age E17 were sacrificed by rapid decapitation at ZT6. Fetal heads were collected for dissection of the SCN and to detect changes in gene expression using RT-qPCR, as described below.
Acute changes in gene expression within the fetal SCN after treatment were detected in pregnant Wistar rats at gestational age E19. Rats maintained on the 12-12 LD cycle were injected intraperitoneally with either 0.5 ml PBS (phosphate-buffered saline, as a vehicle; group assigned as VEH) (n = 4), or 0.5 ml DEXAMED (dexamethasone, 1 mg/kg diluted in PBS; group assigned as DEX) (n = 4) at ZT15 (3 h after the lights off). One pregnant rat was sacrificed at 1, 2, 4, and 8 h after DEX or VEH treatment. Additionally, intact rats (n = 5) were sacrificed at times corresponding to the treatment (time 0) and then at each of the 4 sampling points (times 1, 2, 4 and 8). Fetal heads (n = 5 per each time point) and placentas (n = 5 per each time point) from each rat were collected for RT-qPCR, as described below.
Detection of mRNA Levels in the Fetal SCN using RT-qPCR
Fetal rat and mouse heads were immediately frozen on dry ice and sectioned on a cryostat into 20-µm-thick coronal sections. Each section contained the medial part of the rostro-caudal extent of the fetal SCN, as visualized with cresyl violet staining (Sigma-Aldrich; St. Louis, MO, USA). The SCN was precisely separated bilaterally using a laser microdissector (LMD6000, Leica), as previously described by us elsewhere (Houdek and Sumová, 2014). Dissected fetal SCN tissues were collected in a microfuge tube containing RLT buffer (RNeasy Micro kit; Qiagen; Valencia, CA, USA) and stored until RNA isolation. Total RNA was isolated using the RNeasy Micro kit, according to the manufacturer’s instructions. Isolated RNA samples were immediately reverse-transcribed into cDNA using the HiCapacity cDNA Synthesis Kit (Thermo Fisher; Waltham, MA, USA). Diluted cDNA was amplified on a LightCycler480 Real-Time PCR System (Roche, Basel, Switzerland) in 14-µl reactions using 5× HOT FIREPol Probe qPCR Mix Plus (Solis Biodyne, Tartu, Estonia) and TaqMan Gene Expression Assays (Life Technologies; San Francisco, CA, USA) for the following genes: rat GC receptor gene rNr3c1 (Rn00561369_m1, FAM-labeled), mouse GC receptor gene mNr3c1 (Mm00433832_m1 FAM), and rat rc-fos gene (Rn02396759_m1, FAM). ΔΔCt method was used to quantify relative cDNA concentrations against (up to) 3 reference genes: Beta-2-Microglobulin (rB2M, Rn00560865_m1, VIC-labeled, mB2M, Mm00437762, VIC), Peptidylprolyl Isomerase A (rPpia, Rn00690933_m1, VIC) and Hydroxymethylbilane Synthase (rHmbs, Rn01421873_g1, VIC). Hippocampus tissues dissected from an adult mouse were used as a standard for the detection of mNr3c1 in the fetal mouse SCN.
Detection of mRNA Levels in the Placenta using RT-qPCR
The maternal and fetal parts of the placenta were carefully separated with fine scissors, placed into RNAlater stabilization reagent (Sigma-Aldrich) and stored at −20°C. Samples were homogenized using ultrasound sonication and RNA was purified using the RNeasy Mini kit (Qiagen), according to the manufacturer’s instructions. RNA concentrations were measured using NanoDrop1000 Spectrophotometer (Thermo Fisher) at 260 nm. Each sample was diluted with ddH2O to a final concentration of 100 ng/µl. RNA was reverse-transcribed using the HiCapacity cDNA Synthesis Kit (Thermo Fisher). Diluted cDNA was then amplified on the LightCycler480 Real-Time PCR System (Roche) in 14-µl reactions using the SYBR Select qPCRMasterMix (Thermo Fisher) and 250 nM of the following forward and reverse primers: rB2M, Forward (F): 5’-CGCTCGGTGACCGTGATCTTTCTG-3’, Reverse (R): CTGAGGTGGGTGGAACTGAGACACG; rNr1d1 (Rev-ErbAα), F: GCTGTGCGGGAGGTGGTAGAAT, R: TGTAGGTTGTGCGGCTCAGGAA; rPer1, F: CGCACTTCGGGAGCTCAAACTTC, R: GTCCATGGCACAGGGCTCACC; rPer2, F: GAATTTTCACAACAACCCAC, R: TGTAGGATCTTCTTGTGGATG; rArntl (Bmal1), F: CAATGCGATGTCCCGGAAGTTAGA, R: AAATCCATCTGCTGCCCTGAGAAT; rHsd11b2, F: CAGGAGACATGCCATACC, R: GATGATGCTGACCTTGATAC. The ΔΔCt method was used to quantify relative cDNA concentrations with B2M as reference gene.
Preparation of Organotypic Explants
Pregnant mPer2 Luc mice maintained on a 12-12 LD cycle were sacrificed between ZT5 and ZT8 via rapid cervical dislocation at E15 or E17. Fetuses were extracted and sacrificed by rapid decapitation. Brains were removed and explants of the ventral hypothalamus containing the SCN (~4 mm3) were dissected using fine scissors. The placentas were cut longitudinally, dissected into maternal and fetal parts, and then cut into explants (~4 mm3). The explants were immediately placed into Millicell Culture Inserts (Merck, Darmstadt, Germany) inside 35-mm Petri dishes with 1 ml of air-buffered recording medium supplemented with 100 U/ml penicillin, 100 µg/ml streptomycin, 10 µg/ml gentamicin, 1% GlutaMAX (Thermo Fisher), 5% (SCN)/15% (placenta) fetal calf serum (Sigma-Aldrich), 1% B27 supplement (Thermo Fisher), and 0.1 mM D-Luciferin (Biosynth; Staad, Switzerland).
Bioluminescence Recordings In Vitro
Bioluminescence recordings in the LumiCycle apparatus (Actimetrics; Wilmette, IL, USA) began immediately after preparation of the explant cultures. The software package supplied with the Lumicycle apparatus was used to quantitatively analyze the raw data. Data were baseline-subtracted using the 24-h running average and then fitted to a sine wave to calculate the amplitude, period, and phase shift before and after treatment.
Explants were recorded for approximately 10 days after culture preparation to detect the spontaneous development of rhythmicity of the SCN at E15. Rhythm onset was defined when the peak-to-peak amplitude ratio greater than 3 was followed by a stable circadian oscillation that persisted until the end of the recording interval. Explants that did not display rhythmicity within this interval were considered nonviable (less than 10% of all explants). A separate set of E15 SCN explants was recorded in media containing 100 nM DEX. Explants from the E17 SCN were cultured in media supplemented with or without 100 nM DEX and recorded for approximately 5 days. Thereafter, explants cultured without DEX were exposed to 100 nM DEX and recorded for an additional 3 to 5 days. Careful notes were kept regarding which SCN explants were obtained from fetuses of the same litter.
Explants of the maternal and fetal parts of the placenta were recorded immediately after explanting until their rhythmicity dampened (~5 days). The viability of the fetal placental explants was verified by assessing rhythmicity after the addition of 1 µl of 100 µM DEX per 1 ml of culture media.
To analyze the effects of DEX on the amplitude, period, and phase of the bioluminescence rhythms, E17 SCN and maternal placenta explants were cultured for 2 days in fresh recording medium and, on day 3, were exposed to a treatment procedure admini-stered at different times relative to the phase of the bioluminescence rhythm. The treatments involved the addition of either 1 µl of 100 µM DEX per 1 ml of medium (assigned as the DEX group) or 1 µl of the corresponding vehicle (0.01% ethanol in ddH2O; VEH group). Additionally, a separate set of explants was pretreated for 30 min with either 1 µl of 1 mM mifepristone in ethanol before DEX (MIF+DEX) or VEH (VEH+DEX) treatment, and recorded for 3 days. For repeated treatments, explants were washed with warmed (37°C) PBS twice for 5 min and then placed in fresh media warmed to the same temperature.
Constructing the Phase-Response Curves (PRCs) and Phase-Transition Curves (PTCs)
Treatment-induced phase shifts in the bioluminescence rhythms were quantified by fitting a sine curve to the first of at least 3 full circadian cycles of a 24-h running average baseline-subtracted rhythm, and then extrapolating beyond the time of the treatment. The resulting absolute phase shift was calculated as the difference between the extrapolated sine curve (reflecting the original phase) and the actual measured trace of luminescence after treatment (reflecting the new phase), and was designated as either a phase advance (+) or a phase delay (−). The phase-response curve (PRC) was constructed by plotting the calculated phase shift as a function of the time of treatment normalized to the endogenous period in vitro, and is expressed relative to the trough (time 0) or peak (time 12) of the rhythm. For statistical comparisons, continuous PRCs were visualized by binning the data into 3-h intervals.
A phase-transition curve (PTC) was constructed by plotting the peak of the first full cycle after treatment (y, new phase) as a function of the peak of the extrapolated sine curve (x, old phase). The PTC data were tetra-plotted for clarity.
Statistical Analysis
Daily gene expression profiles were analyzed using one-way ANOVA (for the detection of a significant effect of time) and cosinor analysis (for the detection of the presence of a circadian rhythm). The cosinor analysis was performed by fitting the data to 2 alternative regression models: either a horizontal straight line (null hypothesis) or a single cosine curve (alternative hypothesis), defined by the equation: Y = mesor + (amplitude × cos [2π × {X-acrophase}/wavelength]) with a constant wavelength of 24 h. P values and the coefficient of determination, R2 (goodness of fit), were determined. For comparisons between binned PRCs, 2-way ANOVA (effect of group), followed by post hoc analysis with Sidak’s multiple comparison, was used; P < 0.05 was required for significance. Differences in amplitude, period, or phase between the experimental groups were assessed using paired or unpaired multiple t-tests, where applicable. Parameters (slope, intercept) of the PRCs were tested using a linear regression analysis. All statistics were performed using Prism 7 software (GraphPad; San Diego, CA, USA).
Results
The Circadian Clock in the Maternal Part of the Placenta Temporally Controls Local GC Metabolism and Is Entrained by GCs
As a first step, we examined the role of the placenta in providing the fetus with a rhythmic GC signal. To assess the presence of circadian clocks in the placenta, we analyzed circadian profiles of clock gene expression (Nr1d1, Per2, Per1 and Bmal1) in vivo sepa-rately in samples of the maternal and fetal parts of rat placentas collected at E19 (Fig. 1A). In the maternal part of the placenta, circadian rhythmicity was confirmed for Nr1d1 (1-way ANOVA: P = 0.0022, F(8, 33) = 3.965; cosinor: P = 0.0019, R2= 0.2747) and Per2 (1-way ANOVA: P = 0.0085, F(8, 36) = 3.137; cosinor: P = 0.0008; R2= 0.2877) but not for Per1 (1-way ANOVA: P = 0.1453, F(8, 36) = 1.649; cosinor: P = 0.0446; R2= 0.1377) or Bmal1 (1-way ANOVA: P = 0.0191, F(8, 33) = 2.751; cosinor: P = 0.2548; R2= 0.0677). In the fetal part of the placenta, shallow rhythms were detected for Nr1d1 (1-way ANOVA: P = 0.0133, F(8, 35) = 2.915; cosinor: P = 0.0046, R2= 0.2310), which was due to an elevated level at a single time point at ZT12, and for Per2 (1-way ANOVA: P = 0.0115, F(8, 34) = 3.009; cosinor: P = 0.028, R2= 0.1637). Arrhythmic expression of Per1 (1-way ANOVA: P = 0.1522, F(8, 35) = 1.628; cosinor: P = 0.8196, R2= 0.0097) and Bmal1 (1-way ANOVA: P = 0.1254, F(8, 35) = 1.732; cosinor: P = 0.1529, R2= 0.0875) was observed. We detected PER2-driven bioluminescence in organotypic explants prepared from the maternal and fetal parts of mPer2 Luc mouse placenta and cultured in vitro to assess whether the clocks in these individual parts of the placenta oscillate autonomously. Representative bioluminescence traces (Fig. 1B) show significant circadian rhythmicity in PER2-driven bioluminescence in the maternal placental explants, but the fetal placental explants are arrhythmic. The analyses of these rhythms in the maternal part of the placenta are summarized in detail in Figure 2.
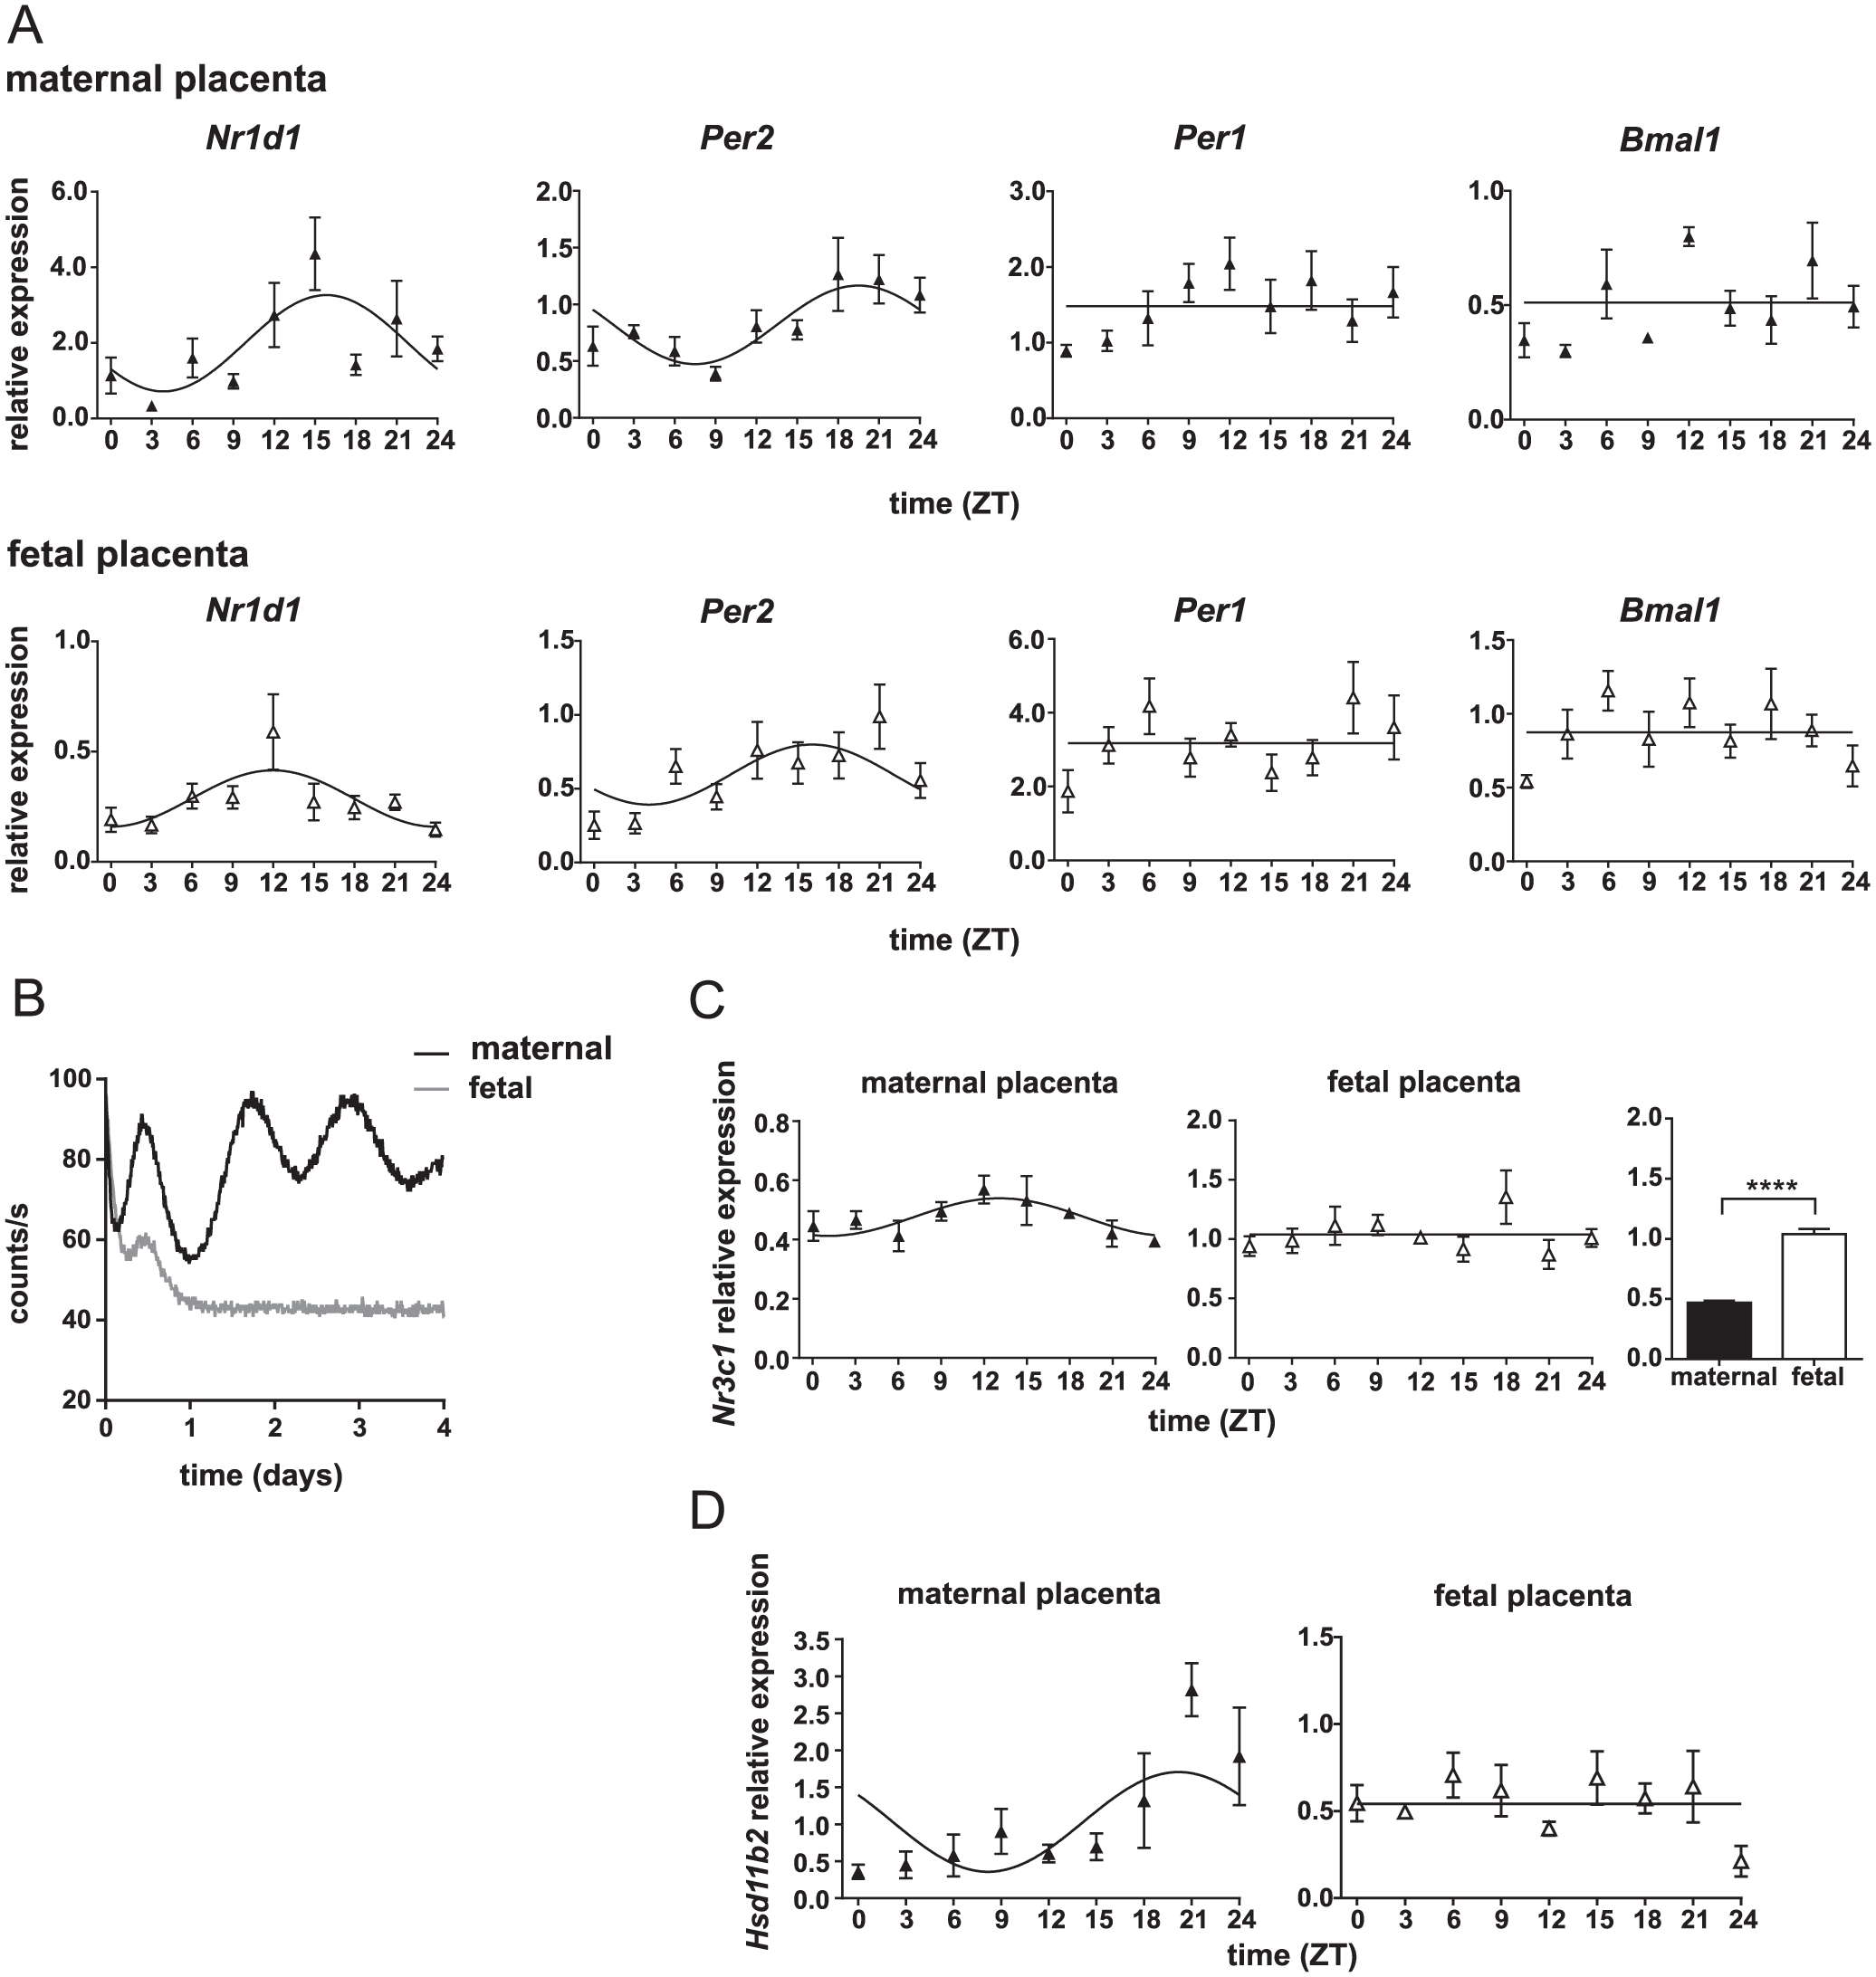
Circadian clock in the rat placenta. (A) Daily profiles of clock gene expression (Nr1d1, Per2, Per1, and Bmal1) in the maternal part (upper panel) and fetal part (lower panel) of the rat placenta collected at gestational age E19. Pregnant rats were sacrificed at 3-h intervals over the 24 h cycle (n = 5 placentas from one mother per time point). Time is expressed as zeitgeber time (ZT). The data were fitted with cosine curves (for more details, see Materials and Methods). (B) Representative traces of bioluminescence of organotypic explants from the fetal part (gray line) and maternal part (black line) of the placenta obtained from mPer2 Luc mice at gestational day 17 (which corresponds to E19 in rats). Significant bioluminescence rhythms were detected from explants of the maternal part but not the fetal part of the placenta. (C) Daily profiles of Nr3c1 mRNA levels in the placenta sampled from mothers of the fetuses used in Fig. 1A. The maternal part and fetal part of the placentas were assayed. In the maternal part, the cosinor analysis fitted a very shallow rhythm in Nr3c1 expression but the rhythmicity was not significant (ANOVA). Constitutive Nr3c1 expression was observed in the fetal part of the placenta across the 24-h cycle. The relative Nr3c1 transcript levels were compared between the maternal and fetal parts of the placenta. ****P < 0.0001. (D) Hsd11b2 expression levels in the maternal and fetal parts of the placenta (same samples as shown in 1A). The data were fitted with cosine curves (for more details, see Materials and Methods).
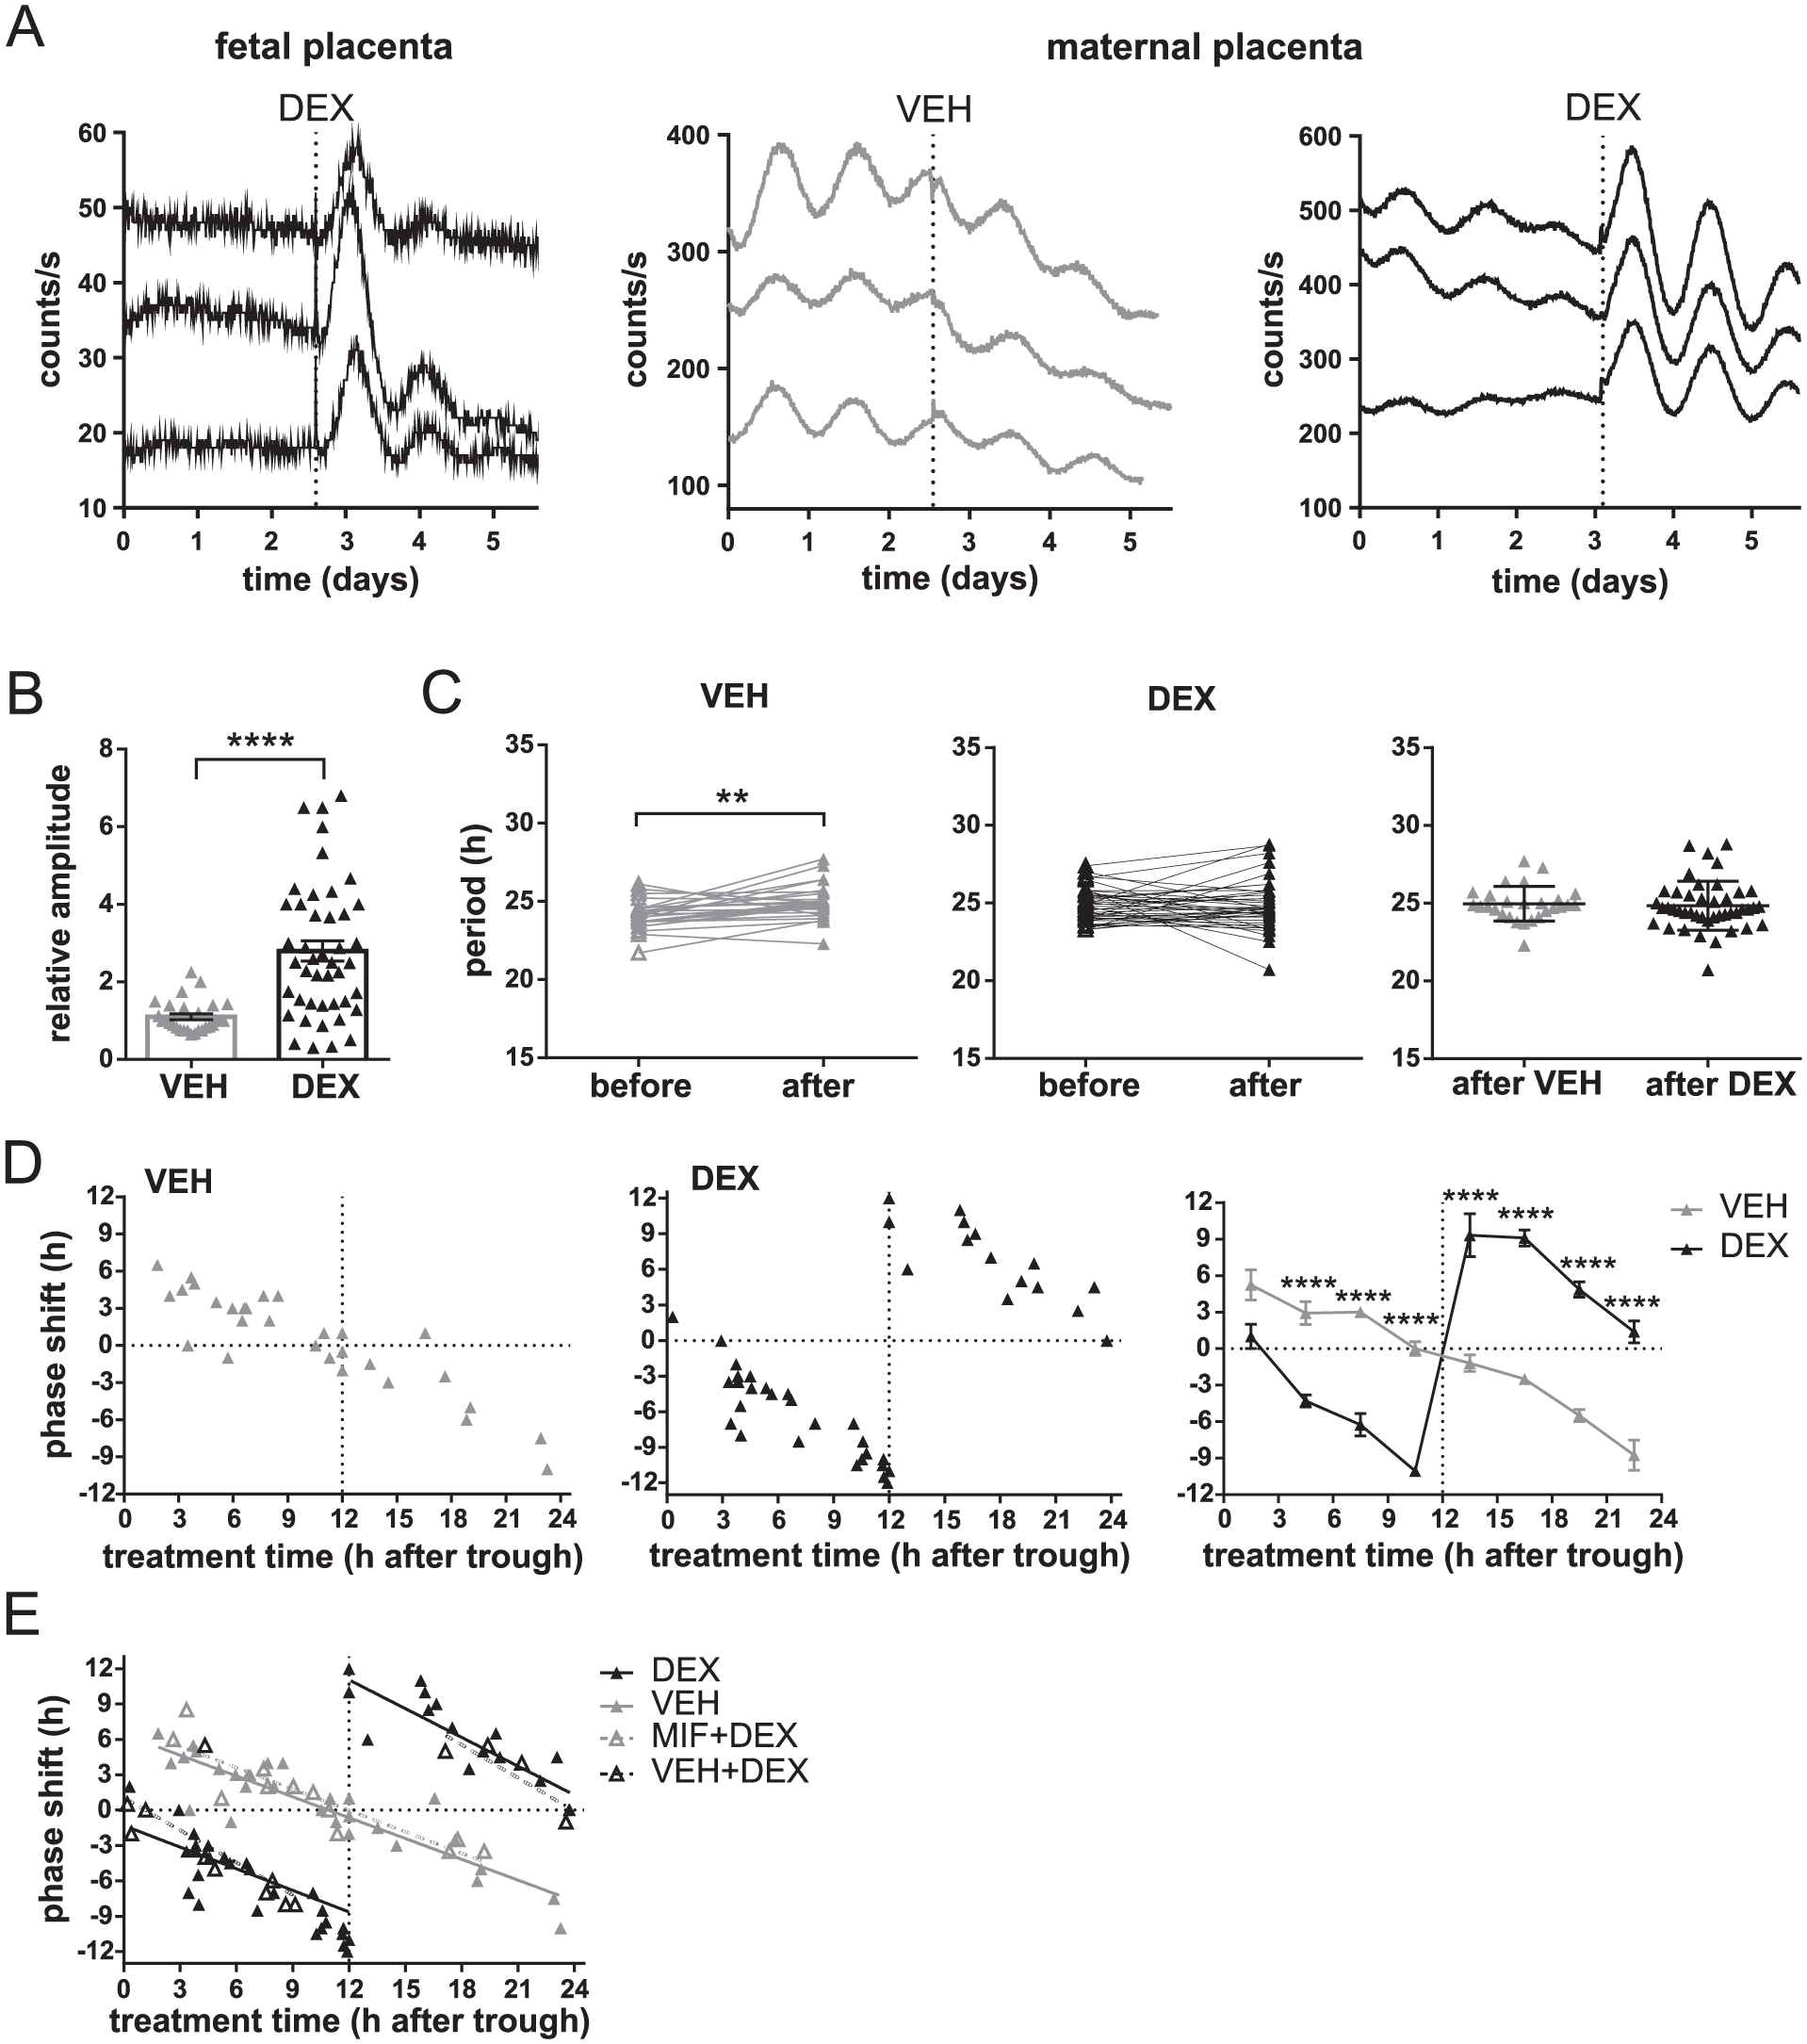
Effect of dexamethasone (DEX) on circadian clocks in organotypic explants of the placenta from mPer2 Luc mice prepared at gestational age E17. (A) Representative traces of bioluminescence from the fetal (left) and maternal (middle and right) parts of the placenta; recording began immediately after culture preparation. Explants were treated with DEX or VEH (vertical dotted line). Each trace represents a different placental explant sampled from the same mother. (B) Effects of VEH (grey) or DEX (black) on changes in the amplitudes of bioluminescence rhythms of organotypic explants from the maternal part of the placenta (n = 73). Ratios of the peak magnitudes before and after treatment were calculated (data are presented as individual ratios and mean ± SEM). ****P < 0.0001. (C) Effect of VEH (grey) or DEX (black) treatments on the period of bioluminescence rhythms of organotypic explants from the maternal part of the placenta (n = 73). Periods of individual explants before and after each treatment as well as periods resulting from the VEH and DEX treatments were compared. **P = 0.0085. (D) PRCs for VEH (left graph, grey) or DEX (middle graph, black) treatments of organotypic explants of the maternal part of the placenta (n = 73). Data for each treatment are presented as magnitudes of a phase shift (+ advance, − delay) produced by the treatment performed at a specific time relative to the bioluminescence peak (expressed as time 12 h). Additionally, a comparison of the PRCs for VEH and DEX treatments binned into 3-h intervals is depicted (right graph). ****P < 0.0001. (E) Effect of the GC antagonist mifepristone (MIF) on the phase shifts produced by DEX. DEX-treated maternal placental explants (n = 26) were pretreated with MIF (MIF+DEX) or with VEH (VEH+DEX), and the shifts were plotted to the PRC for DEX and VEH. For more details, see Materials and Methods.
To ascertain whether the rat placenta contains GC receptors at E19 and whether their levels exhibit circadian variation, daily profiles of Nr3c1 mRNA levels were separately detected in the maternal and fetal parts of the placenta (Fig. 1C). In the maternal part, the cosinor analysis fitted a very shallow rhythm in Nr3c1 expression (cosinor: P = 0.0114, R2 =0.1920) but rhythmicity was not significant (1-way ANOVA: P = 0.1534, F(8, 36) = 1.620). Constitutive Nr3c1 expression was observed in the fetal part of the placenta across the 24-h cycle (1-way ANOVA: P = 0.2342, F (8, 35) = 1.3920; cosinor: P = 0.7561, R2 = 0.0136). The overall relative Nr3c1 expression levels were significantly higher in the fetal part than in the maternal part of the placenta (P < 0.0001, t87 = 12.73).
GC levels passing the placenta are controlled by the enzyme HSD2. Therefore, we detected daily expression profiles of the gene encoding for HSD2, Hsd11b2 (Fig. 1D), in the same samples as those used for the clock gene expression profiles depicted in Fig. 1A. The expression did not change significantly in the fetal part of the placenta over the 24-h interval (1-way ANOVA: P = 0.1114, F(8, 34) = 1.800; cosinor: P = 0.5267, R2= 0.0315) but exhibited circadian rhythmicity in the maternal part (1-way ANOVA: P = 0.0004, F(8, 36) = 4.871; cosinor: P = 0.0127, R2= 0.1877).
After providing evidence for rhythmic activity of the placental barrier, we tested whether the placental clock can be reset by GCs. We analyzed the effects of DEX as a synthetic corticosteroid analog on the PER2-driven bioluminescence rhythms of placental organotypic explants from mPer2 Luc mice (Fig. 2). DEX treatment exerted different effects on the explants prepared from the fetal and maternal parts of the placenta, as shown in representative recording in Figure 2A. The arrhythmic bioluminescence emitted from the fetal placenta (Fig. 2A, left graph) was only acutely affected by DEX treatment, inducing 1 to 2 cycles followed by a rapid dampening of the rhythm. In contrast, explants from the maternal placenta exhibited significant circadian rhythmicity in PER2-driven bioluminescence immediately after explanting as well as after treatment with VEH (Fig. 2A, middle graph) or DEX (Fig. 2A, right graph). We found that, unlike VEH treatment, DEX treatment significantly increased the ratio between the amplitudes before and after treatment (unpaired t-test: P < 0.0001, t70 = 5.090) (Fig. 2B). Although VEH treatment tended to affect the period of the rhythms (paired t-test: P = 0.0085, t27 = 2.838), DEX treatment did not change the period significantly (paired t-test: P = 0.8128, t43 = 0.2382). The mean period resulting from VEH and DEX treatments was not different (unpaired t-test: P = 0.6519, t70 = 0.4531) (Fig. 2C). Importantly, VEH and DEX treatments affected the phase of the maternal placenta rhythms in a different way (Fig. 2D). For both treatments, the magnitude of the phase shifts depended on the timing of these treatments relative to the bioluminescence rhythm (trough and peak defined as times 0 and 12, respectively). Data are plotted as PRCs for VEH (Fig. 2D, left graph in grey) and DEX (Fig. 2D, middle graph in black) treatments. For VEH treatment, the transition point between the phase advances and phase delays was at time 24/0 (PER2 trough); the magnitude of these shifts gradually decreased to reach minimal values at time 12 (PER2 peak). In striking contrast, DEX treatment produced a completely reversed PRC, with the transition point at time 12 (PER2 peak) and the dead zone (minimal shifts) at time 24/0 (PER2 trough). The effect of DEX was confirmed by a statistical comparison of the binned PRCs (Fig. 2D, right graph), in which the shifts were cumulated into 3-h intervals over the 24-h observation (2-way ANOVA, group: P = 0.0044, F(1, 57) = 8.817; time: P < 0.0001, F(7, 57) = 24.12; interaction: P < 0.0001, F(7, 57) = 59.13). The post hoc analysis confirmed that the shifts produced by DEX differed significantly from those induced by the treatment procedure (VEH) at all binned time intervals (P < 0.0001), except for the interval of 0 to 3 h.
To confirm that the DEX-induced phase shifts of the placental clock were mediated via GC receptors, DEX-treated explants were pretreated with mifepristone, a selective GC receptor antagonist (MIF+DEX), or with VEH (VEH+DEX) (Fig. 2E). The resulting phase shifts are plotted into PRCs for VEH and DEX. For statistical comparison, data were double-plotted to fit the linear regression lines for VEH+DEX (Y = −0.8414×X + 20.76; P = 0.0001) and MIF+DEX (Y = −0.605×X+7.237; P < 0.0001) groups, which were significantly different (P < 0.0001, F(1, 23) = 26.91). For clarity, the lines depicted in Figure 2E were plotted in the same data layout as those in the PRCs shown in Figure 2D. It is apparent that the shifts produced by MIF+DEX correspond to those produced by VEH (indicating that MIF completely blocked the DEX-induced shifts) and the shifts produced by VEH+DEX correspond to those produced by DEX itself (indicating that the pretreatment itself did not significantly change the DEX response).
Our results provide evidence for the autonomous rhythmicity of the maternal placenta. In contrast, the fetal part of the placenta does not exhibit rhythmicity; a fast, dampening rhythm is detectable only after DEX administration. The clock in the maternal part of the placenta responds to GCs by specific phase shifts—the magnitude and direction of which depend on the timing of the actual GC levels. Furthermore, the responses can be completely blocked by the GC receptor antagonist.
GC Receptors Are Expressed Rhythmically in the Fetal SCN
We detected the presence of GC receptor expression in the laser-dissected fetal rat and mouse SCN by RT-qPCR. For the fetal rat SCN, rNr3c1 (gene encoding the GC receptor) mRNA levels were detected at E19 every 3 h over the 24-h cycle (Fig. 3A); rNr3c1 mRNA levels exhibited circadian variation (1-way ANOVA: effect of time P = 0.0475, F(8, 33) = 2.274; cosinor analysis: P = 0.0052, R2 = 0.2364), with peak levels at ZT 21.5 ± 1.1 h (acrophase ± SEM). For the fetal mouse SCN, mNr3c1 mRNA levels were analyzed in the SCN of mPer2 Luc mouse collected at E17 at ZT6 (Fig 3B). The data provide evidence for the presence of GC receptors in the SCN of rat and mouse fetuses and demonstrate circadian changes in their expression.
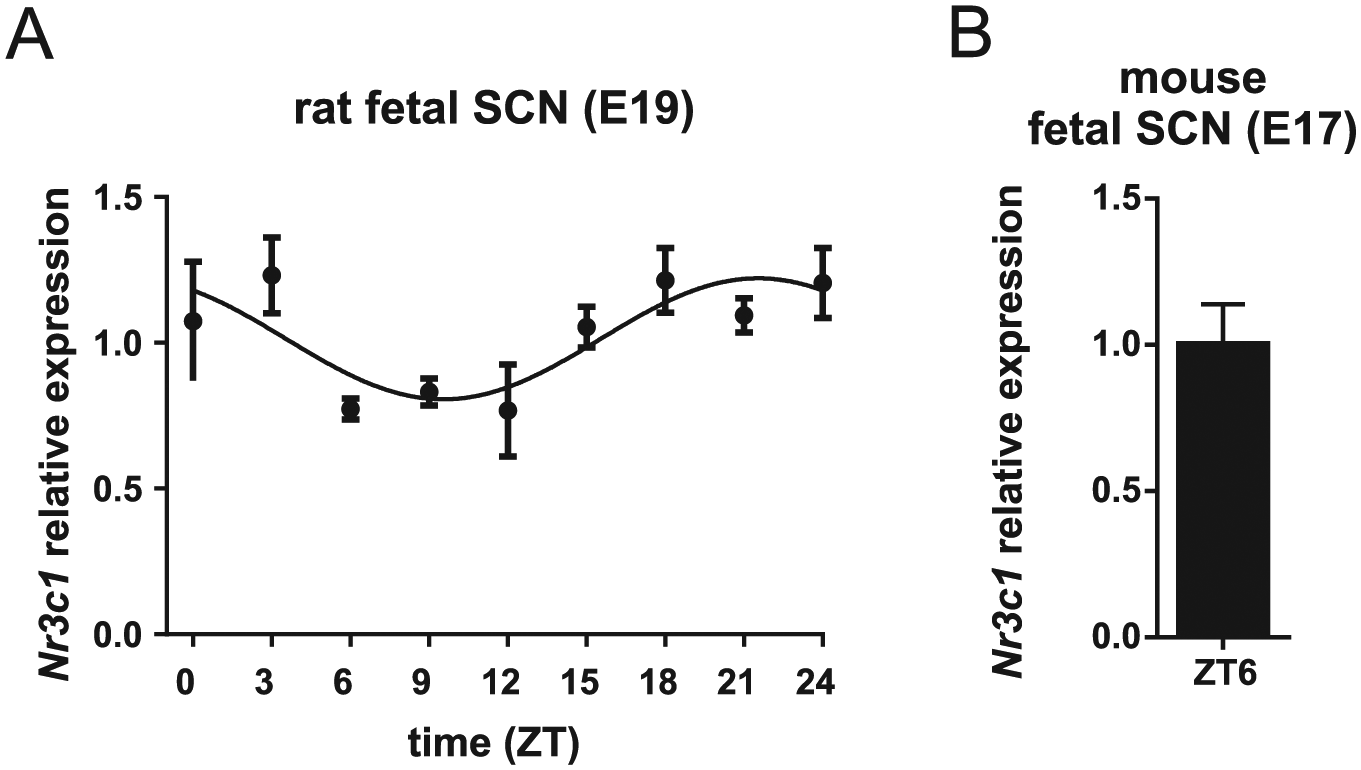
Detection of GC receptors in the laser-dissected samples of rat and mouse fetal suprachiasmatic nuclei (SCN). (A) Daily profile of Nr3c1 mRNA levels in the fetal rat SCN at embryonic stage (E)19. Pregnant rats were sacrificed at 3-h intervals over a 24-h cycle (n = 5 embryos from one mother per time point). Time is expressed as zeitgeber time (ZT). The data were fitted with cosine curves (for more details, see Materials and Methods). (B) Detection of Nr3c1 mRNA in the fetal SCN (n = 3) of mPer2 Luc mouse at E17 collected at ZT6.
GCs Accelerate the Development of Spontaneous Rhythmicity in the Fetal SCN In Vitro
As a next step, we assessed the effect of GC on the spontaneous development of the fetal SCN clock using an in vitro approach. Organotypic hypothalamic explants containing SCN were prepared from fetuses of mPer2 Luc mice at E15 and E17 and the PER2-driven bioluminescence was monitored during the first 10 days in culture. All fetuses from each mother (i.e., 2 to 11 fetuses per mother) were used to prepare organotypic explants, and the onsets of spontaneous circadian oscillations in bioluminescence were compared among fetuses from the same litter (Fig. 4). At E15 (Fig. 4A), the explants obtained from 9 mothers (n = 39) were cultured in standard media as controls (for details, see the Materials and Methods) and moni-tored without media exchange or any other disturbances for 10 days. Only 41.03% of fetal explants started to oscillate on the first day of culture, whereas the remaining explants (58.97%) developed oscillations significantly later (between the day 4 and 7 of culture). Intriguingly, large differences were observed in the onset of the spontaneous rhythmicity among fetuses from the same litter; only in 1 of 9 mothers did all explants from the same litter become rhythmic on the same day (see Fig. 4A: 4 explants obtained from mother No. 9 started to oscillate on day 1). For the remaining 8 mothers, one (rarely more) of the explants in the litter typically started to oscillate immediately, but others exhibited delayed development of rhythmicity. We assessed whether this pattern might result from the order in which the fetuses were sampled and the organotypic SCN explants were prepared for culture. There was no relationship between the order of sampling and the beginning of the oscillations, as the first explants prepared from each litter (depicted in Fig. 4A as open circles) started to oscillate on diffe-rent days after explanting.
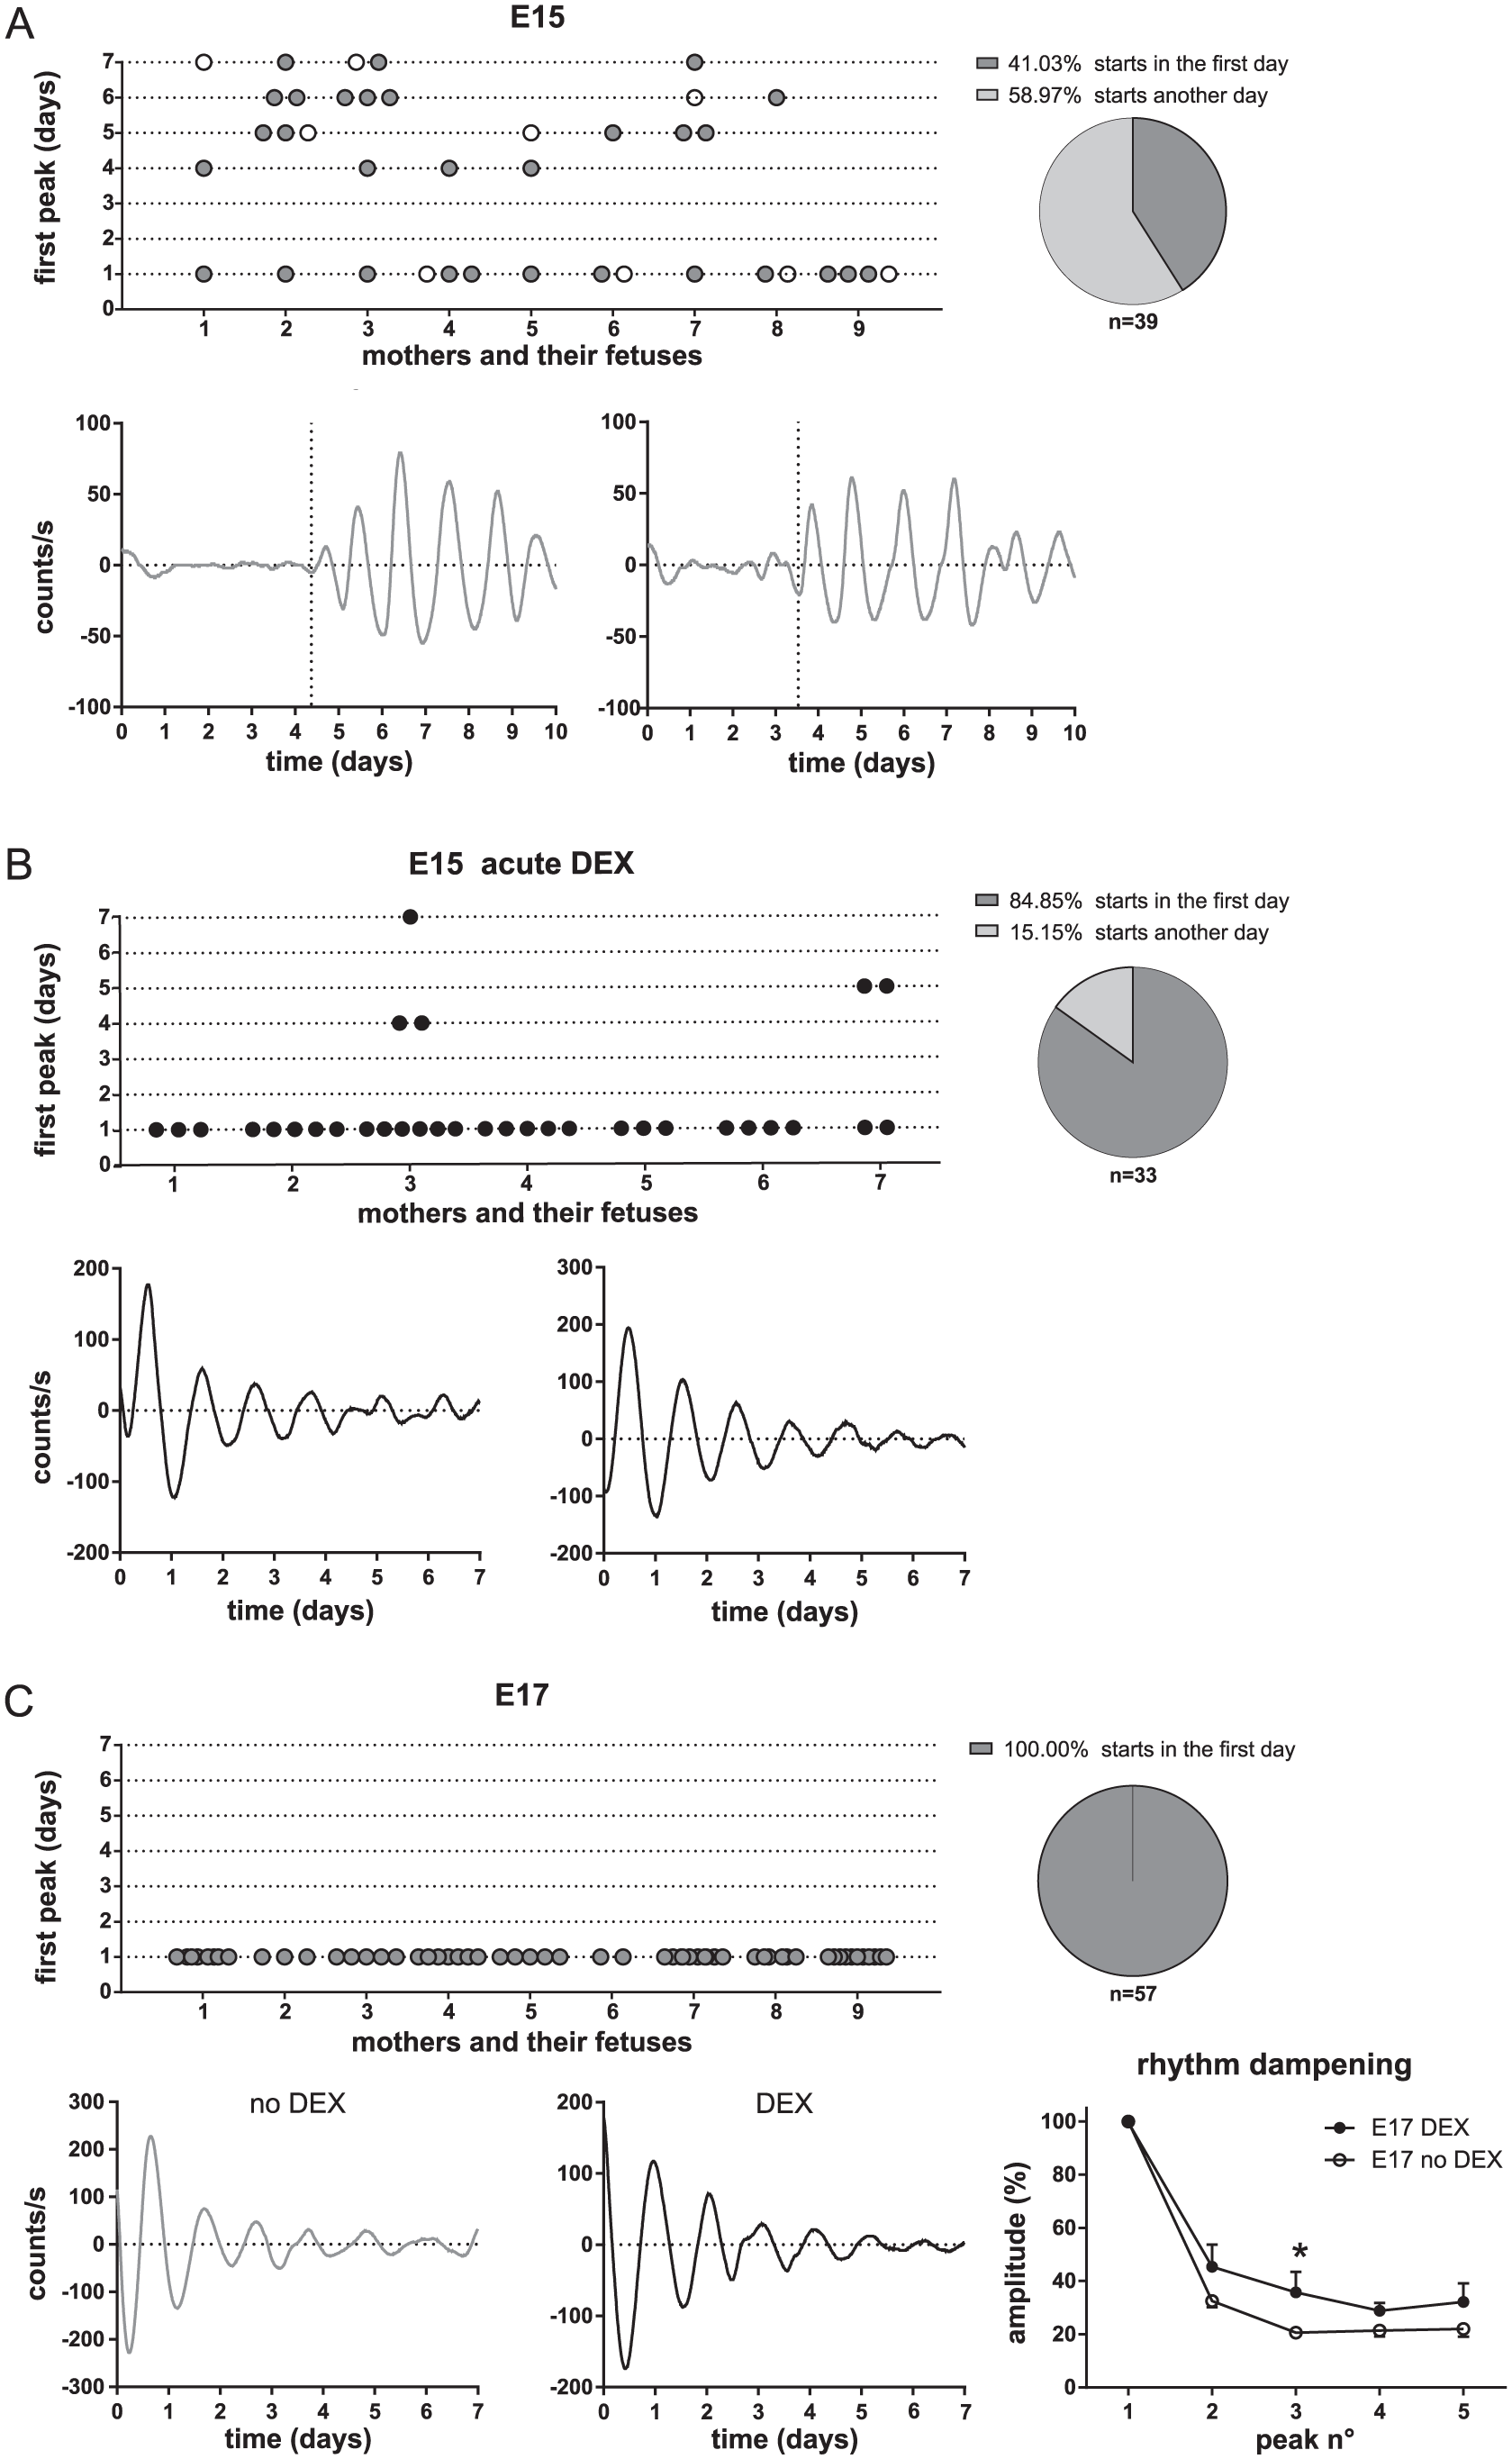
Development of bioluminescence rhythms in the fetal SCN of mPer2 Luc mice. Organotypic explants of the fetal hypothalamus, containing the SCN, were collected (A) from 9 mothers at embryonic day (E)15 and cultured in media without DEX (2 representative traces of bioluminescence are shown). The day of the first appearance of rhythm (vertical dotted line in the representative traces) in each individual fetal explant, sorted according to litters, is plotted. The rhythmicity onset varied among fetuses from the same litter. Only 41.03% of all explants started to oscillate immediately after culture preparation. Explants prepared as the first from each litter are depicted as open circles. (B) Explants from 7 mothers at E15, as in A, were cultured in media supplemented with DEX (2 representative traces of bioluminescence are shown). Most (84.85%) of the explants started to oscillate immediately after the culture was prepared. (C) Explants from 9 mothers at E17, cultured in media without DEX (left representative trace in grey) or with DEX (right representative trace in black). All explants (100%) started to oscillate immediately after culture preparation, including those cultured in media lacking DEX. The addition of DEX exerted a protective effect on the dampening of the rhythm (mean ± SEM, *P = 0.0255). Representative traces were baseline-subtracted for clarity.
Next, other E15 explants obtained from 7 mothers (n = 33) were cultured in media containing DEX immediately after setting up the culture (Fig. 4B). In contrast to the controls, almost all E15 SCN explants (84.85%) in the DEX-treated group started to oscillate immediately upon culture preparation (Fig. 4B), including all explants prepared from the litters of 5 mothers (Nos. 1, 2, 4, 5, and 6), 6 of 9 explants from one mother (No. 3), and 2 of 4 explants from another mother (No. 7).
In contrast to E15, fetal SCN explants prepared at E17 from 9 pregnant mice (n = 57) were all rhythmic (100%) immediately after preparing the culture in the absence of DEX (Fig. 4C). Nevertheless, the addition of DEX to the media of the E17 explants seemed to exert a positive effect on the persistence of their rhythms because their amplitudes exhibited slower dampening than explants cultured in the absence of DEX (2-way ANOVA; time: P < 0.0001, F(4, 115) = 144.0; group: P = 0.0002, F(1, 115) = 14.58; interaction, P = 0.2824, F(4, 115) = 1.2790; 3rd peak: P = 0.0255).
These results demonstrate that, when explanted at E15, hypothalamic tissue containing the fetal mouse SCN clock spontaneously develops rhythmicity in vitro. In the absence of DEX, the dynamics of develo-pment exhibit great inter-individual variability among individual fetuses from the same litter. The presence of DEX accelerates the development and persistence of rhythms in vitro.
Clocks in the Fetal Explants Are Entrained by DEX Treatments In Vitro
In subsequent experiments, we tested whether and how the fetal SCN clock in organotypic culture responds to GC. DEX administration significantly increased the amplitude of the rhythms of the E17 explants from mPer2 Luc mice, as shown in the representative records (Fig. 5A). The effect on amplitude was measured as the ratio of the amplitudes before and after treatment (unpaired t-test: P < 0.0001, t113 = 4.771) (Fig. 5B). Therefore, our next goal was to ascertain whether GCs may potentially entrain the fetal SCN clock. The period of the E17 SCN was affected differently by the VEH and DEX treatments (Fig. 5C). The period did not change significantly after VEH treatment (paired t-test: P = 0.3005, t42 = 1.048) but was significantly prolonged after DEX treatment (paired t-test: P < 0.0001, t61 = 7.372). Comparison of the mean period after both treatments confirmed lengthening of the period after DEX treatment (unpaired t-test: P = 0.0002, t115=3.866). Additionally, VEH and DEX treatments affected differently the phase of the rhythms, as evidenced by a comparison of the resulting PRCs (Fig. 5D) (for details, see the Materials and Methods). For VEH treatments (left graph, grey), the maximal phase delays occurred at times 12 to 15, whereas the maximal phase advances occurred at times 21 to 24, and the transition point between the phase advances and phase delays occurred at times 18 to 21. For DEX treatments (middle graph, black), the phase-delay portion of the PRC was the same as that for VEH; however, the maximal advances were achieved after treatment at times 15 to 18, making the transition between delays and advances steeper and shifted to an earlier phase, i.e., time 15. The binning of the phase shifts into 3-h intervals (Fig. 5D, right graph) clearly revealed that the fetal SCN clock responded differently to VEH and DEX treatments (2-way ANOVA; time: P < 0.0001, F(7, 104) = 30.16; group: P = 0.1455, F(1, 104) = 2.151, interaction: P < 0.0001, F(7, 104) = 15.82). DEX treatment specifically induced large phase advances when administered after the PER2-driven bioluminescence peak (time interval 15 to 18, P < 0.0001; time interval 18 to 21, P < 0.05). Importantly, these DEX-induced phase advances were completely blocked by explant pretreatment with MIF but not with VEH (Fig. 5E) (2-way ANOVA; time : P < 0.0001, F(1, 42) = 39.32; group: P < 0.0001, F(3, 42) = 11.17; interaction P < 0.0001, F(3, 42) = 24.97; post hoc at interval 15-18:VEH+DEX vs. MIF+DEX, P < 0.0001; VEH+DEX vs. DEX:P = 0.9997; MIF+DEX vs. VEH: P = 0.8149). Altogether, our results provide evidence that DEX entrains the circadian clock in the fetal SCN, with specific effects on both the period and phase of the clock.
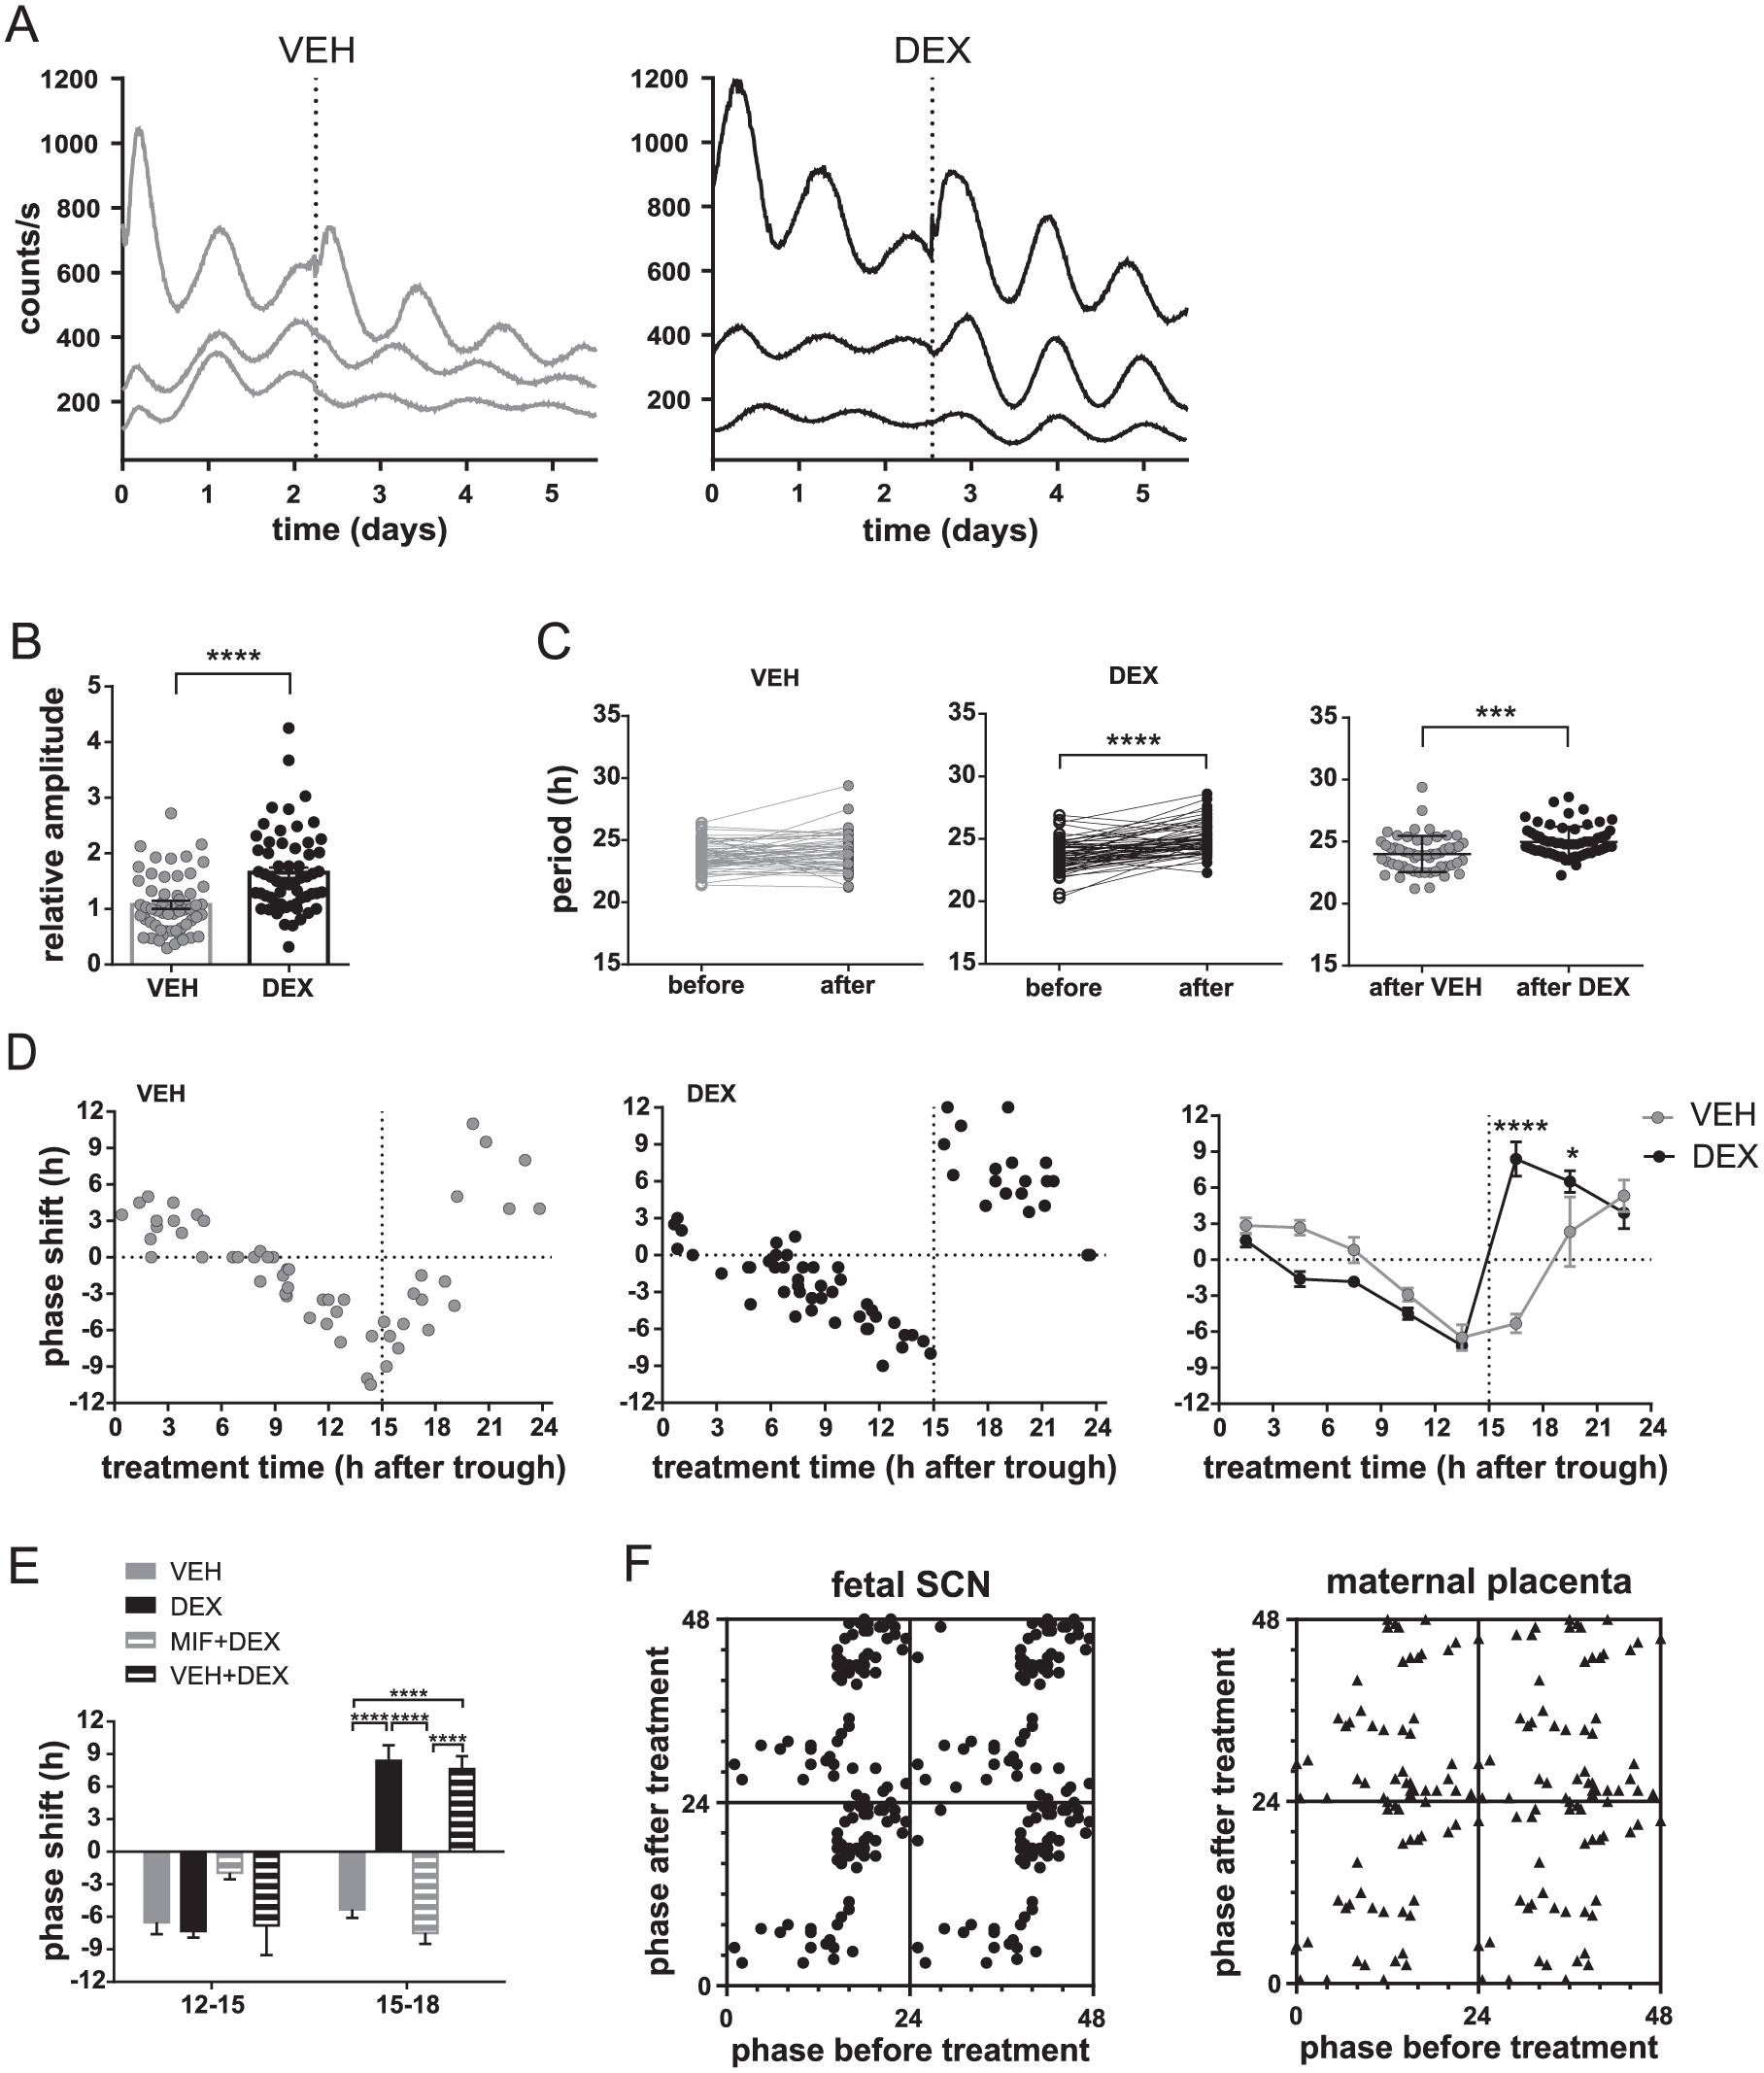
Entrainment of the circadian clock in the fetal SCN from mPer2 Luc mice at E17 by DEX treatment in vitro. (A) Representative traces of bioluminescence of the explants containing the fetal SCN recorded immediately after the cultures were prepared. The explants were treated (vertical dotted line) with VEH (grey) or DEX (black). Each trace represents one SCN explant of fetuses sampled from the same mother. (B) Effect of VEH (grey) and DEX (black) on the amplitude of the bioluminescence rhythms from the fetal SCN (n = 118). Ratios of the peak magnitudes before and after treatments were calculated (data are presented as individual ratios and mean ± SEM). ****P < 0.0001. (C) Effect of VEH (grey) and DEX (black) treatments on the period of the bioluminescence rhythms. The periods for each individual fetal SCN (n = 118) before and after VEH or DEX treatment, as well as a comparison between the periods resulting from VEH and DEX treatment, are depicted. ***P < 0.001; ****P < 0.0001. (D) Effect of VEH (grey) and DEX (black) treatments on the phase of the bioluminescence rhythms of the organotypic explants of the fetal SCN (n = 118). Data are presented as PRCs for VEH (left graph) and DEX (middle graph) treatments. Data for each treatment are presented as the magnitude of a phase shift (+ advance, − delay) produced by the treatment performed at a specific time relative to the bioluminescence peak (expressed as time 12). Additionally, a comparison of the PRCs for VEH and DEX treatments binned into 3-h intervals is shown (right graph). *P < 0.05 and ****P < 0.0001. (E) The effect of the pretreatment with MIF (MIF+DEX) or VEH (VEH+DEX) on the DEX-induced phase shifts on the bioluminescence rhythms from the fetal SCN (n = 37) assessed during the delay (time interval 12 to 15) and advance (time interval 15 to 18) portions of the PRC. ****P < 0.0001. (F) For clarity, phase-transition curves are presented to show the differences in the responses of the circadian clocks located in the fetal SCN-containing explants (left graph) and the maternal placenta explants (right graph) to DEX treatments (for more details, see Materials and Methods).
Finally, we show the PTCs for clarity and to visualize differences in DEX responses of the clocks in the fetal SCN and in the maternal placenta (Fig. 5F). As clearly shown in the PTCs, the DEX treatments administered over 24 h changed the original phases of the clocks differently in the fetal tissue and the placenta.
DEX Treatment In Vivo Differentially Alters c-Fos Expression in the Fetal SCN and in the Placenta
We examined the acute effects of DEX injections in pregnant rats at E19 on gene expression in the fetal SCN and the placenta to ascertain the sensitivity of the tissues to GC in vivo. Most (75%) of the DEX freely crosses the placenta (in contrast to cortisol) (Althaus et al., 1986) and therefore acute changes in gene expression in response to DEX treatment in vivo are expected. The pregnant rats were injected with VEH or DEX or were left intact at ZT15, and the tissues were collected at 1, 2, 4, and 8 h after injection. The time of the injection (3 h after the lights off) was selected to match the highest sensitivity of the SCN explants to DEX treatment in vitro (see Discussion for more explanation). Surprisingly, the DEX injections in pregnant rats exerted no or only minor effects on acute changes in the expression of Nr3c1, Nr1d1, Sgk1, Per1, Per2, Cry1, Avp, and Vip (data not shown), suggesting that the effect of DEX is not relayed by GC response elements (GREs) in the promoters of these genes. In contrast, we identified a significant effect of DEX injections on the expression of the immediate early gene c-fos in the fetal SCN and both parts of the placenta (Fig. 6). Compared with the untreated controls, the VEH treatment itself did not alter c-fos expression in any of the tested tissues at any time point, but DEX treatment significantly downregulated the levels of c-fos mRNA in the fetal SCN (2-way ANOVA, treatment: F(2, 45) = 27.39; P < 0.0001; post hoc: 1 h, P = 0.0027; 2 h, P < 0.0001; 4 h, P = 0.0083), and upregulated the levels in the maternal placenta (2-way ANOVA, treatment: F(2, 46) = 59.83, P < 0.0001; post hoc: 1 h, P = 0.0008; 2 h, P = 0.0035; 4 h, P < 0.0001; 8 h, P < 0.0001) and the fetal placenta (2-way ANOVA, treatment: F(2, 48) = 210.6, P < 0.0001; post hoc: 1 h, P < 0.0001; 2 h, P < 0.0001; 4 h, P < 0.0001; 8 h, P < 0.0001). Therefore, DEX exerted opposite effects on c-fos expression in the fetal SCN compared with both parts of the placenta.
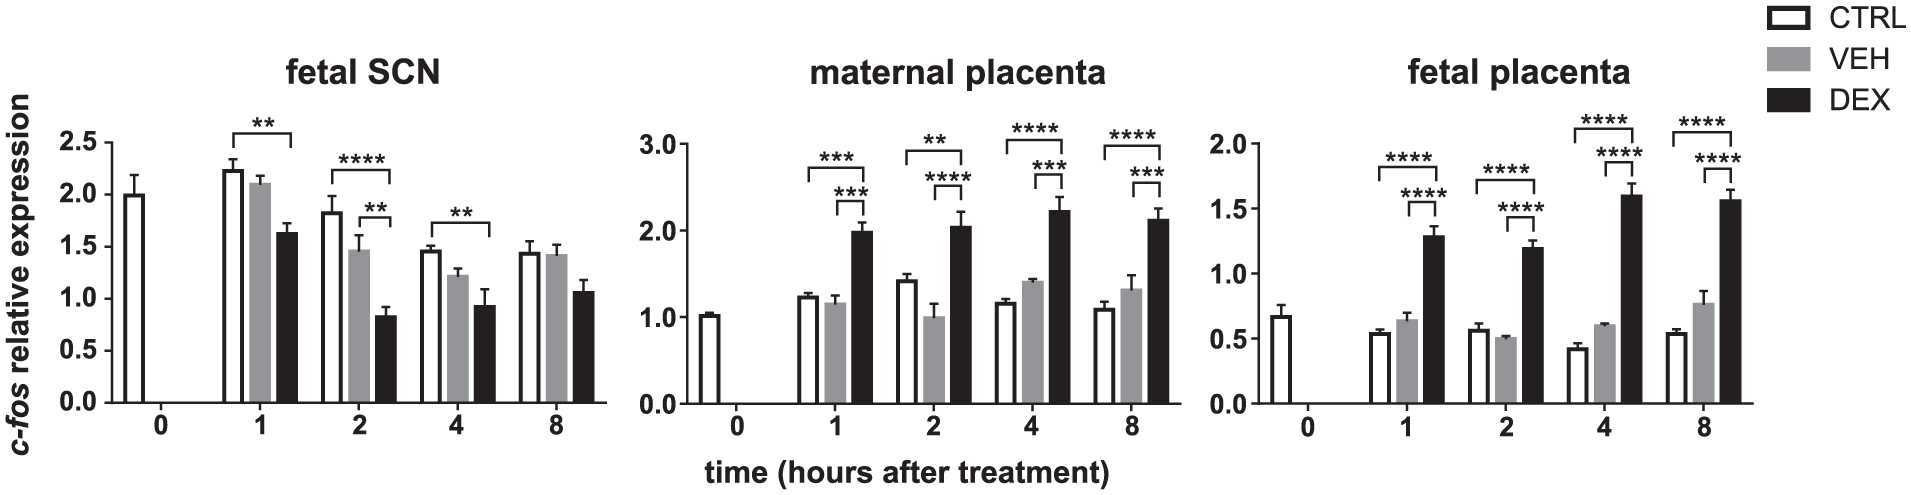
Effect of DEX injected into pregnant rats on c-fos expression in the fetal SCN and placenta. Pregnant rats at gestational age E19 maintained on a 12-12 LD cycle were left intact (open bars) or injected with VEH (grey bars) or DEX (black bars) at ZT15 (3 h after lights off). The expression of c-fos was determined in samples of the laser-dissected fetal SCN (n = 5 embryos from one mother per each time point) (left graph), the maternal part of the placenta (middle graph), and the fetal part of the placenta (right graph) (n = 5 placentas from one mother per each time point). The samples were collected at the time of treatment (0 h) and then at 1, 2, 4, and 8 h after injections of VEH or DEX, and in intact animals at the corresponding time points. **P = 0.01, ***P = 0.001, and ****P = 0.0001.
Discussion
Our results provide the first evidence that the fetal SCN can sense GC signals and potentially use them as maternal entraining cues. This mechanism has not been considered before because the SCN of adult animals is almost insensitive to GCs. Evidence for this effect is based on a series of our findings showing that 1) the placenta may rhythmically regulate GC levels reaching the fetus; 2) GC receptors are rhythmically expressed in the laser-dissected fetal SCN tissue; 3) GCs accelerate the spontaneous development of the fetal SCN clock in vitro; 4) GCs entrain the clock in hypothalamic explants containing the fetal SCN in vitro; and 5) GCs induce acute changes in c-fos expression within the laser-dissected fetal SCN.
A first prerequisite for testing the hypothesis that maternal GC may affect the fetal SCN clock is that the placental barrier controlling local GC metabolism, through GC conversion from active to inactive forms, rhythmically modulates the maternal GC signal reaching the fetus. The clock in the placenta has previously been studied using in vivo approaches and rather contradictory results have been reported, depending on which part of the placenta and which clock genes were examined (Papacleovoulou et al., 2017; Wharfe et al., 2011; Waddell et al., 2012). In our study, separation between the fetal and maternal parts revealed that both parts of the rat placenta exhibited in vivo circadian rhythms in the expression of Nr1d1 and Per2, but not Per1 or Bmal1. Importantly, using an in vitro approach, we monitored clock-driven bioluminescence in organotypic explants of the mouse placenta and confirmed robust autonomous rhythmicity only in the maternal part of the placenta, whereas the fetal part did not exhibit persistent rhythmicity. This shows that the fetal part, which is derived from fetal tissue, cannot sustain autonomous rhythmicity. We found that, in the maternal part of the rat placenta, the expression of Hsd11b2, the gene encoding the enzyme HSD2, which is involved in placental barrier function, also exhibits daily variation. The Hsd11b2 mRNA levels were elevated during the late night in accordance with the time at which low maternal levels were observed (Crew et al., 2016). Therefore, the presumed rhythm in HSD2 activity might provide temporal control for the maternal GC levels passing through the placenta, and may serve as a potential mechanism preventing undesirable influx of excess GCs to the embryo at an improper time of day. This is especially important during the pre-parturition period when the overall maternal GC levels in rats are elevated (Waddell and Atkinson, 1994; Wharfe et al., 2016), and passage of GCs through the placenta increases toward term (Burton and Waddell, 1999; Mark et al., 2009). We found that GC receptors are expressed in both parts of the placenta, and GCs may reset the clock in the organotypic explants of the maternal placenta in vitro. Although the placental clock responded to the treatment procedure per se, the DEX treatments induced specific phase shifts during the interval of insensitivity to the treatment procedure. Moreover, the shifts were completely blocked by the GC receptor antagonist mifepristone. Therefore, changes in GC levels may reset the placental clock and, consequently, temporally adjust the efficiency of the placental barrier.
A second premise for the tested hypothesis about GC-mediated entrainment of the fetal SCN clock is the presence of GC receptors in the fetal SCN. We show that GC receptors are expressed in the fetal rat and mouse SCN, and Nr3c1 expression exhibits a shallow, but significant, circadian variation, with a nadir occurring during the late subjective day and a peak occurring during the late subjective night. This rhythm is in opposite phase to the previously detected rhythm in GC levels of the fetal plasma, where it lags behind the maternal GC rhythm (Crew et al., 2016; Torres-Farfan et al., 2011), and may thus represent a compensatory response operating at the fetal SCN level. Interestingly, the SCN rhythm is also opposite in phase to the previously described rhythm in Nr3c1 expression in the fetal hippocampus (Vilches et al., 2014), which corresponds to mutual phasing between these clocks in adults (Wang et al., 2009).
All of the above-mentioned findings provide a rationale for exploring the fetal SCN clock’s sensitivity to rhythmic GC signals. For the first time, we report a role for GCs in the spontaneous development of the onset of rhythmicity of the fetal SCN clock. By examining the appearance of the bioluminescence rhythm in organotypic explants containing the SCN, we found that, in contrast to previous findings (Carmona-Alcocer et al., 2018), the fetal mouse SCN (which was arrhythmic immediately after explanting at E15) spontaneously begins to oscillate after several days of culture in vitro. The rhythms develop spontaneously with dynamics that vary substantially among individual fetuses from the same litter. Importantly, this process is significantly accelerated in the presence of DEX in the culture media. The hypothesis that GCs serve as important factors contributing to the development of the fetal circadian clock is physiologically relevant with regard to elevation in their absolute levels in the maternal plasma during the pre-parturition period (Wharfe et al., 2016).
Additionally, in the present study, GCs not only played a role in the development of the fetal SCN clock but also entrained the clock. The E17 SCN explants cultured in media without DEX exhibited rhythms with dispersed periods, and the addition of DEX significantly affected both the period and phase of the rhythm, providing evidence for an entraining effect on the fetal clock. Importantly, the PRC for the fetal SCN was significantly different from the PRC for DEX-treated placental explants. Notably—and consistent with previous data (Nishide et al., 2008)—we confirm that the fetal SCN in culture is highly sensitive to the treatment procedure per se. Similar to a previous report (Nishide et al., 2008), administration of the VEH itself produced phase-dependent shifts in the fetal SCN clock. The mechanism underlying these effects remains unclear, but mild temperature changes and stirring of the medium may have contributed to the response. Likely, the structural immaturity of the fetal SCN clock lacking synaptic connections among the individual oscillating neurons causes its poor resilience to subtle changes in the microenvironment. Most importantly, DEX surpassed the non-specific effects of the treatment procedure, specifically at the phase-advancing portion of the PRC, and mifepristone completely blocked these advance shifts. The DEX-induced PRC for the fetal SCN clock displayed a similar shape to the PRC for the maternal placenta, but it was delayed by approximately 3 h. An approximation of the “in vitro time” into the “in vivo time” for the fetal tissue is difficult, but if the phase of the fetal clock corresponds to that of the adult SCN, as we demonstrated in vivo (Sládek et al., 2004), then the peak of the PER2 protein levels (peak in bioluminescence) should correspond to the beginning of subjective night (Shearman et al., 1997), which coincides with the lowest GC levels in the fetal plasma (Crew et al., 2016). The shape of the PRC thus suggests that the fetal SCN clock is most sensitive to resetting only when the GC levels are elevated during the daytime when they should be minimal in the fetal plasma. It is highly unlikely that the observed rhythmicity and the effect of DEX were related to regions outside the fetal SCN in our organotypic explants because no significant rhythms outside the SCN in the close surrounding hypothalamic areas were detected at E17 (Carmona-Alcocer et al., 2018). In support of this result, our recent study showed that the SCN clock of neonatal pups contains GC receptors and is also sensitive to stress-induced elevations in GCs (Olejníková et al., 2018).
The mechanism underlying the effect of GCs on the immature SCN clock remains unclear. Our data rather exclude GRE-mediated transcriptional activation and support a nongenomic mechanism for the DEX-induced effects on the studied circadian clock genes. GC receptors can alter the binding of other transcription factors to DNA (Ratman et al., 2013). They interact with cAMP response element-binding protein (CREB) (Imai et al., 1993) and promote CREB binding to DNA (Haas and Pitot, 1999). Consistent with these observations, we detected significant acute changes in c-fos expression, indicating the plausible involvement of the CREB-related regulatory pathways in these DEX-induced effects. Interestingly, c-fos is among the first rhythmically regulated genes detectable in the fetal SCN in vivo (Houdek and Sumová, 2014) and, therefore, the DEX-induced changes in c-fos expression may suggest a plausible mechanism for the interaction between DEX and the fetal clock. Additionally, GCs were previously shown to elicit opposite effects on gene expression in the placenta and the hypothalamus (paraventricular nuclei), which was explained by structural differences in CRE-binding complexes in gene promoters of these tissues (King and Nicholson, 2007). Future studies examining the effects of GCs on transcriptional complexes regulating c-fos expression may facilitate our understanding of the mechanism of fetal circadian clock entrainment.
Footnotes
Acknowledgements
The authors thank Mrs. Eva Suchanová for her technical assistance with the preparation of fetal organotypic explants. The study was supported by the Czech Science Foundation grant 16-03932S (to AS), the OPPK BrainView CZ.2.16/3.1.00/21544 and the Research Project RV0: 67985823.
Conflict of Interest Statement
The author(s) have no potential conflicts of interest with respect to the research, authorship, and/or publication of this article.