
Abstract
Whereas long-period temporal structures in endocrine dynamics have been well studied, endocrine rhythms on the scale of hours are relatively unexplored. The study of these ultradian rhythms (URs) has remained nascent, in part, because a theoretical framework unifying ultradian patterns across systems has not been established. The present overview proposes a conceptual coupled oscillator network model of URs in which oscillating hormonal outputs, or nodes, are connected by edges representing the strength of node-node coupling. We propose that variable-strength coupling exists both within and across classic hormonal axes. Because coupled oscillators synchronize, such a model implies that changes across hormonal systems could be inferred by surveying accessible nodes in the network. This implication would at once simplify the study of URs and open new avenues of exploration into conditions affecting coupling. In support of this proposed framework, we review mammalian evidence for (1) URs of the gut-brain axis and the hypothalamo-pituitary-thyroid, -adrenal, and -gonadal axes, (2) UR coupling within and across these axes; and (3) the relation of these URs to body temperature. URs across these systems exhibit behavior broadly consistent with a coupled oscillator network, maintaining both consistent URs and coupling within and across axes. This model may aid the exploration of mammalian physiology at high temporal resolution and improve the understanding of endocrine system dynamics within individuals.
The “what” of endocrinology, or the study of central and peripheral endocrine factors and their genesis, has a long history of systematic investigation from the organismal to the molecular scales. In contrast, the temporal dynamics of hormonal secretions, or the “when” of endocrinology, is not defined with comparable precision. Endocrine activity varies across infradian (>1 day), circadian (~1 day), and ultradian (<1 day) timescales, with the majority of scientific investigation focused on understanding the longer 2 periodicities. Examination of infradian and circadian endocrine rhythms has advanced our understanding of basic physiology by providing temporal structures that explain substantial variance of measured outputs within and among individuals. This knowledge has facilitated translational breakthroughs, exemplified by personalized chronotherapy, for example, in which the timing of pharmaceutical administration is aligned to the patient’s circadian peak of receptivity to treatment (Giacchetti et al., 2006; Lévi et al., 2010). Whereas ultradian variation also provides clinically relevant information (Hompes et al., 1992; Sturis et al., 1992) and has long been suggested to be central to mammalian physiology (Brandenberger et al., 1987; Lloyd, 1992; Miyata et al., 2016; Veldhuis et al., 2008), there is no single accepted systems-level framework to unify the study of ultradian rhythms (URs) at the organismal level (Bashan et al., 2012; Bourguignon and Storch, 2017; Prendergast and Zucker, 2016). Because of the absence of a unifying framework, as well as the technical challenges of measuring endocrine systems at ultradian timescales, circadian studies outnumber ultradian studies nearly 32:1 (Landgraf et al., 2014; Prendergast and Zucker, 2016). In the present overview, we propose a framework to aid future investigation of URs within individuals based on the notion that crosstalk among hormonal systems is predictably organized. Through researchers working across disciplines to further understand this level of organization, such knowledge of URs can help guide research, predictive medicine, and clinical interventions in much the same way as has knowledge of circadian rhythms.
Overview and Implications of a Coupled Oscillator Network Model of URs
Circadian rhythms exhibit coupled oscillator behavior (Feillet et al., 2014; Hannay et al., 2015; Stoleru et al., 2004), driving independent oscillators to a stable phase relationship (Komarov and Pikovsky, 2015). We propose that this principle likely applies to URs across endocrine axes. Two criteria must be met for a coupled oscillator, ultradian, endocrine network to exist: 1) in unmanipulated organisms, URs appear across endocrine systems, and 2) URs exhibit the physiological substrate for, or direct evidence of, coupling. The present overview outlines evidence for both of these requirements with examples from canonical endocrine axes: the gut-brain axis (GBA) and the hypothalamic-pituitary-thyroid (HPT), -adrenal (HPA), and -gonadal (HPG) axes (Fig. 1). These systems regulate a range of core processes, including energy acquisition (GBA), allocation (HPT), production and maintenance of gametes (HPG), and arousal (HPA), providing important functional significance for networked URs. We first provide evidence that nodes within these axes exhibit ultradian oscillations by reviewing findings that illustrate the presence of the most common periodicities of UR (i.e., 1-4 h). We then review evidence for coupling across endocrine axes through neural and hormonal signaling (Laferrère et al., 2006). A comprehensive summary of ultradian oscillations in these axes is available in Table 1. Furthermore, we present evidence that body temperature shapes, and is shaped by, URs across endocrine axes, providing a highly tractable measure of inter-UR coupling (i.e., a tightly coupled network manifests as high-amplitude body temperature URs). Finally, we conclude with a consideration of translational implications for personalized, predictive medicine.
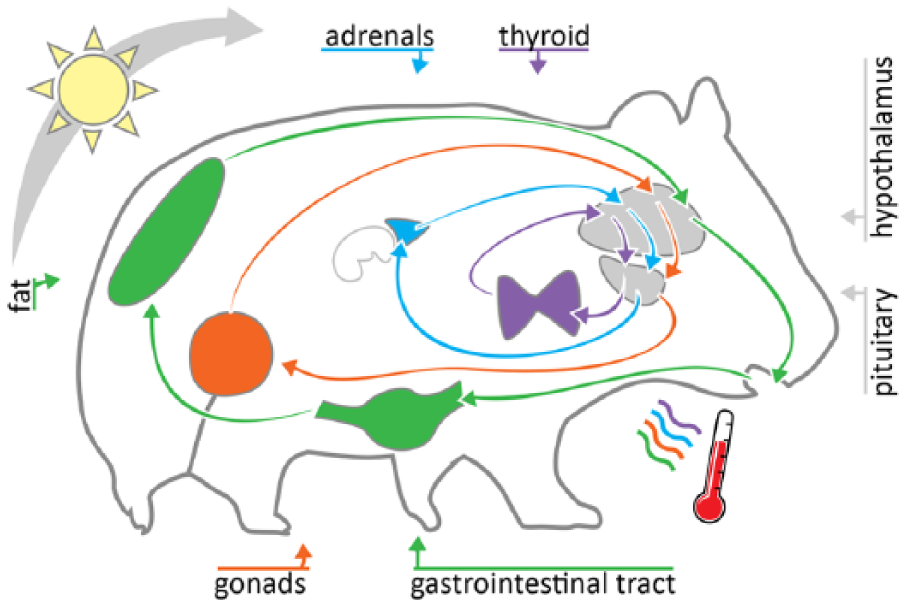
Canonical axes in mammalian physiology exhibit 1- to 4-h ultradian rhythms. The hypothalamus and pituitary (HP) coordinate feedback loops across physiological systems. The gut-brain axis influences feeding and digestion, the HP-thyroid axis influences metabolism, the HP-adrenal axis regulates the arousal and stress responses, and the HP-gonadal axis regulates reproductive function. The 1- to 4-h ultradian rhythms occur in outputs of each of these axes, are coupled within and among axes, and modulate body temperature output.
Characteristics of endocrine ultradian rhythms.
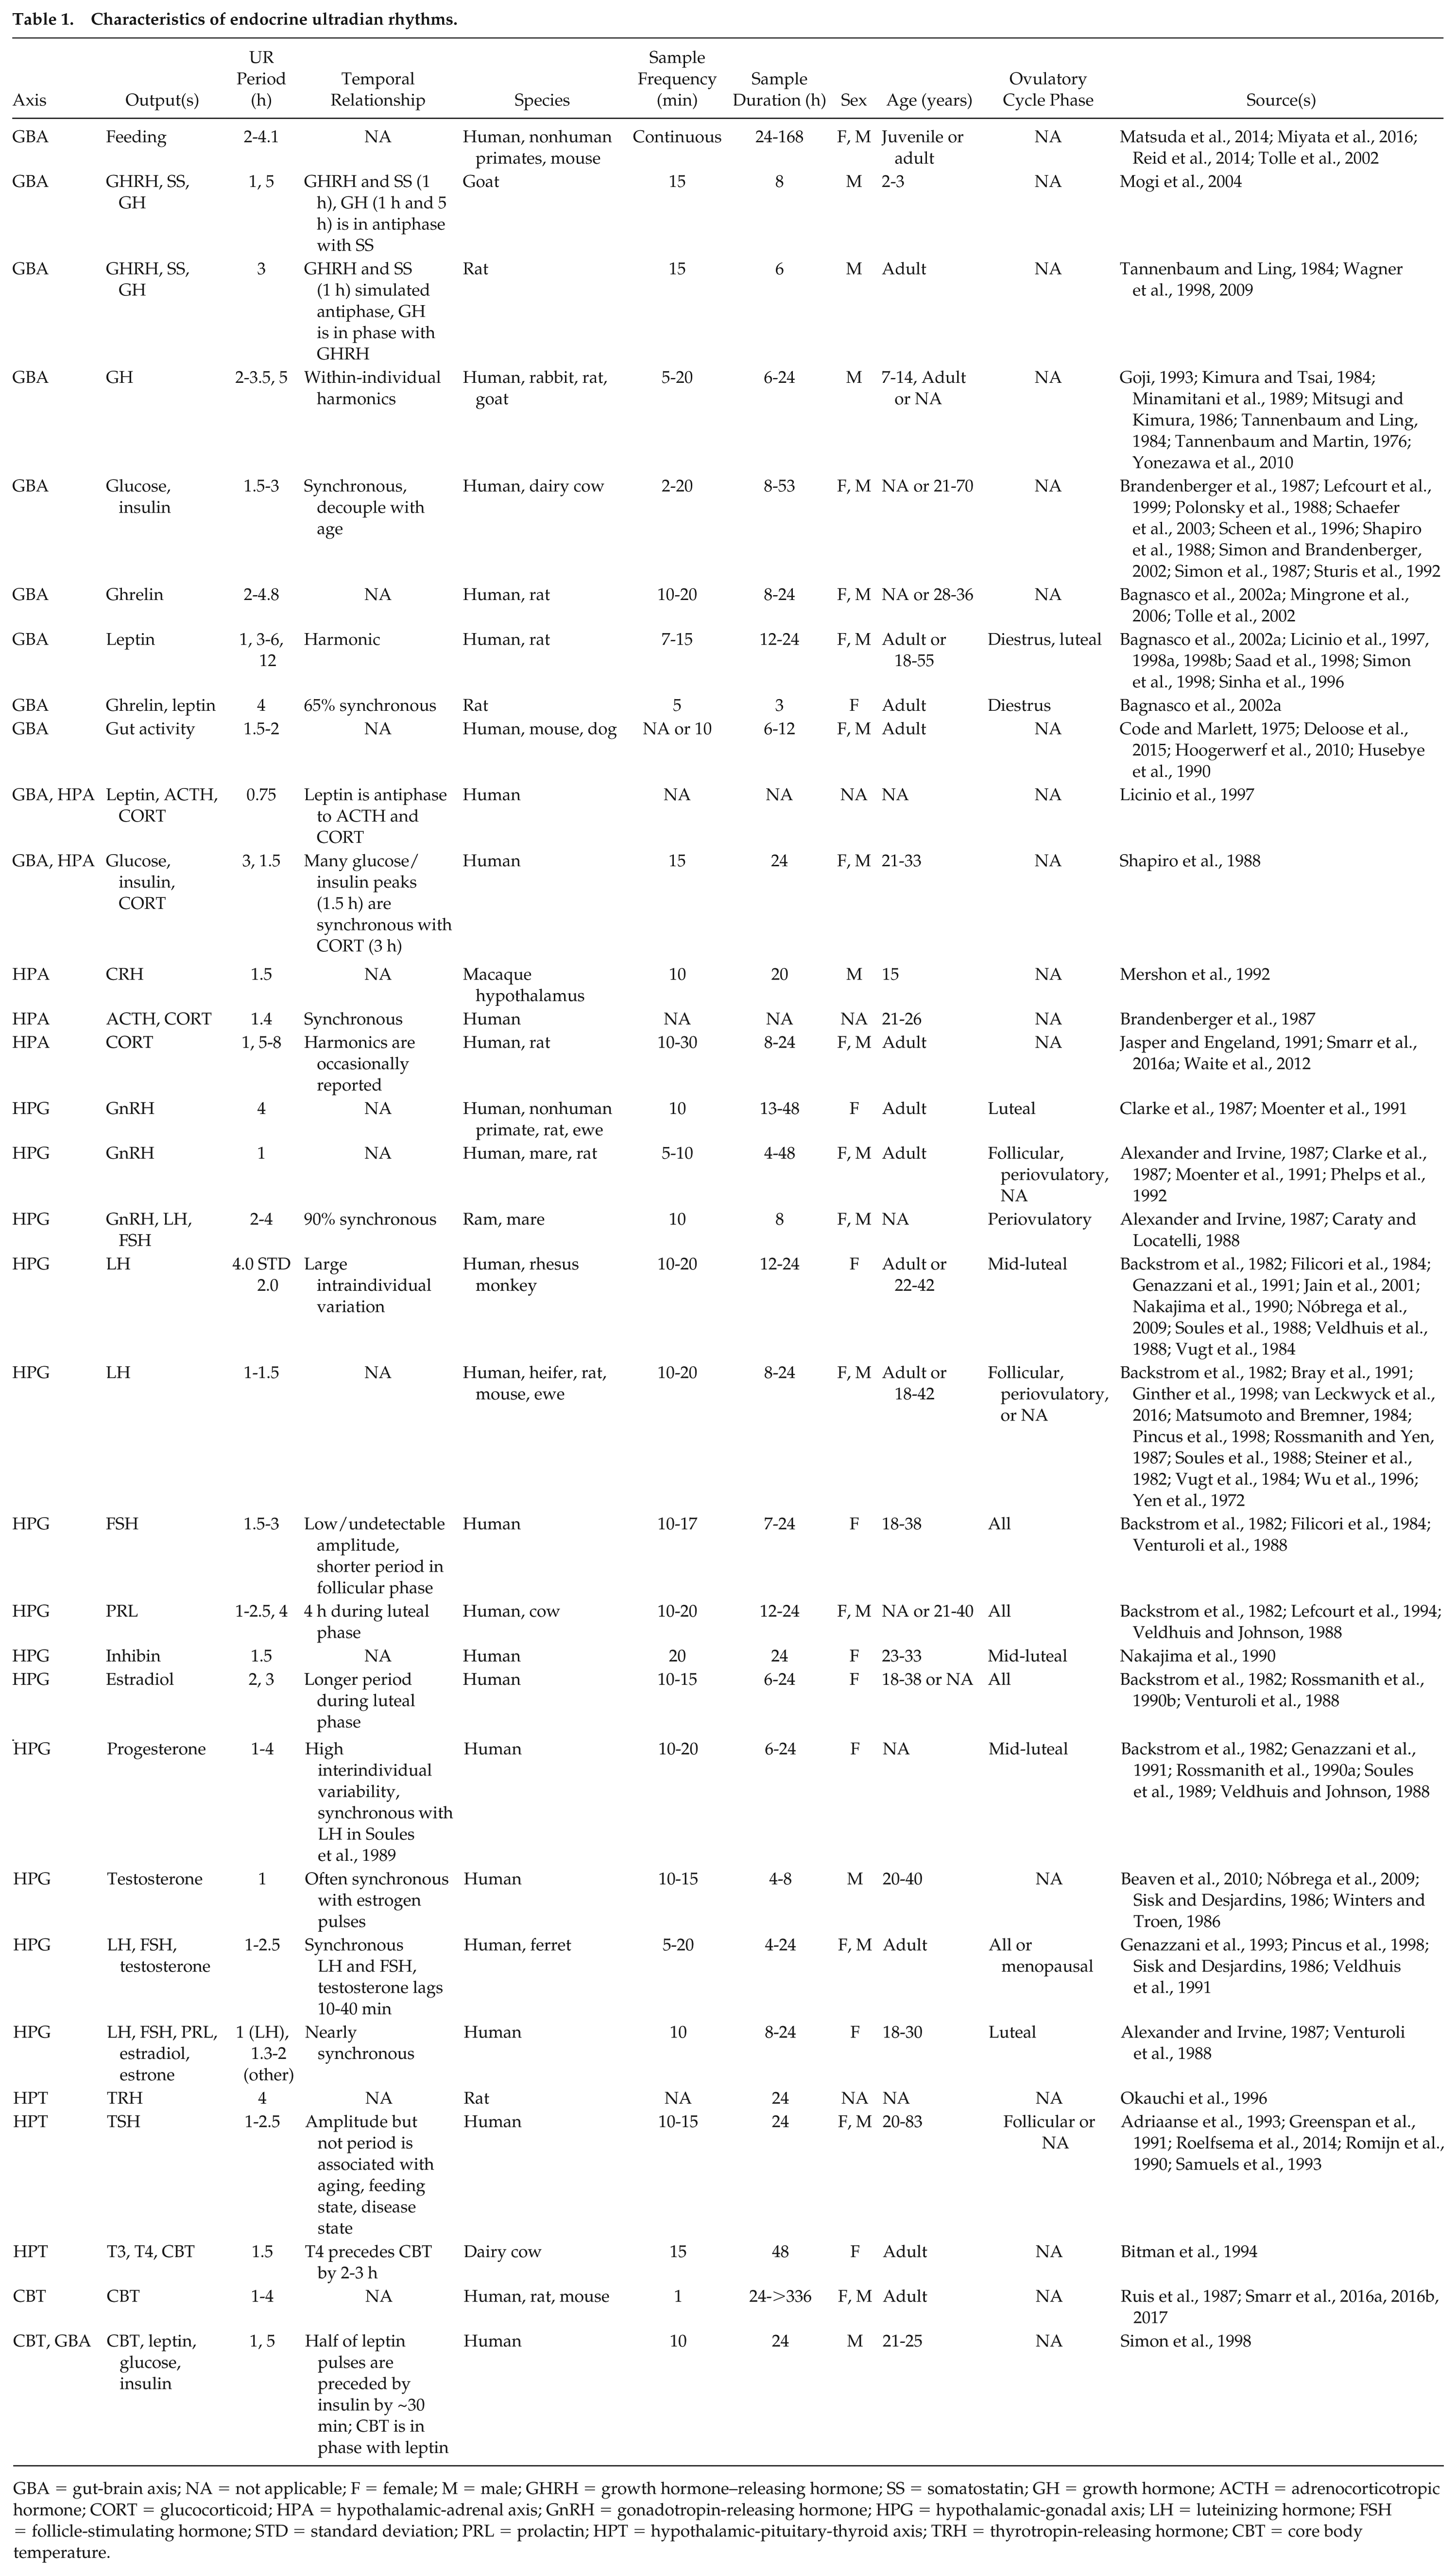
GBA = gut-brain axis; NA = not applicable; F = female; M = male; GHRH = growth hormone–releasing hormone; SS = somatostatin; GH = growth hormone; ACTH = adrenocorticotropic hormone; CORT = glucocorticoid; HPA = hypothalamic-adrenal axis; GnRH = gonadotropin-releasing hormone; HPG = hypothalamic-gonadal axis; LH = luteinizing hormone; FSH = follicle-stimulating hormone; STD = standard deviation; PRL = prolactin; HPT = hypothalamic-pituitary-thyroid axis; TRH = thyrotropin-releasing hormone; CBT = core body temperature.
URs and Coupling Within Endocrine Axes
URs and Coupling within the GBA
In the present overview, the GBA is defined as neural and hormonal signaling among the brain, gastrointestinal tract, and supporting organs that mediate functions from food-seeking behavior to digestion and elimination (Collins and Bercik, 2009; Pigrau et al., 2016). Hunger, food consumption, satiety, and digestion display URs in mammals (Matsuda et al., 2014; Miyata et al., 2016; Reid et al., 2014), with most hormones involved exhibiting coupled URs with periods (τ) ranging from 1 to 4 h. Two hormones, the orexigenic and anorexigenic peptides ghrelin and leptin (Avau et al., 2013; García-García et al., 2014; Miyata et al., 2016), respectively, provide a temporal link among hormonal and organ URs in the GBA. Ghrelin (García-García et al., 2014; Mingrone et al., 2006) and leptin (Licinio et al., 1998b, 1998a; Saad et al., 1998; Simon et al., 1998; Sinha et al., 1996) exhibit URs, most often with τ = 1 to 5 h in humans and rodents; in rodents, pulses of these hormones often occur within minutes of one another (Bagnasco et al., 2002a; Kalra et al., 2003; Otukonyong et al., 2005). In addition, ghrelin URs couple to 1- to 5-h URs in the growth hormone axis (Goji, 1993; Minamitani et al., 1989; Mitsugi and Kimura, 1986; Mogi et al., 2004; Tannenbaum et al., 2003; Tannenbaum and Ling, 1984; Tolle et al., 2002; Wagner et al., 2009, 1998; Yonezawa et al., 2010), ghrelin and leptin to ~3-h URs in glucose and insulin in the fed state (Brandenberger et al., 1987; Lefcourt et al., 1999; Otukonyong et al., 2005; Poher et al., 2018; Polonsky et al., 1988; Sinha et al., 1996; Thaela et al., 1998; Tolle et al., 2002). In addition, 2- to 8-h URs in intestinal activity (Ariga et al., 2007; Code and Marlett, 1975; Deloose et al., 2012, 2015; Fujino et al., 2003; Hoogerwerf, 2010; Husebye et al., 1990; Masuda et al., 2000; Zheng et al., 2009) can be initiated by administration of ghrelin or the related peptide motilin. In rats, plasma ghrelin and leptin and, in humans, glucose and insulin URs occur both in fed and fasted conditions (Bagnasco et al., 2002b; Schaefer et al., 2003; Scheen et al., 1996; Shapiro et al., 1988; Simon et al., 1987; Simon et al., 1998; Simon and Brandenberger, 2002; Sturis et al., 1992), suggesting that these rhythms are not only food entrained but also endogenously maintained.
Although interindividual variability makes clear that multiple stable states of varying periodicity exist, the periodicities and phase alignments of GBA components provide compelling evidence for a temporally organized GBA network structure on an ultradian timescale. Considering results across studies in humans and rats, ghrelin, leptin, and growth hormone oscillate approximately in phase with the most common τ = ~1 and 3 h (Bagnasco et al., 2002b; Goji, 1993; Kimura and Tsai, 1984; Licinio et al., 1998a, 1998b; Mingrone et al., 2006; Sinha et al., 1996; Tannenbaum and Martin, 1976; Tolle et al., 2002). Approximately antiphase to these 3 hormones (Licinio et al., 1997; Shapiro et al., 1988), glucose and insulin oscillate in near synchrony with τ = 1.5 to 3 h (Polonsky et al., 1988a; Scheen et al., 1996; Simon et al., 1987). At the harmonic circhoral (rhythms of ~1 h), hypothalamic growth hormone–releasing hormone (GHRH) oscillates in phase with ghrelin/leptin and growth hormone (Mogi et al., 2004; Tannenbaum and Ling, 1984).
URs and Coupling within the HPT Axis
The HPT axis is responsible for regulating metabolism. Hypothalamic release of thyrotropin-releasing hormone (TRH) into the hypophyseal portal system stimulates production and release of thyroid-stimulating hormone (TSH) from the pituitary. TSH stimulates production of thyroid hormones from the thyroid gland. Thyroid hormones are initially produced as thyroglobulin, which is converted primarily to thyroxine (T4). T4 is considered inactive and is the most abundant thyroid hormone in circulation. T4 can be converted into the active thyroid hormone, triiodothyronine (T3). T3 is present in relatively low quantities in circulation.
Although data about HPT axis function at high temporal resolution in unmanipulated animals are limited, elements of the HPT axis show URs with τ = 1 to 5 h (Buff et al., 2007; Roelfsema et al., 2014; Romijn et al., 1990). To our knowledge, the only high temporal resolution TRH study reports ultradian release with τ = 3 to 5 h in male rats (Okauchi et al., 1996). TSH, however, consistently oscillates in circulation with τ = 1 to 4 h in mammals (Adriaanse et al., 1993; Buff et al., 2007; Cauter, 2004; Greenspan et al., 1986, 1991; Guyot et al., 2007; Jansen et al., 2015; Joustra et al., 2016; Keenan et al., 2003; MacCagnan et al., 1999; Roelfsema et al., 2014; Romijn et al., 1990; Rookh et al., 1979; Samuels et al., 1993; Stewart et al., 1994; Veldhuis et al., 1990). Some studies in dairy cows and humans also show ultradian T3/T4 release with ~1.5-h URs (Bitman et al., 1994; Russell et al., 2008). Given strong associations between plasma concentrations of TSH and T3 in humans (Jansen et al., 2015; Russell et al., 2008), it is possible that TSH oscillates with double the period of T3/T4, therefore using a harmonic to retain a stable phase relationship over many cycles.
URs and Coupling within the HPA Axis
The HPA axis regulates arousal under normal conditions and promotes rapid availability of stored energy in response to acute challenges (e.g., predation or fasting). Hypothalamic release of corticotropin-releasing hormone (CRH) stimulates release of adrenocorticotropic hormone (ACTH). In systemic circulation, ACTH acts on the adrenal cortex to stimulate glucocorticoid (CORT) release. CORT acts broadly within the body and generates negative feedback at both the hypothalamus and the pituitary to inhibit its own production. The 1.5- to 3-h URs in CRH neuron excitation and CRH release have been observed in rodents, rams, and macaque hypothalamus but not extensively characterized (Caraty et al., 1988; Ixart et al., 1991; Mershon et al., 1992; Ono et al., 2015; Vrang et al., 1995). As one would expect, ACTH and CORT release show URs and are highly synchronized (τ = ~2-3 h; Brandenberger et al., 1987; Dallman et al., 1987; Henley et al., 2009; Jasper and Engeland, 1991; Lightman and Conway-Campbell, 2010; Smarr et al., 2016a; Spencer and Deak, 2017; Spiga et al., 2011, 2014; Waite et al., 2012). Stable CORT URs likely impose periodic inhibition on CRH neurons through negative feedback regulation, perpetuating ultradian output within the axis (Watts, 2005).
URs and Coupling within the HPG Axis
The HPG axis controls reproduction, including the generation and maintenance of gametes and the appropriate expression of sexual behavior. Release of hypothalamic gonadotropin-releasing hormone (GnRH) triggers the release of the gonadotropins, luteinizing hormone (LH) and follicle-stimulating hormone (FSH). LH and FSH then stimulate sex steroid (i.e., estradiol, progesterone, and testosterone) synthesis in the gonads. These sex steroids feed back onto the HPG axis to regulate GnRH and the gonadotropins. As with other axes described, HPG axis URs appear to be coordinated with predictable changes in UR features across the axis based on the time of the ovulatory cycle in females.
GnRH release (Caraty and Locatelli, 1988; Clarke et al., 1987; Gore et al., 2004; Grattan et al., 1995; Levine and Ramirez, 1982; Meredith and Levine, 1992; Moenter et al., 1991; Phelps et al., 1992; Ramirez et al., 1991) and LH (Alexander and Irvine, 1987; Ar, 1985; Backstrom et al., 1982; Ben Jebara et al., 1994; Caraty and Locatelli, 1988; Czieselsky et al., 2016; Ellis and Desjardins, 1984; Evans et al., 1979; Ginther et al., 1998; Hodges, 1978; Irvine and Alexander, 1994; Jain et al., 2007; Joustra et al., 2016; Levine and Ramirez, 1982; Luboshitzky et al., 1996; Matsumoto and Bremner, 1984; Mulligan et al., 1995; Nordéus et al., 2012; Rossmanith et al., 1990b; Sisk and Desjardins, 1986; Soules et al., 1988, 1989; Steiner et al., 1982; Urban et al., 1988; van Leckwyck et al., 2016; Veldhuis et al., 1988; Vugt et al., 1984; Wu et al., 1996) oscillates with τ = ~ 1 to 4 h in both sexes, and these pulses are consistently coupled, within minutes within individuals (Alexander and Irvine, 1987; Bergendahl et al., 1996; Caraty et al., 1992; Caraty and Locatelli, 1988; Chandolia et al., 1997; Gazal et al., 1998; Irvine and Alexander, 1994; Levine and Ramirez, 1982). FSH exhibits low-amplitude URs that are often concomitant with LH (Booth et al., 1996; Genazzani et al., 1993; Joustra et al., 2016; Lockwood et al., 1998; Matsumoto and Bremner, 1984; Pincus et al., 1998; Stewart et al., 1994; Urban et al., 1988; Veldhuis et al., 1991; Yen et al., 1972), although pulsatile FSH is not always detectable in general circulation (Filicori et al., 1984; Ginther et al., 1998; McNeilly et al., 2003; Spratt et al., 1988; Yen et al., 1972). Gonadotropins are also coupled to gonadal hormone production on ultradian frequencies; LH peaks usually precede peaks in testosterone and progesterone by 10 to 40 min (Backstrom et al., 1982; Beaven et al., 2010; Bray et al., 1991; Filicori et al., 1984; Genazzani et al., 1991; Ginther et al., 1998; Lewis et al., 1995; Nakajima et al., 1990; Nóbrega et al., 2009; Rossmanith et al., 1990a; Sisk and Desjardins, 1986; Soules et al., 1989; Spratt et al., 1988; Urban et al., 1988; Veldhuis et al., 1988; Winters and Troen, 1986), and estrogen pulses occur either concomitant with or just after testosterone or progesterone in men (Winters and Troen, 1986) and women (Backstrom et al., 1982; Licinio et al., 1998a; Venturoli et al., 1988), respectively. Finally, inhibin (a hormone produced by the gonads that inhibits FSH) also shows weak URs at approximately circhoral frequencies (τ = 1-1.7 h) in antiphase with the gonadotropins (Lockwood et al., 1998; Nakajima et al., 1990).
The ovulatory cycle has well-documented effects on the period and coupling strength of HPG axis URs. Coupling among the release of reproductive hormones (e.g., GnRH, LH/FSH, and progesterone) is more consistent during the follicular phase than the luteal phase (Booth et al., 1996; Clarke et al., 1987; Genazzani et al., 1991, 1993). The period of GnRH and LH pulses decreases across the follicular phase, reaching a minimum before ovulation (Ginther et al., 1998; Moenter et al., 1991; Rossmanith et al., 1990a; Stewart et al., 1994), and most mammals exhibit the longest GnRH, LH, progesterone, and estradiol UR periods during the luteal phase (Ar, 1985; Backstrom et al., 1982; Czieselsky et al., 2016; Filicori et al., 1984; Genazzani et al., 1991; Ginther et al., 1998; Gore et al., 2004; Healy et al., 1984; Licinio et al., 1998a; Moenter et al., 1991; Nakajima et al., 1990; Prendiville et al., 1996; Rossmanith et al., 1990b, 1990a; Soules et al., 1989; Tani et al., 1999; Venturoli et al., 1988; Vugt et al., 1984). The reason for these changes in UR periodicity and coupling across the ovulatory cycle are not well understood. However, the presence of these patterns across ovulatory cycles of different species, which differ in duration, argue for a shared role for URs in ovulatory cycle regulation.
URs and Coupling Across Endocrine Axes
The presence of URs coupled within single axes is not sufficient evidence for a body-wide UR network. Coupling must also occur across axes such that all URs in the hypothetical network are directly or indirectly linked. Such an arrangement would allow for sampling from one node to inform rhythmic patterns at other nodes. We propose that the GBA and HPT axes, in their regulation of energy acquisition and allocation, are functionally and dynamically tied to the HPA and HPG axes to appropriately allocate the use of available energy (Tena-Sempere, 2013). This proposition is based on findings pointing to cross-axis ultradian coupling for well-studied systems, as well as hormonal and neural substrates for coupling among all four axes. For example, GBA-HPA axis crosstalk coordinates extraction of energy following food intake, as CORT inhibits insulin secretion (Lambillotte et al., 1997; Plat et al., 1996), increases leptin levels (Laferrère et al., 2006), and stimulates protein breakdown (Spiga et al., 2014). Leptin URs show an inverse phase relationship to insulin and glucose (Simon et al., 1998), and to ACTH and CORT (Licinio et al., 1997). This might imply that glucose and insulin oscillate in phase with ACTH and CORT. Although acute glucose ingestion amplifies pulsatile ACTH and CORT secretion (Iranmanesh et al., 2011), other investigations have not identified a stable phase relationship among these outputs (Brandenberger et al., 1987; Shapiro et al., 1988).
GBA URs also couple to HPG axis URs, as leptin, LH, and estrogen peaks often oscillate in synchrony in women (Licinio et al., 1998a). Although not studied at an ultradian timescale, the HPG axis likely couples to the HPT axis, as TSH and thyroid volume change with ovulatory cycle phase (Doufas and Mastorakos, 2000). CORT and sex steroids influence patterns of GBA and HPT axis activity via actions on numerous neural substrates. Briefly, hunger-regulating circuits in the arcuate and paraventricular nuclei are sensitive to CORT feedback (Leon-Mercado et al., 2017; Ramos et al., 2005). Likewise, feeding and drinking behavior are modulated by testosterone and intracerebroventricular-administered estradiol (Clegg et al., 2006; Mauvais-Jarvis, 2011). Furthermore, one potential driver of URs in locomotor activity and appetitive behavior (including feeding) was recently located in CORT-tunable neurons in central dopaminergic circuitry (Berry et al., 2016; Blum et al., 2014). Finally, the HPT expresses receptors for numerous products released by the GBA and vice versa (Kluge et al., 2010; Sirakov and Plateroti, 2011; van den Beukel and Grefhorst, 2014), providing support for reciprocal interactions between these axes (Miller et al., 1978; Mullur et al., 2014). Taken together, there is substantial evidence that all four axes described exhibit 1) ultradian oscillations and 2) coupling at multiple levels within and across axes. As a result, these axes should behave as a coupled oscillator network in unperturbed individuals.
Implications of Ultradian Coupled Oscillator Network Properties for Research and Clinical Applications: A Case for Body Temperature
If the endocrine system operates as a coupled UR network, this system has the potential to provide continuous and noninvasive access to information about individual nodes of the network to researchers and clinicians without the need for high-frequency sampling of biological material (e.g., blood). Electrical outputs such as heart rate, heart rate variability, gastric contractions, and cortical power provide physiological information, but none of these measures exhibit clear relationships to all of the axes discussed above. In contrast, all four axes have well-documented influences on body temperature, a measure that exhibits URs of a similar periodicity in rodents and humans (Huang et al., 2014; Lindsley et al., 1999; Prendergast and Zucker, 2016; Ruis et al., 1987; Smarr et al., 2016a, 2016b; Smarr et al., 2017). Body temperature may therefore provide continuous information about the UR network. Evidence below provides support for the notion that body temperature is shaped by, and in turn shapes, each axis on an ultradian timescale.
HPT Axis and GBA Influence Core Body Temperature
It has been accepted since the 1800s that energy regulation influences the rate of heat production through the HPT axis and the GBA (Magnus-Levy, 1895). In fact, it has been argued that endothermy evolved from the cold response of the HPT axis in ectotherms (Little and Seebacher, 2014), suggesting a long evolutionary history of HPT responsiveness to temperature. Temperature change can influence HPT axis activity, as low temperatures stimulate HPT activity in humans (Smolander et al., 2009) and rodents (Ikegami et al., 2015); conversely, HPT axis dysfunction impairs core body temperature (CBT) rhythms (Mazzoccoli et al., 2004; Mullur et al., 2014). Thyroid-stimulated metabolic activity can be used directly for thermogenesis, as in brown fat thermogenesis, but many digestive and metabolic activities intrinsically generate heat (Clapham, 2012).
Body temperature profiles are dependent on GBA activity, including feeding schedules (Yoon et al., 2012); feeding-related changes to body temperature manifest in 2 forms: facultative and obligatory (Brundin et al., 1997). Facultative changes occur as the body anticipates incoming energy by increasing metabolism. For example, ghrelin stimulates both appetite and brown fat thermogenesis (Lin and Sun, 2012). Obligatory increases in temperature arise from the metabolic activity of breaking down food (e.g., protein, sugar, and fat content of a meal) and shape subsequent thermogenesis (Kus et al., 2008; Landsberg and Young, 1978; Quatela et al., 2016). Protein intake, for example, causes an increase in human CBT within 1 h (Brundin and Wahren, 1994), whereas fat intake causes a temperature decrease (Maffeis et al., 2001). Antagonizing the metabolism of glucose in the brain via intracerebroventricular injection of 2-deoxyglucose causes a dose-dependent hypothermic response that lasts 2 to 3 h in rats (Fiorentini and Müller, 1975). Similarly, insulin secretion decreases CBT (Sanchez-Alavez et al., 2010). Temperature may also feed back on this axis, exerting a synchronizing effect (Buhr et al., 2010). For instance, some insulin receptors expressed in the pancreas are sensitive to temperature changes within the physiological range (Uchida and Tominaga, 2011; e.g., TRPV4 [27-41°C], TRPM2 [>36°C]). This finding suggests a role for CBT URs in insulin regulation and provides a mechanism to close the feedback loop of food intake and metabolism affecting CBT.
Beyond the immediate impact on metabolic activity, food intake can shape neural control of homeostatic thermogenesis. For example, leptin is involved in increasing thermogenesis in response to cold stress in mice (Rozhavskaya-Arena et al., 2000; a response that takes 3-4 h), and glucose intake affects this thermoregulation by enhancing the leptin sensitivity of neurons in the feeding circuit (Mounien et al., 2010). Finally, extensive literature attests to the immediate and long-timescale effects of GBA and HPT activity on body temperature, strongly supporting its potential use in monitoring changes occurring on an ultradian timescale in these systems.
HPA Axis Influences CBT
There is some evidence that human cortisol URs have a stable phase relationship to URs of core and distal body temperature both in isolation and under natural conditions (Smarr et al., 2016a). Similarly, an injection of CORT or adrenaline at doses mimicking acute stress results in an acute decrease in CBT over the subsequent hour (Kainuma et al., 2009; Watanabe et al., 2008). ACTH and CORT also have opposing effects on brown fat activation in rodents (Soumano et al., 2000; Strack et al., 1995; van den Beukel et al., 2014; Viengchareun et al., 2001), with ACTH increasing thermogenesis and CORT in turn muting this activation. Reciprocally, corticosteroid-binding globulin is temperature sensitive, enabling changes in HPA signaling in response to thermoregulatory challenges (Lightman and Conway-Campbell, 2010).
HPG Axis Influences CBT
The gross effects of estradiol and testosterone on the temporal pattern of CBT have been documented for decades, giving rise to the term in heat for an ovulating, sexually receptive female mammal (Marrone et al., 1976). The preovulatory spike in estradiol on days of ovulation in mice and rats is associated with a plateau of high CBT (Sanchez-Alavez et al., 2010; Smarr et al., 2017). Acutely, estradiol raises CBT and lowers skin temperature in females (Mittelman-Smith et al., 2012; Rance et al., 2013; Williams et al., 2010), and OVX mice show a sustained increase in tail temp that is reversed with treatment by estradiol (Ding et al., 2013). In males, testosterone acutely raises muscle temperature while lowering adipose temperature but can also be aromatized to estradiol, thereby affecting CBT through similar mechanisms as estradiol in females (Clarke et al., 2012; Mauvais-Jarvis, 2011). Changes in thermogenesis associated with sex steroids likely occur through influence on hypothalamic neurons that regulate pulsatile release of LH as well as body temperature (Mittelman-Smith et al., 2012; Rance et al., 2013).
In summary, there is ample evidence that temperature is modulated on an ultradian timescale by output of the GBA, HPT, HPA, and HPG axes. Thus, if these axes operate as coupled oscillators, then body temperature should oscillate with a stable phase relationship to the oscillations within these axes. In turn, resulting temperature URs may reinforce coordination among these axes.
Discussion
The existence of 1- to 4-h URs and coupling in the GBA, HPT, HPA, and HPG axes support a coupled oscillator network model of URs. This network provides a testable framework that makes several predictions relevant to academic and clinical endocrinology. First, information from one endocrine axis carries information about other axes. Second, there may be shared outputs, including body temperature, that provide high temporal resolution information about the entire endocrine network through noninvasive means. While lacking the precision of direct chemical assays, such shared outputs enable a range of endocrine studies not currently possible. For example, such an arrangement would permit combined longitudinal and high temporal resolution assessment of physiological dynamics within individuals (Bashan et al., 2012). Such an assessment may uncover changes to endocrine dynamics particular to specific states (e.g., obesity, diabetes, fertility). For example, continuous, high temporal resolution data have already been shown to enable predictions of future physiological changes, including pregnancy outcomes in mice and sepsis onset in hospital patients (Drewry et al., 2013; Smarr et al., 2016b). Alongside the rapid evolution of wearable technology, conceptualizing endocrine dynamics as a coupled oscillator UR network may assist in the development of predictive medical analytics by pairing traditional endocrine studies with hypotheses generated from noninvasive, biologically relevant data gathered continuously within individuals from broad populations. Although a great deal of additional knowledge is needed to inform the type of and extent to which a coupled oscillator network model correctly describes endocrine interactions and dynamics, such information will likely be invaluable as a clinical diagnostic or for noninvasive data collection across systems.
Considerations and Caveats
Networks are composed of nodes and edges. Here, nodes represent oscillating, measurable outputs (e.g., CORT, LH, ghrelin) with edges representing coupling between nodes (see Fig. 2). Edges contain 2 dimensions, with weight representing coupling strength (degree to which a change in one node will affect change in an adjacent node) and length representing phase delay (the time delay of propagation from change in one node to change in the connected node). In this arrangement, all nodes and edges of the proposed network could be experimentally mapped. The properties of edges likely change over time and condition. For example, the length of an edge might change as a function of sleep and wakefulness, hunger, sex, ovulatory phase or age. Nodes themselves are likely to change across development, as in the rise in prominence of the estradiol node at puberty. A useful model will therefore require complexity and flexibility. Our simplistic model gives at least 3 testable predictions, which may inform network-mapping efforts.
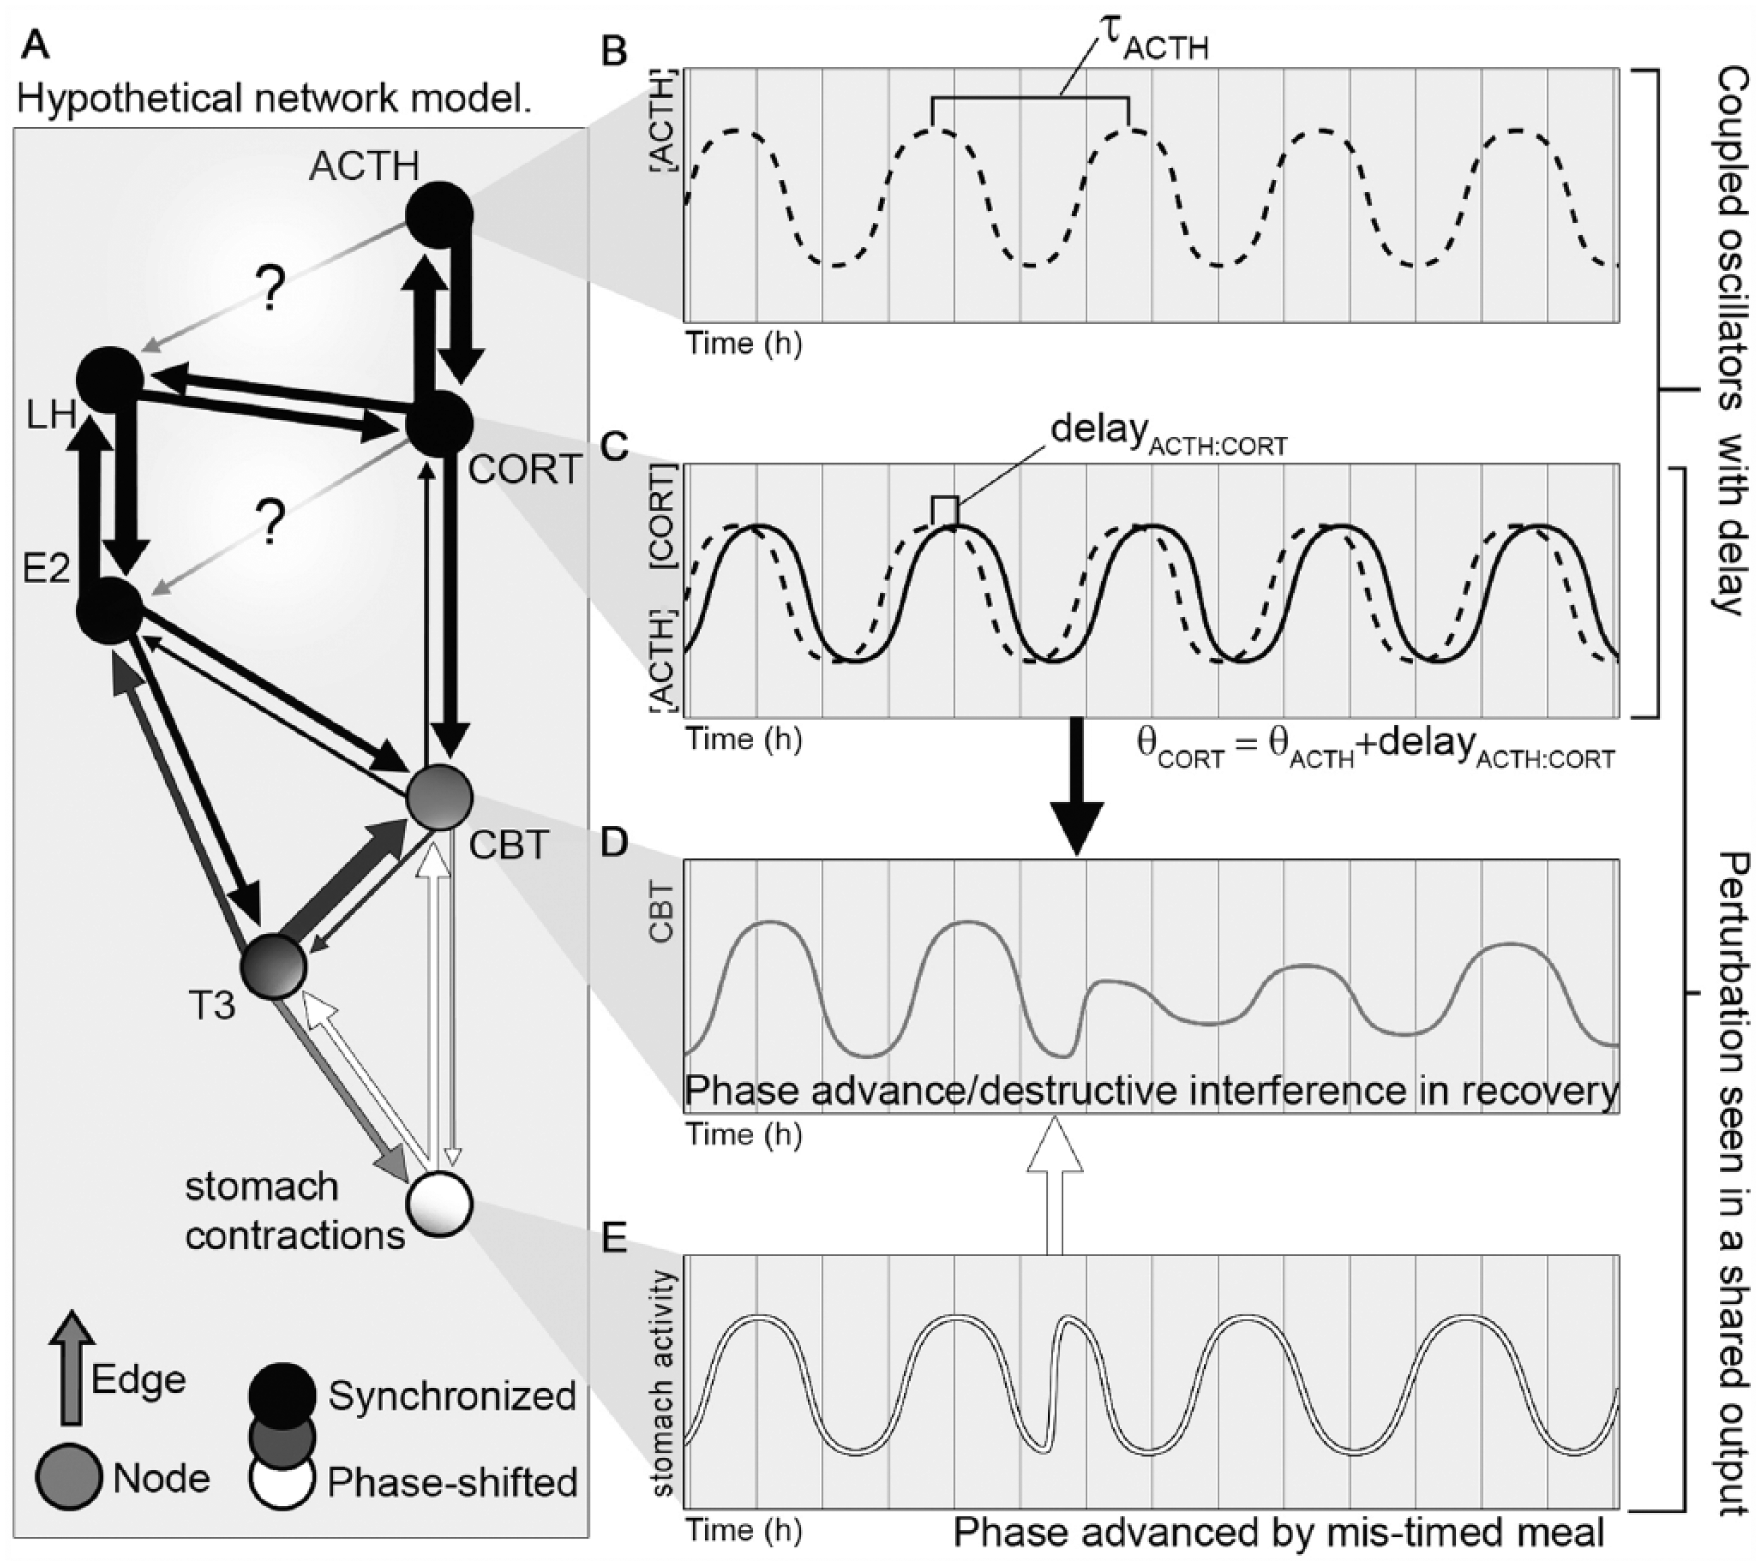
Hypothetical Coupled Oscillator Network and Properties. Schematic of the hypothetical ultradian rhythm network with URs represented as sines (A) exemplifying node and edge properties. Oscillating outputs are represented by nodes. The presence of coupling is represented by edges, with edge thickness proportional to the consistency with which a modulation of one node is associated with response in its neighbors (i.e., coupling strength), and edge length indicating the time delay between modulation of one node and response of another. Arrowheads indicate that coupling is directed. The white arrow indicates a perturbation that spreads from the stomach contraction node to neighboring nodes and indicates that perturbation may propagate through multiple nodes and influence subsequent feedback to the originally perturbed node. (B) Hypothetical ACTH ultradian rhythm approximated as a sine wave, with ΤauACTH indicating period. (C) ACTH ultradian rhythm from (B) with overlaid hypothetical CORT ultradian rhythm, illustrating the concept of coupled oscillations with a stable phase difference. (D) Hypothetical Core Body Temperature (CBT) ultradian rhythm resulting from combined influence of ACTH, CORT, and stomach contractions, highlighting potential for detecting network disruptions as rhythm perturbations. (E) Hypothetical ultradian rhythms in stomach contractions, illustrating a phase advance from a mistimed early meal. This perturbation is visible in the rapid dampening of the composite CBT signal, and in the depressed amplitude as the systems recover and realign (black and white arrows).
UR Parameters: Maintenance of Fundamental Frequency and Harmonics
In an unperturbed individual, coupled nodes may share a fundamental frequency at the ultradian timescale. That is, they may have a single lowest common frequency, as in circhoral pulses superimposed on 3-h oscillations. Thus, individual rhythms need not share the same frequency to maintain a stable phase relationship, and it would be expected that abolishing or perturbing signaling at one timescale would predictably perturb oscillations at others (Baker and Driver, 2007; Smarr et al., 2012). Body temperature provides an example of a node that is strongly modulated by other hormonal outputs and exhibits a single dominant frequency in the 1- to 4-h range in individuals (Fig. 2). URs may also have stable frequencies at harmonics (i.e., whole-number multiples of the fundamental frequency). For example, an individual might have LH peaks every hour, CORT peaks every 2 h, and feed every 4 h without violating this expectation. As many URs appear to be primarily circhoral, this is an important component of ultradian network stability. If constituent nodes influencing body temperature were not coupled, each node would contribute an independent frequency and phase of UR. When these unrelated frequencies overlap to modulate the body temperature UR, the composite frequency space would lack the structure of superimposed harmonics, obscuring URs in body temperature (Fig. 3A). The fact that a dominant 1- to 4-h rhythm is observed in temperature supports the coupling hypothesis (Fig. 3B, C). Experimental mapping of the ultradian frequencies of hormonal outputs within an individual, along with widely coupled outputs such as temperature, could be used to test this prediction.
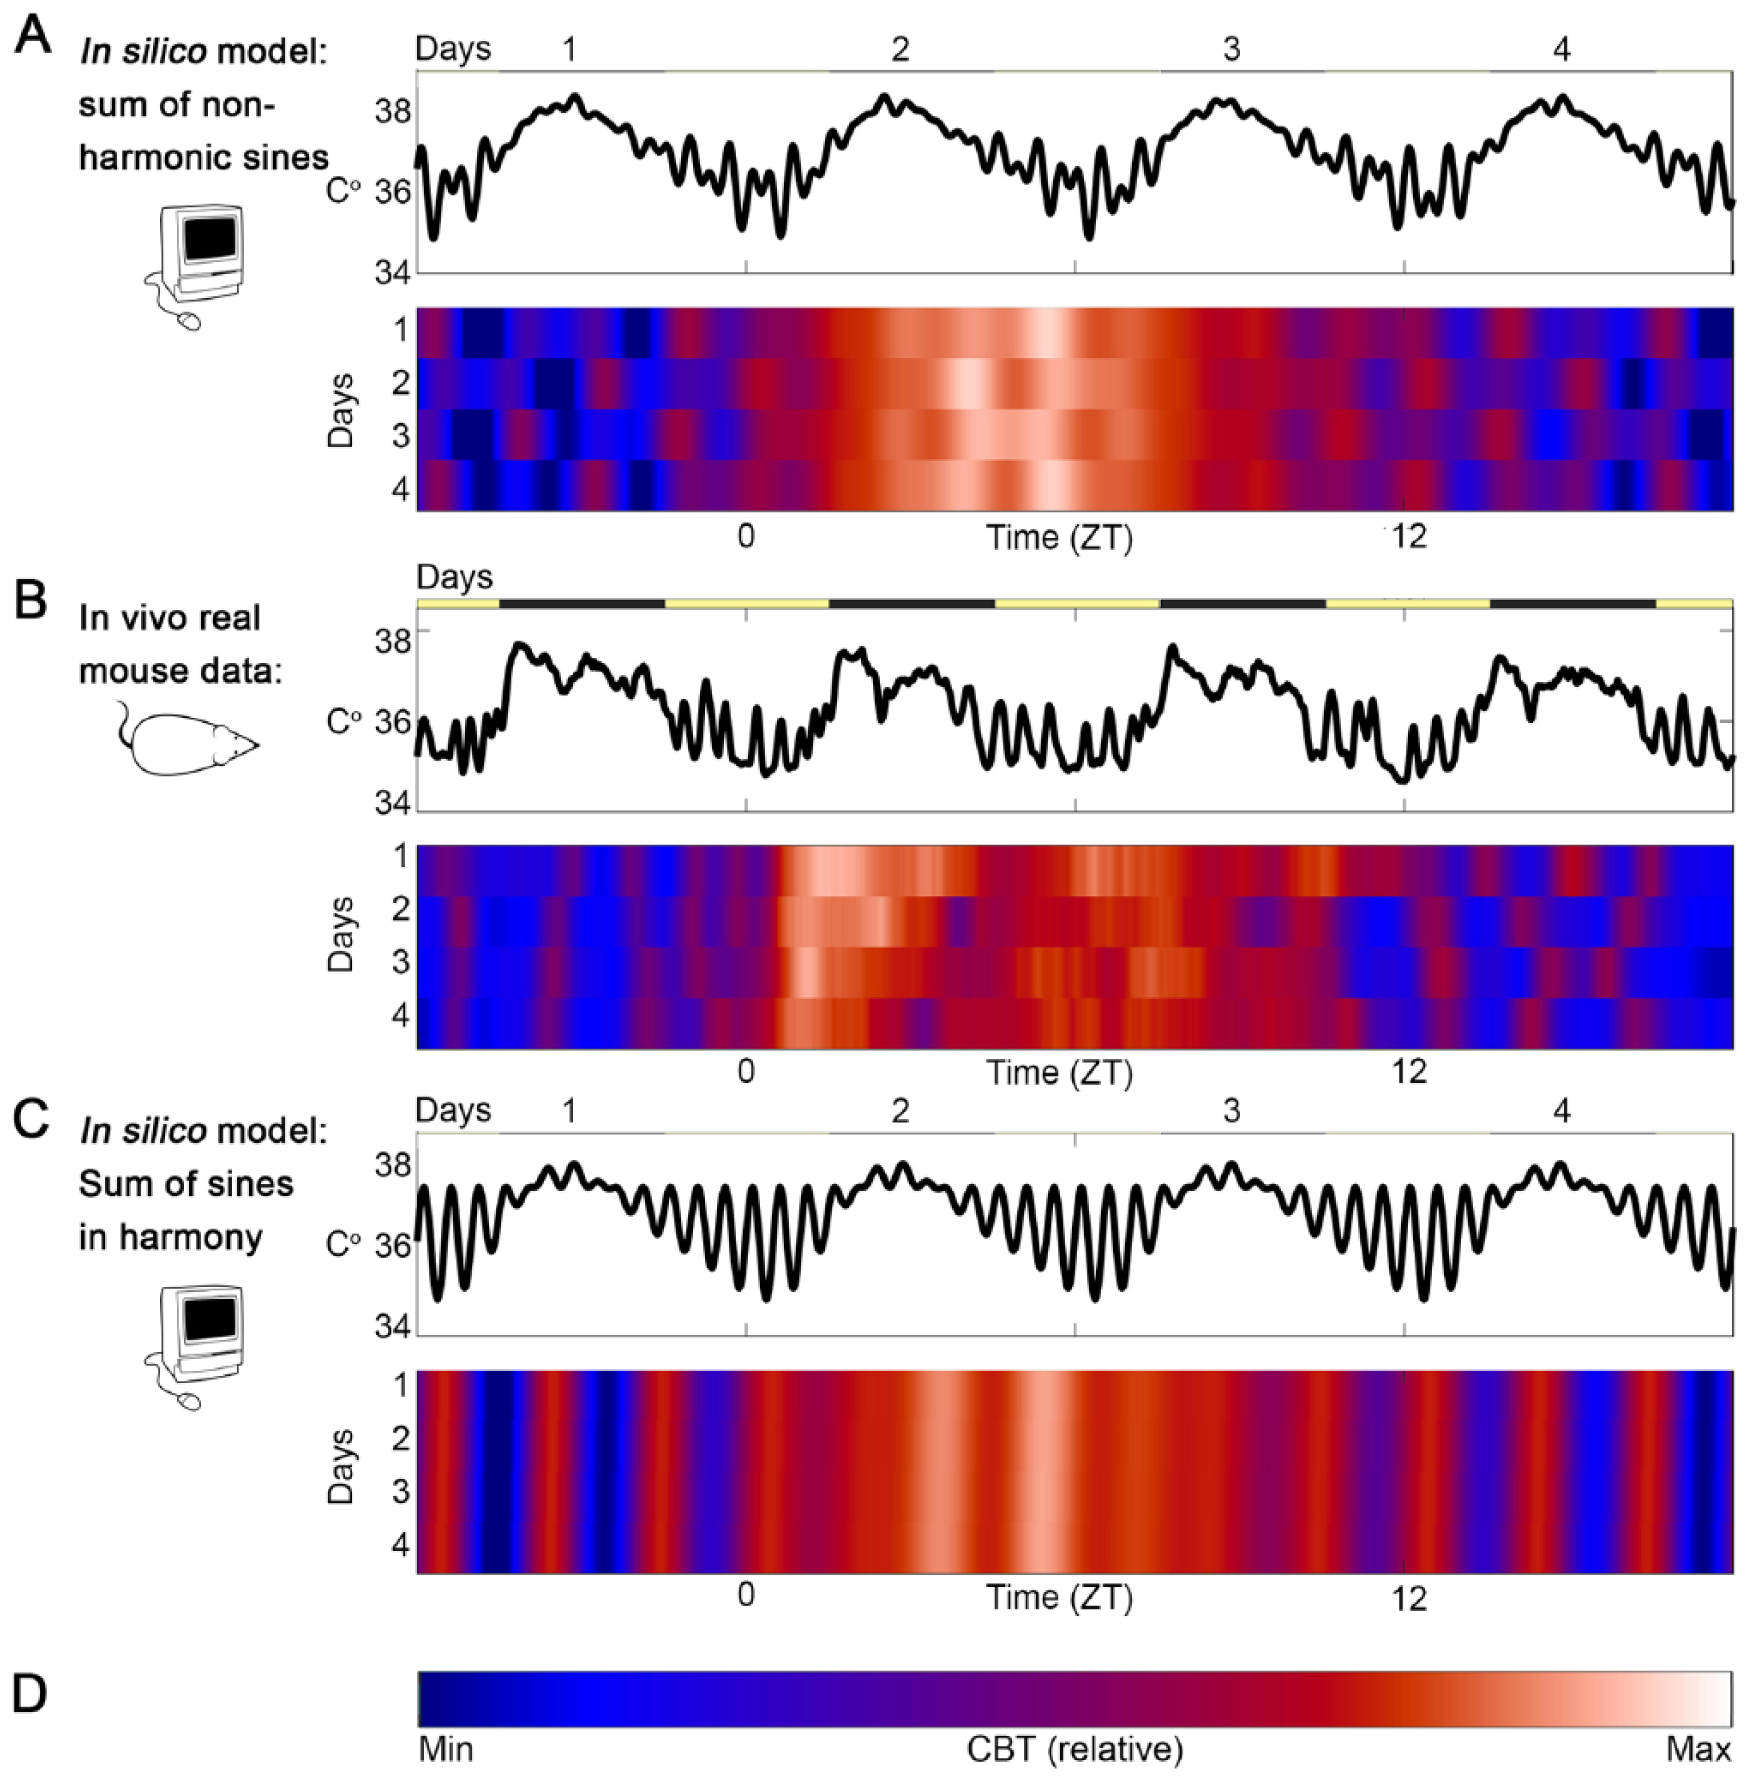
Real data can be compared to simple models to explore harmonics. Simulated body temperature data (A, C) was generated by superimposing sinewaves of circadian and ultradian frequencies and compared to 4 days of real mouse core body temperature data (B). (A) Two ultradian frequencies overlap with an average periodicity of 2 h but with each component sine wave set to a noninteger, non–whole-number-multiple (i.e., nonharmonic) of the other. Linear depiction of the simulated waveform (above) across 4 simulated days; the same data plotted as a raster plot of temperature (color, D), per minute (x-axis) per day (y-axis) allows comparison of peak-timing across days. (B) Real mouse body temperature data (based on data published in Smarr et al., 2017) show circadian and ultradian rhythms overlapping, as well as reactions to sudden changes in the light:dark cycle (yellow and black bars) not included in our data for the sake of simplicity. (C) Simulated data with only 1 dominant frequency (τ = 2 h) results in perfect ultradian alignment across days. Comparisons across animals and conditions would allow quantitative testing of conditions under which harmonics emerge, as appears to be the case in the real data (B) during the late inactive phase (preceding ZT 0). Notably, UR frequency appears to be modulated at the circadian timescale. (D) Color scale bar.
Active Decoupling and Recovery
If endocrine nodes are usually coupled, then lack of coordinated activity in adjacent nodes would imply the presence of a decoupling force. Thus, if an endogenous rhythmic pattern is known, then predictable perturbations should be detectable following a disruptive event. In addition, stable phase relationships should reemerge following recovery from disruption (Fig. 2B, C). Sufficiently strong disruptions might shift the entire network to a new stable state, whereas smaller disruptions would be expected to result in transient perturbation. For example, decoupling could arise from a phase-shift of gastric output due to an ill-timed meal, with the meal’s influence on gastric activity acting to temporarily decouple gastric activity from the surrounding network (see Fig. 2E). Decoupling could also manifest along an edge. For example, if the edge between the nodal outputs ACTH and CORT were pharmacologically suppressed by an ACTH receptor antagonist, then a lack of coordinated pulsatility would be expected between these 2 hormones because of the decoupling action of the antagonist. One implication is that disruptions to network synchrony might be detectable through the appearance of destructive interference in a shared output such as body temperature (Fig. 2D). As each day in an individual’s life does not share identical timing (e.g., sleep, meals, etc.), another implication is that a degree of system-wide perturbation is expected to arise from environmental factors, and perfect regularity of URs is not expected from real-world data (Fig. 3B). At present, sparse literature has investigated active decoupling and recovery at the timescale of hours. Modeling of these relationships has begun in isolated axes but, to our knowledge, has yet to be investigated using a holistic framework to incorporate across-axes interactions (Caplan et al., 2010; Lightman and Terry, 2014).
Network-wide Predictions
With sufficient knowledge of a network’s nodes and edges, measurement of the UR phase of one node should allow reasonable predictions about the UR phase of any other node in the network. Measured deviation from these predictions would imply either imperfect mapping of the network or the presence of disruptions. This property speaks to the potential utility of easily acquired outputs, like body temperature, for estimating the state of more difficult-to-measure hormonal dynamics. For example, research into coupling among blood glucose, blood insulin, and body temperature under various conditions might allow diabetes management by continuous temperature measurement without the need for frequent blood samples.
Past and Present Challenges to Collecting and Analyzing UR Data
There are many reasons why it is not yet clear if endocrine systems comprise a coupled oscillator network, despite an abundance of evidence that individual axes both have URs and couple. In part, our lack of understanding reflects the complexity of the system being mapped. However, methodological barriers including limitations in sampling frequency from tissues, interindividual variability of period and network state, and intra-individual variability across days due to modern environmental disruptions have made those mapping efforts more difficult.
Adequate sampling frequency and duration across multiple hormones is difficult in small mammals and can be cost prohibitive in humans. Detection of URs requires high-frequency sampling: for a 4-h rhythm, a sample every 2 h is the mathematical minimum sampling frequency required to avoid aliasing (i.e., the Nyquist critical frequency) (Durkin and Callaghan, 2005). Even if sampling is adequately frequent, a short duration of data collection (i.e., a small number of cycles) also decreases the likelihood of accurately detecting the oscillation. Sampling periods of only a few hours, even at high sampling frequencies, are biased toward the detection of ultrashort URs (Bagnasco et al., 2002b; Otukonyong et al., 2005). Some studies have attempted to bypass these challenges by measuring ultradian outputs in tissue explants (Chou and Johnson, 1987; Lewy et al., 1996); however, if URs rely extensively on network feedback, a node isolated from network feedback may not exhibit the same periodic behavior as it would in vivo. An ideal tool would be able to measure a node continuously over many days at high temporal resolution. Hormone-proxy measures from easy-to-measure variables such as body temperature are therefore of great potential value. Likewise, newer devices that allow continuous monitoring (e.g., glucose or lactate monitors) will aid researchers and practitioners interested in studying URs.
Once data have been collected, choice of analytical method can influence the detection of periodicities in measured outputs. Widely used pulse-detection algorithms (e.g., PREDETEK, Genazzani et al., 1991; ULTRA, Polonsky et al., 1988; Saad et al., 1998; Simon et al., 1998) have user-specified detection thresholds. In these analyses, a lower threshold for pulse detection results in a larger number of detected peaks. As the peak number is often divided by the duration of measurement, detection threshold can directly affect the determination of periodicity, with a lower threshold leading to a shorter estimated period, and a bias toward missing large, but slow, peaks. As alluded to earlier, these analyses may bias results of studies conducted over a short interval toward detection of high-frequency rhythms that may or may not be the dominant frequency observed over a longer interval (Otukonyong et al., 2005). Signal-processing techniques such as wavelet transformations (Leise et al., 2013), dynamic time warping (Tan et al., 2015), or delay differential analysis (Lainscsek and Sejnowski, 2015) provide a more unbiased picture of the frequency compositions of, and relationships between, hormonal signals over many cycles.
After accounting for variability arising from sampling and analytical methods, within-individual variability may still account for a substantial amount of total variability. For example, intraindividual variability in periodicity of intestinal contractions accounts for about 50% of population variability (Husebye et al., 1990), more than the contributions of expected sources of variability, such as sex or age. If individuals comprise unique UR networks, then averaging across individuals or even by time of day within individuals will “wash out” higher frequencies. Nonetheless, because of the infeasibility and expense of high temporal resolution sample collection, URs in the literature are almost exclusively a reflection of averages across individuals. In some cases, modern computational techniques allow researchers to revisit existing raw data with an eye to understanding individual-specific features (e.g., periodicity, period variability, rhythmic strength), rather than average values at a given time of day.
Despite these sources of variance, remarkable UR consolidation exists in one model organism, laboratory rats. Examined separately, rats have consistent 3- to 4-h rhythms in serum GH (Tannenbaum and Martin, 1976), CORT (Mitsugi and Kimura, 1986), body temperature (Harper et al., 1996; Ruis et al., 1989), ghrelin (Bagnasco et al., 2002b; Kalra et al., 2003) and leptin (Bagnasco et al., 2002b; Kalra et al., 2003). Although we should expect greater variability in humans who have more environmental and genetic variability than model animals raised in laboratory conditions, the potential consolidation of within-individual URs across outputs is an avenue worthy of further investigation. Simultaneous monitoring of multiple URs in a single individual will be important for expanding understanding of UR dynamics.
Conclusion and Implications: Building Personalized Medicine Through Modeling and Wearable Devices
The present overview suggests that neuroendocrine physiology operates as a network of coupled ultradian oscillators. More research is needed to fully characterize and verify the proposed model by acquiring new data and reanalyzing existing data using signal-processing techniques. Focusing on intraindividual comparisons sidesteps challenges associated with interindividual variability and allows identification of information-rich nodes that can be noninvasively assayed (Skarke et al., 2017). Such metrics have the potential to replace costly and disruptive measures such as blood draws and enable personalized medicine through comparison of individuals to themselves over time, rather than by comparison of a single measure to the population mean. For example, if temperature dynamics accurately reflect reproductive or digestive state, individual monitoring of fertility or individually tailored times to eat or exercise might be garnered noninvasively. Although the present overview focuses on body temperature as a proxy for hormonal dynamics, other noninvasive metrics like heart rate and heart rate variability, EEG components, skin conductivity, and so forth may also provide information on hormonal and nonhormonal physiological nodes.
In research, reliable proxy measures would allow more detailed descriptions of endocrine dynamics and identification of conditions that perturb those dynamics. Future work designed within this framework could aid in the development of network models of disease that could help explain increasingly common, cross-axes comorbidities such as polycystic ovary syndrome and obesity (Naderpoor et al., 2015), gastrointestinal imbalance and depression (Dash et al., 2015), and adrenal fatigue and infertility (Hompes et al., 1992). With the aid of new technologies and analyses, it is feasible to collect data longitudinally at high temporal resolution and across multiple nodes. Such advances may enable rapid progress in understanding endocrine URs and the potential translational applications they carry.
Footnotes
Acknowledgements
We thank Dr. Irv Zucker for his helpful comments on an earlier version of this manuscript. The preparation of this manuscript is supported by National Institutes of Health grants HD-050470 (L.J.K.), ES-027509 (B.L.S), and HD-081957 (B.L.S).
Conflict of Interest Statement
The authors have no potential conflicts of interest with respect to the research, authorship, and/or publication of this article.