
Abstract
The spread of adaptive genetic variants in populations is a cornerstone of evolutionary theory but with relatively few biologically well-understood examples. Previous work on the ls-tim variant of timeless, which encodes the light-sensitive circadian regulator in Drosophila melanogaster, suggests that it may have originated in southeastern Italy. Flies characterized by the new allele show photoperiod-related phenotypes likely to be adaptive in seasonal environments. ls-tim may be spreading from its point of origin in Italy by directional selection, but there are alternative explanations for its observed clinal geographical distribution, including balancing selection and demography. From population analyses of ls-tim frequencies collected on the eastern side of the Iberian Peninsula, we show that ls-tim frequencies are inverted compared with those in Italy. This pattern is consistent with a scenario of directional selection rather than latitude-associated balancing selection. Neutrality tests further reveal the signature of directional selection at the ls-tim site, which is reduced a few kb pairs either side of ls-tim. A reanalysis of allele frequencies from a large number of microsatellite loci do not demonstrate any frequent ls-tim-like spatial patterns, so a general demographic effect or population expansion from southeastern Italy cannot readily explain current ls-tim frequencies. Finally, a revised estimate of the age of ls-tim allele using linkage disequilibrium and coalescent-based approaches reveals that it may be only 300 to 3000 years old, perhaps explaining why it has not yet gone to fixation. ls-tim thus provides a rare temporal snapshot of a new allele that has come under selection before it reaches equilibrium.
Keywords
The timeless (tim) gene encodes a cardinal light-sensitive component of the circadian clock in Drosophila melanogaster and has 2 natural variants: ls-tim and s-tim (Rosato et al., 1997; Peschel et al., 2009). In ls-tim, a single base insertion recruits an additional upstream Methionine codon, so that a long (L-TIM1421) and short (S-TIM1398) isoform are produced, whereas in s-tim, the main product is S-TIM1398 (Tauber et al., 2007). L-TIM has weaker physical interactions with the blue light circadian photoreceptor CRYPTOCHROME (CRY) when examined in a yeast model, and this is reflected in the enhanced stability of LS-TIM in fly heads, which correlates with reduced circadian responses to light at both behavioral and molecular levels (Sandrelli et al., 2007; Peschel et al., 2009). ls-tim also has a dramatic seasonal phenotype in D. melanogaster in ovarian diapause, a reproductive arrest (overwintering) observed at lower temperatures, that is photoperiodic and more pronounced in shorter day-lengths at approximately 12 °C (Saunders, 1990; Zonato et al., 2017). ls-tim females enter diapause at significantly higher levels than s-tim, even in relatively long day-lengths, an indication of reduced photoresponsiveness in a seasonally adaptive trait (Tauber et al., 2007). ls-tim thus provides a genetic link between the circadian and diapause mechanisms, a subject that has stirred some debate (Emerson et al., 2009; Bradshaw and Holzapfel, 2007).
Recently, the frequency of ls-tim has been shown to be low in North American populations of D. melanogaster (Pegoraro et al., 2017). Nevertheless, a significant cline is present, with ls-tim frequency ranging from 15% (Florida) to 30% (Maine). This cline, in the opposite direction to the one observed in Europe, would be expected to contribute to the generation of the impressive diapause cline detected in North American populations, which contrasts with the very weak cline in Europe (Pegoraro et al., 2017; Schmidt et al., 2005).
Given these putative adaptive ls-tim phenotypes, it would follow that ls-tim should be favored in northern over southern Europe; however, counterintuitively, the highest ls-tim frequencies are found in southeastern Italy near the town of Novoli and decrease linearly as the overland distance from this location increases both northward and southward (Tauber et al., 2007). We have previously suggested, based on neutrality tests and phylogenetic analyses, that the ls-tim variant was spreading slowly from its origin in southern Italy under directional selection. This positive selection would include the beneficial effects from adaptive circadian photoresponses and enhanced diapause in Europe’s seasonal environment (Tauber et al., 2007; Sandrelli et al., 2007). However, because the ls-tim mutation appeared to be approximately 8000 to 10,000 years old, it was surprising that it had not gone to fixation. Signatures of directional selection from neutrality tests can also be caused by other nonequilibrium forces (Biswas and Akey, 2006), so might it be that ls-tim is actually maintained by balancing selection but favored over a narrow range of latitudes in southern Europe? Here we answer this question using different approaches to understand the forces driving the ls-tim geographical distribution.
Materials and Methods
Fly Strains
Natural D. melanogaster populations were collected in Spain in the late summer of 2008 and in England and North of Europe in 2009. Males were frozen in EtOH 100% within 10 days from collection, while females were used to establish a large number of isofemale lines. The exact locations of collection are shown in Supplementary Table S1. The captured males (and occasionally 1 male per isofemale line) were used for the genotyping study, after a species-specific PCR was performed to exclude Drosophila simulans flies from the analysis. For this PCR, the following primers were used: 5′-TTCACCTCTGGTACCACGTTAAG-3′ and 5′-AATGGCTGGGGATTGAAAAT-3′, and the PCR reaction was carried out for 35 cycles with 92 °C for 30 sec, 57 °C for 30 sec, and 72 °C for 30 sec.
ls-tim and s-tim Genotyping
ls/s-tim genotypes were determined using the same allelic-specific PCR approach as used by Tauber et al. (2007). Two PCRs were performed for each DNA, using a forward primer specific for either ls- or s-tim (5′-TGGAATAATCAGAACTTTGA-3′ and 5′-TGGAATAATCAGAACTTTAT-3′, respectively), together with a common reverse primer (5′-AGATTCCACAAGATCGTGTT-3′). The following primers, amplifying a syntenic region, were added to the reaction to control for PCR efficiency: 5′-CATTCATTCCAAGCAGTATC-3′ and 5′-TATTCATGAACTTGTGAATC-3′. The following thermal profile was used to carry out the amplification: 35 cycles with 92 °C for 30 sec, 55 °C for 30 sec, and 72 °C for 30 sec.
Microsatellite Analysis
The data for the microsatellite study were kindly provided by Christian Schlötterer (Nunes et al., 2008; Caracristi and Schlötterer, 2003). The frequency of each microsatellite allele was plotted against latitude and overland distance from Novoli (Italy). For the locations of collection considered in the analysis and the details of the loci showing significant correlation, see Supplementary Tables S3 and S4. Alleles with very low frequency (frequency <0.1 in at least 5 locations out of 8) were not considered in the analyses.
Phylogeny and Neutrality Tests
Flies from 3 Spanish populations, SP-22 (36.97°N), SP-35 (38.78°N), and SP-53 (41.73°N) (see Suppl. Table S1), were crossed to the tim deficiency Df(2L)tim02, thus providing hemizygous progeny for the DNA sequencing. The primers used to obtain the sequences for the neutrality tests and phylogeny are listed in Supplementary Table S5. One corresponding D. simulans sequence was obtained for each of the 3 regions used for the HKA test from NCBI (chromosome 2L, GeneBank CM000361.1, FLYBASE coordinates, ls-tim 3458245-34572520, 5′ region 3462343-3461505, 3′ region 3431897-3430807). For the phylogenetic analyses, the African outgroup was provided by sequencing a D. melanogaster individual collected in Zimbabwe. The Neighbour-Joining tree with the Kimura 2-parameter model with gaps treated as pairwise deletions was calculated using MEGA4 software. We also used GENETREE, a coalescent-based method that generates likelihood estimates of the temporal distribution of mutations and most recent common ancestors (Griffiths and Tavaré, 1999). For the linkage disequilibrium analysis, the number of crossovers between the 2 loci (r) has been calculated by multiplying the recombination rate (3.47 cM per Mbp in this region; Fiston-Lavier et al., 2010) by the distance between the 2 loci (the recombination rate was divided by 2 because of the lack of recombination in males). This method (Slatkin and Rannala, 2000) does not require any demographic assumptions and is based on the equation t = 1/(ln(1 – r))(ln((x – y)/(1 – y))), where r is the number of recombination events and x and y are the frequencies of one of the marker alleles on the new and the old alleles, respectively.
Results
Iberian ls-tim Frequencies Favor Directional over Balancing Selection
According to the directional selection hypothesis (Tauber et al., 2007), the spread of ls-tim from southeastern Italy generates the distance cline that we currently observe, with the frequency of the derived allele decreasing as a function of the overland distance from the site of origin (Tauber et al., 2007). Since for most of Europe, latitude and overland distance from southern Italy follow the same pattern (both increase moving northward), we studied the frequency of ls-tim from the eastern coast of the Iberian Peninsula because as latitude increases, overland distance from southern Italy decreases and vice versa. Thus, if balancing selection was maintaining the ls-tim cline, we might expect similar patterns of ls-tim frequencies in the Iberian peninsula for the similar latitudes, temperatures, and photoperiods of Italy, namely higher ls-tim levels in the south and lower in the north. In contrast, the directional selection scenario would predict higher ls-tim levels in northern Spain because this is closer, by overland distance, to southeastern Italy.
Natural populations of D. melanogaster from 16 Spanish locations were collected in the late summer of 2008 (Suppl. Table S1), and males and females were frozen within 2 weeks of collection for subsequent genotyping. The newly obtained Spanish data were compared with the previously published European dataset (Tauber et al., 2007), to which 6 newly captured and genotyped populations have been added approximately 12 years after the original collections from 1997 (Tauber et al., 2007) (Suppl. Table S1). These 6 new data points integrate well with the 1997 data (green dots, Fig. 1A). The figure reveals that ls-tim shows a significant latitudinal cline in Spain, but in contrast to Italy and the rest of continental Europe, ls-tim increases in frequency as latitude increases. However, ls-tim frequencies maintain their negative relationship with overland distance from the putative site of origin of ls-tim (near Novoli, Italy; Fig. 1B). Thus, the frequency of ls-tim throughout Europe depends on distance from the putative site of origin rather than on latitude, reinforcing the view that directional rather than balancing selection is favoring ls-tim. Interestingly, the regression lines describing overland distance of the 2 datasets (Spain vs. the rest of Europe) reveal an approximate 10% reduction in the frequency of ls-tim in Spain for the equivalent distance from Novoli. The lower levels of ls-tim as it spreads southward from northern Spain, compared with northward from southern Italy for the same distance from the point of origin, are consistent with seasonal selection, which would be expected to be reduced in more southerly latitudes.
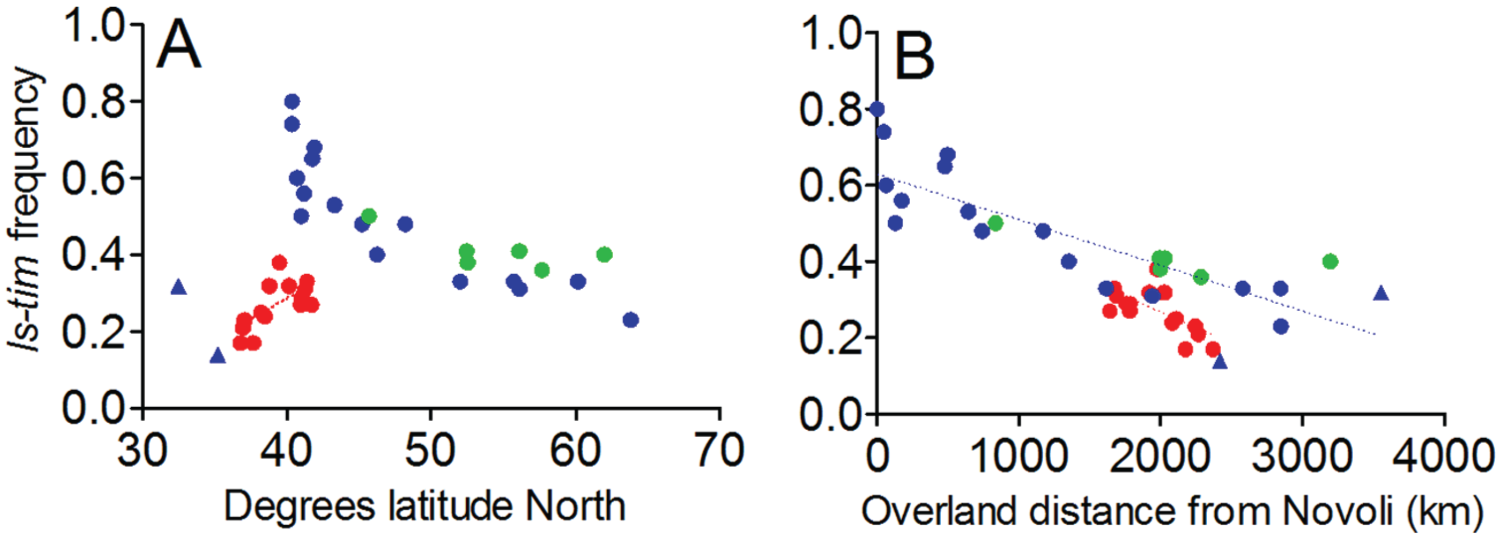
Population analyses of ls-tim. ls-tim gene frequencies in Europe. Red circles, Spanish data. Blue circles, European data from Tauber et al. (2007). Green circles: newly genotyped European populations. (A) ls-tim frequencies plotted by latitude. ls-tim frequency increases with increasing latitude in Spain (R2 = 0.40, p = 0.0086) in contrast to the corresponding situation from Novoli (southeastern Italy) northward (R2 = 0.72; p < 0.0001), where ls-tim frequency decreases with increasing latitude. The 2 triangular data points on the left represent population frequencies from the extreme south of Europe, Crete and Israel, that do not fit the latitudinal pattern and are not included in this analysis. (B) ls-tim frequencies plotted by overland distance from Novoli. The same inverse relationship between distance from Novoli and ls-tim frequency is observed in Spain (R2 = 0.403; p = 0.0082) and in the rest of Europe (R2 = 0.68; p < 0.0001), but in this analysis, populations from Crete and Israel (triangles) that do not fit the latitudinal pattern are included (Tauber et al., 2007). Consequently, “distance from Novoli,” not latitude, readily explains the frequencies of ls-tim we observe in all European populations.
Failure to Reach Fixation Might Be Due to the Age of the New Allele
Our previous phylogenetic estimations used the sibling species D. simulans (diverged from D. melanogaster 2-2.5 million years ago; Russo et al., 1995) to calibrate the age of ls-tim as approximately 8000 to 10,000 years (Tauber et al., 2007). To achieve a higher resolution, we used a sub-Saharan African D. melanogaster tim sequence as an ancestral outgroup (D. melanogaster colonized Europe from sub-Saharan Africa approximately 15 Kya; Li and Stephan, 2006) and compared it with the Spanish sequences. As shown in Figure 2, all the ls-tim haplotypes cluster at the top of the tree regardless of location of collection, suggesting that ls-tim is the more recent derived allele. The branch length to the ancestral African sequence suggests that ls-tim is approximately 3000 years old. We also used GENETREE (Griffiths and Tavaré, 1999) and obtained an estimate (±SD) of 2130 (899) years assuming population size of 105 and 20 generations per year (Fig. 3). We used a third method and estimated the age of the ls-tim allele by analyzing the amount of linkage disequilibrium (LD) with flanking markers (Slatkin and Rannala, 2000) (Table 1). We used 6 markers at different distances from the ls/s-tim polymorphic site, and the results suggest a high level of LD between markers, compatible with a recent origin of the new allele, between 130 and 3000 years ago depending on the markers used. Overall, and despite substantial variation between the age estimates produced by the different methods, they all point to a very young allele that originated after the colonization of Europe by Drosophila and is much younger than our original estimate of approximately 8000 to 10,000 years (Tauber et al., 2007).
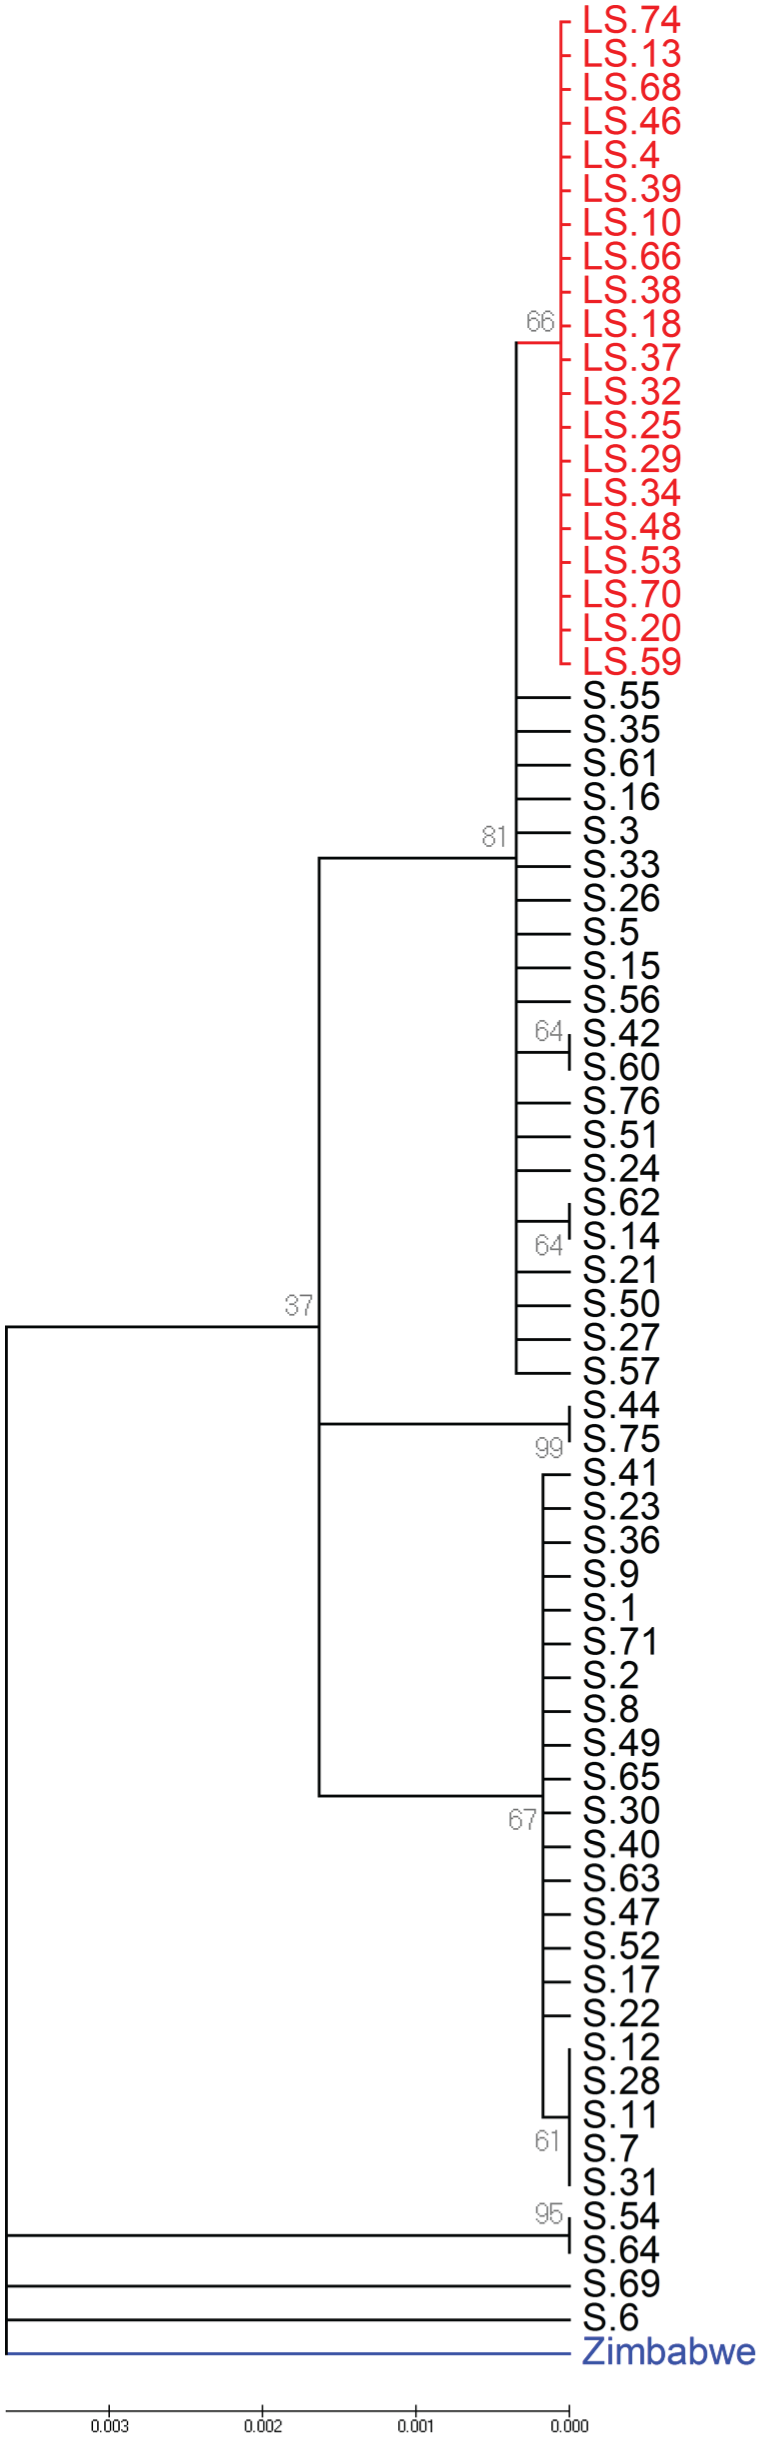
Neighbour Joining tree. Linearized tree with Kimura 2-parameter model, where gaps were treated as pairwise deletions. Red, ls-tim sequences; black, s-tim; blue, African (Zimbabwe). Sequences marked 1-23, 24-44, and 46-75 were collected from Spanish populations SP-22, SP-35, and SP-53 (Suppl. Table S1). Gray numbers indicate bootstrap values. The horizontal scale represents substitutions per site.
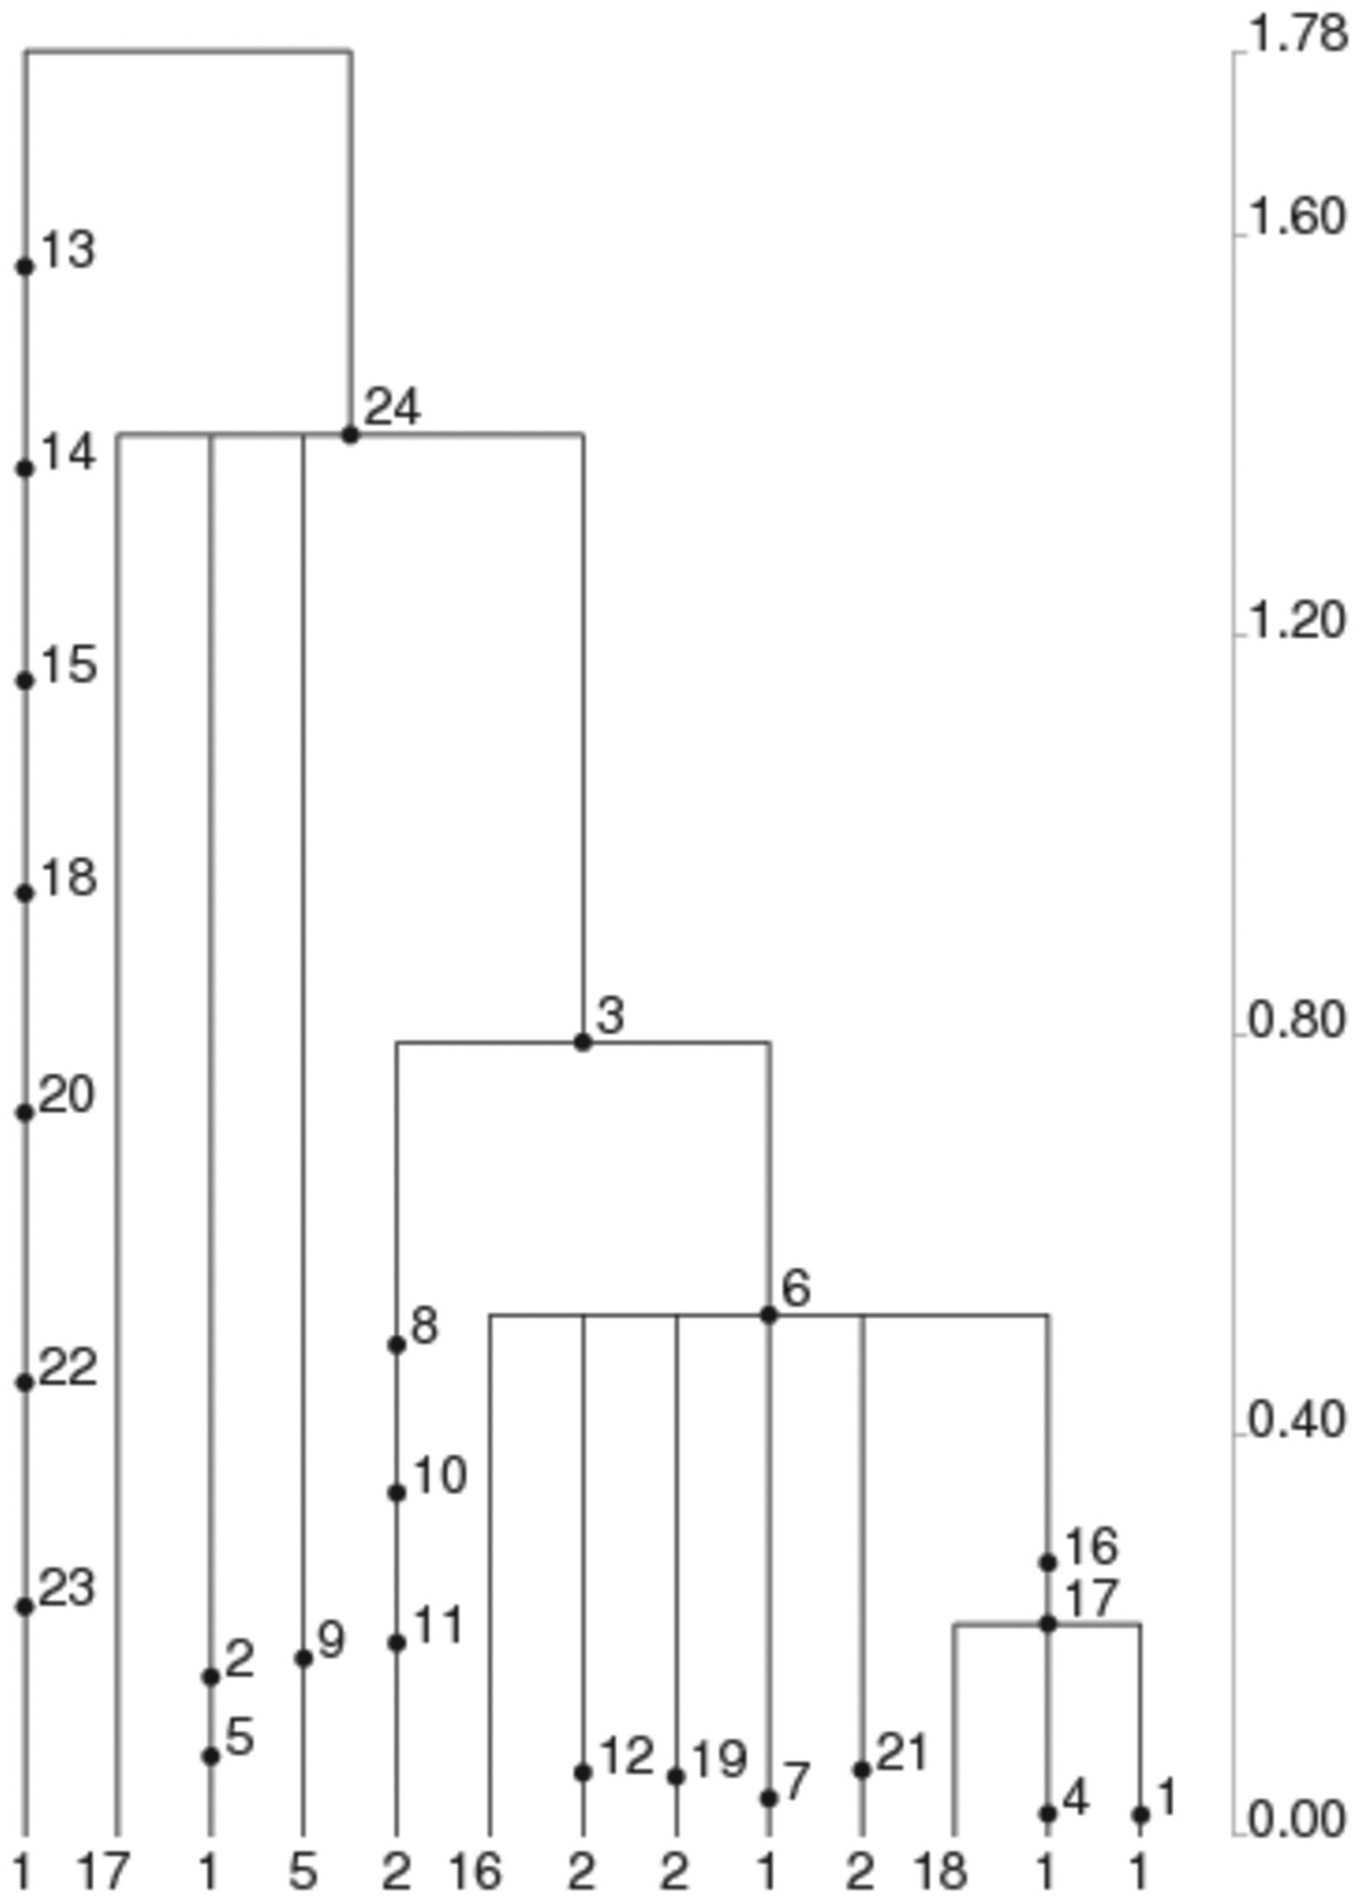
Coalescent tree and mutations in tim generated by GENETREE. ls-tim polymorphism represented by mutation 17, haplotype frequencies shown at the bottom. The vertical timescale on the right indicates coalescent units.
Estimation of the age of ls-tim.
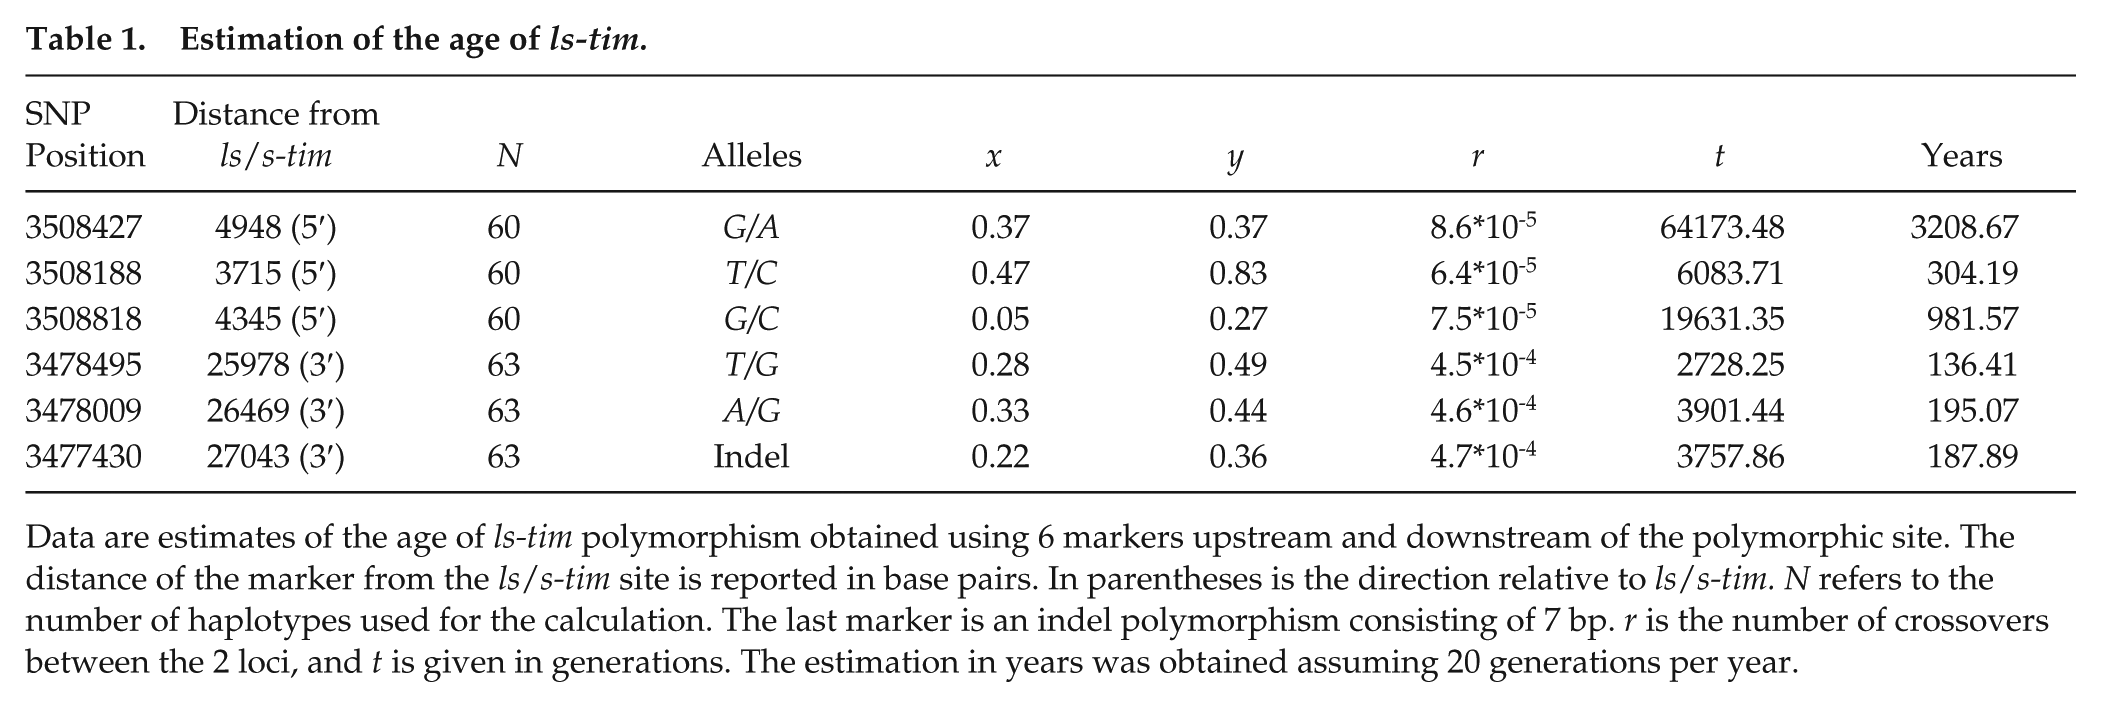
Data are estimates of the age of ls-tim polymorphism obtained using 6 markers upstream and downstream of the polymorphic site. The distance of the marker from the ls/s-tim site is reported in base pairs. In parentheses is the direction relative to ls/s-tim. N refers to the number of haplotypes used for the calculation. The last marker is an indel polymorphism consisting of 7 bp. r is the number of crossovers between the 2 loci, and t is given in generations. The estimation in years was obtained assuming 20 generations per year.
Neutrality Tests Further Suggest the Role of Natural Selection
We also conducted neutrality tests using sequences obtained from individuals collected in 3 locations in Spain
Neutrality tests.
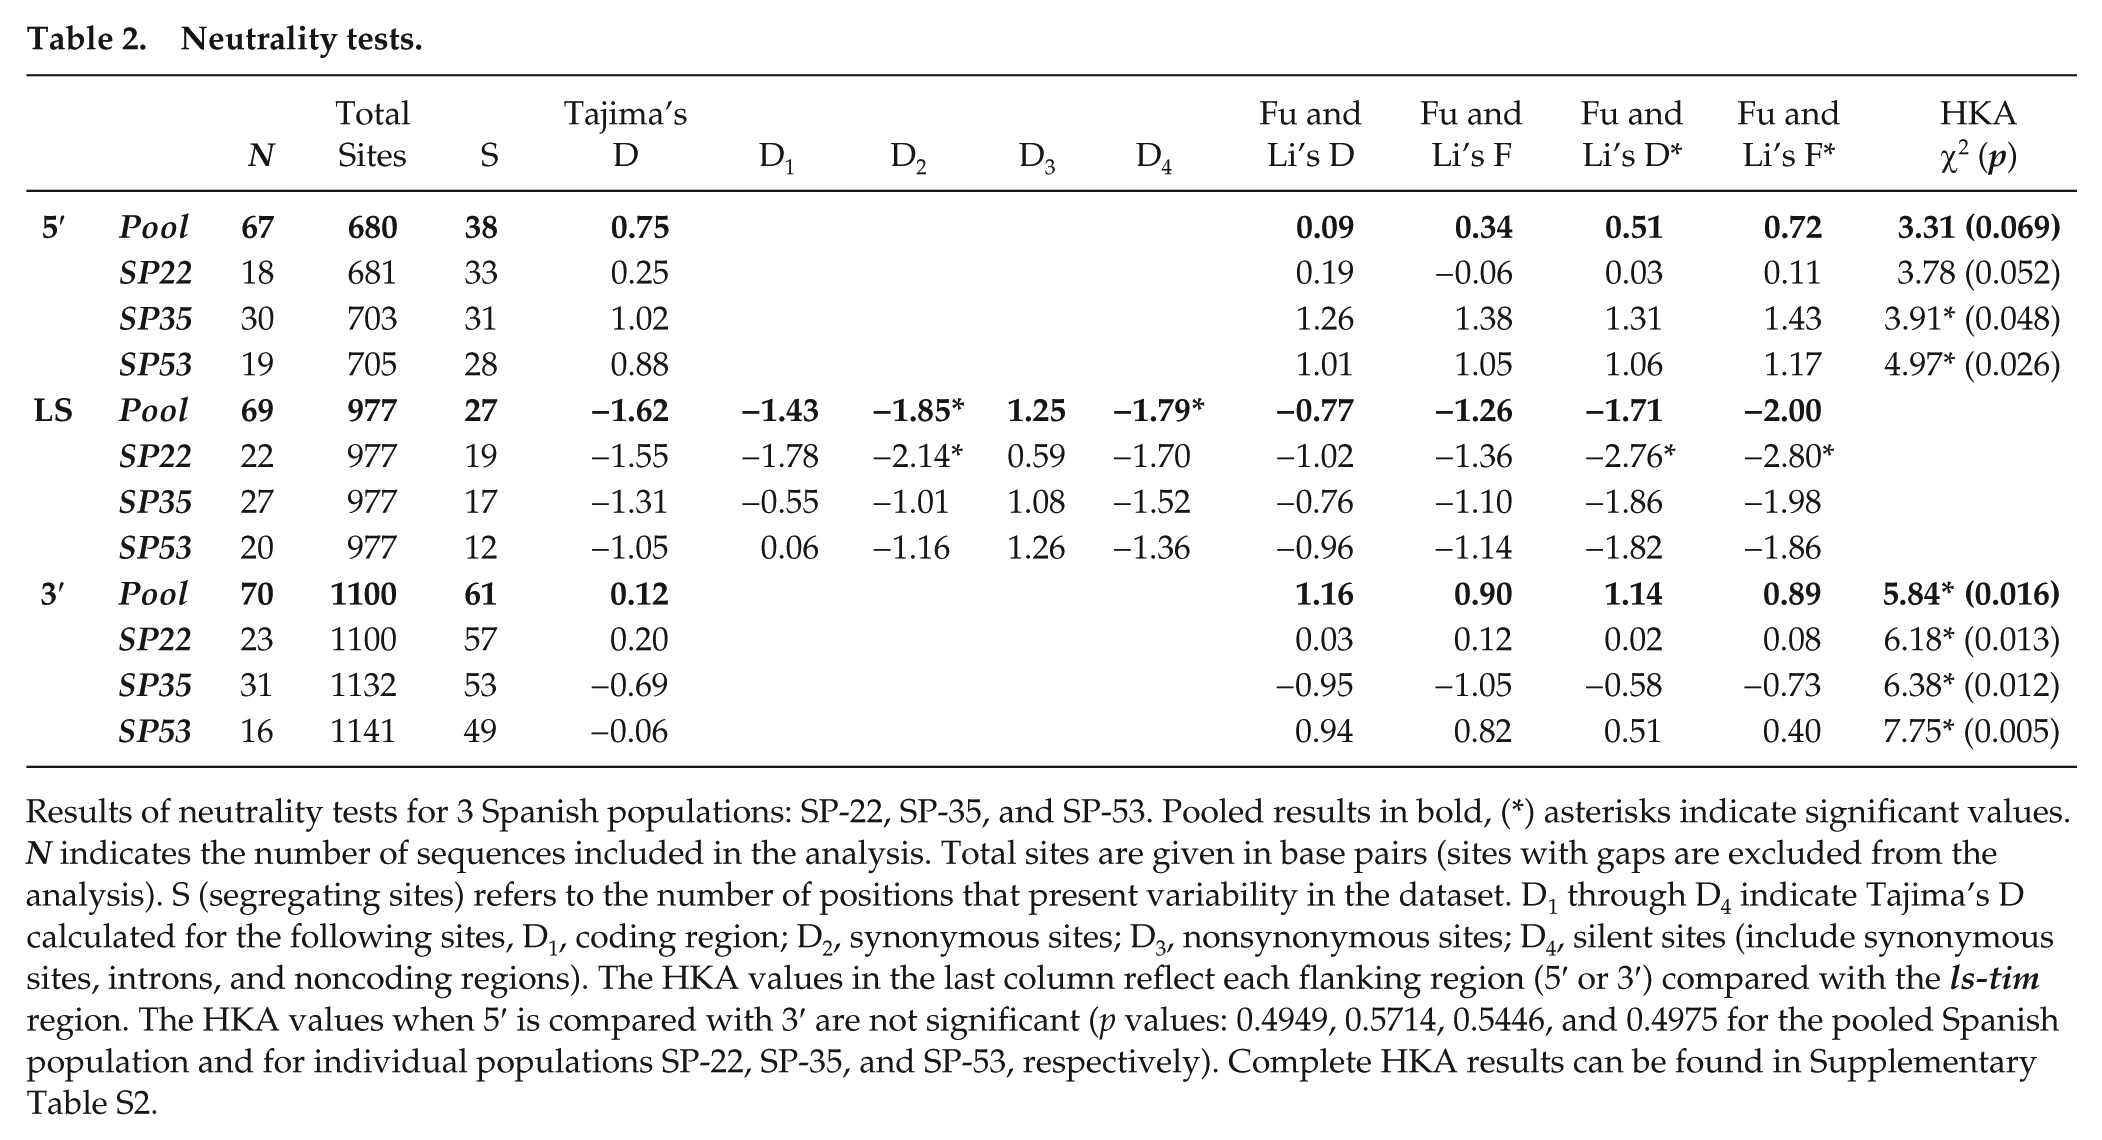
Results of neutrality tests for 3 Spanish populations: SP-22, SP-35, and SP-53. Pooled results in bold, (*) asterisks indicate significant values. N indicates the number of sequences included in the analysis. Total sites are given in base pairs (sites with gaps are excluded from the analysis). S (segregating sites) refers to the number of positions that present variability in the dataset. D1 through D4 indicate Tajima’s D calculated for the following sites, D1, coding region; D2, synonymous sites; D3, nonsynonymous sites; D4, silent sites (include synonymous sites, introns, and noncoding regions). The HKA values in the last column reflect each flanking region (5′ or 3′) compared with the ls-tim region. The HKA values when 5′ is compared with 3′ are not significant (p values: 0.4949, 0.5714, 0.5446, and 0.4975 for the pooled Spanish population and for individual populations SP-22, SP-35, and SP-53, respectively). Complete HKA results can be found in Supplementary Table S2.
The HKA test compares the levels of nucleotide polymorphism within species and patterns of sequence divergence between species from at least 2 genomic regions. Under a neutral scenario, the level of polymorphism between the 2 regions should be proportional to the level of species divergence between these regions, and any deviation from this expectation suggests the presence of selection (Hudson et al., 1987). In our analysis, sequences from D. simulans were used for the interspecies (divergence) comparison. Comparing the region that includes the ls/s-tim polymorphism to either of the 2 intergenic flanking regions (5′ and 3′ that would be expected to be evolving neutrally) gives significant (or almost significant) deviations from neutral expectations, with the ls region showing less intraspecific variability than expected, consistent with a signature of directional selection. In contrast, comparing the 2 flanking intergenic regions with each other does not give a significant HKA statistic regardless of the dataset used (Table 2 and Suppl. Table S2). These analyses further suggest that directional selection is acting on the ls/s-tim region rather than more generally on that region of the second chromosome.
We have also carried out a coalescent simulation using the “ms” software (Hudson, 2002), which tests whether the observed Tajima’s D could be explained simply by a bottleneck out-of-Africa model. Parameters used in the model (without recombination) were those previously reported (Saminadin-Peter et al., 2012). Simulations were performed 100,000 times to calculate Tajima’s D distribution under these conditions. For each of the 3 loci that were tested, negative values of Tajima’s D were observed as expected under the bottleneck, but the 95% quantile for Tajima’s D was very similar and largely overlapped among the sites: 5′ (−2.72 to −2.60), LS (−2.6 to −2.52), and 3′ (−2.64 to −2.52). This contrasts the results observed in Table 2, where the pooled Tajima’s D values were negative for ls-tim but positive for 5′ and 3′ sites, reflecting a similar pattern to results observed for the non-Spanish populations in two 3′ regions (Tauber et al., 2007).
Microsatellite Analysis Suggests Minimal Demographic Contributions
Could similar results be generated by demographic processes alone, without the necessity of inferring the action of natural selection? D. melanogaster is a human commensal, so might a general “out-of-southern Italy” scenario have carried the ls-tim variant north and south of Italy, perhaps during the Roman expansion, when ls-tim might have arisen? If this was the case, many other neutral loci spread throughout the D. melanogaster genome should show similar geographical distributions. We therefore reanalyzed the allelic frequency of 49 neutral microsatellite loci genotyped from lines collected in 8 different locations in Europe (Nunes et al., 2008). We investigated the correlation between 106 major microsatellite allele gene frequencies and distance from Novoli (Italy) from these 49 loci. While 9 of these loci show at least 1 allele whose frequency has a significant correlation with latitude, only 3 of these loci have 1 allele whose frequency changes significantly with overland distance from Novoli (all correlations p < 0.05, but without correction for multiple testing [Suppl. Tables S3 and S4]. When multiple testing is applied, none of the loci are significant). Thus, a general population expansion of flies from southern Italy is unlikely to explain the current ls-tim frequencies.
Discussion
Our results suggest that the tim polymorphism provides a rare snapshot of a newly derived mutation that appears to be spreading under natural selection and which can be understood at phenotypic, molecular, and population levels (Tauber et al., 2007; Sandrelli et al., 2007). Our various experiments all come to similar conclusions that ls-tim is spreading through Europe under seasonal selection from a very recent point of origin in southeastern Italy. The finding of inverse clines in the 2 Mediterranean peninsulas was particularly relevant and clearly indicated that we are not dealing here with a classic latitude-mediated balanced polymorphism. This may be a reflection of the recent age of the new allele, which has not yet had time to either go to fixation or reach frequencies that may generate a classic balanced polymorphism. Yet latitudinal factors are important in the spread of ls-tim, given that the high latitudes of Europe represent a seasonal photoperiodic and thermal environment that is dramatically different from that found in the very low latitudes of the species’ ancestral sub-Saharan homeland. Thus, the new European mutation ls-tim was particularly well equipped due to its reduced circadian photosensitivity, which we presume could help to maintain rhythmicity even under the very long photoperiods of a northern European summer (Pittendrigh et al., 1991) and its associated enhanced diapause to withstand the rigors of the European winters (Tauber et al., 2007; Sandrelli et al., 2007). Our work on ls-tim therefore shows some parallels with the studies of the spread of adaptive coloration genes in deer mice populations (Manceau et al., 2011; Linnen et al., 2009; Linnen et al., 2013). Furthermore, Figure 1B highlights the contribution of latitude in determining ls-tim frequency. Flies collected in Spain (red) are characterized by a frequency of ls-tim 10% lower than that of flies collected at the same distance from Novoli but at higher latitude. This observation allows us to rule out the possibility that the observed cline might be due to a relaxed selection in the North, perhaps caused by the presence of genetic backgrounds that historically carry more diapause-favoring alleles. Finally, the D. melanogaster colonization of Europe from sub-Saharan Africa resonates with the similar migrational history of Homo sapiens (Stewart and Stringer, 2012). While there is no consistent evidence for any correlation between latitude and DNA sequence variation in human clock genes, variation at the hPeriod2 locus does reveal evidence for directional selection in non-African populations (Cruciani et al., 2008). It is tantalizing to consider that mammalian Period2 is required for circadian light resetting (Albrecht et al., 2001) and, like the TIM protein in flies (Myers et al., 1996), plays a major role in photic responses of the circadian clock. Thus, the colonization of Europe by D. melanogaster and Homo sapiens from sub-Saharan Africa may have exposed both species to novel photoperiod-related selection pressures on these 2 clock genes, adapting them to their new seasonal environments, and leaving the signatures of directional selection in their corresponding DNA sequences.
Footnotes
Acknowledgements
This work was funded by grants from the European Community (the 6th Framework Project EUCLOCK No. 018741 and the 7th Framework Project INsecTIME No. 316790) to R.C. and C.P.K., a NERC and a BBSRC grant to E.T. and C.P.K. We thank Christian Schlötterer for providing the raw microsatellite data. V.Z. and S.V. collected the populations in Spain. V.Z. analyzed the population data and performed the neutrality tests, phylogenetic analyses, and microsatellite study. E.T. collected the populations in the UK and Sweden, advised and helped with the phylogenetic analyses and the bottleneck simulation, and provided the new European populations. C.P.K. and R.C. conceived the study, R.C. initially maintained the Spanish populations, C.P.K. supervised the study, and C.P.K. and V.Z. wrote the manuscript.
Notes
References
Supplementary Material
Please find the following supplemental material available below.
For Open Access articles published under a Creative Commons License, all supplemental material carries the same license as the article it is associated with.
For non-Open Access articles published, all supplemental material carries a non-exclusive license, and permission requests for re-use of supplemental material or any part of supplemental material shall be sent directly to the copyright owner as specified in the copyright notice associated with the article.