
Abstract
Circadian rhythms are observed in most organisms on earth and are known to play a major role in successful adaptation to the 24-h cycling environment. Circadian phenotypes are characterized by a free-running period that is observed in constant conditions and an entrained phase that is observed in cyclic conditions. Thus, the relationship between the free-running period and phase of entrainment is of interest. A popular simple rule has been that the entrained phase is the expression of the period in a cycling environment (i.e., that a short period causes an advanced phase and a long period causes a delayed phase). However, there are experimental data that are not explained by this simple relationship, and no systematic study has been done to explore all possible period-phase relationships. Here, we show the existence of stable period-phase relationships that are exceptions to this rule. First, we analyzed period-phase relationships using populations with different degrees of genome complexity. Second, we generated isogenic F1 populations by crossing 14 classical period mutants to the same female and analyzed 2 populations with a short period/delayed phase and a long period/advanced phase. Third, we generated a mathematical model to account for such variable relationships between period and phase. Our analyses support the view that the circadian period of an organism is not the only predictor of the entrained phase.
Keywords
Introduction
Organisms, from bacteria to humans, experience predictable and unpredictable environmental changes. The ability of an organism to predict incoming stresses and resources could serve a selective advantage, and biological clocks underlie such an ability; the clock with an approximately 24-h period is called the circadian clock (Bass and Lazar, 2016; Panda, 2016; Roenneberg and Merrow, 2016). Among the features of a typical circadian clock (Pittendrigh, 1993; Dunlap and Loros, 2017) are its free-running period (τ), the time that the oscillator takes to complete 1 full cycle in constant conditions, and phase of entrainment (ψ), the stable time difference between a defined phase of a behavioral or physiological rhythm and the cycling environmental signal (zeitgeber) that synchronizes it to 24 h.
Natural selection is predicted to favor a circadian period close to 24 h because this eases the process of entrainment to the daily solar cycle (Pittendrigh, 1993; Bordyugov et al., 2015; Roenneberg and Merrow, 2016). However, since ψ is a feature expressed in natural conditions, it is the expected target of natural selection. Variation in ψ among natural populations is likely to reflect differences in selection on circadian parameters in their progenitors (Darrah et al., 2006; Bordyugov et al., 2015). Since ψ is critical to the evolution of the circadian clock, it is important to learn how ψ is determined (Roenneberg et al., 2003).
There have been significant efforts in theoretical and empirical studies to understand the mechanisms determining ψ, while recent work has focused mostly on elucidating molecular mechanisms that determine τ (Roenneberg et al., 2003; Rémi et al., 2010). There are several factors that influence ψ when τ and the period of the entraining cycle do not match: zeitgeber strength or amplitude (Aschoff, 1960; Abraham et al., 2010), zeitgeber period (Aschoff and Pohl, 1978; Merrow et al., 1999; Rémi et al., 2010), amplitude of the oscillator (Lakin-Thomas et al., 1991; Pittendrigh et al., 1991), amplitude relaxation rate and coupling among oscillators (Abraham et al., 2010), and photoperiod (Rémi et al., 2010; Schmal et al., 2015).
A simple “rule” on the relationship between τ and ψ—that a short τ leads to an earlier (advanced) ψ and a long τ leads to a later (delayed) ψ—has been supported by some dramatic examples. The short period mutant tau in the Syrian hamster showed an advanced ψ (Ralph and Menaker, 1988; Lowrey et al., 2000); a short period allele of period in Drosophila melanogaster showed an advanced ψ and a long period allele a delayed ψ (Hamblen-Coyle et al., 1992; Saunders et al., 1994); a short period allele of frequency, frq1, in Neurospora crassa showed an advanced ψ and a long period allele frq7 a delayed ψ (Rémi et al., 2010); and even in human sleep disorders, with mutations in hPer2 in familial advanced sleep phase syndrome (FASPS) and in CRY in familial delayed sleep phase syndrome (Toh et al., 2001; Patke et al., 2017).
However, this simple view does not explain all available data. The seminal work in explaining FASPS as the result of a short τ was based on the data from 1 patient (Jones et al., 1999). In elderly individuals, advanced ψ cannot be explained by a shortened τ with age (Duffy et al., 1998; Duffy and Czeisler, 2002). There are also examples in clock mutants that showed an altered ψ without a change in τ (Kaldi et al., 2006; Heintzen and Liu, 2007). Although there are many genetic resources available to examine the relationship between ψ and τ, most of the studies have focused on τ (Loros and Dunlap, 2001; Martinek et al., 2001; Xu et al., 2005; Yerushalmi et al., 2011).
We wished to systematically test the relationship between ψ and τ using the model system Neurospora crassa and considered 3 different options: (1) association study among natural populations, if there is a causative relationship between ψ and τ; (2) biological aging or pharmaceutical alteration of τ; and (3) genetic alteration of τ.
In our previous study using the first approach, we could not observe meaningful correlations between ψ and τ among 564 F1 strains in 3 mapping populations (supplementary figure 1 in Kim et al., 2007). However, we could not make a definitive conclusion since we analyzed only 3 mapping populations generated from 6 ecotype parents. The second approach could be interesting, and there are reports showing that τ is altered based on an organism’s age, nutritional condition, and pharmaceutical chemical treatment (Dharmananda, 1980; Kohsaka et al., 2007; Patton et al., 2016). However, the value of ψ in individuals with such altered τ might reflect confounding effects because of other age-related or chemical-caused secondary effects and may not lead to a definitive conclusion. Thus, we chose to use the genetic approach to test the universality of the simple rule relating ψ and τ (i.e., shorter τ, advanced ψ; longer τ, delayed ψ).
In the current study, we first examined the correlation between τ and ψ in 3 different populations of N. crassa, with different genetic complexities—natural accessions, near-isogenic strains produced by backcrosses, and classical single gene mutants—and found no simple linear relationship between τ and ψ in all populations studied. Then, we generated 14 isogenic F1 populations by crossing classical period mutants to a common female strain and analyzed 2 populations that violated the rule. Finally, to characterize the parameter(s) that determine the relationship between ψ and τ, we developed a mathematical model. There are previous deterministic models characterizing ψ based on multiple factors in the literature (Abraham et al., 2010; Schmal et al., 2015), but we sought a model that could account for our new experimental results.
Materials And Methods
Strains and Growth Conditions
We obtained 75 natural ecotypes and 14 other classical mutants from the Fungal Genetics Stock Center (www.fgsc.net). N453 is the BC3 (backcross third generation) between FGSC 4715 and FGSC 4720. FGSC 4720 has been a recurring female strain for backcrosses. Strains used in this study were cultured as previously described (Lee et al., 2003). The list of strains used in this study and the analyzed data set to make figures are available in the supplementary data.
Assessing Phenotype
N. crassa, a model organism for the study of circadian rhythm, expresses its rhythm by alternating areas of asexual spore formation (conidiation) with areas of thinner hyphal growth without spore formation when growing on solid agar medium. Areas of spore formation are known as “bands,” and thinner areas without spore formation are known as “interbands.” The observed overt rhythm has a periodicity of about 24 h in constant environmental conditions (free-running period). The rhythm is also reset (entrained) by environmental cues in a cycling environment, which allows the internal clock to align its internal time to the local time. The overt clock phenotypes including τ and ψ were measured using the inverted race tube assay (Park and Lee, 2004). Race tubes were incubated in constant light (LL) for 12 h at room temperature. After confirming normal mycelial growth in the race tube, tubes were transferred to an I-36L Percival Scientific (Perry, IA) growth chamber and incubated an additional 12 h under LL. For all experiments, temperature was set at 25 °C. After the 24-h LL treatment, the light was off for the rest of the experiment for the τ measurement. The growing front was marked at the light-to-dark transition and on the last day of the experiment. In the race tube experiment for the ψ phenotype, the light condition was a light 12 h:dark 12 h (LD) cycle. The growing front of the culture in the race tube was marked every 24 h at the time when the light-to-dark transition occurred. The fluence rate was 250 µE/m2/sec in LL. Light sources were white fluorescent bulbs and incandescent bulbs (Osram Sylvania, Danvers, MA). In both τ and ψ experiments, tubes were randomly positioned within the chamber to reduce the possibility of positional effects. In each experiment, 3 replicates of each progeny were assayed. We repeated the experiment to generate data from at least 3 biological replicates for each strain.
τ Analysis
For the analysis of τ phenotype, individual τ estimates of F1 progenies of each population were produced after 4 to 5 days of consecutive conidial banding, using the fast Fourier transform nonlinear least-squares program (Plautz et al., 1997; Zielinski et al., 2014) and the program Chrono (Roenneberg and Taylor, 2000).
ψ Analysis
The reference phase of individual genotype/progeny was the conidial band center. Thus, the ψ of individual progeny was determined based on the time elapsed to reach the band center within a day. The time when cultures were transferred to the dark cycle is, by definition, CT12 (dusk). Thus, in these experiments, the time in the band center of an individual was calculated by the following formula: zeitgeber (ZT) ψ = (growth to band center/overall growth) × 24 + 12. For example, if a conidial band occurs at 180 mm and the total growth after light-dark transition is 280 mm, ZT ψ = 24 × (180/280) + 12 = 27.43. By convention, ZT is always expressed as 24 ZT h. For example, ZT ψ 27.43 is expressed as ZT 3.43 (27.43 – 24) instead of ZT 27.43. We used the program Chrono to calculate ψ (Roenneberg and Taylor, 2000).
Mathematical Model
We model the relationship between ψ and τ with a set of ordinary differential equations (ODEs). Because our focus is on this relationship, we do not model the range of entrainment (i.e., the range of zeitgeber periods to which an oscillator is able to entrain), which depends also on oscillator amplitude and zeitgeber strength (Abraham et al., 2010; Granada et al., 2013). Our model consists of 3 oscillators: the periodic signal representing the environmental rhythm (zeitgeber, θ
Z
), the periodic expression of a light-sensitive protein (θ
p
), and the periodic expression of an endogenous clock (θ
E
). The zeitgeber entrains the light-sensitive protein at a specific time of day, for instance, during the time when light-to-dark transition occurs (dusk). The model identifies the start of an oscillator’s period with 0 and the completion of a full cycle with 2π. The zeitgeber oscillator represents the diurnal cycle, and dawn is represented as θ
Z
= 0, while dusk is θ
Z
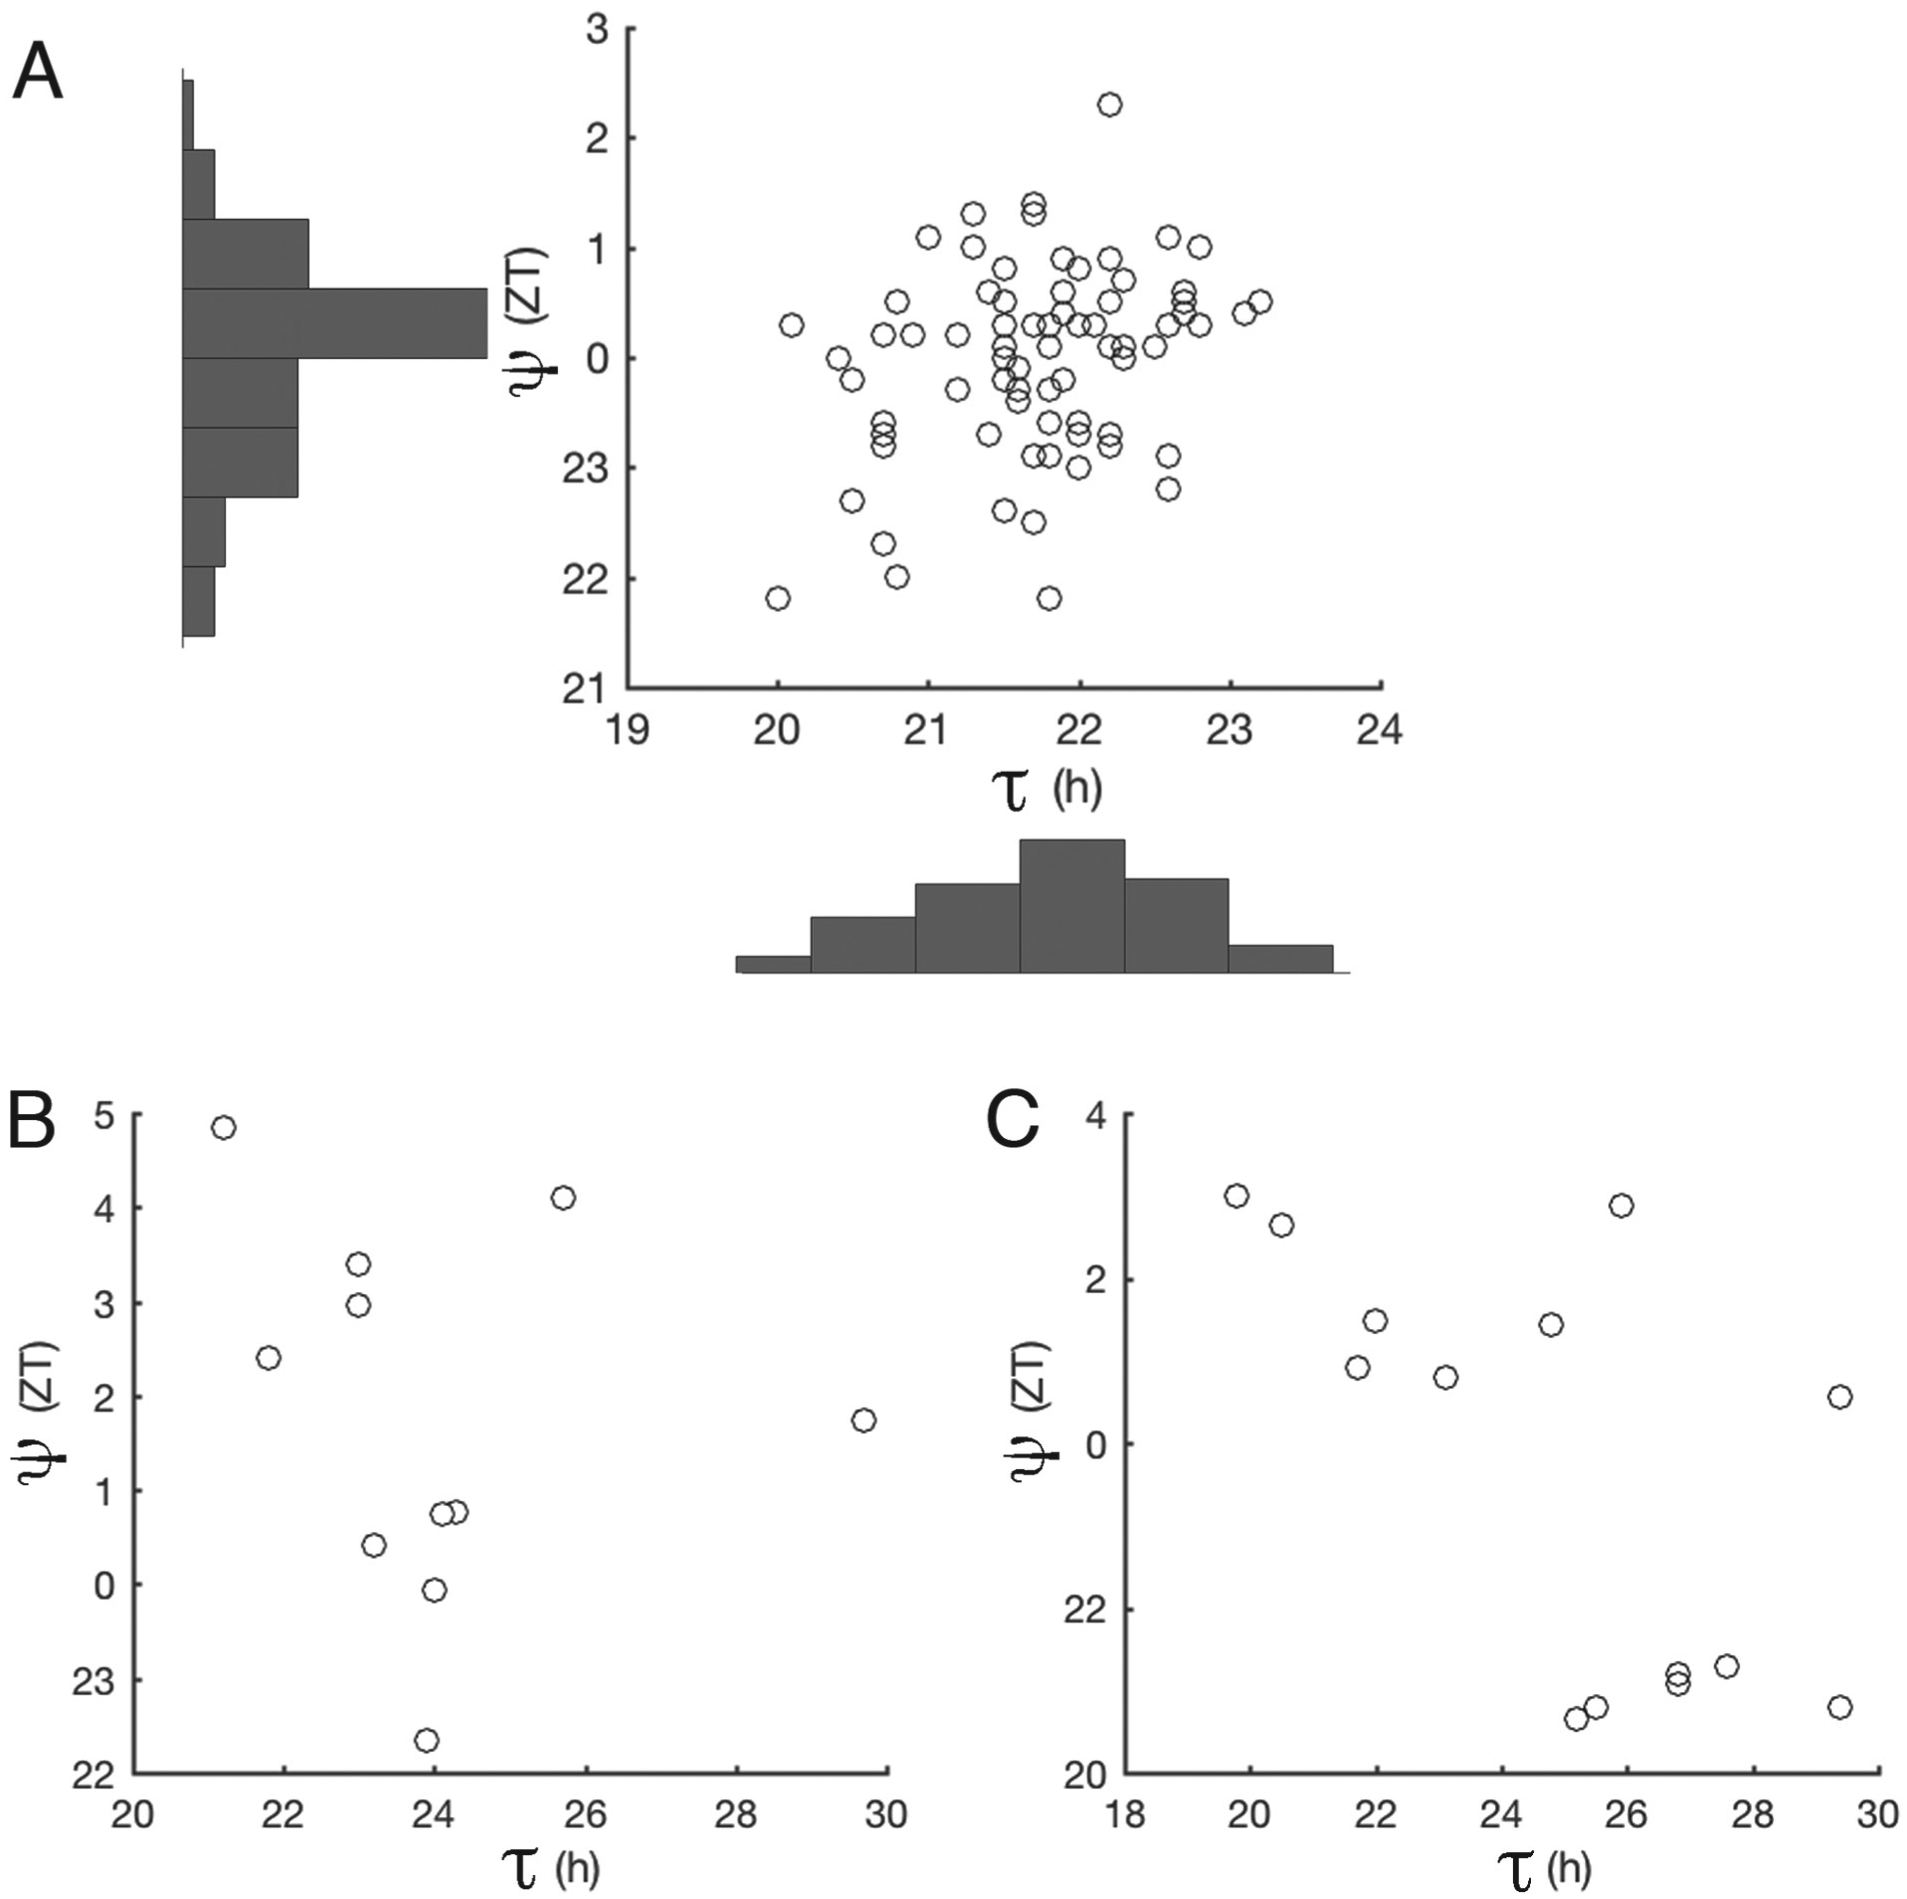
= π (π = 12 h, for the zeitgeber cycle). This is halfway through the zeitgeber cycle beginning at dawn. In our model, we specify how close the zeitgeber must be to dusk with a parameter denoted ε, which is the radius of the time window that defines when the zeitgeber is “close enough” to dusk for entrainment to occur. For instance, with parameter
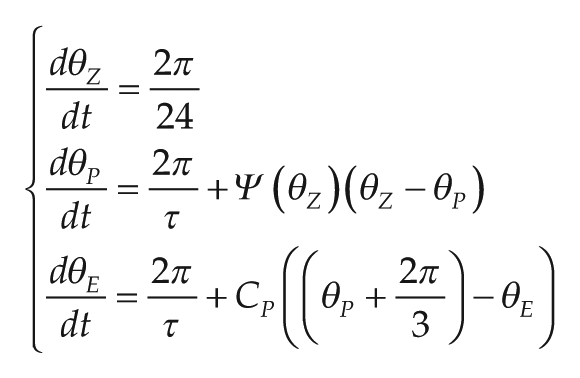
In the system above, we show the 3 oscillators and the differential equations that govern them; τ is the endogenous period of the biological clock. Entrainment is modeled in 2 stages; each stage synchronizes 2 clocks together by a term in the style of the Kuramoto model (Kuramoto, 1984). The first stage of entrainment is described by the term Ψ(θZ)(θZ – θ
P
), which synchronizes θ
P
with θ
Z
. The second stage is described by the term
Simulations
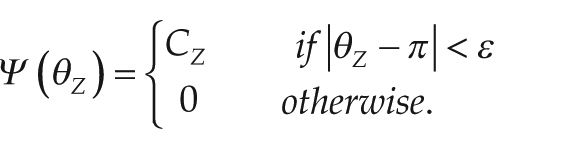
In our simulations, we visualize the periodic signals over time of the endogenous clock and the zeitgeber by plotting sin(θ E ) and sin(θ Z ), respectively. We measure the phase of entrainment (ψ) between the endogenous signal and the zeitgeber by comparing the time corresponding to the peak signal (shown in Fig. 1B). The phase of entrainment is defined as

where Φ is the phase of the zeitgeber and ϕ is the phase of the entrained biological oscillation. Note that ψ < 0 implies a delayed ψ, and ψ > 0 implies an advanced ψ. For every day (peak of the zeitgeber), we measure ψ (Fig. 1B) by observing the time coordinate of the closest peak of the endogenous clock to the zeitgeber peak. When we run our simulations, we observe how ψ changes from day to day. Plots of time versus ψ are shown in Figure 1C. The ψ between the zeitgeber and the endogenous clock changes over consecutive days and then finally stabilizes to a stable ψ. The code to generate Figure 1C is available in the supplementary data.
Mathematical model. (A) A cartoon describing the mathematical parameters in a biological system. The zeitgeber (θ
Z
) entrains photosensitive protein (θ
P
), and the time derivative for the state of this protein (
Results
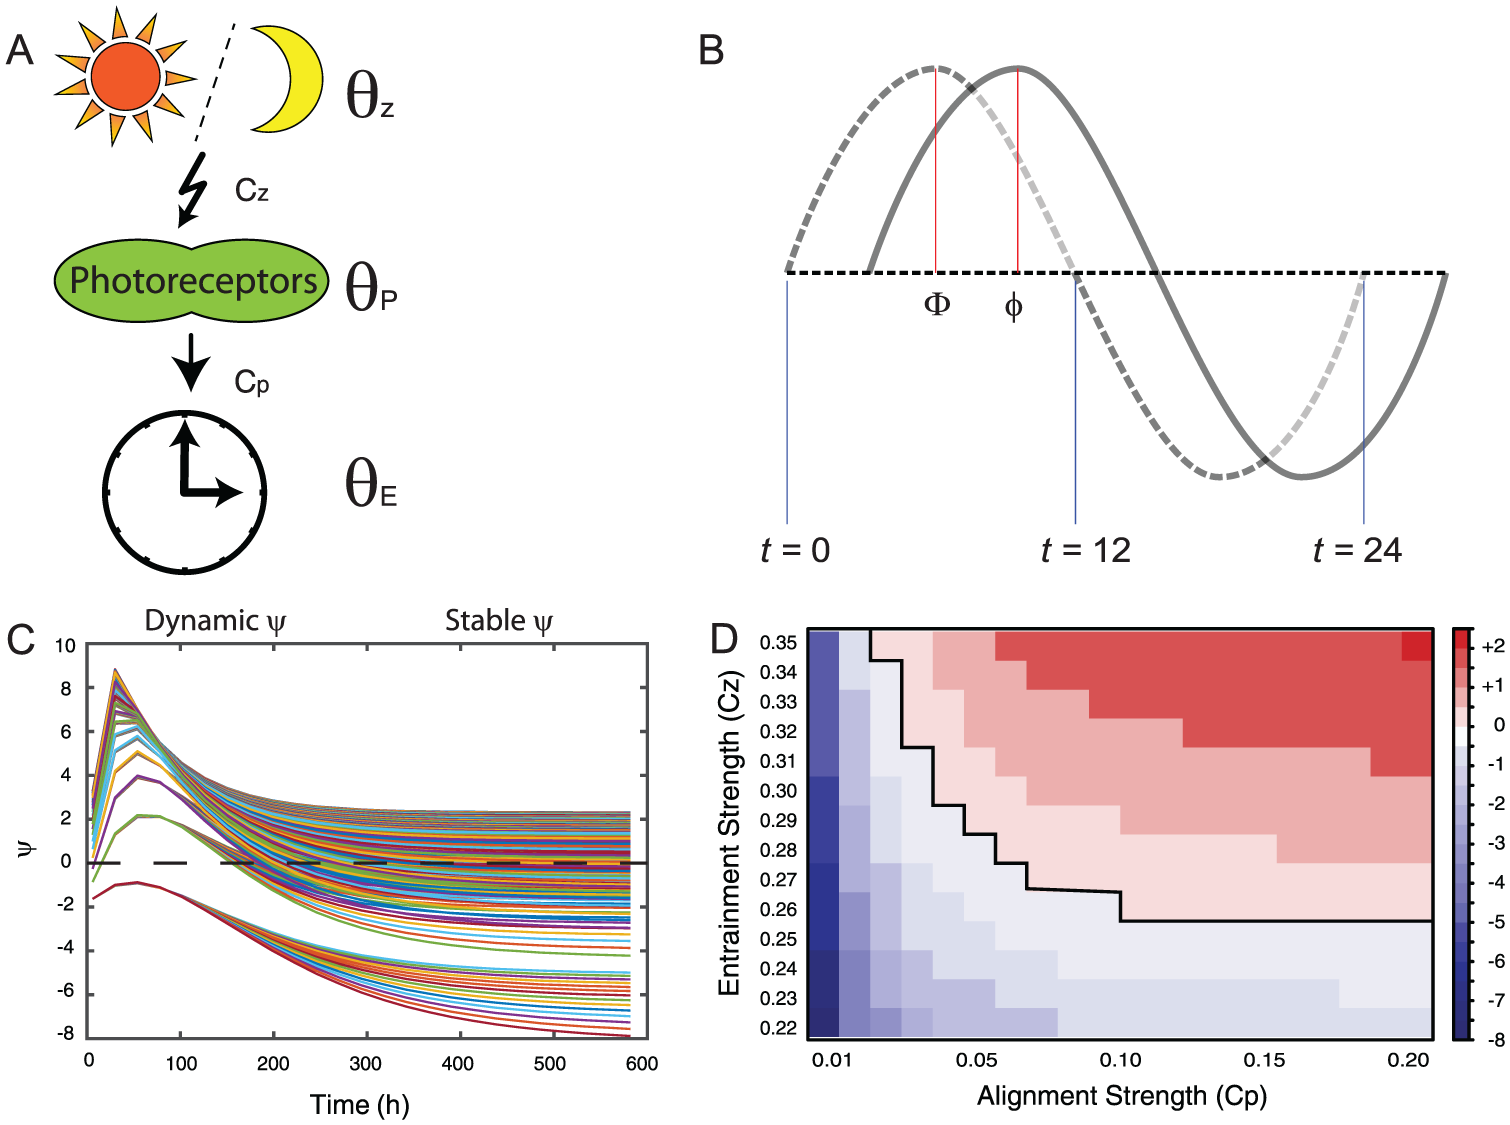
We measured τ and ψ among 75 natural N. crassa ecotypes and found a weak correlation between them, Pearson correlation r = 0.3, p < 0.01 (Fig. 2A).
τ/ψ correlation in 75 natural ecotypes (A), 9 BC3 near-isogenic lines (B), and 14 classical mutants (C).
Since these natural ecotypes are adapted to different habitats and have different genetic backgrounds, we measured circadian traits among 9 near-isogenic lines (NIL) N453 (see the Materials and Methods section). In theory, these NIL should share 93.75% of the recurrent female’s genome. We still found no apparent correlation between τ and ψ (Pearson correlation r = −0.18, p = 0.59, Fig. 2B). Next, we measured τ and ψ of the 14 classical mutants of τ. There was an apparent negative correlation between τ and ψ among mutants (Pearson correlation r = −0.64, p = 0.01; Fig. 2C). However, this apparent negative correlation is due to the convention of ZT hours expressed as discontinuous numbers (e.g., ZT 1 = ZT 25). When the ψ data are expressed as continuous numbers, the correlation between τ and ψ among all the tested mutants is reduced (Pearson correlation r = 0.46,p = 0.09, Fig. 2C).
To further test the relationship between τ and ψ using the F1 populations, we crossed the classical mutants to the common strain FGSC 4720. We chose 2 classical mutant alleles, a short period mutant cys-9 (FGSC 2160) and a long period mutant prd-1 (FGSC 4902), for further analysis.
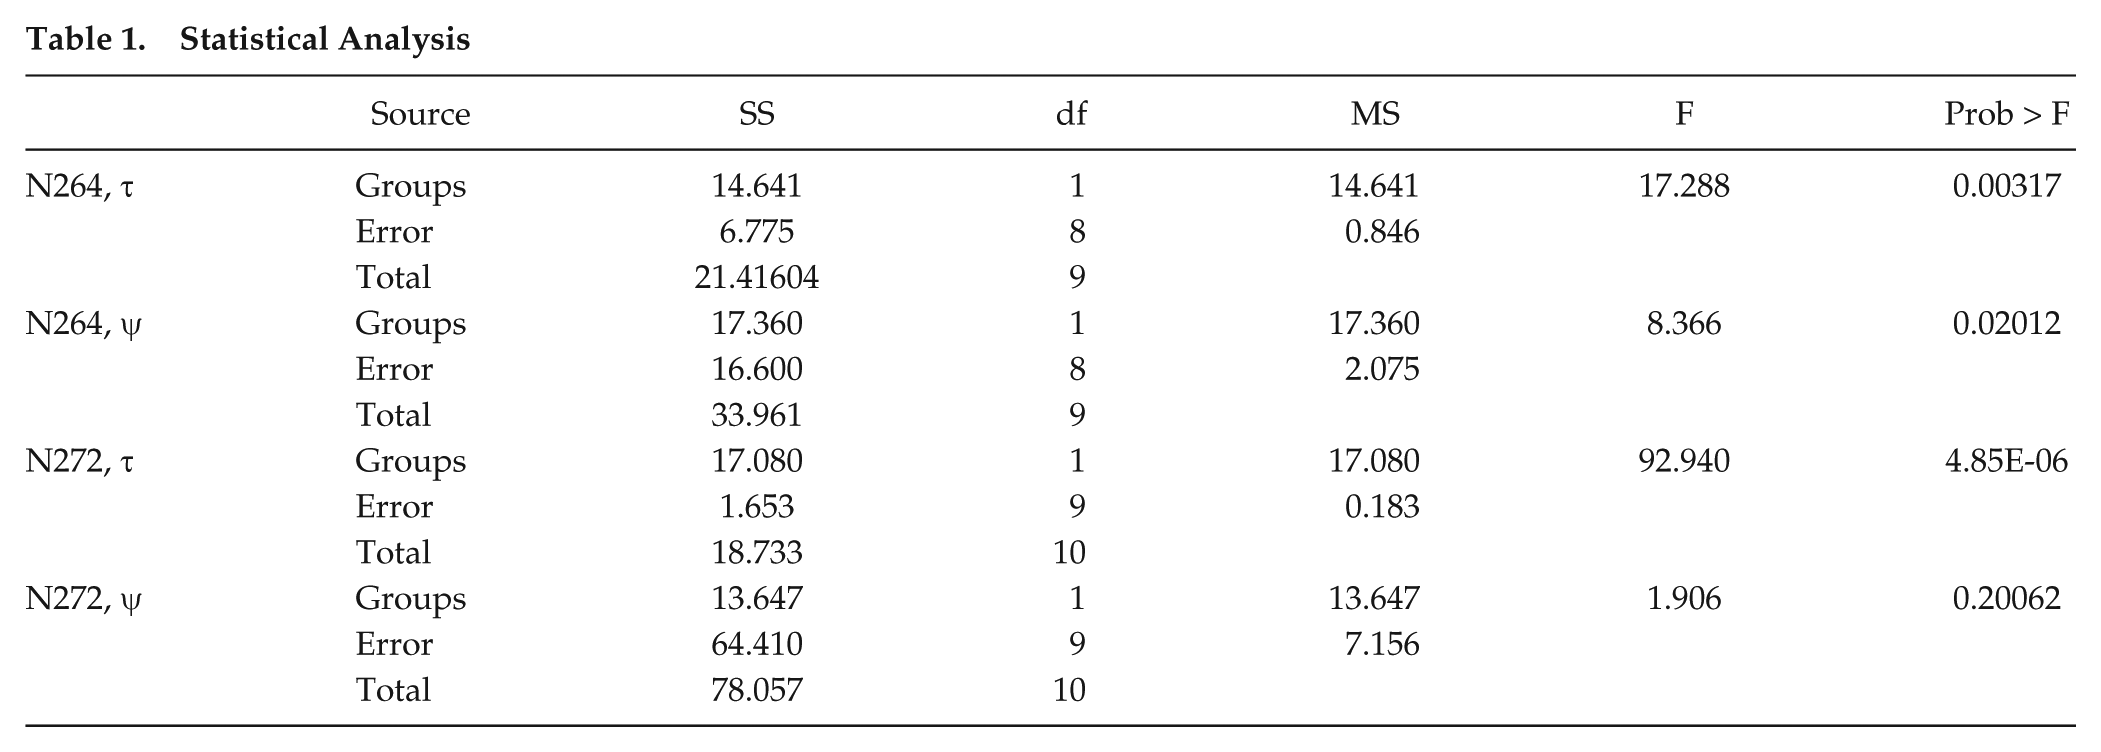
There were 2 subpopulations with different periods as expected (Fig. 3A, C). More interestingly, there were statistically significant differences in the ψ’s of the subpopulations (Fig. 3B, D; Table 1). The short τ progeny in N264 had a delayed ψ (Fig. 3B), and the long τ progeny in N272 had an advanced ψ (Fig. 3D). These populations represent a stable τ and ψ relationship that does not obey the simple rule that is thought to relate τ and ψ (i.e., shorter τ, advanced ψ; longer τ, delayed ψ). To understand the parameter space that would produce our experimental relationship, we turned to mathematical modeling.
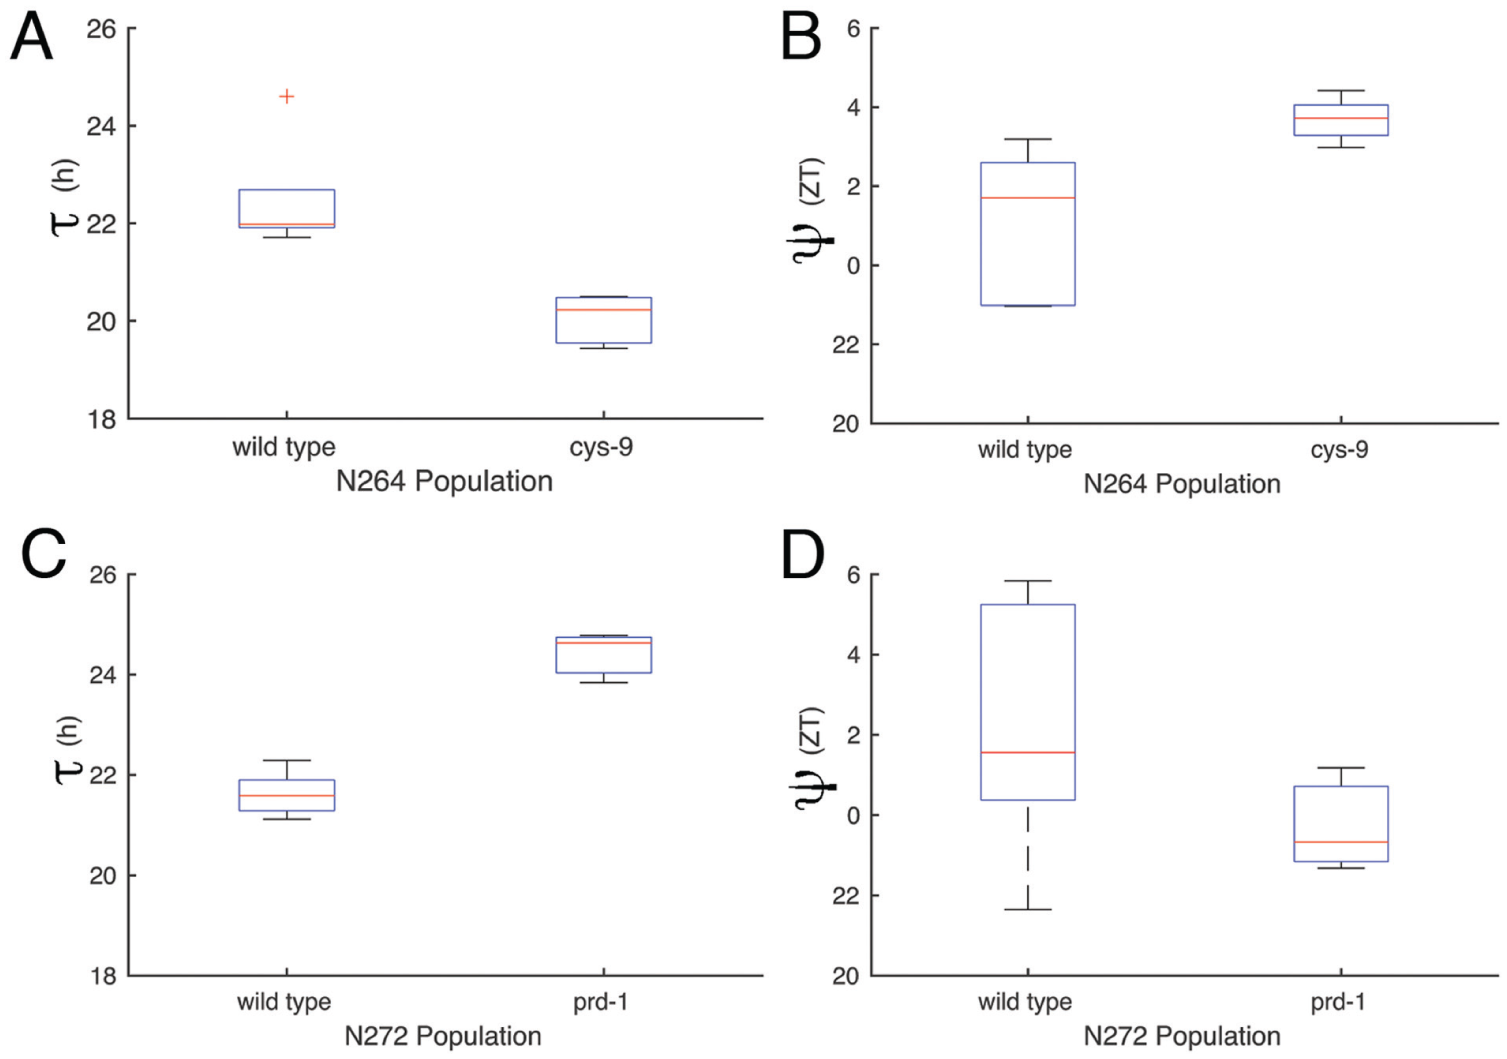
A significant correlation between τ and ψ of F1 populations; a short period (cys-9, N264) and a long period (prd-1, N272) mutant. τ (A) and ψ (B) of N264 progeny. τ (C) and ψ (D) of N272 progeny.
Statistical Analysis
Our mathematical model (see the Materials and Methods section) can describe all possible relationships between τ and ψ; furthermore, the model is dynamic, showing unstable ψ’s gradually becoming stable over a few days (Fig. 1C). These 2 aspects of the model suggest that we have a simplified version of mechanisms that govern the periodic behavior of endogenous clocks upon entrainment. The endogenous clock is sensitive to the choice of “the entrainment strength” (C Z ) and “the alignment strength” (C P ; Fig. 1D and Materials and Methods section). We concluded that combinations of the entrainment strength and the alignment strength are key parameters that can lead to a variety of stable τ and ψ relationships.
Discussion
Although the relationship between τ and ψ is of fundamental interest to chronobiologists, there has been no systematic empirical or mathematical study done to address the possibility, as shown here, of a short τ/delayed ψ and a long τ/advanced ψ.
One possible explanation for such a relationship between τ and ψ is that it reflects a different directionality and/or sensitivity of different stages of the circadian oscillator to a zeitgeber. The phase response curve (PRC) has been an important tool to account for ψ. The PRC represents differential responses of a circadian oscillator to an outside stimulus applied at different phases of its circadian cycle (Johnson, 1992). At the cellular level, τ is quite elastic depending on nutritional and environmental conditions (Herzog et al., 2004; Welsh et al., 2004; Patton et al., 2016). And there are different stages of a circadian oscillation that respond differentially to genetic and pharmacological perturbations (Patton et al., 2016). A mutation in one clock component may yield a particular τ and ψ relationship in one context but another relationship in a different one. As an example, a mutation of CKIδ that caused FASPS in humans caused a shorter τ in mice and a longer τ in Drosophila (Xu et al., 2005). In a typical limit cycle model, the zeitgeber is explained as a unidirectional force moving a state variable to a predictable isochron. Neurospora has been a good tool explaining entrainment mechanisms by light and temperature (Dunlap and Loros, 2017). However, it is also possible that the same zeitgeber signal may cause different directional changes at the molecular level. For example, light as a zeitgeber entrains fungal and mammalian clocks by inducing the negative regulators (Lowrey and Takahashi, 2011; Dunlap and Loros, 2017), whereas the same zeitgeber entrains the fly clock by degrading the negative regulators (Dubowy and Sehgal, 2017). It is possible that the different sensitivity of circadian oscillators at different stages to a particular zeitgeber may create a diverse set of τ and ψ relationships.
Although the PRC is a powerful tool, it is not a sufficient one to account for all τ and ψ relationships (Roenneberg et al., 2003; Rémi et al., 2010). ψ is influenced by many different factors (Aschoff, 1960; Aschoff and Pohl, 1978; Lakin-Thomas et al., 1991; Pittendrigh et al., 1991; Roenneberg et al., 2003; Abraham et al., 2010; Rémi et al., 2010; Schmal et al., 2015). Quantitative trait locus (QTL) analysis is one way of estimating the number of genetic factors underlying a complex trait. In one study with 3 mapping populations of Neurospora, the authors found 16 QTL for τ and 27 QTL for ψ, in which 7 loci were co-localized for both τ and ψ (Kim et al., 2007). It is not surprising that there are more genetic factors responsible for the variation of ψ than that of τ. Thus, it may be challenging to derive a unified and simple model that explains all entrainment data; however, such a model could provide new insights on fundamental questions such as the evolution of clocks and on applied aspects of clock studies such as diagnosing or intervening in sleep disorders.
Another process that might account for variation in the relationship between τ and ψ is the “rate of entrainment,” the kinetics of signal transduction, by which a zeitgeber signal reaches the oscillator. In our mathematical model, this could be an example of alignment strength, C P (discussed more later). There are 2 known examples of ψ-influencing clock mutants in the Neurospora clock; both are blue-light receptors, wc-1 and vvd (Kaldi et al., 2006; Heintzen and Liu, 2007). In these mutants, ψ is altered while τ is not, demonstrating the feasibility of different ψ’s when the input pathway of a circadian clock is altered.
Our investigation of a short period mutant cys-9 (FGSC 2160) and a long period mutant prd-1 (FGSC 4902) revealed associated ψ’s that were counterintuitive. The short period gene cys-9 is an NADPH-dependent thioredoxin reductase (Onai and Nakashima, 1997). The authors in their initial report suggested that the clock phenotype could be caused by altered protein modification of potential clock transcription factors or kinases or by altered housekeeping metabolism (Onai and Nakashima, 1997). Although its short τ clock phenotype was reported 20 years ago, there has been no follow-up study on the gene since the initial report. There are now ample data supporting the existence of circadian oscillations in cellular redox conditions both in prokaryote and eukaryote organisms (Stangherlin and Reddy, 2013). In the prokaryote clock, the redox change in the form of the adenosine triphosphate (ATP)/adenosine diphosphate ratio can replace the phase shift of the clock by light (Rust et al., 2011). In a similar manner, the redox condition plays an important role in circadian clock and light entrainment in Neurospora (Yoshida et al., 2011; Gyongyosi and Kaldi, 2014). So one possible explanation for our cys-9 phenotype could be that an altered cellular redox condition by the cys-9 mutation results in a delayed ψ. The long period clock gene prd-1 is an ATP-dependent DEAD-box RNA helicase (Emerson et al., 2015; Adhvaryu et al., 2016). DEAD-box helicases are involved in many cellular processes involving RNA metabolism (Rocak and Linder, 2004). In addition to a function unwinding RNA (Busa et al., 2017), DEAD-box helicases are involved in different functions at different stages of circadian regulation. In the Neurospora clock, FRQ-interacting RNA helicase’s primary role is to mediate a proper contact among FRQ, CK1a, and WCC (Hurley et al., 2013; Lauinger et al., 2014; Conrad et al., 2016). TOGR1, a DEAD-box helicase in the rice plant, is involved in temperature-dependent and clock-controlled plant growth through stabilizing rRNA homeostasis (Wang et al., 2016). DDX5, an ortholog of PRD-1, is associated in the PER complex and regulates per RNA metabolism and its clock function (Padmanabhan et al., 2012). As in the case of CYS-9, PRD-1 appears to be involved in housekeeping metabolic processes and not a part of the transcription/translation feedback loop oscillator (TTFL); prd-1 is not regulated by light or the TTFL (Emerson et al., 2015). Although PRD-1 is clearly a part of the metabolic oscillator, the biochemical function of PRD-1 is not clear yet (Emerson et al., 2015; Adhvaryu et al., 2016), and it is too early to speculate on how PRD-1 contributes to shape the τ/ψ relationship.
We have constructed a mathematical model to describe the complex relationships between τ and ψ that we observe in the current study. This model is general in the sense that it does not describe particular molecules that regulate rhythmic expression in the endogenous clock or participate in entrainment. Rather, it describes biological rhythms that synchronize with a zeitgeber and how such signals affect the endogenous clock. In our model, the endogenous clock does not directly sense the zeitgeber. Instead, there is an intermediate quantity that responds to the light-to-dark transition by synchronizing to the zeitgeber as the Kuramoto model describes. We considered parameters in our mathematical model, entrainment strength (CZ) and the alignment strength of the oscillator to the light receptor (C P ). Zeitgeber strength has been included in other models (Abraham et al., 2010; Schmal et al., 2015). The alignment strength (CP) could reflect several other factors, including amplitude of the oscillator and coupling of the oscillators.
Some parameterizations of this model show long τ with a delayed ψ and short τ with an advanced ψ, as traditional models do. Our proposed model in this work is the result of starting with a simpler model. We began our investigation by producing a very simple set of ODEs with 2 oscillators. In this first model, the zeitgeber entrained the endogenous clock the same way that the zeitgeber entrains the light-sensitive protein in our tri-oscillator model. This direct synchronization of the 2 oscillators showed stable entrainment only with short τ/advanced ψ and long τ/delayed ψ relationships (this first model is shown in the supplementary material). To build a model that could explain our experimental observations, we added a third oscillator in our proposed model, which is the light-sensitive protein. The addition of an intermediate protein that would be entrained by the zeitgeber, which in turn would serve as a regulator of the endogenous clock, was able to describe the wider range of behavior. Our mathematical model requires more optimization to include other known factors to explain the full spectrum of τ/ψ relationships.
In summary, our genetic data demonstrate variation in the relationship between τ and ψ, and the mathematical model provides working hypotheses for further characterization of molecular mechanisms of entrainment. Our data also imply that misaligned ψ’s (e.g., in human sleep disorders) may have etiologies distinct from an altered τ.
Footnotes
Acknowledgements
Strains were obtained from the Fungal Genetics Stock Center (Manhattan, KS). The authors thank Drs. Joseph Martin, Eric Klein, Bala Koritala, and Charot Rodeget; 2 anonymous reviewers; and the editor for critical reading and insightful suggestions. The current work was supported by NIGMS- R15GM117523-01.
Conflict of Interest Statement
The author(s) have no potential conflicts of interest with respect to the research, authorship, and/or publication of this article.
Notes
References
Supplementary Material
Please find the following supplemental material available below.
For Open Access articles published under a Creative Commons License, all supplemental material carries the same license as the article it is associated with.
For non-Open Access articles published, all supplemental material carries a non-exclusive license, and permission requests for re-use of supplemental material or any part of supplemental material shall be sent directly to the copyright owner as specified in the copyright notice associated with the article.