
Abstract
The stability of circadian clock mechanisms under cyclic environments contributes to increased Darwinian fitness by accurately timing daily behavior and physiology. Earlier studies on biological clocks speculated that the timing of behavior and its accuracy are determined by the intrinsic period (τ) of the circadian clock under constant conditions, its stability, the period of the external cycle (T), and resetting of the clock by environmental time cues. However, most of these previous studies suffered from certain limitations, the major ones being a narrow range of examined τ values and a non-uniformity in the genetic background across the individuals tested. We present data that rigorously test the following hypotheses by employing Drosophila melanogaster fruit flies with τ ranging from 17 to 30 h in a uniform genetic background. We tested whether 1) precision (day-to-day stability of τ) is greater for clocks with τ close to 24 h; 2) accuracy (i.e., day-to-day stability of the phase relationship (ψ), where ψ is the duration between a phase of the rhythm and a phase of the external cycle) is greater for clocks with τ close to 24 h; 3) Ψ is delayed with an increase in τ; and 4) Ψ becomes more advanced with an increase in length of zeitgeber cycle (T). We show that precision is not always maximum for ~24-h clocks, but that accuracy is greatest when τ approximates T. Further, flies exhibit a delayed phase relationship with increasing τ and an advanced phase relationship under long T-cycles as compared with shorter T-cycles. We also describe relationships between activity and rest durations and how our observations fit predictions from models of circadian entrainment. Overall, we confirm that accuracy and phase of entrained rhythm are governed by both intrinsic clock period and the length of the external cycle; however, we find that the relationship between intrinsic period and precision does not fit previous predictions.
Entrainment of biological rhythms is crucial for organisms, enabling ecologically appropriate and stable phasing of near 24h internal clocks with the 24h external environmental cycles. Organisms exhibit a free-running period (τ) that is close to 24 h under constant environmental conditions, but that is rarely exactly 24 h, and there is remarkable variability in τ across individuals within a species as well as across different species. Internal free-running periodicities are rarely expressed in nature since the rhythm entrains or synchronize to the external environmental cycle (light being the key zeitgeber) and, with it, assumes a stable phase-relationship (ψ). This phase-relationship with the environment is thought to be adaptive to organisms due to appropriate timing of behavioral and physiological processes that may increase their reproductive fitness. For this phasing of behavior to be adaptive, it must be consistent across days for a given physiological state or ecological context. This consistency or lack of variability of entrained phase across days is measured as accuracy (Beersma et al., 1999). While τ is considered a core parameter of the clock, and accuracy a trait that may confer adaptive advantages to organisms, there are several clock properties, such as range of entrainment, response to environmental cues, among others, that are related to both τ and ψ. Various studies have examined the relationships between τ and ψ, and certain patterns related to clock properties have been established over the years. However, this consensus has emerged based primarily on the non-parametric model of entrainment (Daan and Aschoff, 2001; Daan and Pittendrigh, 1976; Johnson et al., 2003), and there are some inconsistencies in the results.
For instance, it has been observed that very few individuals display τ of exactly 24 h (Pittendrigh and Daan, 1976). To explain this observation under the paradigm of the non-parametric model of entrainment, it was proposed that when τ exactly matches the period of the external cycle (T), phase relationship (ψ) would be prone to large fluctuations, even with small deviations in τ, leading to weak or unstable entrainment (Pittendrigh and Daan, 1976). This suggests that evolutionary forces might act against individuals exhibiting τ exactly equal to 24 h (Pittendrigh and Daan, 1976) unless it is compensated for by high precision. This could partly explain the rarity of individuals with an exactly 24h τ. Additionally, this deviation from 24 h is proposed to facilitate seasonal adaptation (Daan and Aschoff, 1982; Daan and Beersma, 2002; Johnson et al., 2003). Whereas this may suggest that clocks with τ slightly deviating from 24 h would be adaptive, large deviations from 24 h can also be detrimental (Daan and Beersma, 2002). Furthermore, organisms with τ matching T appear to have higher Darwinian fitness compared with those with τ greatly deviant from T (Dodd et al., 2005; Emerson et al., 2008; Ouyang et al., 1998).
Pittendrigh and Daan (1976) provided an explanation for this apparent paradox by proposing that reduced accuracy (day-to-day stability of ψ -a measure of how well the clock can recognize local time; stability under cyclic environments) associated with clocks with τ exactly 24 h is compensated for by their enhanced precision (day-to-day stability of τ -a measure of how well the clock estimates passage of time; stability under acyclic environments). Therefore, it was hypothesized that individuals with τ approximating 24 h would exhibit higher precision. Some empirical studies have reported evidence of an association between τ and precision, and have found that clocks having τ closer to 24 h are indeed more precise (Aschoff, 1971; Pittendrigh and Daan, 1976; Sharma and Chandrashekaran, 1999). Since recognizing local time is one of the clock’s major functions, previous studies also investigated how τ influences phase relationships (ψ). An association between ψ and τ has been observed using fruit flies with altered τ (Hamblen-Coyle et al., 1992) and with those selected for early or late adult emergence (Kumar et al., 2007). The periodicities of external cycle (T) to which the circadian clock can entrain (range/limits of entrainment) is also known to be a function of τ in addition to the magnitude of phase resetting (Pittendrigh, 1965). Additionally, ψ of entrained behavior changes with the period of T-cycles, such that entrainment to an increasing length of zeitgeber cycle is associated with advancing ψ (Aschoff and Pohl, 1978); this suggests that ψ, in addition to being dependent on τ, is also a function of T. However, each of these previous studies suffered from certain limitations to make generalizations regarding phase-period relationship, such as a non-uniform genetic background among individuals with contrasting τ (Pittendrigh and Daan, 1976), the use of environmental manipulations to generate a range of τ (Aschoff, 1971) and comparisons across a small range of τ (Sharma and Chandrashekaran, 1999).
Moreover, there have been exceptions to the correlations in clock properties observed in several of the above-mentioned studies. For instance, a recent study using mutant hamsters demonstrated that precision is not dependent on τ (Bittman, 2012). Similarly, τ-ψ relationships that do not follow the proposed rule of delayed phase with increasing τ have also been observed in a study with Neurospora crassa (Lee et al., 2017). In the field mouse, Mus booduga, the τ-ψ relationship holds true under gradual transitions of light and dark but not under abrupt transitions (Sharma et al., 1998). These inconsistencies could be because of different methodologies or model organisms across the different studies.
In addition to the non-parametric model of entrainment, predictions on the relationship between clock properties have also been proposed based on the parametric model suggesting that τ increases or decreases to facilitate entrainment. Two important clock characteristics for which certain speculations were made and that are known to be associated with τ are 1) duration of activity, referred to as alpha (α), and 2) duration of rest, referred to as rho (ρ). Aschoff tried to explain certain observations regarding these parameters using a model according to which α or ρ can change with changing levels of threshold and frequency of the oscillation (Aschoff and Wever, 1962; Wever, 1960). The α/ρ ratio was also found to be dependent on τ (Aschoff, 1971; Eskin, 1969): with an increase in τ, the ratio decreased, and vice versa. Moreover, in diurnal animals (with exceptions to the rule; Aschoff, 1979) an increase in light intensity was thought to shorten τ, increase α, and decrease ρ thereby increasing the ratio.
Here we sought to test the hypotheses regarding these clock properties while minimizing confounding factors encountered in previous studies. Drosophila melanogaster is a model for circadian rhythm research and has been the subject of research on the formal properties of circadian clocks and their inter-relationships, with the underlying molecular and cellular underpinnings described in relative detail (Hardin, 2005). We generated lines of fruit flies with distinct τ values in the range of 17 to 30 h using mutations in a core clock gene period (per) introgressed into the background of a wild-type, outbred population (Materials and Methods). This population has been consistently maintained at a large size (~1000 flies) to minimize the loss of genetic variation due to genetic drift, bottlenecks, or mutation accumulation. Besides speculating about the adaptive relationships between different clock properties, our aim was to identify functional correlations with circadian period while minimizing the effects of interactions with genetic background and employing a wide range of τ almost symmetrical around 24 h. A systematic assessment of all core clock properties with this range and the absence of other limitations (e.g., differences in genetic background, age or sex) are perhaps exclusive to this study. Since the stability of phase of entrainment depends on the phase-marker and model system (Daan and Oklejewicz, 2003), we first computed precision using multiple phase-markers; namely, activity onsets and offsets to mark the start and end of activity, respectively, and Centre of Gravity measures (CoG; mean daily clock time of all recorded activity impulses to indicate the temporal center of the activity-rest rhythm) (Kenagy, 1980). We also asked to what extent our observations can be explained by the phase response curves (PRCs) of the fly lines employed. Further, we compared α and ρ values of individual flies across days to examine their correlations and their relationships with τ.
Our results suggest that circadian clock precision significantly increases near τ = 24 h only when a very large number of individuals are considered for analysis. On the other hand, the accuracy of the entrained phase varies with both τ and T, and was higher when τ was closer to T. ψ was correlated with τ and T, consistent with predictions from the non-parametric model of entrainment, whereby shorter τ flies were phase advanced relative to longer τ flies. Thus, we demonstrate that, although precision is only weakly correlated with τ, the relationships among intrinsic period, accuracy and phase relationship of entrained rhythm appear to be governed by the endogenous period as well as the period of the external cycle. Additionally, analysis on α and ρ of individual flies shows that differences in τ are brought about by a change in α.
Materials and Methods
Fly Lines and Maintenance
Using a large outbred population of Drosophila melanogaster (Gogna et al., 2015), individuals carrying either the short or long period mutation, pers or perl, were backcrossed for a total of 10 generations to generate 2 lines with short and long τ on an otherwise similar genetic background. The backcrossing scheme is depicted in Supplementary Fig. S1a. The experiments described here were performed with fifth-, seventh- and tenth-generation backcrossed individuals. Because our interpretations are not focused on the specific effects of the period gene per se, henceforth, we have used the term “period range” to denote the 3 genotypes: 17-19 h or “short” for pers; 23-25 h or “intermediate” for wild-type; and 26-30 h or “long” for perl. For all analyses, we have used only those flies with period values falling within these defined ranges to compare across distinct, non-overlapping segments of the period distribution. However, in the scatter plots, we have also included values that did not fall in these ranges. On days 9 and 10 after egg collection, freshly emerging flies were collected, sexed, and separated within 6 h of their emergence as virgin males and females. To acclimatize flies to assay conditions, all flies were maintained under LD 12:12 cycles at 25°C for 3 to 4 days after emergence before beginning any assay.
Locomotor Activity Rhythm Recordings
Individual 4- to 5-day-old virgin male flies were introduced into Drosophila Activity Monitors (DAM 5, Trikinetics; Waltham, MA, USA) at an ambient temperature of 25°C either in constant darkness (DD) or in LD cycles with light intensity of 1 lux during the light phase. We employed a low intensity of light to estimate stability of entrainment because higher light intensities could result in greater effects of masking. A sample actogram for a short-period fly under constant and entraining conditions is depicted in Supplemental Fig. S1b, where the phase of daily offsets is shown using grey triangles. Activity-rest rhythm was first recorded in DD for 8 days to obtain the τ of individual flies, after which different subsets of flies were transferred to different T-cycles (T20, T24, or T28 symmetric regimes with LD 10:10 h, 12:12 h or 14:14 h cycles) for 10 cycles. This was followed by a few days of recording in DD to verify if entrainment occurred. To obtain PRCs, for each period range, circadian times (CTs) were separately calculated and light pulses (15 min, 1 lux) were given at 6 different circadian times after 4 days of entrainment under LD 12:12 h. Along with the experimental set, we used one set of flies (disturbance controls) of each period range that were disturbed at each of the CT points but not given any light pulse. Since our main aim was to check if our observations under T24 can be explained by PRCs, we chose to keep the intensity of light similar to what was used to estimate phase relationship and stability of entrainment under T24.
Estimation of Precision and Accuracy
To assess various clock characteristics, 3 phase markers were used: onset of activity, offset of activity, and CoG. Modulo-T plots of actograms were plotted, and the activity onset and offset phases, identified using Clock lab software, were verified by visual inspection (Actimetrics; Wilmette, IL, USA). ActogramJ was used to estimate the CoG of activity of individual flies averaged across 10 cycles (Schmid et al., 2011). Under entrained conditions, ψ was calculated by measuring the duration between the phases of entraining zeitgeber and entrained rhythms (for example, ψ [offset] is the difference in timings of lights-off and activity offset). Phase shifts were calculated by measuring the difference between the predicted and obtained phases extrapolated to the day of the light pulse (phase shift = pre-pulse phase – post-pulse phase). Delays in phase relationships as well as phase-shifts were given negative values whereas advances were given positive values by convention (Pittendrigh and Daan, 1976). The difference in phase shifts between disturbance control and experimental flies for each time-point was used as the real estimate of the phase shift occurring due to the light pulse. τonset was calculated as the duration between successive activity onsets under constant conditions. Similarly, τoffset and τCoG were calculated using activity offsets and CoG, respectively. Precision was calculated as the inverse of the standard deviation (SD) in τ (see below) across days:
Similarly, accuracy was estimated as the inverse of the SD in ψ of activity onset, offset and CoG for 10 cycles.
Alpha and Rho
Activity duration (α) for each cycle was measured as the time difference between the activity onset and offset of that cycle (identified subjectively by the visual inspection of actograms, as described above). Rest duration (ρ) was the time difference between the offset of one cycle and the onset of the next cycle.
Statistical Analysis
To compare the mean values of precision across the 3 period ranges and with different phase markers, repeated measures ANOVA was performed with “period range” as a fixed factor and “phase marker” as a repeated measure. Correlations among the 3 measures (precision, accuracy and ψ) of individual flies and their respective τ values were assessed using Spearman correlation (coefficient depicted by r to avoid confusion with rho, which we use to denote rest duration). We preferred Spearman’s correlation, as this commonly used non-parametric correlation method is reliable for moderate to large sample sizes and because the data were not normally distributed. Also, it can be used when both variables do not change proportionally or at a constant rate with each other. For both precision and accuracy, 2 separate correlations were performed, one for τ ranging from 17 to 24h, and the other for τ ranging from 24 to 30 h; because we were testing for increasing precision and accuracy when τ approaches 24h from either side, the results were considered significant at p < 0.01 to account for the increased type I error rate due to 2 correlations. We included 24h values in both correlations because the main purpose here was to see whether clocks with ~24h τ performed better (in terms of accuracy and precision) when compared with those with non-24h τ. For ψ, a single correlation for the entire period range was assessed. Similarly, correlation between precision and accuracy for the entire period range was also tested for significance at p < 0.05. We also tested these correlations for smaller subsets of data as well as for data pooled across replicate experiments to determine if and to what extent the relationships between these parameters depended on sample size. For accuracy and ψ, we also compared mean values across T-cycles using ANOVA, where “regime” was used as a fixed factor and individual flies were taken as replicates of the dependent variables, accuracy and ψ. Correlations of α and ρ values for the 3 period ranges and for correlations of α and ρ with the respective τ values were assessed as mentioned above. All statistical analyses were performed on STATISTICA, version 7 (Statsoft, 1995).
Results
Offset Is the Most Reliable Phase-marker for Estimation of Precision
Using repeated measures ANOVA to determine the optimal marker for assessment of rhythm properties, we found a significant main effect of “phase-marker” (F2,348 = 24.862; p < 0.05) and “period range” (F2,696 = 195.05; p < 0.05). Post-hoc tests, performed using Tukey’s HSD, showed that precision calculated using activity offsets was significantly higher when compared with that using onsets or CoG (Fig. 1a) within each period range (p < 0.05). Moreover, a “phase-marker” × “period range” interaction was also significant (F4,696 = 15.058; p < 0.05), where precision values obtained using offsets (vs. onset or CoG) were greatest in flies in the short-period range as compared with the other period ranges (p < 0.05; Fig.1a).
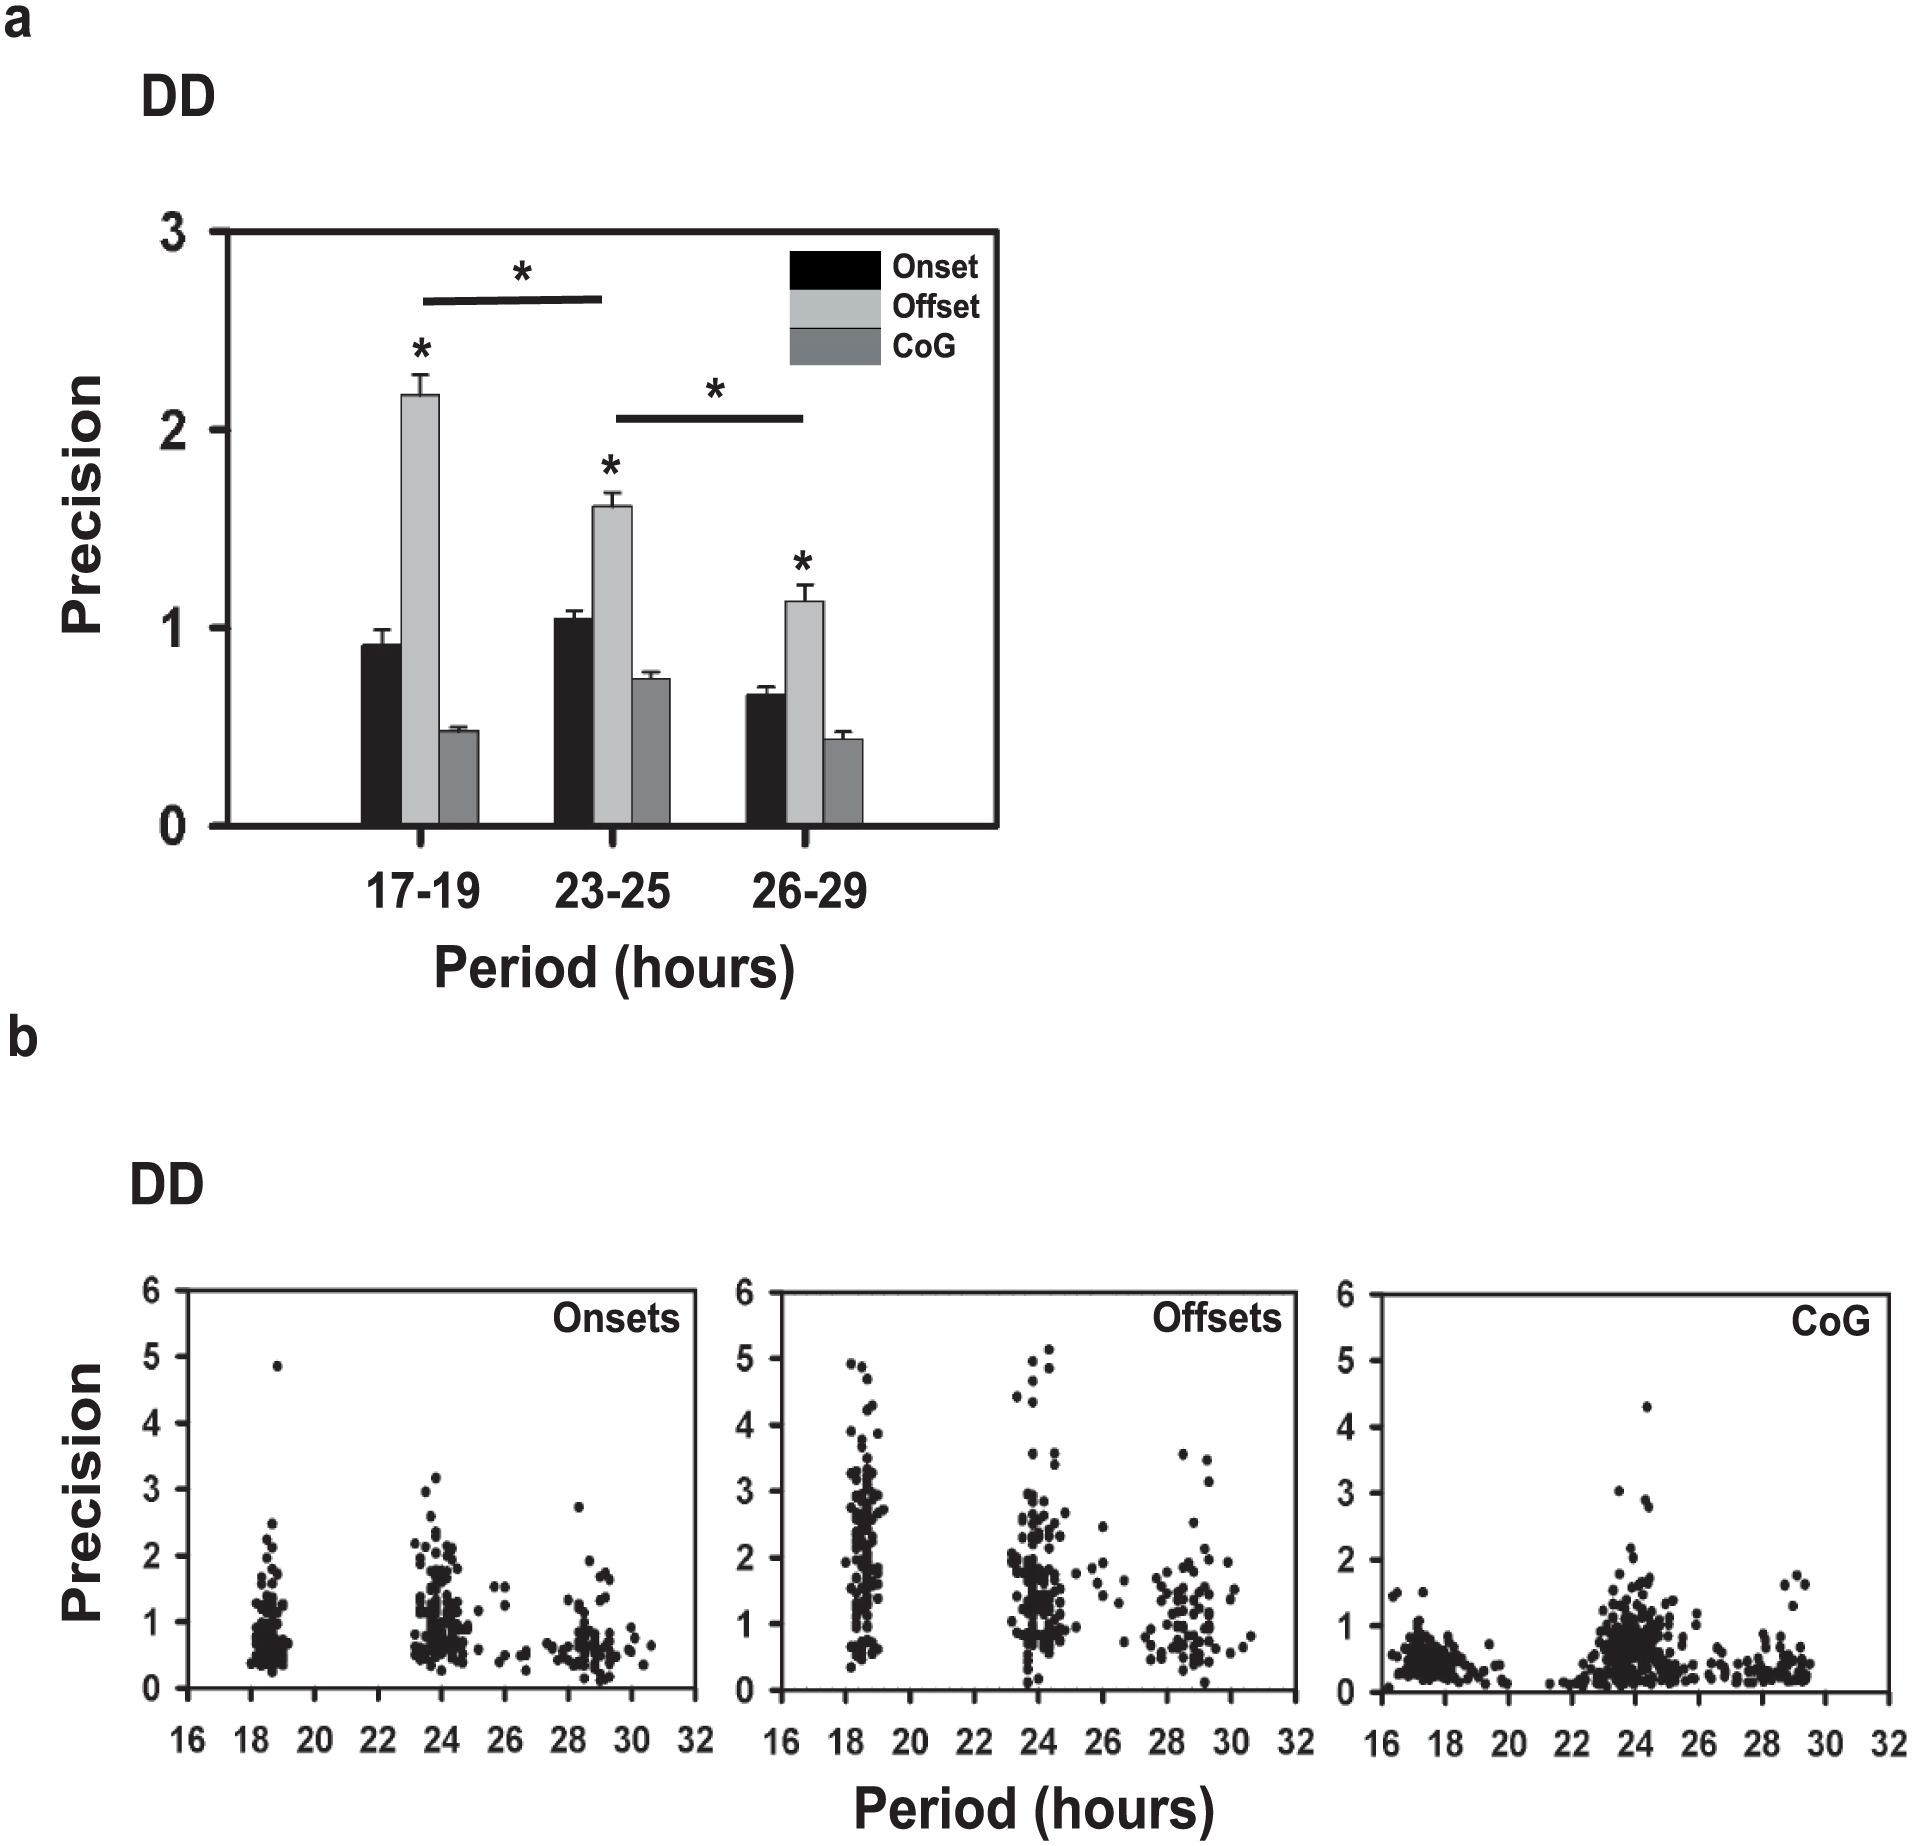
Comparison of period and precision for flies across period ranges. (a) Comparison of precision across the 3 period ranges measured using onsets (black), offsets (light gray), and Center of Gravity (CoG; dark gray). Bars depict the mean precision across flies of each period range (n = 138 for short, 158 for intermediate, 72 for long) plotted as a function of the period range. Error bars are SEM. Asterisks above the error bars represent significant differences across phase markers at p < 0.05, whereas asterisks above the horizontal bar represents differences across period ranges for offset as a phase marker. (b) Correlation of precision and period of individual flies with periods ranging from 17 to 30 h measured using onsets (left), offsets (middle) and CoG (right). Dots represent the precision value on the y-axis for individual flies (n = 368), with the corresponding period value on the x-axis. Correlation coefficients are given in Table 1.
Precision of Locomotor Activity Rhythm is Weakly Correlated With τ
With onsets, offsets, and COG, significant negative correlations were observed between precision and τ for both the 17 to 24 h range (p < 0.01) and the 24 to 30 h range (r values for onsets = 0.36; offsets = 0.27; p < 0.01; Fig. 1b; Table 1a), suggesting that precision is lower for long period-range flies. However, these correlations were not consistent across experiments. With the dataset pooled across experiments (from multiple generations), we find precision to be higher for ~24h clocks (Supplemental Table S4).
τ-Precision correlation using different phase markers.
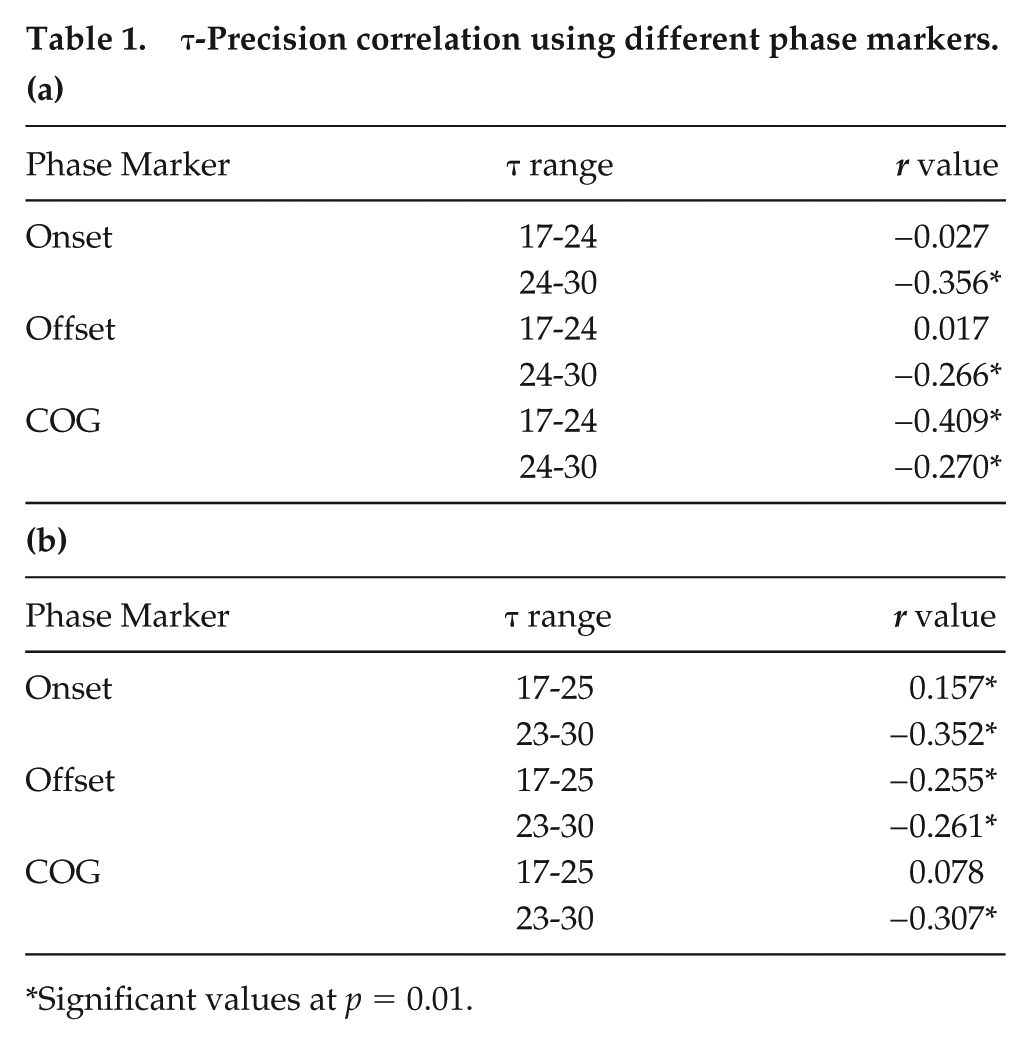
Significant values at p = 0.01.
Accuracy Is Maximal for Clocks With τ Close to That of External Cycle
We tested the relationship between τ and accuracy of entrainment in the presence of LD cycles of 24 h (T24). We find that accuracy (offset) is significantly positively correlated with τ for the 17- to 24-h range (r = 0.65; p < 0.01), and negatively correlated for the 24 to 30h range (r = −0.47; p < 0.01; Fig.2a; Table 2). Next, we asked whether, irrespective of τ, flies that possessed more precise clocks exhibited greater accuracy. We estimated both precision and accuracy of an individual fly from each period category by subjecting them to DD followed by their respective resonating T-cycles. Correlation of accuracy and precision was not found to be statistically significant (T24: r = −0.02; p = 0.87) nor did it reveal any clear trend (Fig. 2b). We also did not see any correlation between precision and accuracy for any of the period ranges when examined in their respective T-cycles (short-period range in T20: r = 0.19; p > 0.05; intermediate-period range in T24: r = −0.18; p > 0.05; long-period range in T28: r = 0.14; p > 0.05; Supplemental Fig. S2). This is inconsistent with the idea that precise clocks are associated with higher accuracy (Pittendrigh and Daan, 1976).
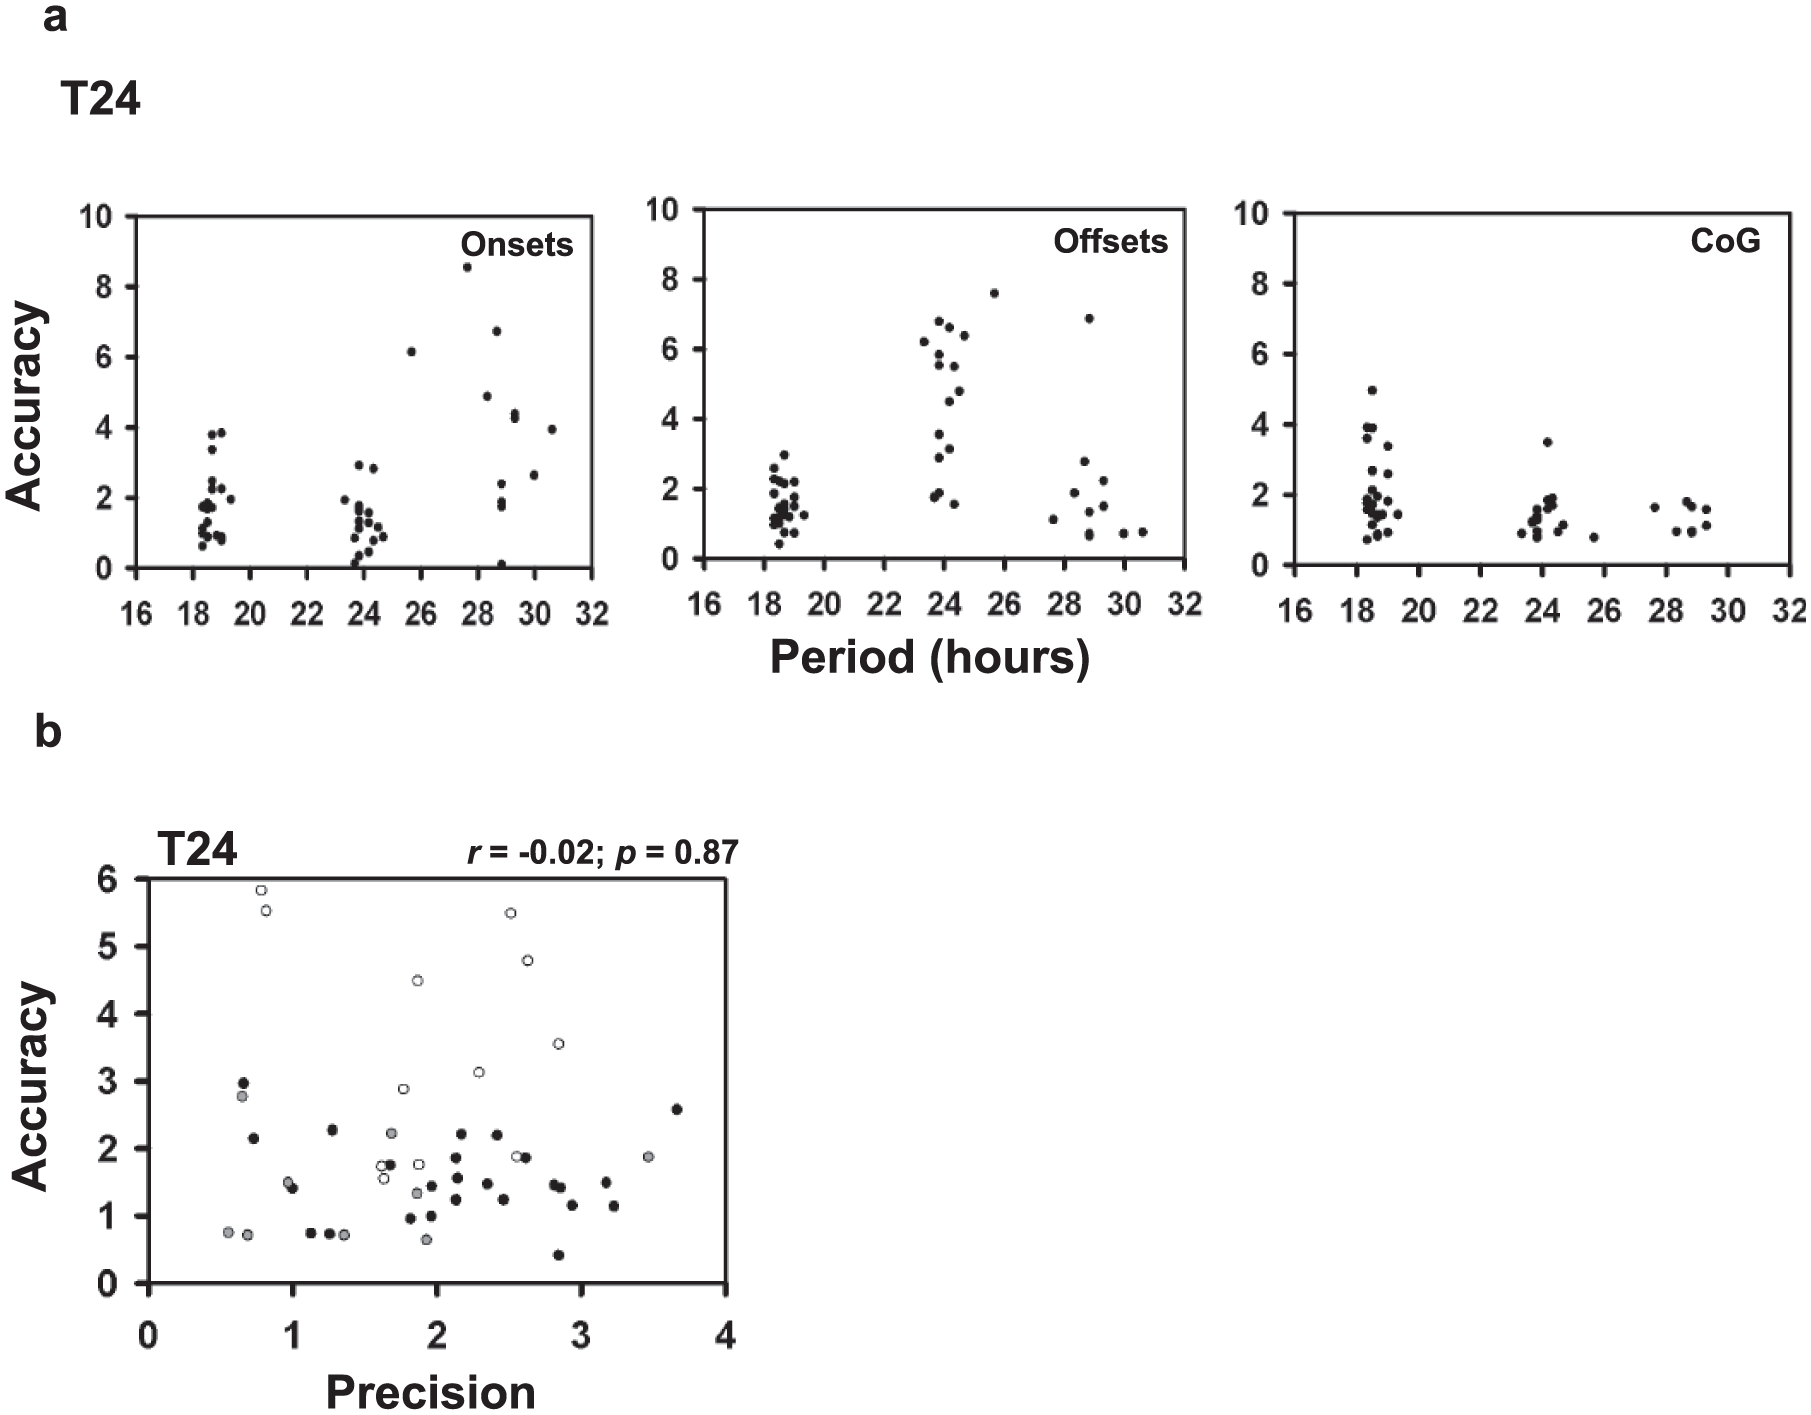
Correlations of accuracy with period and precision. (a) Correlation of accuracy and period measured using onsets (left), offsets (middle), and CoG (right) under T24 regime. Each dot represents the accuracy value on the y-axis for an individual fly with the corresponding period value on the x-axis. Correlation coefficients are given in Table 2. This represents data from generation 7. (b) Correlation of accuracy and precision measured using offsets. Dots represent the accuracy value on the y-axis for an individual fly with the corresponding precision value on the x-axis for the 3 period ranges (black, short; white, intermediate; grey, long) under T24.
τ-Accuracy correlation using different phase markers.
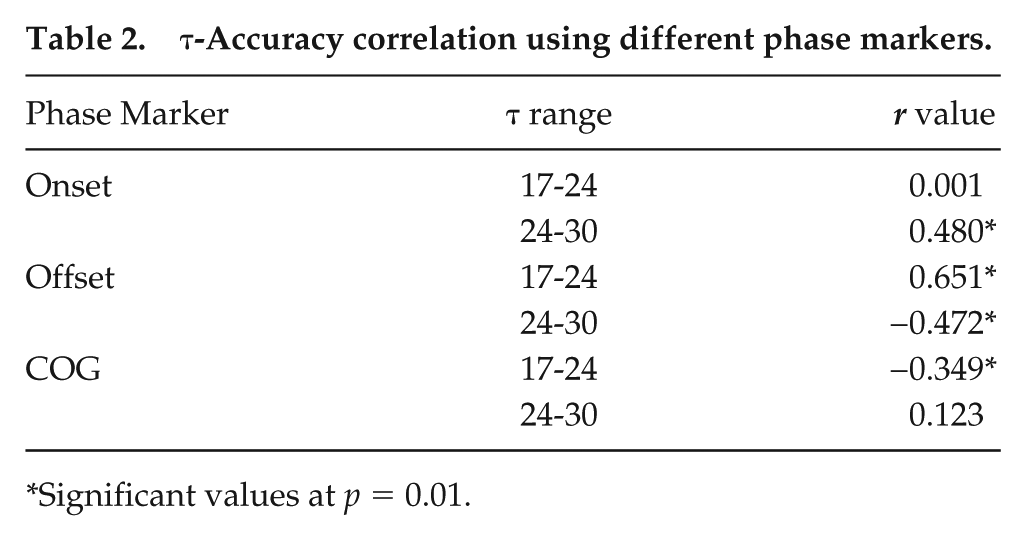
Significant values at p = 0.01.
Because flies with period range around 24 h show greater accuracy under T24, we tested the hypothesis that accuracy is enhanced when τ is closely matched with T. For this, we used 2 other regimes, T20 and T28, with symmetric LD durations, and checked if flies with different τ entrained under these regimes. (Each fly was assessed for entrainment based on whether it showed periodicity of ±0.5 h of the entraining regime, and whether the phase of its rhythm following transfer to DD could be extrapolated back to the phase on the last day of entrainment. Flies of a particular period range were included for analysis only if >75% fulfilled these criteria). Representative actograms show activity patterns for each period range under T20 (Fig. 3), T24 (Fig. 4), and T28 (Fig. 5). Flies of similar periods show differences in consolidation of activity in different actograms mainly due to differences in the scales of the x-axes. Under T20, flies in the short and intermediate τ range were found to entrain but not those with long τ, and correlation of accuracy with τ was found to be significantly negative. Under T28, flies entrained irrespective of their intrinsic period; however, there was no significant correlation between accuracy and τ (Fig. 6a, Table 3). Thus, the notion that accuracy would be greater when T is closest to τ is upheld for short and intermediate period ranges.
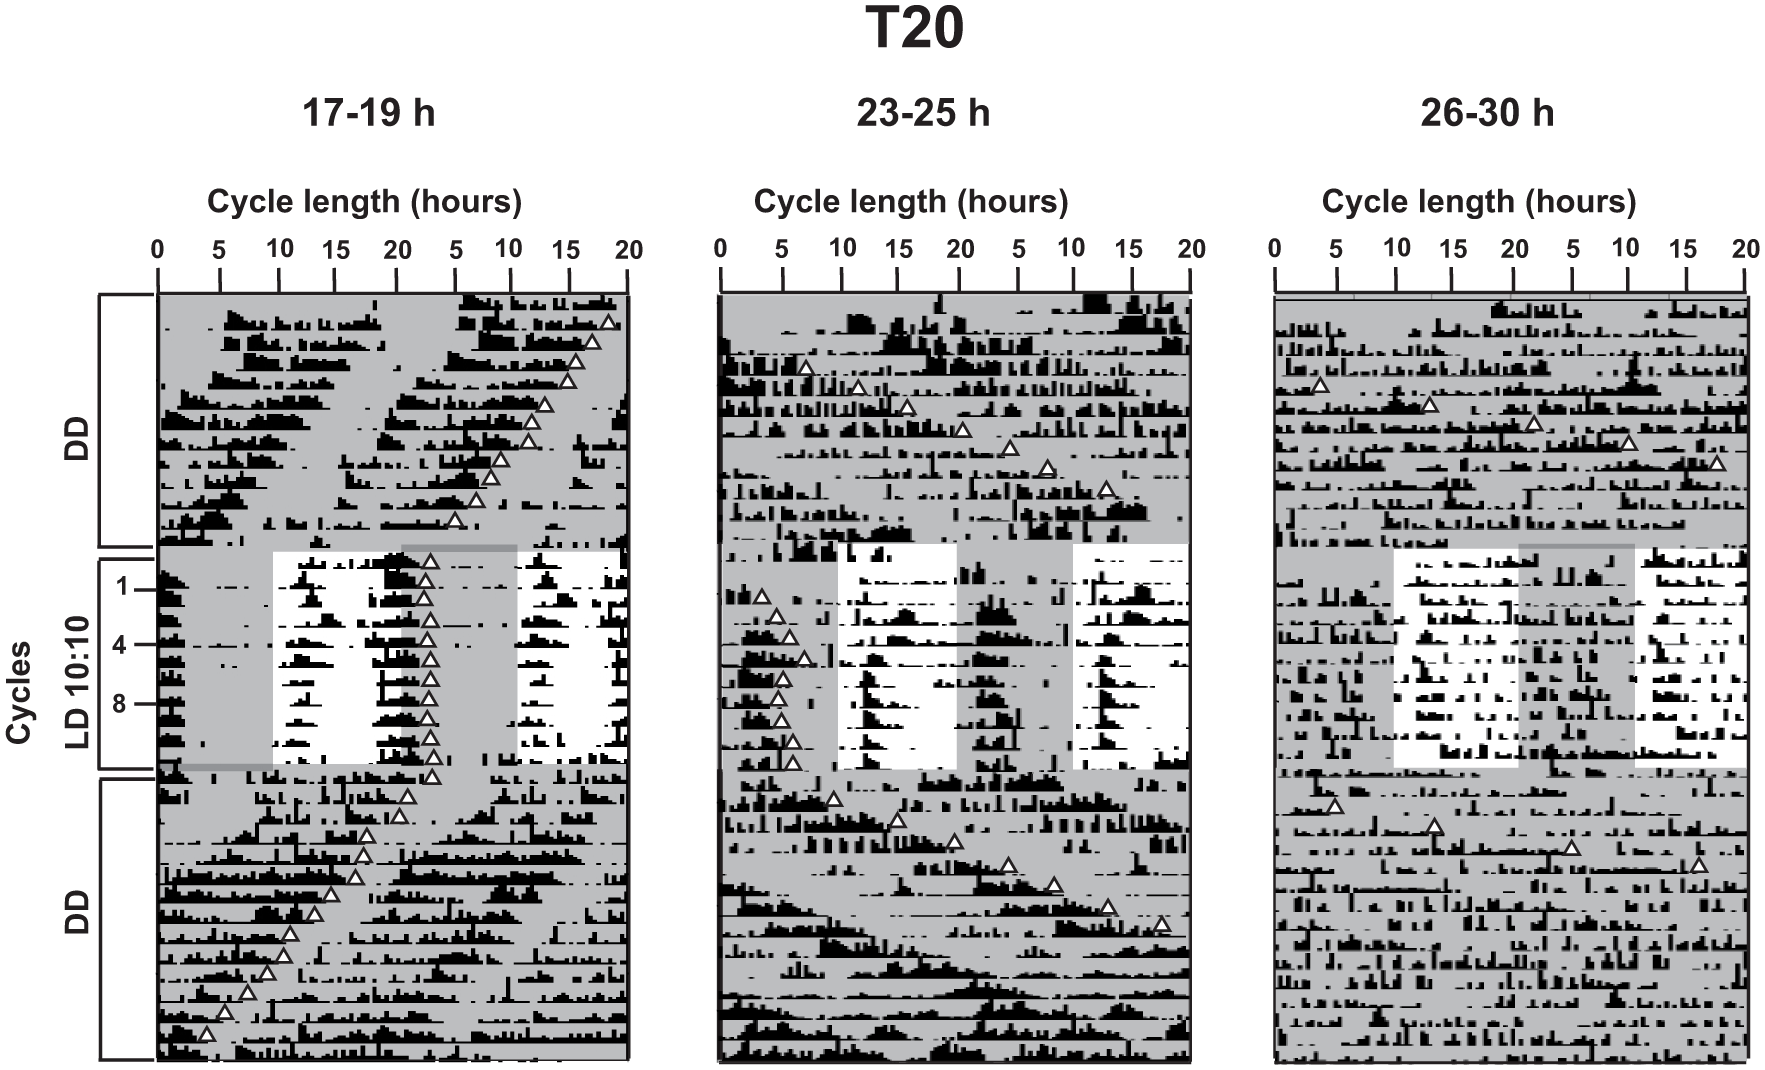
Representative actograms under T20. Actograms for an individual fly from each of the 3 period ranges under T20 (cycle number shown by values on y-axis) preceded and followed by DD as indicated on the y-axis. Here, scale on the x-axis is adjusted to 20 h. Triangles depicting the offset phase for each cycle are placed to qualitatively follow the free-running and entrained rhythms. Shaded areas in the actograms depict the dark phase in each cycle.
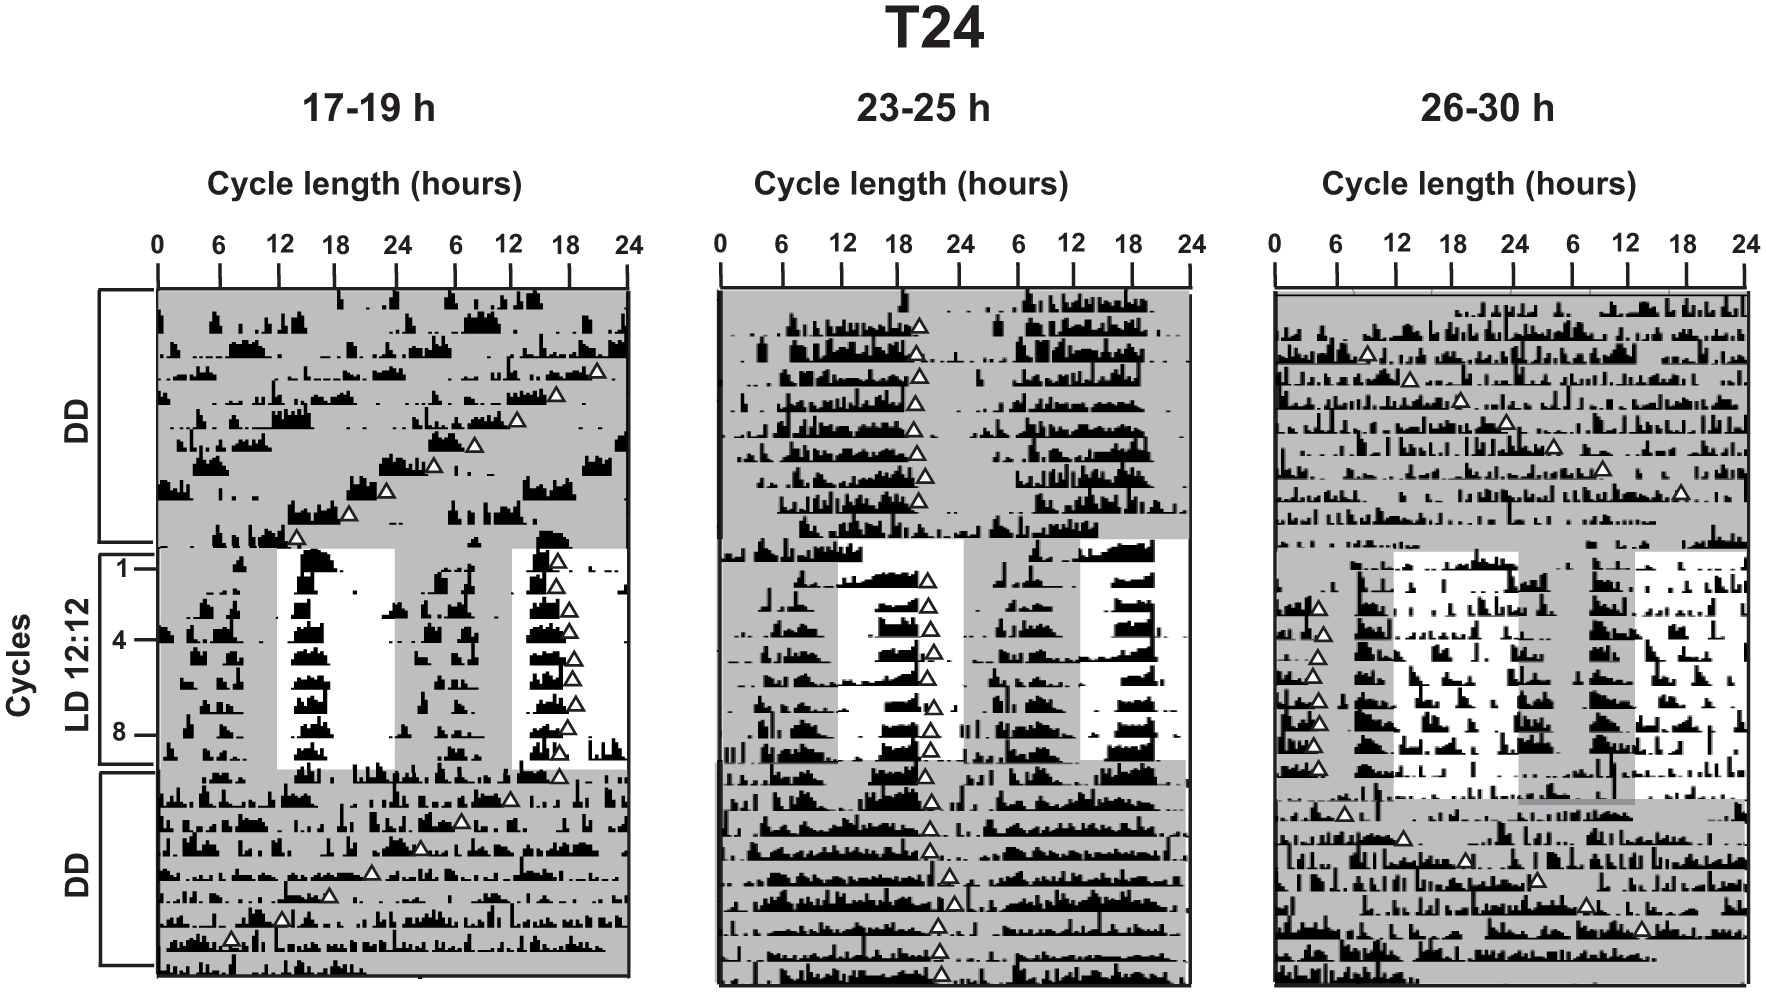
Representative actograms under T24. Actograms for an individual fly from each of the 3 period ranges under T24 (cycle number shown by values on y-axis) preceded and followed by DD as indicated on the y-axis. Here, scale on the x-axis is adjusted to 24 h. Triangles depicting the offset phase for each cycle are placed to qualitatively follow the free-running and entrained rhythms. Shaded areas in the actograms depict the dark phase in each cycle.
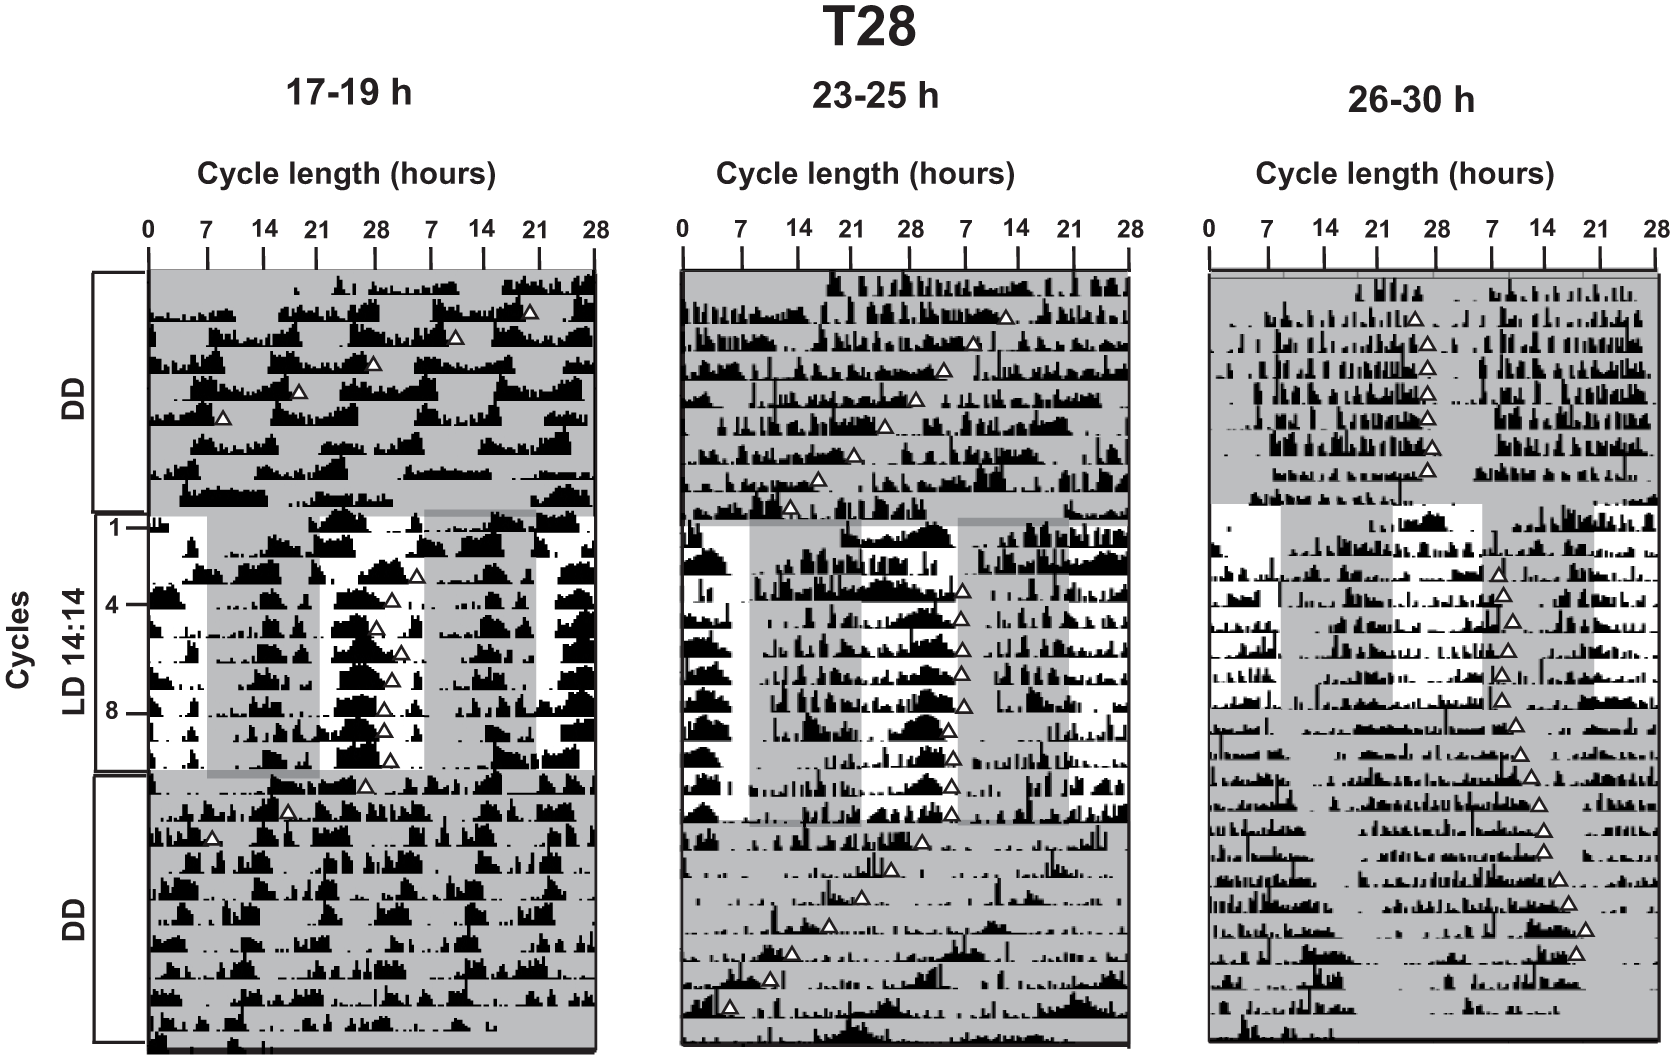
Representative actograms under T28. Actograms for an individual fly from each of the 3 period ranges under T28 (cycle number shown by values on y-axis) preceded and followed by DD as indicated on the y-axis. Here, scale on the x-axis is adjusted to 28 h. Triangles depicting the offset phase for each cycle are placed to qualitatively follow the free-running and entrained rhythms. Shaded areas in the actograms depict the dark phase in each cycle.
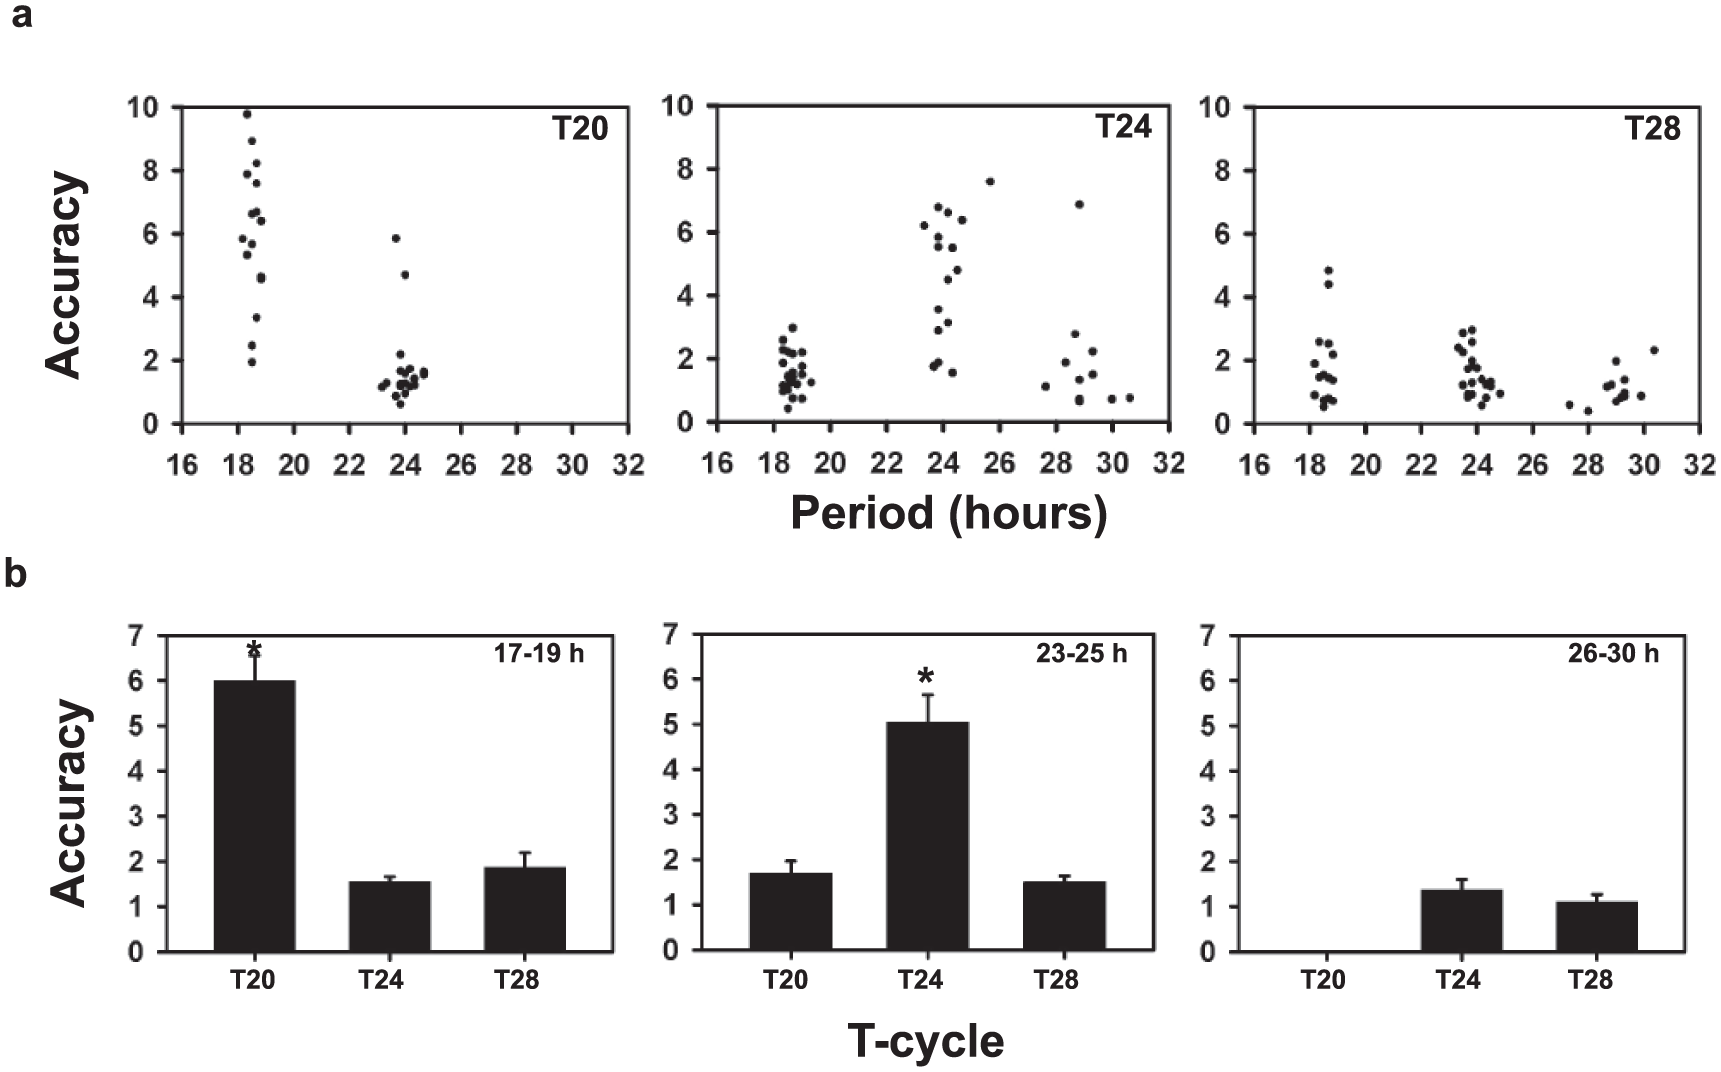
Comparisons of Accuracy with period and T-cycles. (a) Correlation of accuracy and period of individual flies with periods ranging from 17 to 30 h measured under different T-cycles: T20 (left), T24 (middle), and T28 (right). Dots represent the accuracy values on the y-axis for an individual fly, with the corresponding period values on the x-axis. Correlation coefficients are given in Table 3. (b) Comparison of accuracy across T-cycles for the 3 period ranges: 17-19 h, 23-25 h and 26-30 h. Bars depict mean accuracy across flies for each period range under each T-cycle. Error bars are SEM. Asterisks above the bars represent significant differences across T-cycles at p < 0.05.
τ-Accuracy correlation under different T-cycles.
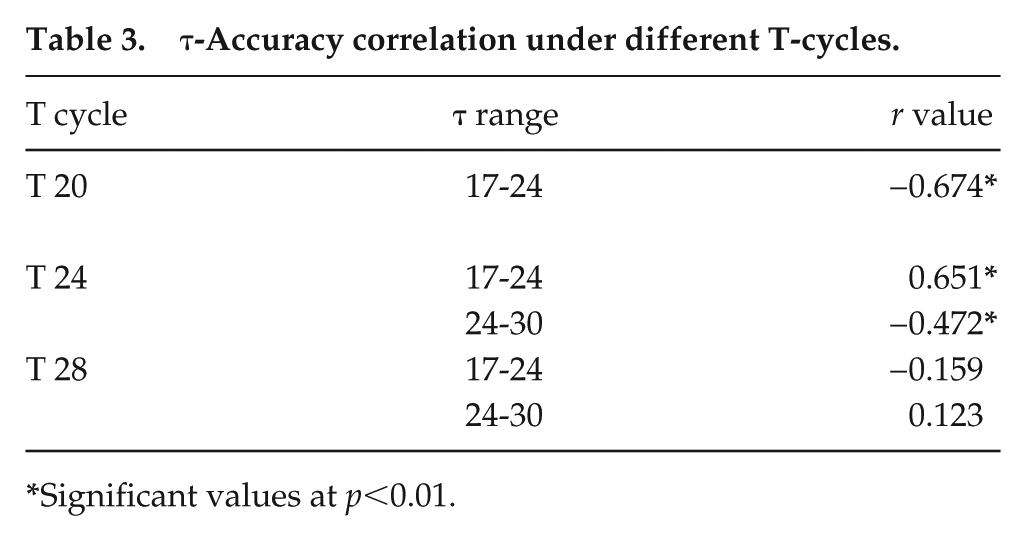
Significant values at p<0.01.
Next, we tested whether, for a given τ range, absolute value of accuracy itself varied across T-cycles. Separate one-way ANOVA (a composite ANOVA was not feasible in this case, as the long τ flies did not entrain under T20) for each period range was performed to test the effect of T-cycles on accuracy. The results revealed a significant effect of “T-cycle” on accuracy for the short (F2,53 = 53.00, p < 0.05) and intermediate (F2,62 = 28.71, p < 0.05) period ranges but not for the longer period range (p > 0.05). Individuals in the short period range showed higher accuracy in T20, as compared with that in other T-cycles (Fig. 6b), whereas those in the intermediate range showed higher accuracy in T24 (Fig. 6b). Figure 6b shows the comparison made across T-cycles, by replotting the data shown in Figure 6a. The data highlight that, for a given period range, accuracy is significantly lower in the 2 T-cycles that deviate from the mean τ. We also show the trends for accuracy for each period range under varying photoperiods (Supplemental Fig. S4).
Phase and Period Are Correlated
We tested the widely held notion that τ is strongly associated with ψ. To do so, we examined ψ for flies belonging to the 3 period ranges under 3 T-cycles. We show that the correlation of τ and ψ for the entire period range was significant under LD 12:12 (Fig. 7a, middle panel), where ψ was found to be delayed with an increase in τ. This correlation was also significant under T20 and T28 (Fig. 7a; Table 4). We also tested this relationship with a narrower period range. No significant τ-ψ correlations were obtained with smaller ranges of τ (17-19 h, 23-25 h, 26-30 h; Supplemental Table S3), suggesting that distinct phases are obtained only when largely deviant τ values are considered.
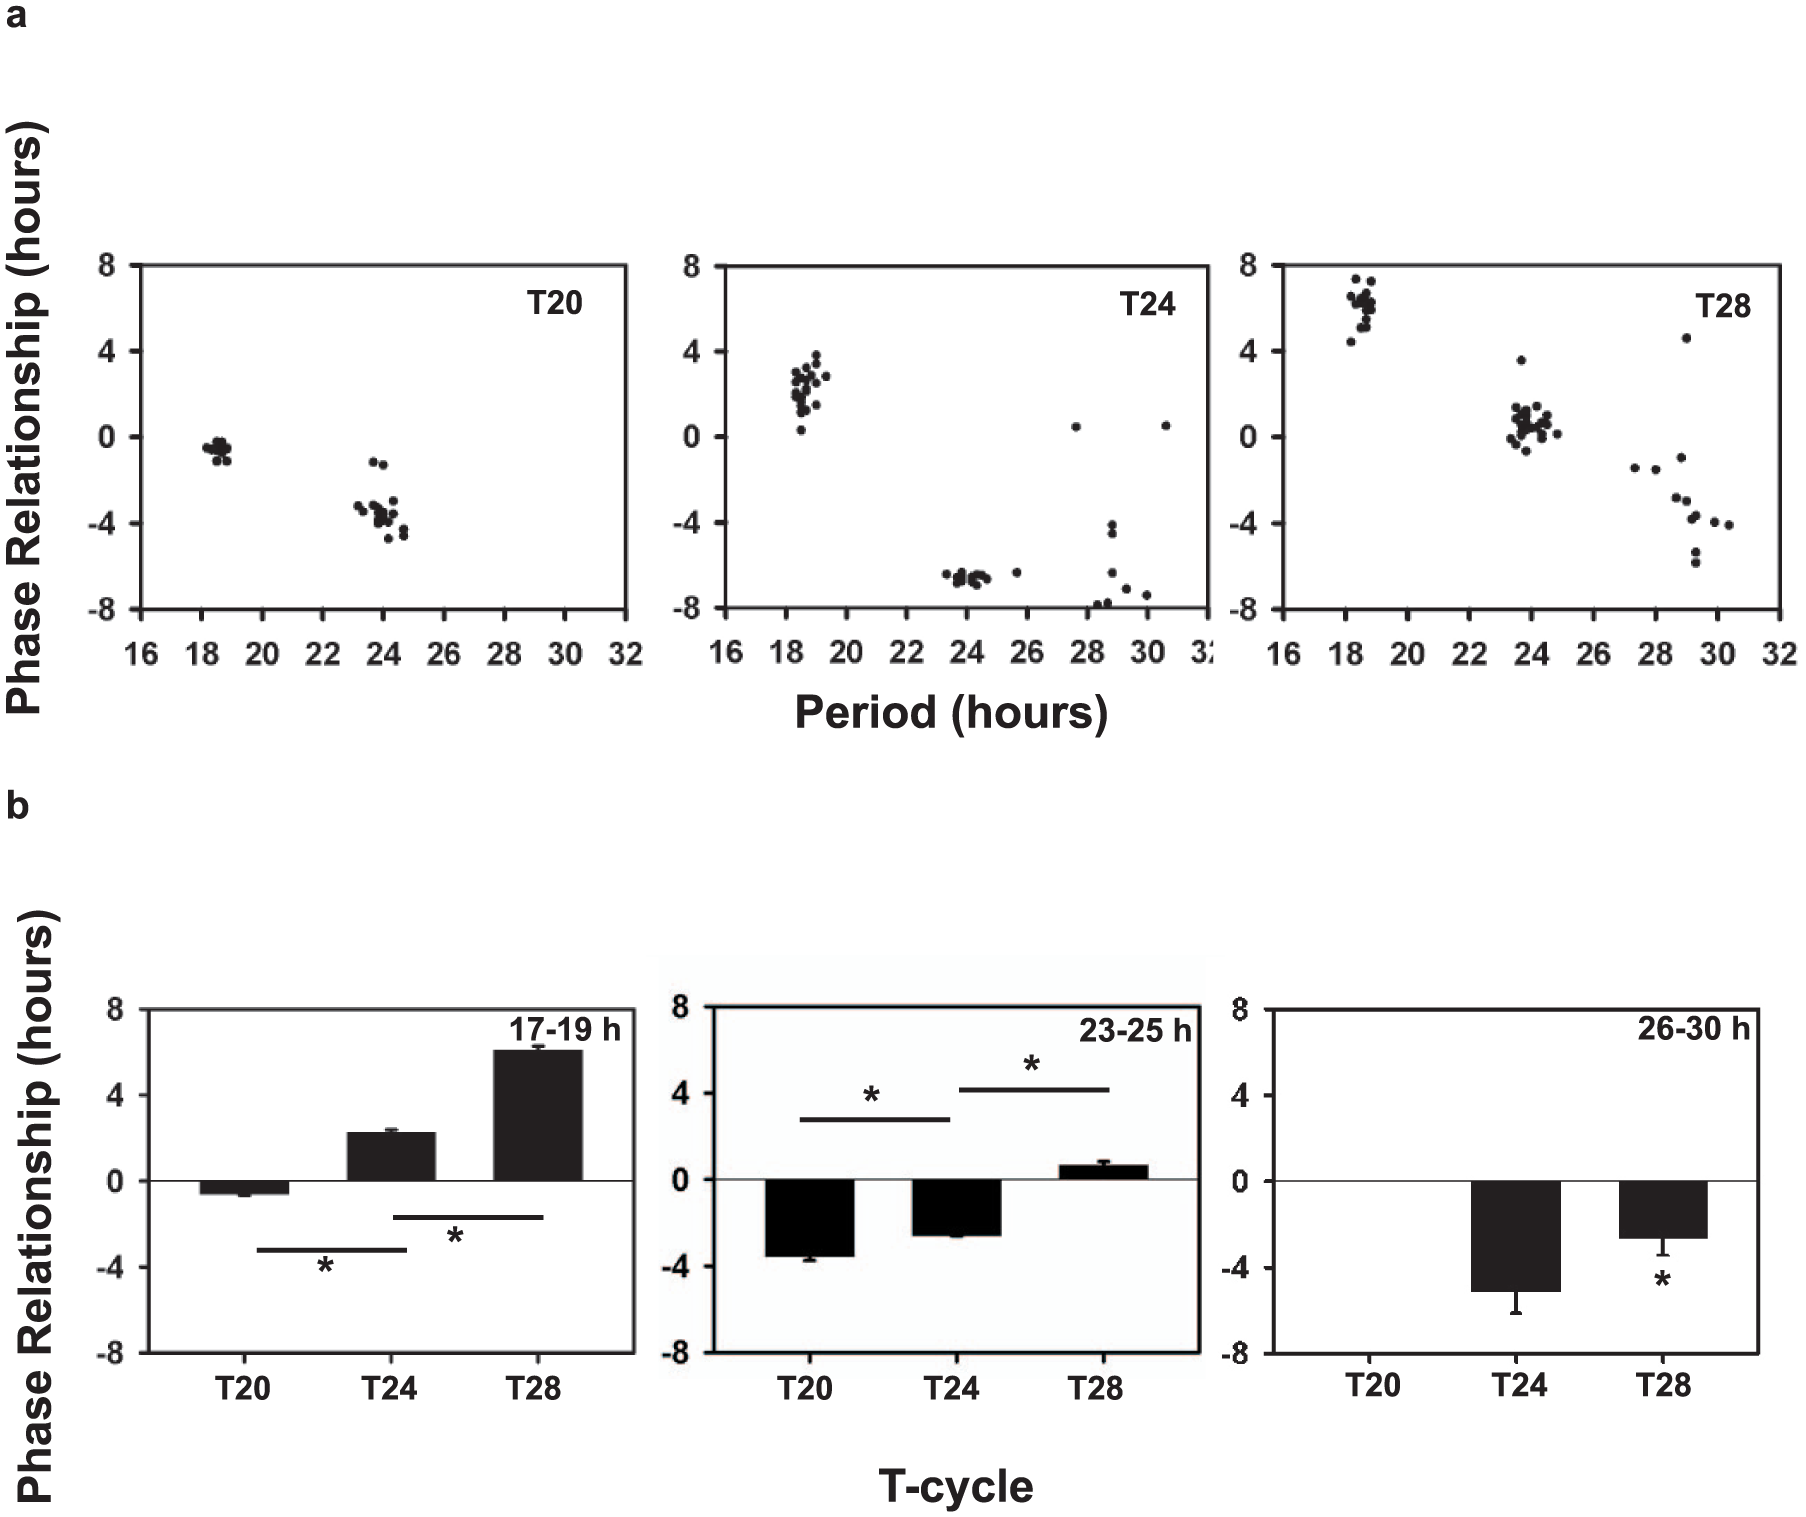
Comparison of phase relationship with period and T-cycles. (a) Correlation of phase relationship and period of individual flies with period values ranging from 17 to 30 h measured under different T-cycles: T20 (left), T24 (middle) and T28 (right). Dots represent the phase value on the y-axis for an individual fly, with the corresponding period value on the x-axis. Correlation coefficients are given in Table 4. Negative values imply a delayed phase relationship, and positive values an advanced phase relationship. (b) Comparison of phase relationship across T-cycles for the 3 period ranges: 17-19 h, 23-25 h and 26-30 h. Bars depict the mean phase-relationship across flies for each period range under each T-cycle. Error bars are SEM. Asterisks denote significant differences across T-cycles at p < 0.05.
τ-ψ Correlation under different T-cycles.
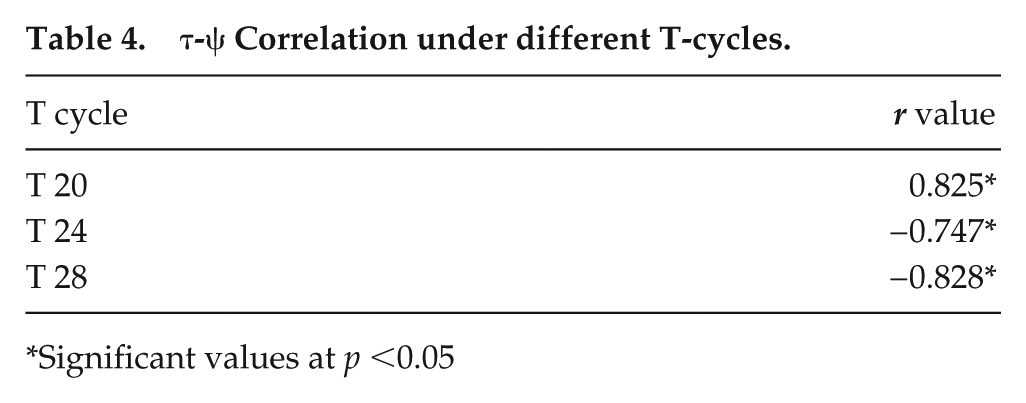
Significant values at p <0.05
Phase Differences Across T-cycles
We next tested the notion that ψ is advanced with increasing length of T-cycles, and found this to be the case. ANOVA on ψ for each of the period ranges across different T-cycles revealed a significant main effect of regime across period ranges (17-19 h: F2,53 = 1515.12, p < 0.05; 23-25 h: F2,61 = 783.41, p < 0.05; 26-30 h: F1,20 = 12.46, p < 0.05; Fig. 7b). Post-hoc comparisons showed that ψ under T28 was significantly advanced relative to T24 and T20 for period ranges of 17-19 h and 23-25 h (Fig. 7b). Flies of period range 26-30 h largely did not entrain to T20; however, under T28, ψ was more advanced compared with T24 (Fig. 7b).
Phase-response Curves for the Three Period Ranges
We constructed light-pulse PRCs for individual flies of the 3 period ranges (Fig. 8a). Two-factor ANOVA was used to test the effect of period range and time point on phase shifts. We found significant main effects of period range (F2,431 = 3.89, p < 0.05), time point (F5,431 = 11.34, p < 0.05), and their interaction (F10,431 = 11.34, p < 0.05). Interestingly, the extent of the phase shift did not differ significantly across the different circadian time points tested for short τ individuals (Fig. 8a, top). Further, whereas the intermediate τ range showed significantly greater advances at CT20 and delays at CT16 (Fig. 8a middle), the long τ range showed maximum advances at CT4 and delays at CT16 (Fig. 8a, bottom). For clarity, comparisons across period ranges for each time point are depicted in a combined manner in bar graphs (Fig. 8b), whereas comparisons across time points are shown as separate bar graphs for short (Fig. 8c, top), intermediate (Fig. 8c, middle) and long (Fig. 8c, bottom) period ranges. We also estimated delay/advance ratios (D/A) for each period range (D/A for short period range: 1.12; intermediate period range: 0.74; long period range: 0.63) and found reductions in the ratios with lengthening periods.
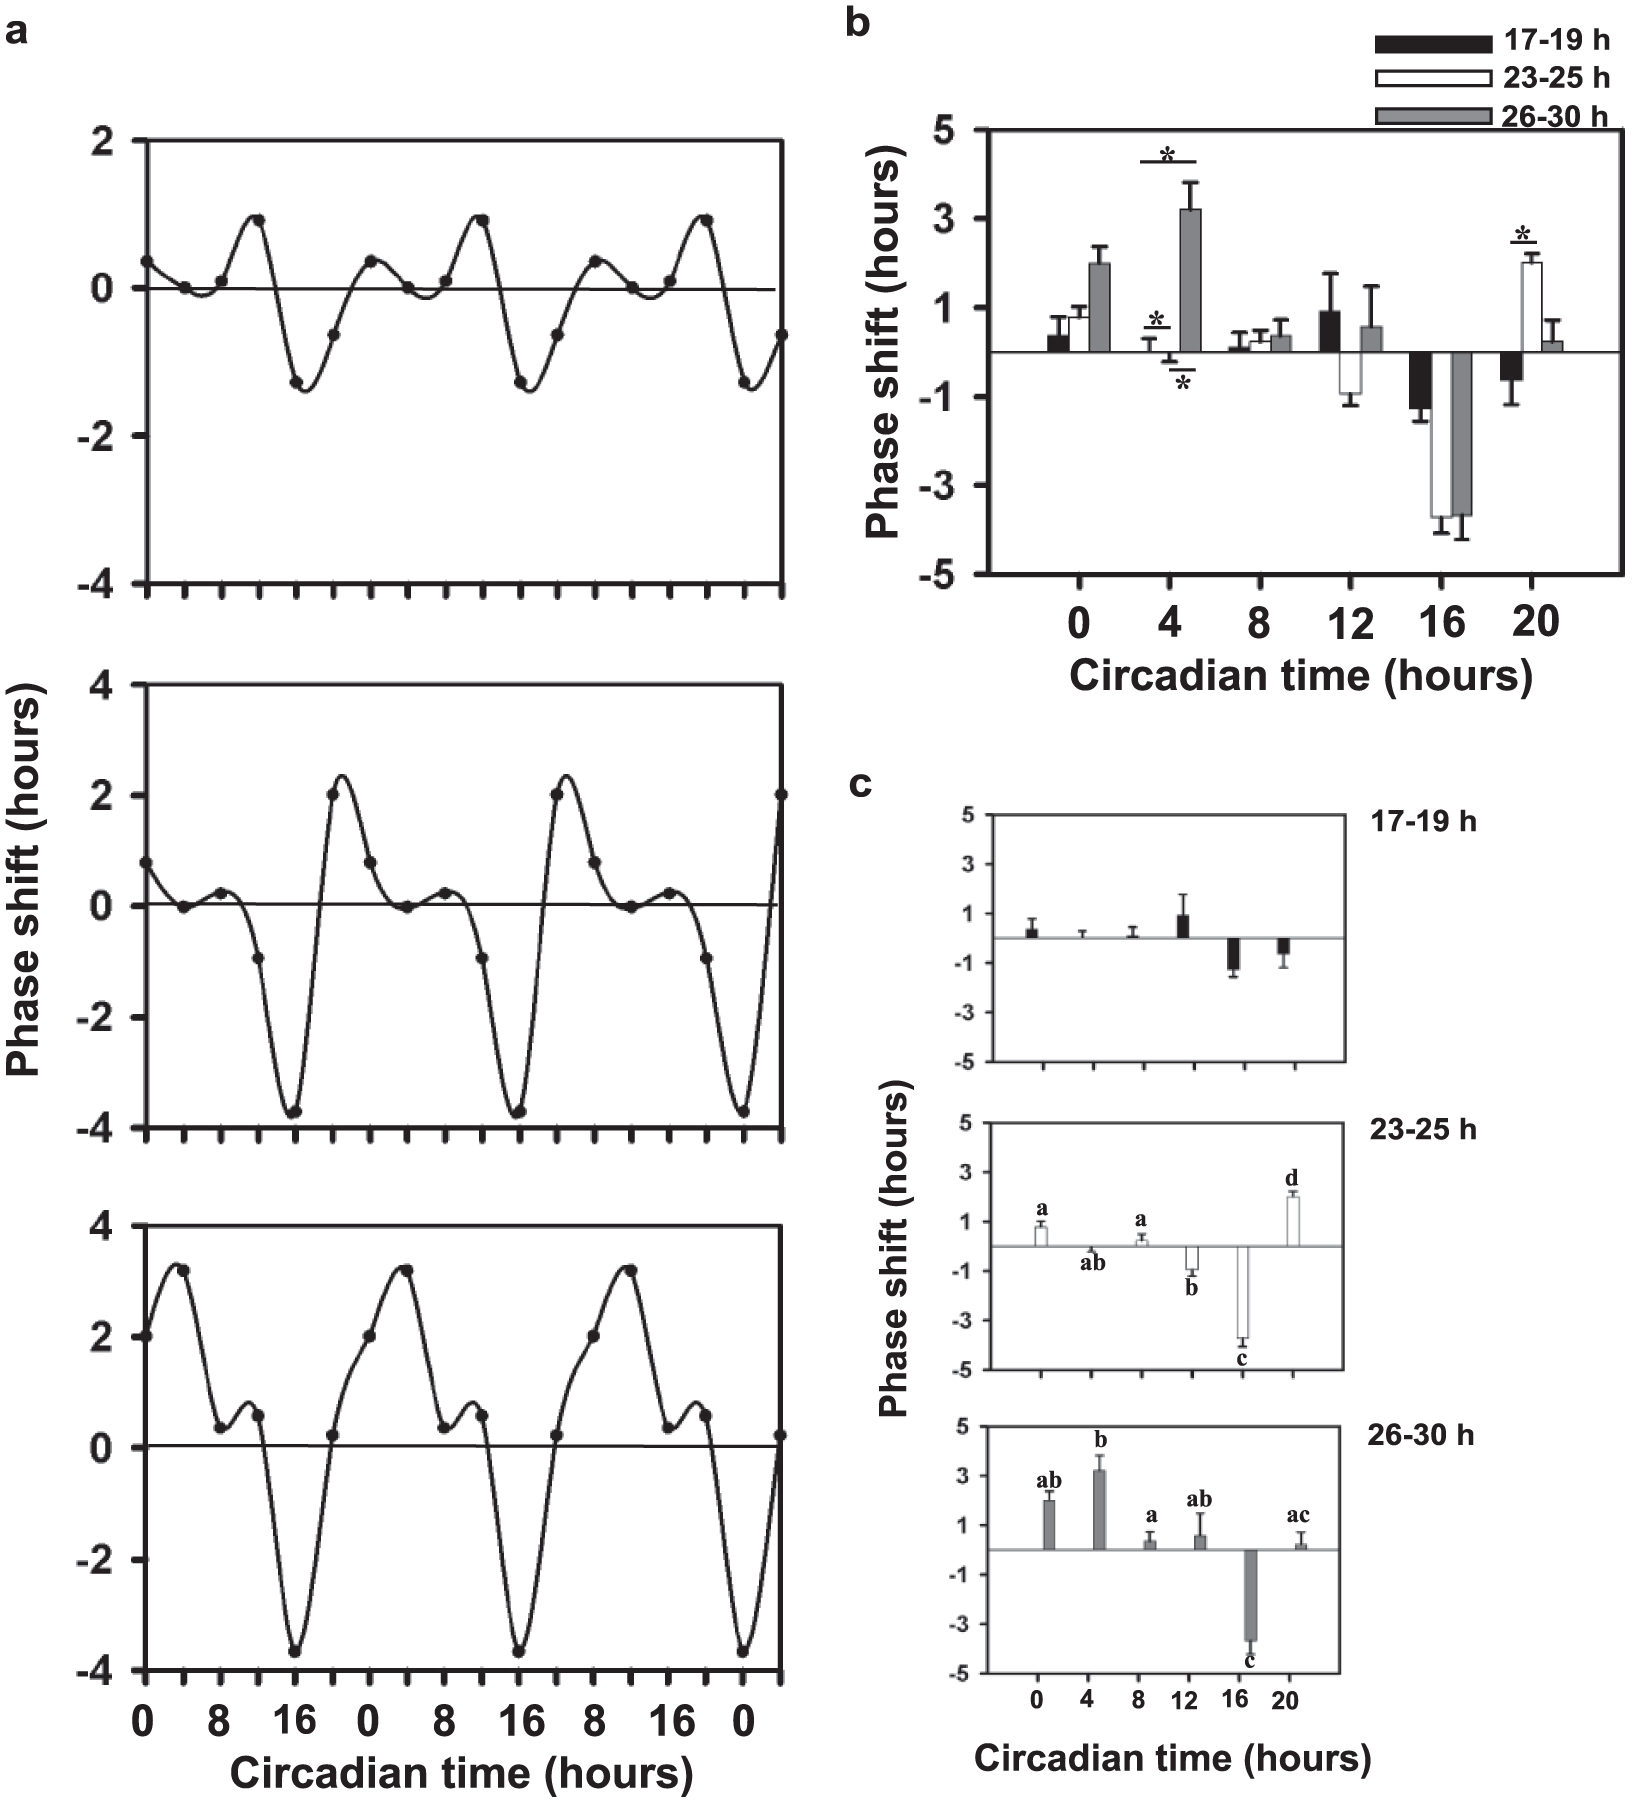
Phase-response curves of flies from the 3 period ranges. (a) Phase shifts in response to light pulses of 15 min duration and 1-lux light intensity plotted against circadian time for 17-19 h (top), 23-25 h (middle), and 26-30 h (bottom) (n ≈ 32 for each time point for each period range). Negative values imply a delayed phase relationship, and positive values imply an advanced phase relationship. The obtained curves have been tri-plotted for clarity. (b) Bar graphs showing comparisons across period ranges for each time point. (c) Bar graphs showing comparisons across time points for each period range: 17-19 h (top), 23-25 h (middle) and 26-30 h (bottom).
α and ρ Correlations
A significant negative correlation was found between α and succeeding ρ (Supplemental Fig. S3a, right) as well as between α and preceding ρ (Supplemental Fig. S3a, left) for all period ranges in DD (Supplemental Table S5). ANOVA results comparing the summed SDs of α and ρ with that of τ showed that the combined variation of α and ρ was significantly greater than the variation in τ for all period ranges examined (Supplemental Fig. S3b) (17-19 h [F1,56 = 24.547, p < 0.05]; 23-25 h [F1,46 = 19.332, p < 0.05]; 26-30 h [F1,56 = 20.445, p < 0.05]).
α and ρ Across Period Ranges
When α was compared across flies with different τ, a significant positive correlation of α and τ was seen in DD (Supplemental Fig. S3c, top left; Supplemental Table S6) as well as in LD (Fig. S3c, bottom left; Supplemental Table S6), suggesting that an increase in τ is achieved by increasing α. However, there was no significant correlation between ρ and τ in DD (Supplemental Fig. S3c, top right; Supplemental Table S6), whereas the 2 were negatively correlated in LD 12:12 (Supplemental Fig. S3c, bottom right; Supplemental Table S6). This suggests that ρ decreases in longer τ individuals whereas α increases to adjust to a shorter environmental cycle.
Discussion
Daily precision and persistence of rhythm are the most striking features of circadian rhythms (Pittendrigh, 1965). In this regard, the approach by Pittendrigh and Daan to understand the properties of the entrainment mechanisms of a complex circadian timing system had used the genetic diversity of natural populations of different species (Pittendrigh and Daan, 1976). However, the absence of a wide range of τ values and that major differences in τ were primarily found between species was a limitation to interpreting the relationship between τ and other clock properties. We conducted a comprehensive study and eliminated this limitation by using mutant lines reared in laboratory conditions and backcrossed to a wild-type, outbred fly stock derived from a natural population. Despite successes in cyanobacteria, Arabidopsis, and mice (Dodd et al., 2005; Ouyang et al., 1998; Wyse et al., 2010), previous attempts to use mutant fly lines to test circadian resonance in Drosophila with different light regimes have yielded negative results (Klarsfeld and Rouyer, 1998). However, this may be attributed to the lack of a common genetic background and/or the effects of inbreeding in mutant fly lines, which are typically critical for interpreting fitness traits. Because activity-rest patterns of flies are remarkably consistent in different environmental regimes, employing them to assess different clock properties, which indirectly contribute to fitness and therefore form the basis of circadian resonance, must help in deriving conclusions regarding the relevance of circadian period for wild-type organisms. Given that the population used for our backcrossing scheme has been maintained in the laboratory with a large population size (minimum ~1000 flies in each generation), factors such as mutation accumulation are unlikely to have mitigated the natural variation present in them. Hence, we feel that our study offers greater control over genetic background while using a greater range of τ values than previous studies on this issue. However, laboratory rearing for decades may have had effects on the genetic composition of our populations and could be a limitation in making interpretations in the context of selection in the wild. Our primary aim was to study different clock properties in the context of existing models of entrainment rather than infer the effects of natural selection on τ and precision alone, and therefore we reasoned that this approach would be an advancement over previous studies.
Previous studies have suggested that clocks with τ close to 24 h would show higher precision (Aschoff, 1971; Pittendrigh and Daan, 1976; Sharma and Chandrashekaran, 1999), which we did not find when data from multiple independent experiments were analyzed separately (Fig. 1b, Table 1). However, this correlation was found to be significant when we pooled data across experiments (Supplemental Table S4, n ≈ 640). This suggests that the above inconsistency could be a result of the difference in sample sizes. For other correlations, e.g., those for phase relationship and accuracy, this problem is not encountered. Therefore, we consider period precision correlation to be weak. For instance, Sharma and Chandrashekaran (1999) used large sample sizes of mice (~240) and reported significantly higher precision for τ close to 24 h. In contrast, with another rodent species (Syrian hamster) and relatively smaller sample size (~30-60), no significant correlation was detected (Bittman, 2012). However, we could also implicate certain methodological limitations or differences across model organisms in the previous studies to be responsible for the differences in the results. For instance, the study by Pittendrigh and Daan involved rodents of different species with different ranges of τ, which were pooled together to obtain a correlation between precision and τ (Pittendrigh and Daan, 1976). Various loci can influence clock properties (Shimomura et al., 2001; Takahashi et al., 2008) and, therefore, a comparison of these clock properties across species may not be ideal, given that several factors, including genetic background, ancestry or ecological niches, could confound the interpretation of the results. Similarly, in another study where this correlation was observed, a larger range of τ was generated for the comparison of period and precision in birds by exposure to constant light (Aschoff, 1971). This approach might have produced effects on the clock apart from a change in τ, since constant light can induce after-effects, the decoupling of oscillators, and arrhythmia at higher intensities (Pittendrigh and Daan, 1976). Indeed, Aschoff and colleagues noted that constant light may induce changes in activity durations as well as phase variability by changes in the threshold level of the oscillator (Aschoff, 1971). Hence, the correlations observed in the study on birds may not reflect the true relationship between endogenous τ and precision. Although the study on Mus booduga was conducted on mice of a similar genetic background and avoided artificial manipulations of τ (Sharma and Chandrashekaran, 1999), the range of τ obtained across individuals was narrow, with few individuals showing τ greater than 24 h. Hence, these results suggest that the correlation between τ and precision is somewhat inconsistent, relative to some of the other correlations between clock properties. We also show the relationship between accuracy with τ across 3 different light intensities (Supplemental Fig. S5). We did not observe greater accuracy with an increase in strength of zeitgeber for any period range. Hence, we do not believe that using a strong zeitgeber would change our conclusions regarding the relationships between these clock properties.
The finding from our results that precision is not always greater when τ approximates 24 h does not support the notion that individuals with τ close to 24 h are selected for increased precision. Indeed, it is the phase relationship of the rhythm with the external cycle and its accuracy that confers adaptive advantage to the organism (Roenneberg and Merrow, 2015). We also do not see any sudden dip in the frequency distribution of our period data at 24 h (Supplemental Fig. S1c), which would be expected according to the proposed hypothesis. It has been speculated previously that variation in τ has no direct correlation with fitness and therefore τ is susceptible to random variation within a circadian limit (Shimizu et al., 1997). Moreover, precision was also observed to be unrelated to τ in homogenized lines of closely related Syrian hamsters with τ ranging from 17.8 to 24.2 h (Bittman, 2012). Our results provide evidence in favor of a weak correlation between τ and precision.
In our study, accuracy under LD 12:12 was higher for individuals lying in the intermediate period range as compared with those in the short and long period ranges (Fig. 6a). This demonstrates that individuals with τ closer to 24 h can entrain to 24h LD cycles with greater stability of entrained phase relative to clocks with τ deviating from 24 h. The trends in accuracy across period ranges, however, were seen to differ in altered periodicities of the external cycle (T). To some extent, the accuracy values were higher when T matched τ. For example, flies with shorter τ showed higher accuracy under T20 (Fig. 6a). However, accuracy for flies in this range was reduced under both T28 and T24 (Fig. 6b, left), which indicates that the enhanced accuracy observed under T20 is indeed because T matched τ and not just because it is within the range of entrainment. Similarly, individuals with an intermediate τ exhibited reduced accuracy under shorter and longer T (Fig. 6b, middle).
It is interesting that long period-range individuals do not show greater accuracy than other period ranges under T28. This could be attributed to the nature of the long period mutant gene (perl), which produces a PER protein that has a defective interaction with TIM. The interaction between TIM and PER is thought to determine the nuclear entry of PER (Gekakis et al., 1995); regulated timing of the nuclear translocation of PER has been considered a critical determinant of τ (Vosshall et al., 1994). Moreover, it is argued that the presence of inter-locked feedback loops is essential for increased rhythm stability and robustness in the face of random perturbations or noise (Brown et al., 2012; Partch et al., 2014); therefore, reduced accuracy and precision of long period range flies may be attributed to this defect in one component of the molecular feedback loop. However, recent studies under natural-like conditions have shown that nuclear entry of PER and TIM are not always synchronous under summer conditions mainly due to long photoperiods (Menegazzi et al., 2013). Hence, although we acknowledge that inferences from the experiments described here are limited to laboratory conditions with low strength of zeitgeber and symmetric photoperiod, the role of differences in the interlocked feedback loops in rhythm stability can be thought of as a more general phenomenon affecting different period range individuals to different extents. We also see that the trends in accuracy vary under different photoperiods; however, there is no consistent trend with increasing photoperiods for any period range (Supplemental Fig. S4). We wish to point out that the effects of the alleles perl or pers on precision, accuracy, and ψ cannot be treated purely as effect of lengthening or shortening τ. It is likely that specific and unique effects of the altered sequences influence steps in clock resetting in addition to their influence on τ. For example, mutations of per may influence coupling strength, which consequently alters pacemaker lability and range of entrainment.
Because precision was also not correlated with accuracy of the entrained phase in our study (Fig. 2b), other properties of the clock may be important for such resonance-dependent increase in accuracy and, therefore, be under indirect selection. These results suggest that accuracy is not a function of the variability of the clock’s intrinsic period alone but varies depending on the external conditions. These results also suggest that accuracy of phase may be affected by sensitivity of the clock to zeitgebers, as individuals with similar levels of precision show differences in accuracy (Fig. 2b). However, based on the PRCs we obtained, reduced accuracy exhibited by long period-range flies cannot be explained by the relatively large-amplitude PRCs, given that large magnitude phase shifts are expected to contribute to greater accuracy (Beersma et al., 1999). For instance, conservation of phase across different environmental conditions, such as photoperiods, was proposed to be enhanced by large-amplitude PRCs (Pittendrigh and Daan, 1976). Nevertheless, large-amplitude PRCs have steep slopes and, therefore, small daily variability in the internal clock period can result in light falling at different parts of this steep portion, resulting in vastly different phase shifts. Such daily differences in phase shift could also compromise accuracy of the entrained phase in individuals with PRCs having steep slopes, and could explain the reduced accuracy seen in long-period flies. Whereas molecular clocks consisting of cycling proteins of the core clock genes period and clock would be expected to determine intrinsic clock period and its precision (Gonze et al., 2002), accuracy of entrained rhythms would be also affected by the activity of CRYPTOCHROME and degradation of TIMELESS proteins in response to light (Busza et al., 2004; Emery et al., 1998). This could also explain why we do not find strong correlations between precision and τ, as accuracy does not seem to depend on precision and therefore, selection for greater accuracy may not entail concomitant selection for precision. Moreover, theoretical studies have suggested that factors affecting accuracy under naturalistic LD cycles where continuous, fluctuating zeitgeber are present, may be significantly different from those under square-wave, laboratory LD cycles (Beersma et al., 1999). Thus, we must qualify our interpretations as being limited to observations made under laboratory conditions alone.
Our results support the predictions based on the discrete model of entrainment (Daan and Pittendrigh, 1976; Pittendrigh and Daan, 1976): that ψ would be delayed with an increase in τ, as this was found to be true under all T-cycles examined (Fig. 7a). In earlier studies, the trend of ψ being delayed for greater τ was seen even when period range was considerably narrower (Daan and Pittendrigh, 1976; Pittendrigh and Daan, 1976: 23.6-24.8 h; Sharma and Chandrashekaran, 1999; Sharma et al., 1999: 23-24 h). However, in our study when similar narrow ranges of τ were considered (0.5 to 1 h), correlation between τ and ψ was not significant (Supplemental Table S3). This could be limited by the methodology of our measurement of ψ and τ within such narrow ranges, because, in such cases, the intra-individual variability in ψ and τ would be greater than the variability between individuals (almost twice in the case of short- and intermediate-period ranges). The relationship of ψ with different T has been considered as a criterion for entrainment as opposed to masking (Aschoff, 1965), where the phase of a rhythm would immediately follow a transition from dark to light or light to dark, irrespective of T. Supporting the findings of a previous study (Aschoff and Pohl, 1978), where a relatively small range of τ was examined, we show that, even across a wide range of τ, with increasing length of T-cycles, ψ was advanced (Fig. 7b). Interestingly, the crossover point of phases is not observed when the internal and external period match. However, within the framework of the non-parametric model of entrainment, the cross-over point of the phase relationship between negative and positive values always occurring at τ = T will be true only under the following assumptions:
1) There is no dead zone in the PRC, and there is exactly one point at which the phase-shift will be equal to 0, when τ = T, such that entrainment can occur.
2) All phase markers of the overt rhythm will map onto the clock phases (or phases of the PRC) in a one-to-one manner, and therefore all phases will phase-shift by the exact same amount.
Given our results, we claim that the non-parametric model of entrainment is not sufficient to explain all features of entrainment. We can extend that argument to explain why the cross-over does not exactly fall at the point where τ = T. We can additionally attribute this to differences in the parametric effects of light on the clock.
Based on the D/A ratios, the pattern of phase shifts obtained across time points for flies with different τ meets the expectations of the non-parametric model of entrainment for long τ flies, which exhibit larger advance regions, and short τ flies, which show larger delay regions. However, the range of entrainment that we obtained for the 3 genotypes does not completely conform to expectations based on the observed phase shifts, because flies with longer τ would be expected to show a wider range of entrainment compared with those with shorter τ, since they exhibit larger-amplitude PRCs. Perhaps, the non-parametric model of entrainment—initially proposed based on the results from a different species of fly, D. pseudoobscura with a type 0 PRC and on which most of our hypotheses were based—is not enough to explain the relationships among clock properties for a broad range of τ. However, the trend in D/A ratios implies period range-dependent differences in the parametric effects of light, which may contribute to the observed differences. In the case of short-period flies, since the shape of the PRC is similar to that for other period ranges, we speculate that the lack of significant phase shift could be due to large inter-individual variability in the phase shifts that we obtained. Overall, PRCs of the period mutants are largely comparable with previously reported PRCs (using higher light intensity and duration) on these mutants (Saunders et al., 1994). However, we obtained relatively small-amplitude PRCs and, especially in case of pers, we did not detect any significant phase shifts. We would also like to emphasize that, although the shape of the PRC can vary depending on species, the results regarding phase-period relationships are consistent across organisms and abide by the previously proposed hypothesis. These results therefore not only provide evidence for the existence of such a relationship but also provide value to our approach.
In our study, activity and rest durations were found to be interdependent and negatively correlated under constant conditions for all period ranges examined. However, the correlation of α seems to be stronger with the preceding ρ for all 3 period ranges (Supplemental Fig. S3). This observation was similar to that from a previous study on Syrian hamsters, where the correlation of α and succeeding ρ was found to be stronger across the full range of τ examined (Bittman, 2012). Therefore, the correlation between α and ρ does not appear to be dependent on τ, which is inconsistent with Aschoff’s predictions (Aschoff, 1971). Instead, it appears that the relationships vary across different model organisms used in the different studies. The importance of α-ρ interdependence in maintaining the stability in τ was further shown by comparing the summed variation of α and ρ and the variability in τ itself. We found that variation in τ, measured using offsets, was consistently lower than the summed variability of α and ρ (Supplemental Fig. S3). These results suggest that both α and ρ vary across days in a manner that minimizes the variation in period, as also previously discussed by Aschoff (1971). These results support the findings from the previous study on birds and humans (Aschoff, 1971) and the study on Syrian hamsters (Bittman, 2012). Chaffinches, which have roughly equal α and ρ, also showed the highest precision in the former study; though, this was not observed in our study, since most flies showed a higher α compared with ρ.
Aschoff’s study suggested that the increase or decrease in τ is mostly due to changes in the ρ in each cycle (Aschoff, 1971). It was, however, later reported that short period mutants of female Drosophila change their activity duration while the longer period mutants change their rest duration (Saunders, 1994). A proportionate reduction in both α and ρ was shown in tau and duper mutants of Syrian hamsters (Bittman, 2012). Our results show that α—but not ρ—fluctuates to bring about a change in the intrinsic period. The inconsistencies in the findings from different studies could be because the trends are specific to the model organisms. Such changes could also be determined by which of the two—α or ρ—is flexible to bring about change in period. Under LD 12:12, α increased and ρ decreased for individuals with increasing periods. These results indicate that both activity and rest durations are adjusted for entrainment to different LD conditions.
Aschoff had proposed a level-and-threshold model to explain the changes in circadian clock properties with changes in period and illumination (Aschoff et al., 1971). According to this model, the waveform of the circadian oscillation may be represented by the change in levels of some physiological variable, which is a proxy for the state of the endogenous oscillator. Since the levels of this variable represent the state of the circadian cycle, it would also determine the propensity for activity of the organism that is gated by the clock. He proposed that this oscillation passes through a threshold twice during every cycle and if the oscillation is above the threshold, the organism is active. This model predicts that α should be correlated with both succeeding and preceding ρ, which is consistent with our findings. However, the hypotheses based on the extension of the model, which assumes that the shape or skew of the endogenous oscillation would change with τ, does not fit our observations. According to this assumption, an oscillation with a short τ would be left-skewed and therefore have higher precision for onset of activity as compared with offset and vice versa. However, we found offsets to be more precise for all 3 period ranges (Fig. 1). It can be speculated therefore that the skew does not change with τ as strictly as hypothesized previously.
It is important to note that while making predictions about the change in the α-ρ relationship with τ (Aschoff et al., 1971), it was assumed that the change in the level of oscillation was caused by changing the intensity of light, which therefore changed τ and α. However, in our study and in some previous studies, individuals with distinct τ values were obtained using mutations (Bittman, 2012; Saunders et al., 1994). The effect of varying environmental conditions on τ could be quite different from that of a mutation in a core-clock gene, as in our case. Moreover, the effects of mutations also may be different under natural environments compared with laboratory conditions, as has been observed (Vanin et al., 2012). Therefore, it is important to keep in mind these considerations before making conclusions about clock properties and their relationships with τ.
In summary, our results show weak correlations between period and precision of the clock. However, phase relationship and its accuracy under entrained conditions is a result of the interaction between intrinsic period and periodicity of the external cycle. We also find some evidence in support of the threshold model to explain the patterns of activity and rest durations observed in our study but do not find our results to be entirely consistent with the non-parametric model of entrainment. While it is likely that several factors, such as the strength of the zeitgeber, duration of the photic phase and even rearing conditions can affect accuracy, we acknowledge that inferences from the experiments described here are limited to low strength of zeitgeber, a mostly symmetric photoperiod, and a fixed rearing regime. Further studies accounting for different photoperiods and natural-like environments may help make these conclusions more general.
Supplemental Material
Supplementary_Material__Page_1 – Supplemental material for Circadian Clock Properties and Their Relationships as a Function of Free-Running Period in Drosophila melanogaster
Supplemental material, Supplementary_Material__Page_1 for Circadian Clock Properties and Their Relationships as a Function of Free-Running Period in Drosophila melanogaster by Manishi Srivastava, Vishwanath Varma, Lakshman Abhilash, Vijay Kumar Sharma and Vasu Sheeba in Journal of Biological Rhythms
Supplemental Material
Supplementary_Material__Page_7 – Supplemental material for Circadian Clock Properties and Their Relationships as a Function of Free-Running Period in Drosophila melanogaster
Supplemental material, Supplementary_Material__Page_7 for Circadian Clock Properties and Their Relationships as a Function of Free-Running Period in Drosophila melanogaster by Manishi Srivastava, Vishwanath Varma, Lakshman Abhilash, Vijay Kumar Sharma and Vasu Sheeba in Journal of Biological Rhythms
Supplemental Material
Supplemetary_Material__Page_2 – Supplemental material for Circadian Clock Properties and Their Relationships as a Function of Free-Running Period in Drosophila melanogaster
Supplemental material, Supplemetary_Material__Page_2 for Circadian Clock Properties and Their Relationships as a Function of Free-Running Period in Drosophila melanogaster by Manishi Srivastava, Vishwanath Varma, Lakshman Abhilash, Vijay Kumar Sharma and Vasu Sheeba in Journal of Biological Rhythms
Supplemental Material
Supplemetary_Material__Page_3 – Supplemental material for Circadian Clock Properties and Their Relationships as a Function of Free-Running Period in Drosophila melanogaster
Supplemental material, Supplemetary_Material__Page_3 for Circadian Clock Properties and Their Relationships as a Function of Free-Running Period in Drosophila melanogaster by Manishi Srivastava, Vishwanath Varma, Lakshman Abhilash, Vijay Kumar Sharma and Vasu Sheeba in Journal of Biological Rhythms
Supplemental Material
Supplemetary_Material__Page_4 – Supplemental material for Circadian Clock Properties and Their Relationships as a Function of Free-Running Period in Drosophila melanogaster
Supplemental material, Supplemetary_Material__Page_4 for Circadian Clock Properties and Their Relationships as a Function of Free-Running Period in Drosophila melanogaster by Manishi Srivastava, Vishwanath Varma, Lakshman Abhilash, Vijay Kumar Sharma and Vasu Sheeba in Journal of Biological Rhythms
Supplemental Material
Supplemetary_Material__Page_5 – Supplemental material for Circadian Clock Properties and Their Relationships as a Function of Free-Running Period in Drosophila melanogaster
Supplemental material, Supplemetary_Material__Page_5 for Circadian Clock Properties and Their Relationships as a Function of Free-Running Period in Drosophila melanogaster by Manishi Srivastava, Vishwanath Varma, Lakshman Abhilash, Vijay Kumar Sharma and Vasu Sheeba in Journal of Biological Rhythms
Supplemental Material
Supplemetary_Material__Page_6 – Supplemental material for Circadian Clock Properties and Their Relationships as a Function of Free-Running Period in Drosophila melanogaster
Supplemental material, Supplemetary_Material__Page_6 for Circadian Clock Properties and Their Relationships as a Function of Free-Running Period in Drosophila melanogaster by Manishi Srivastava, Vishwanath Varma, Lakshman Abhilash, Vijay Kumar Sharma and Vasu Sheeba in Journal of Biological Rhythms
Footnotes
Acknowledgements
We are grateful to Prof. Eric Bittman and Dr. KL Nikhil for discussions on our results and two anonymous reviewers for critical comments and suggestions on a previous version of the manuscript. We thank summer students Thapasya Vijayan, Bharathi N, for help during experiments and Rajanna Narasimhaiah and Muniraju Muniappa for technical assistance. Jawaharlal Nehru Centre for Advanced Scientific Research and Department of Science and Technology SERB, India, are acknowledged for funding.
authors’ note
This study was conceived by Vijay Kumar Sharma and the questions posed therein were especially dear to him, the authors would like to dedicate this paper to the memory of an ardent chronobiologist and teacher.
Author Contributions
VKS conceived the idea and designed the experiments along with MS and VV. MS conducted the experiments and analysis. MS, VV and VS wrote the manuscript. MS, VV, LA, VKS and VS contributed to the interpretations presented. All authors (except VKS) read the final version of the manuscript.
Conflict of Interest Statement
The author(s) have no potential conflicts of interest with respect to the research, authorship, and/or publication of this article.
Notes
References
Supplementary Material
Please find the following supplemental material available below.
For Open Access articles published under a Creative Commons License, all supplemental material carries the same license as the article it is associated with.
For non-Open Access articles published, all supplemental material carries a non-exclusive license, and permission requests for re-use of supplemental material or any part of supplemental material shall be sent directly to the copyright owner as specified in the copyright notice associated with the article.