
Abstract
The insect antennae receive olfactory information from the environment. In some insects, it has been shown that antennal responsiveness is dynamically regulated by circadian clocks. However, it is unknown how general this phenomenon is and what functions it serves. Circadian regulation in honeybee workers is particularly interesting in this regard because they show natural task-related chronobiological plasticity. Forager bees show strong circadian rhythms in behavior and brain gene expression, whereas nurse bees tend brood around-the-clock and have attenuated circadian rhythms in activity and whole-brain gene expression. Here, we tested the hypothesis that there is task-related plasticity in circadian rhythms of antennal responsiveness to odorants in worker honeybees. We used electroantennogram (EAG) to measure the antennal responsiveness of nurses and foragers to general odorants and pheromones around the day. The capacity to track 10-Hz odorant pulses varied with time of day for both task groups but with different phases. The antennal pulse-tracking capacity was higher during the subjective day for the day-active foragers, whereas it was better during the night for around-the-clock active nurses. The task-related phases of pulse-tracking rhythms were similar for all the tested stimuli. We also found evidence for circadian rhythms in the EAG response magnitude of foragers but not of nurses. To the best of our knowledge, these results provide the first evidence for circadian regulation of antennal olfactory responsiveness and odorant pulse-tracking capacity in bees or any other hymenopteran insect. Importantly, our study shows for the first time that the circadian phase of olfactory responsiveness may be socially regulated.
Keywords
Olfaction is crucial for processing ecologically relevant information and for initiating physiological and behavioral responses in many animals. In most insects, the antennae are the main olfactory organ. Odor filaments that make up odor plumes are dispersed by turbulence and mix rapidly with other airborne chemicals (Murlis et al., 1992; Vickers, 2000; Andersson et al., 2011; Riffell et al., 2014). Insect antennal olfactory receptor-neurons can track fast odorant fluctuations (Lemon and Getz, 1997; Bau et al., 2002; Hinterwirth et al., 2004; Schuckel et al., 2008; Kim et al., 2011; Getahun et al., 2012; Szyszka et al., 2014), and insects use temporal stimulus-cues for segregating odor objects from the milieu of background odors (Baker et al., 1998; Fadamiro et al., 1999; Nikonov and Leal, 2002; Szyszka et al., 2012; Saha et al., 2013). Maintaining a high responsiveness and odorant pulse-tracking capacity of olfactory receptor neurons may be energetically expensive (Niven and Laughlin, 2008), and it may be adaptive to down-regulate antennal responsiveness and pulse-tracking capacity at times of reduced vigilance or activity. Indeed, circadian clocks, which are endogenous systems that generate rhythms with a period of ~24 h, have been implicated in regulating the level of antennal responsiveness (Gadenne et al., 2016).
Some insect odor-guided behaviors are adaptively performed at specific favorable times. For example, courtship and mating behaviors that are initiated by volatile sex pheromones have been studied in diverse insect species. These behavioral responses to the female calling commonly vary with time of day, and for some species, there is good experimental evidence for endogenous circadian regulation (Zhukovskaya, 1995; Rosen et al., 2003; Silvegren et al., 2005; Fujii et al., 2007; Rymer et al., 2007). In some moth species, the time of highest male sensitivity to the sex attractants is precisely aligned with the time of sex pheromone release by the female, which is also under circadian regulation (Baker and Cardé, 1979; Rosen, 2002; reviewed in Bloch et al., 2013; Gadenne et al., 2016). Circadian regulation was also shown for odor-guided behaviors other than those associated with mating. For example, the attraction or repulsion of Drosophila melanogaster flies to low or high concentrations of some odorants (Zhou et al., 2005), respectively, and the host-seeking behavior of blood-feeding insects such as triatomine bugs, mosquitoes, and tsetse flies are under circadian regulation (reviewed in Gadenne et al., 2016).
One could assume that animals are most responsive to odors at times of increased arousal or activity. Some studies are indeed consistent with this premise. For example, the responsiveness of the mouse olfactory bulb (the mammalian olfactory processing organ) to odors is circadianly regulated, and perceptual odor discrimination is better during the night when these nocturnal rodents are most active (Granados-Fuentes et al., 2006; Granados-Fuentes et al., 2011). Similar phase relationships were also shown for blood-feeding mosquitoes, triatomine bugs, and tsetse flies, for which peak antennal responsiveness to host odors co-occurs with the time they show increased host-seeking behaviors (Gadenne et al., 2016). However, rhythms in insect olfactory responsiveness and behavior are not always aligned, and their phase relationships may vary with species, behavior, or odorant identity. For example, the circadian phase of antennal responsiveness is almost opposite to the time of increased locomotor activity in D. melanogaster, the cockroach Leucophaea maderae, and the moth Spodoptera littoralis (Krishnan et al., 1999; Page and Koelling, 2003; Merlin et al., 2007; Rymer et al., 2007; Saifullah and Page, 2009). In some other moth species, the responsiveness of the male antennae to the female sex attractant seems not to be circadianly regulated because it does not vary with time of day even when recorded under a light-dark illumination regime (Payne et al., 1970; Worster and Seabrook, 1989; Rosen et al., 2003). This is despite the evidence for circadian rhythms in the behavioral responses to the same pheromones in these species. In the bug Rhodnius prolixus, the antennal responsiveness to host odors peaks at around dusk, matching its host-seeking time, but the response to another odorant, the aggregation pheromone, is not circadianly regulated, even though the bug aggregation behavior typically occurs at dawn (Bodin et al., 2008). These studies illustrate the diversity and complexity of the phase relationships between circadian regulation of olfactory responsiveness to odorants and circadianly regulated behaviors. To find common principles governing these phase relationships and understand their functional significance, it is necessary to study additional species, behaviors, and ecologically relevant odorants.
The honeybee provides an excellent model system with which to study these relationships. The olfactory system of honeybees is well characterized (Galizia and Roessler, 2010; Sandoz, 2012; Roessler and Brill, 2013), and honeybees show remarkable natural socially regulated plasticity in circadian rhythms (Bloch, 2010; Eban-Rothschild and Bloch, 2012). Young honeybee workers typically tend (“nurse”) the brood around-the-clock (i.e., with a similar level of activity throughout the day), whereas at a later age, workers typically forage for pollen and nectar during the day and sleep inside the hive during the night (reviewed in Eban-Rothschild and Bloch, 2012). Forager honeybees show strong circadian rhythms in whole-brain clock-gene transcript abundance. Nurses, on the other hand, typically show similar brain levels of the same transcripts throughout the day. This natural task-related plasticity in activity rhythms is thought to be functionally significant because foragers rely on their circadian clock for timing visits to flowers and for time-compensated sun-compass navigation, while around-the-clock care may improve or accelerate brood development (Moore, 2001; Bloch, 2010; Eban-Rothschild and Bloch, 2012). However, the endogenous circadian clock of nurse bees does not stop. Pacemaker neurons show similar strong oscillations in PERIOD protein levels in the brains of both around-the-clock active nurses and rhythmic foragers (Fuchikawa et al., 2017). A microarray study further revealed that the abundance of approximately 160 transcripts in the nurse brain vary with a period of about 24 h, which is consistent with circadian regulation of their expression or stability (Rodriguez-Zas et al., 2012). The nurse internal clocks are further revealed when they are removed from the brood. Shortly after being deprived of contact with larvae, nurse bees show circadian rhythms in activity and whole-brain clock-gene expression, with a phase similar to the ambient day-night cycles, suggesting that under these conditions, their circadian clocks take control over some processes (Shemesh et al., 2007; Shemesh et al., 2010). Given that some processes in nurses are regulated by circadian clocks and others are not, it is difficult to predict if and how the responsiveness of their antennae is temporally regulated.
Here, we used electroantennograms (EAGs) to record the summed neuronal response in the antennae of nurses and foragers. We recorded the EAG response to general odorants and pheromones at different times during the day, addressing the following hypotheses: (1) the worker honeybee antennal responsiveness to odors is influenced by circadian clocks, (2) the circadian regulation of the antenna varies with worker task, and (3) task-related circadian regulation of the antenna differs for different odorants and pheromones. We tested for daily changes in both the EAG response magnitude and the ability of the antenna to track high-frequency odorant pulses.
Materials and Methods
Observation Hive and Focal Bees
The honeybees were kept according to standard beekeeping procedures at the Bee Research Facility of the Hebrew University of Jerusalem, Givat Ram, Jerusalem, Israel. The stock we used is a mixture of honeybee (Apis mellifera) strains typical to Israel. We established a 2-frame observation hive in which we housed a queen and 3 similarly sized cohorts of worker bees (~1500 bees each): foragers, nurses, and newly emerged “callow” bees (0-24 h of age). The queen and workers were obtained from the same source colony. Foragers were identified as bees returning to the hive with pollen on their hind legs. Nurses were bees seen inserting their heads into a cell containing a larva. To obtain callow bees, we removed brood containing frames with no adult bees from the source colony and transferred them to an incubator (~33 °C, ~60% RH). We collected the newly emerged bees on the next day. The upper frame in the observation hive contained brood and pollen, and the lower frame contained stored honey and pollen. We placed a queen-excluder between the upper and lower frames confining queen egg laying and brood rearing to the upper frame. We placed the observation hive in an environmental chamber with constant temperature (29-30 °C) and humidity (40%-50% RH). The room was illuminated with constant dim red light (Edison Federal EFEE 1AE1 Deep Red LEDs, maximum and minimum wavelengths = 670 and 650, respectively). The hive entrance was connected to the outside with a flexible plastic tube. To sample focal foragers around the day, we paint marked the thorax of foragers returning to the hive over the 2 days before beginning with the EAG recordings. At the day of EAG recordings, we detached the entrance tube and connected it to an indoor foraging arena made of Plexiglas (31 × 22 × 16 cm), from which we sampled marked foragers. To obtain focal nurses of known age, we collected callow bees and paint marked them with dots of enamel dye (Humbrol Enamel, www.humbrol.com) on the dorsal part of both the thorax and the abdomen. When the dye was dry, we introduced them into the observation hive. These bees were collected as nurses at 7 to 9 days of age (a typical age for nurses) only if observed with their head in a larva-containing cell.
Experimental Outline
Figure 1 summarizes the experiment outline. We established the observation hive on day 2 of the experiment, during which we also paint marked 350 callow bees and introduced them into the observation hive. Two days later, we opened the hive entrance, allowing the colony free access outside. On days 7 and 8, we paint marked foragers returning to the colony during daytime. On day 8 at 1830 h, right after sunset, when the foragers had returned to the hive, we detached the entrance tube and reconnected it to a foraging arena inside the environmental chamber. This enabled us to sample marked foragers under dim red light, avoiding exposure to the strong ambient environmental cycles in light and temperature that could affect circadian rhythms and bee physiology. Between 0900 and 1030 h of day 9, we collected marked nurses and foragers for locomotor activity monitoring from the upper brood comb or the foraging arena, respectively. We started the EAG recordings at 1500 h on day 9 and repeated the recordings every 4 h, until 1500 h on day 10. This sampling protocol provided recordings over an entire circadian cycle. At each time point, we first measured the EAG responses from the right antennae of 4 foragers and 4 nurses, using 2 recording electrodes. We repeated this procedure twice, such that in total, we recorded 8 antennae of 8 different individuals per task group and time point. The entire procedure from collecting the first bee to the end of EAG recordings took 1:20 to 1:40 h. We assigned time points to night or day according to the times of sunrise and sunset on day 9, 11 May 2013, as provided in www.timeanddate.com. Sunrise and sunset times during the day of recording were 0559 h and 1646 h, respectively.
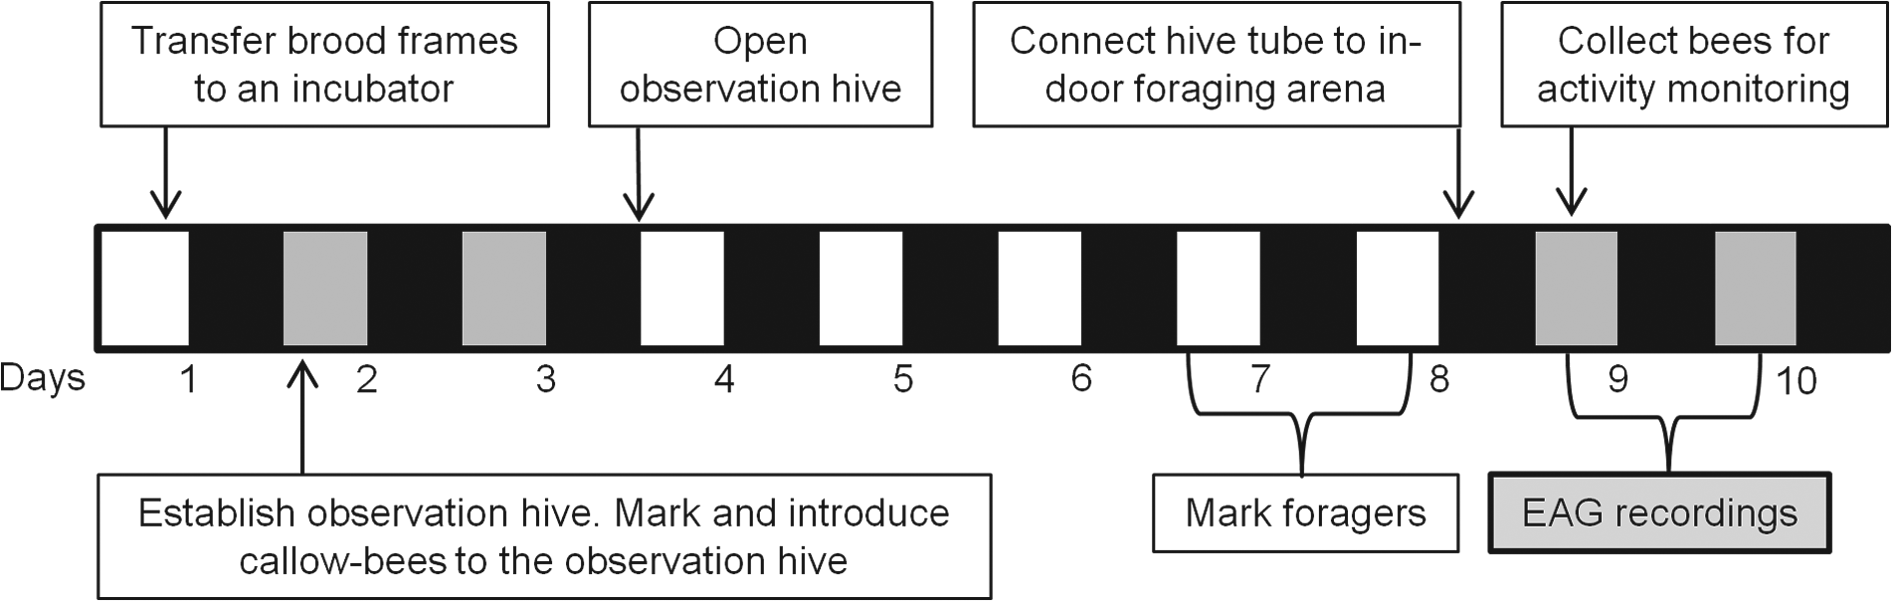
Experiment outline. The horizontal bar shows the days of the experiment and the illumination regime. Open box = daytime; the hive was open and the bees were free to exit the hive. Gray filled box = subjective daytime; the hive entrance was closed during both day and night. Filled black box = night or subjective night.
EAG Recordings
We used EAG to measure the electrophysiological responses of the entire detached antenna to selected odorants. We recorded from dissected rather than in vivo antennae to reduce the noise due to muscle activity, which is picked up in vivo EAGs (Schneider, 1957). We collected nurses and foragers from the observation hive and immediately anesthetized them by chilling on ice. We then used dissection scissors to remove the right antenna of each bee and mounted it onto an electrode. We used only right antennae to avoid possible effects of lateralization (Letzkus et al., 2006). Four antennae were fixed to a custom-made quadruple EAG electrode with conductive gel (GEL+, Ritex, Germany). The entire procedure from bee collection to the end of antennae mounting took up to 20 min. Ten minutes later, the antennae were placed at a distance of approximately 2 cm in front of a custom-made olfactometer (Szyszka et al., 2011) that was designed to minimize mechanical stimulus components. This stimulator provided a constant airflow (3000 mL/min). The antennae were exposed to this constant airflow throughout the whole duration of the recordings before and between the odorant stimuli. To apply odorants, odorant-loaded air (300 mL/min) was injected into the constant air stream, and simultaneously, the same amount of clean air was withdrawn to keep the total airflow constant, which minimized mechanical stimulus components. The olfactometer was supplied with compressed air that was filtered with a 0.01-µm porosity filter and an active carbon filter (series AS3-FLC and AS3-FLA, respectively, Rexroth Pneumatics), and the stimulation was controlled with the IDAC-4 system (Syntech, Germany). EAG signals in response to the odorants were amplified with a 4-channel amplifier (DP-34, Warner Instrument Corp.), 0.1- to 1000-Hz band-pass filtered, and digitized at a sampling rate of 120 Hz using the IDAC-4 system.
We placed the recording system in an environmental chamber, constantly illuminated with dim red light (as described above) and controlled for temperature and humidity (26.5-27.5 °C, 35%-45% RH). We exposed each EAG preparation (containing 4 antennae) to a sequence of olfactory stimuli. The odorant stimuli were 2 alarm pheromone components, 2-heptanone (Hptn; Sigma Aldrich) and isoamyl acetate (Isoe; Sigma Aldrich), the plant odor 1-nonanol (Nonl; Sigma Aldrich), and the commercially available queen mandibular pheromone (QMP; Contech Inc.) and brood ester pheromone (BEP; Contech Inc.) blends. The stimuli were delivered as continuous 4-s pulses for the low-volatility stimuli (QMP, BEP) or in 1.5-s-long sequences of 10-Hz pulses for the more volatile substances (Hptn, Nonl, Isoe; Table 1). The EAG responses to the 10-Hz pulsed stimuli were later used to estimate the antennal odorant pulse tracking capacity. We presented QMP and BEP as continuous stimuli only, because of their low volatility and because worker bees encounter these pheromones inside the hive, where odor stimuli are assumed more static than outside. The other odorants (Hptn, Isoe, and Nonl), however, are mainly encountered outside the hive, where odorants are typically carried by wind and occur as intermittent stimuli due to turbulences (Murlis et al., 1992).
The sequence of stimuli during electroantennogram measurements. a
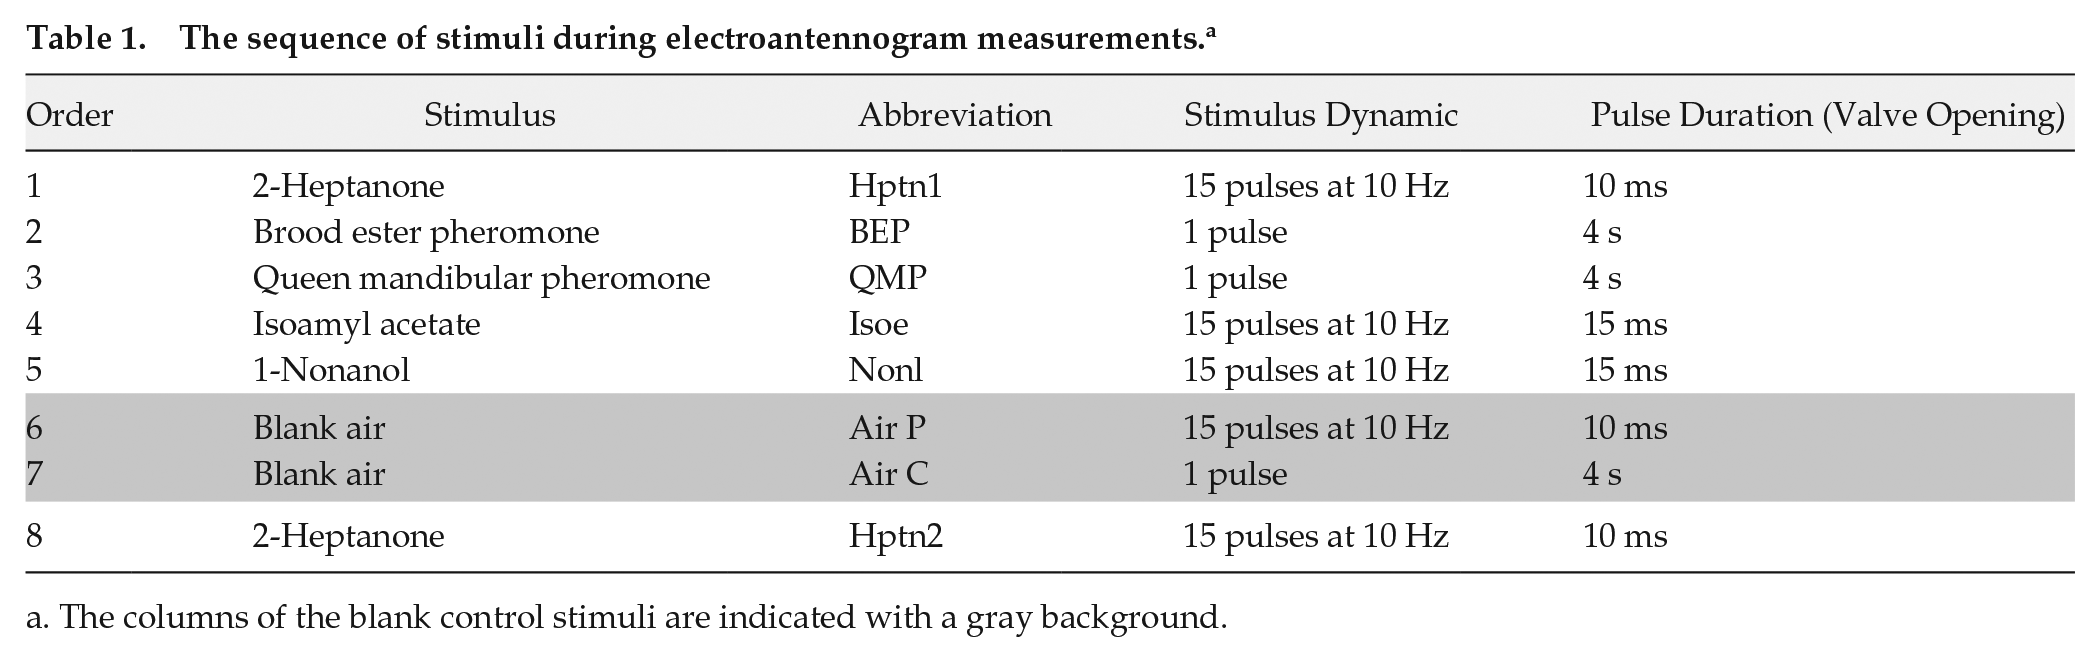
The columns of the blank control stimuli are indicated with a gray background.
We assumed that the stimulus concentration in the airflow would vary along with the duration of the odorant pulses. Therefore, we adjusted the duration of each pulsatile odor stimulus such that the amplitude of the EAG response did not saturate (increasing or decreasing pulse duration resulted in corresponding changes in the EAG response). We used an empty bottle as a blank control. The sequence of odorant stimuli delivered to each antenna, stimuli dynamics and pulse durations are summarized in Table 1.
For the analysis of the EAG data, we first subtracted the baseline response (the mean voltage recorded 100 ms before stimulus delivery) from the EAG traces. We then visually examined all EAG traces blindly to the experimental treatments. We excluded antennae that did not respond to the odorant stimuli or that had unstable EAG traces (i.e., if there were large fluctuations in voltage during the stimulus delivery, which disrupted the signal). This selection procedure resulted in the exclusion of 96 of 898 traces (see Table 2 for the final sample sizes).
Sample sizes of the electroantennogram measurements in each time point and task group. a
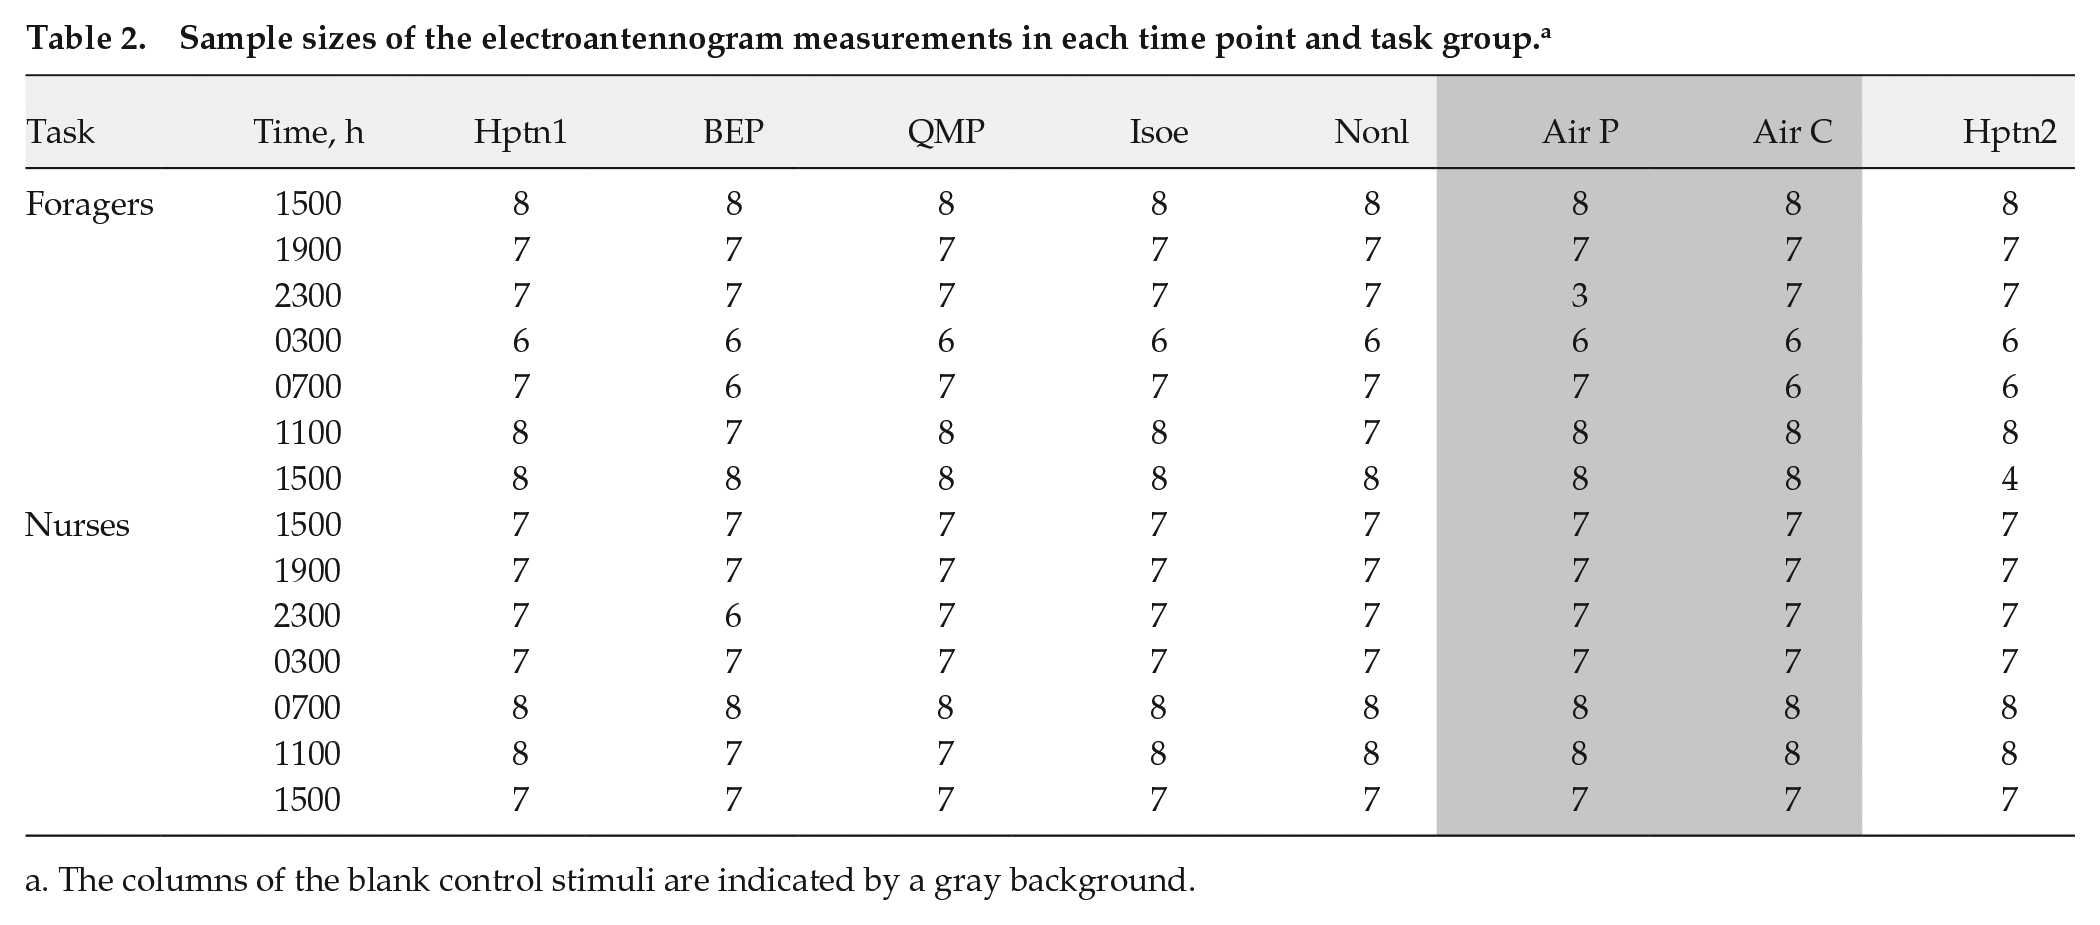
The columns of the blank control stimuli are indicated by a gray background.
Monitoring Locomotor Activity for Individually Isolated Bees
To determine the phase of locomotor activity rhythms, we sampled nurses and foragers from the observation hive and placed each individually in a monitoring cage made of a modified Petri dish (diameter of 90 mm). We provisioned each cage with 50% (w/w) sucrose solution. We transferred the cages with the bees in a lightproof box to an environmental chamber that was temperature (28-29.5 °C) and humidity (RH = 48%-56%) regulated. The chamber was illuminated with dim red light (Edison Federal EFEF 1AE1 Far [Cherry] Red LED; maximum and minimum wavelengths were 750 and 730, respectively). The distance traveled in pixels on the camera field of view (transformed to millimeters) was recorded at a frequency of 1 Hz with 4 CCD cameras (Panasonic WV-BP334) and an image acquisition board (IMAQ 1409, National Instruments, Austin, TX) over 6 days with the ClockLab data acquisition system as previously described (Shemesh et al., 2007; Yerushalmi et al., 2006). We used the ClockLab circadian analyses software (Actimetrics, Wilmette, IL) to generate actograms, using 10-min bins. The activity acrophases on days 2 to 6 were determined using the ClockLab software. We omitted days on which the acrophase could not be determined. No more than 1 day per bee was omitted. We then fitted a linear regression model passing through the acrophase points of each day and extrapolated the regression model to the day in which the bee was transferred from the hive to the monitoring cage (day 1; see Fig. 2a). We used the Oriana software package (Kovach Computing Services, Isle of Anglesey, UK) for circular statistics analyses. We used the Rayleigh test and the length of the vector as indices for phase coherence and the Watson-Williams F-test to compare the locomotor activity acrophases of nurses and foragers.
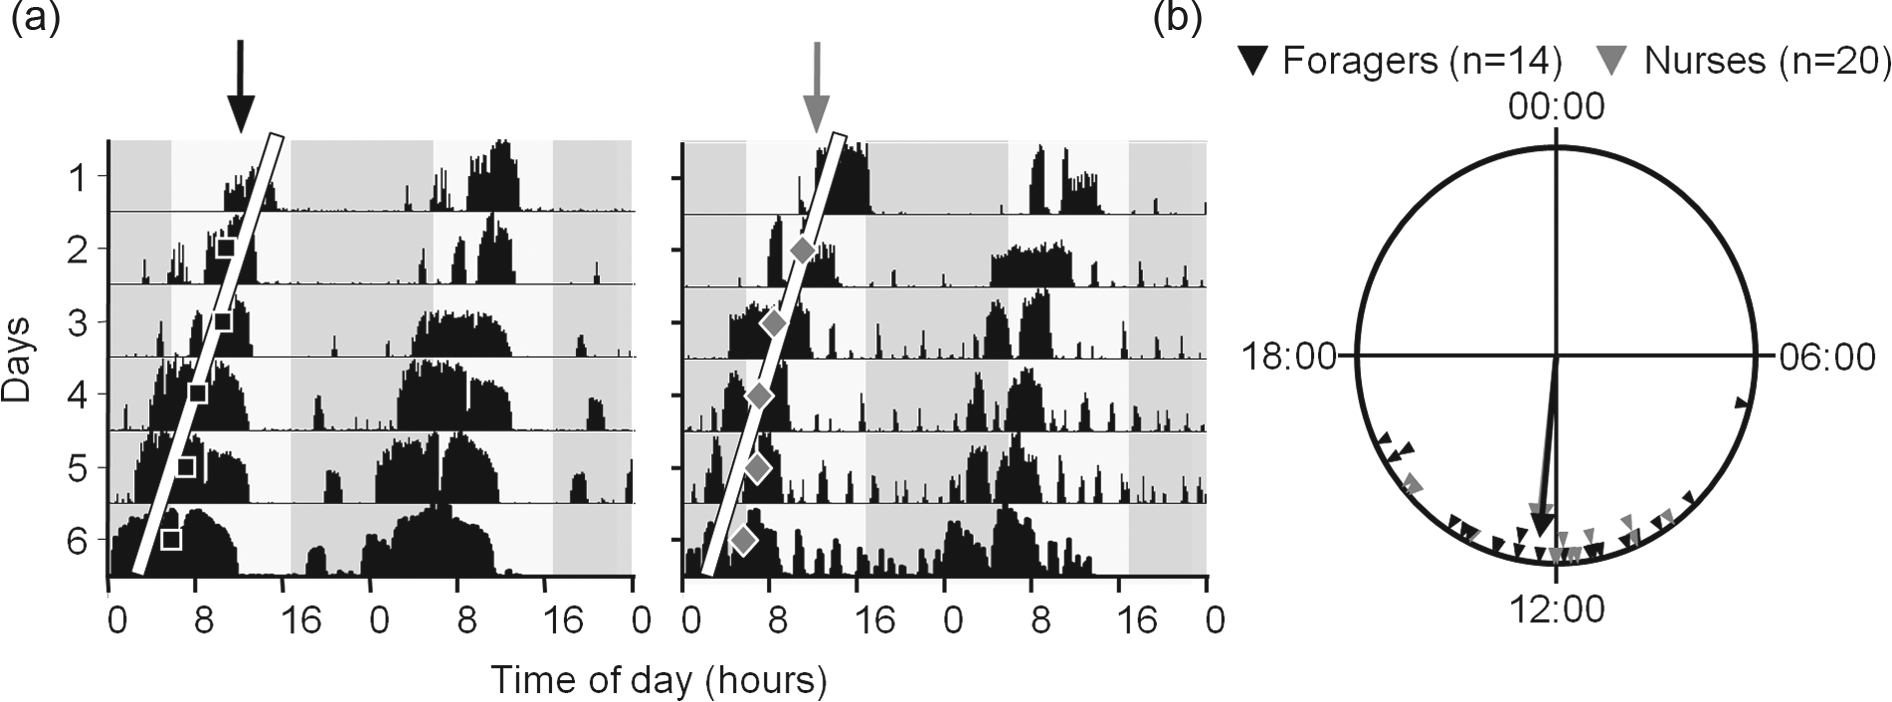
Circadian rhythms in locomotor activity of nurses and foragers shortly after they were removed from the hive. (a) Representative double-plot actograms of a forager (left) and a nurse (right). The y axis shows the days in isolation under constant laboratory conditions. The x axis shows the time of day over 2 consecutive days. The height of the black bars corresponds to the level of locomotor activity in 10-min bins. The black squares and gray diamonds show the estimated acrophases for each day, for the representative forager and nurse, respectively. The white lines depict the fitted linear regression models. The arrows show the extrapolations of the regression lines on day 1, in which we performed the electroantennogram measurements. (b) Summary of circular statistics analysis. Each triangle depicts the acrophase of an individual forager (black) or nurse (gray) bee on day 1, estimated as explained in a. The vectors in corresponding shades point to the mean acrophases of each group, and their lengths show the degree of phase coherence (Rayleigh test, p < 0.001 for both groups).
Influence of Time of Day on the EAG Magnitude and Pulse-Tracking Capacity
We compared the magnitude of the EAG responses between different time points and task groups using 2-way analysis of variance (ANOVA) for each odorant stimulus (Matlab). We fitted cosine models to the values of mean EAG response magnitudes as a function of time of day. The cosine model was
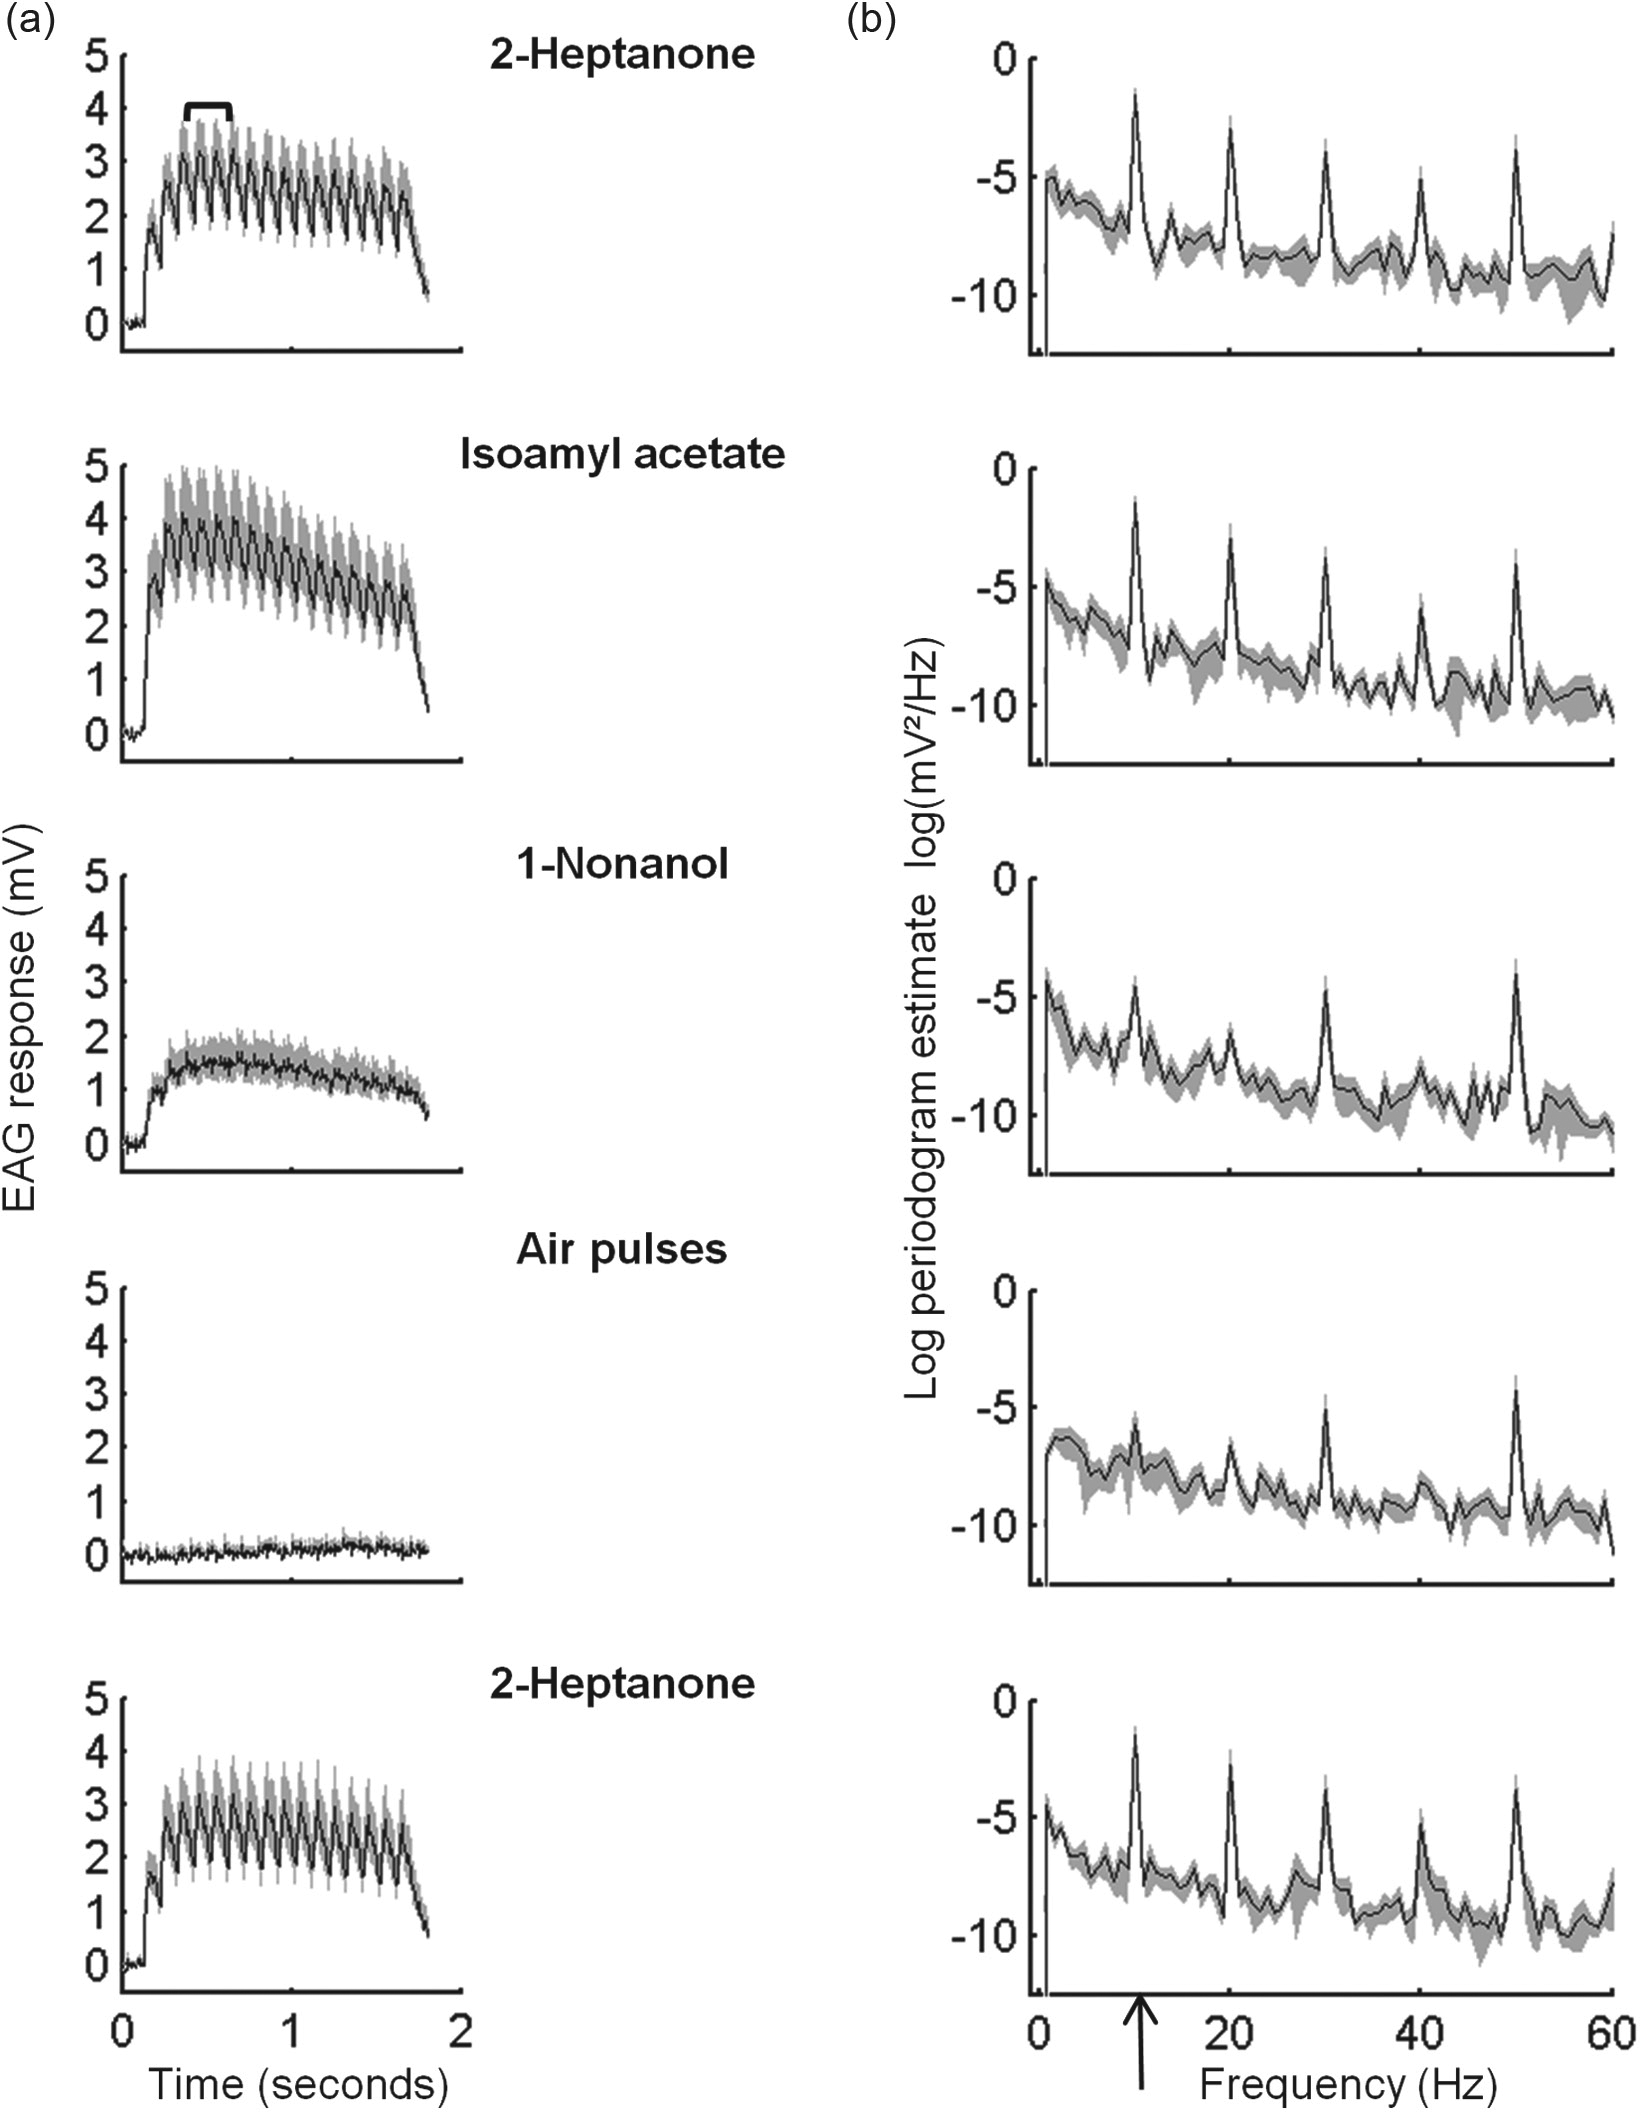
Analyses of electroantennogram (EAG) traces. (a) Average (black line) and SE (gray shade) of EAG response traces to pulsatile stimuli delivered to antennae of foragers at 1100 h (M ± SE, n = 8 antennae for all stimuli). The mean of the 3 maximal peaks was used to evaluate the EAG response magnitude (marked by a bracket in the upper plot). (b) Periodograms calculated for the traces shown in (a) (log [M ± SE]). The periodogram value at 10 Hz (indicated with an arrow on the x axis) was used to estimate antennal pulse-tracking capacity. The values for Nonl and the blank air pulses were more than 1 or 2 orders of magnitude lower compared with the other stimuli, respectively.
We performed a periodogram analysis (Matlab) for each EAG trace that was delivered in pulses. The periodogram was performed on the EAG trace segment recorded between the delivery of the 3rd and the 15th odorant pulses (between 0.3 and 1.5 s from the beginning of the stimulus), because from the first to the third stimulus pulses, the EAG responses were still rising (see Fig. 3 for examples). Before running the periodogram analysis, we subtracted the trace segment mean and detrended it using linear regression (Matlab). The periodogram peak at 10 Hz of each trace was used as an estimate for the antennal pulse-tracking capacity (see Fig. 3 for examples). We compared the 10-Hz periodogram peaks between time points and task groups for each pulsed stimulus with 2-way ANOVAs (Matlab). In addition, we fitted cosine regression models to the time points means as described above for the EAG magnitude values.
To test the statistical significance of the R2 values obtained from the cosine regression analyses for the time point means, we fitted cosine models to 10,000 random permutations of the data for each stimulus. For each odorant, we generated a distribution of R2 values from the fits to the permuted data. We tested whether the “real” R2 value of each odorant exceeds the 1-sided α = 0.05 or α = 0.1 significance thresholds of the distribution.
Results
Circadian Rhythms in Locomotor Activity
Both nurses and foragers showed circadian rhythms in locomotor activity when removed from the observation hive and monitored individually under constant laboratory conditions (Fig. 2a). Circular statistics analyses for the acrophase of both nurses and foragers produced large and statistically significant Rayleigh vectors (0.83 and 0.89, respectively; p < 0.001 for both task groups; Fig. 2b). The mean acrophase was similar for foragers and nurses (1220 h and 1223 h, respectively; Watson-Williams F-test, p = 0.93). These analyses indicate that the phase of circadian rhythms in locomotor activity was synchronized for both nurses and foragers, consistent with previous studies (Shemesh et al., 2007; Shemesh et al., 2010; Fuchikawa et al., 2016).
Task-Related and Circadian Variation in the EAG Response Magnitude
There was much variation in the magnitude of the odorant-induced EAG response among bees within the same time point, and the effects of time of day or worker task were not statistically significant in 2-way ANOVA for any of the stimuli (besides an effect for time in the continuous air control; Fig. 4; Table 3). Cosine models accounted for a high proportion of the variation among the mean EAG response magnitudes over time in foragers (R2 = 0.44-0.86; Fig. 4). Simulations with random permutations showed that the R2 values for QMP, the continuous, and the pulsed-air stimuli were significant at the α = 0.05 level; values for BEP and Nonl were p < 0.1 (Suppl. Fig. S1a). The cosine models accounted for a lower proportion of the variation in nurses, producing R2 values between 0.03 and 0.38, none of which was statistically significant (Fig. 4; Suppl. Fig. S1b). In foragers, the peaks of the fitted cosine models occurred during the day, whereas in nurses, the peaks of the best-fit cosine models occurred during the night.
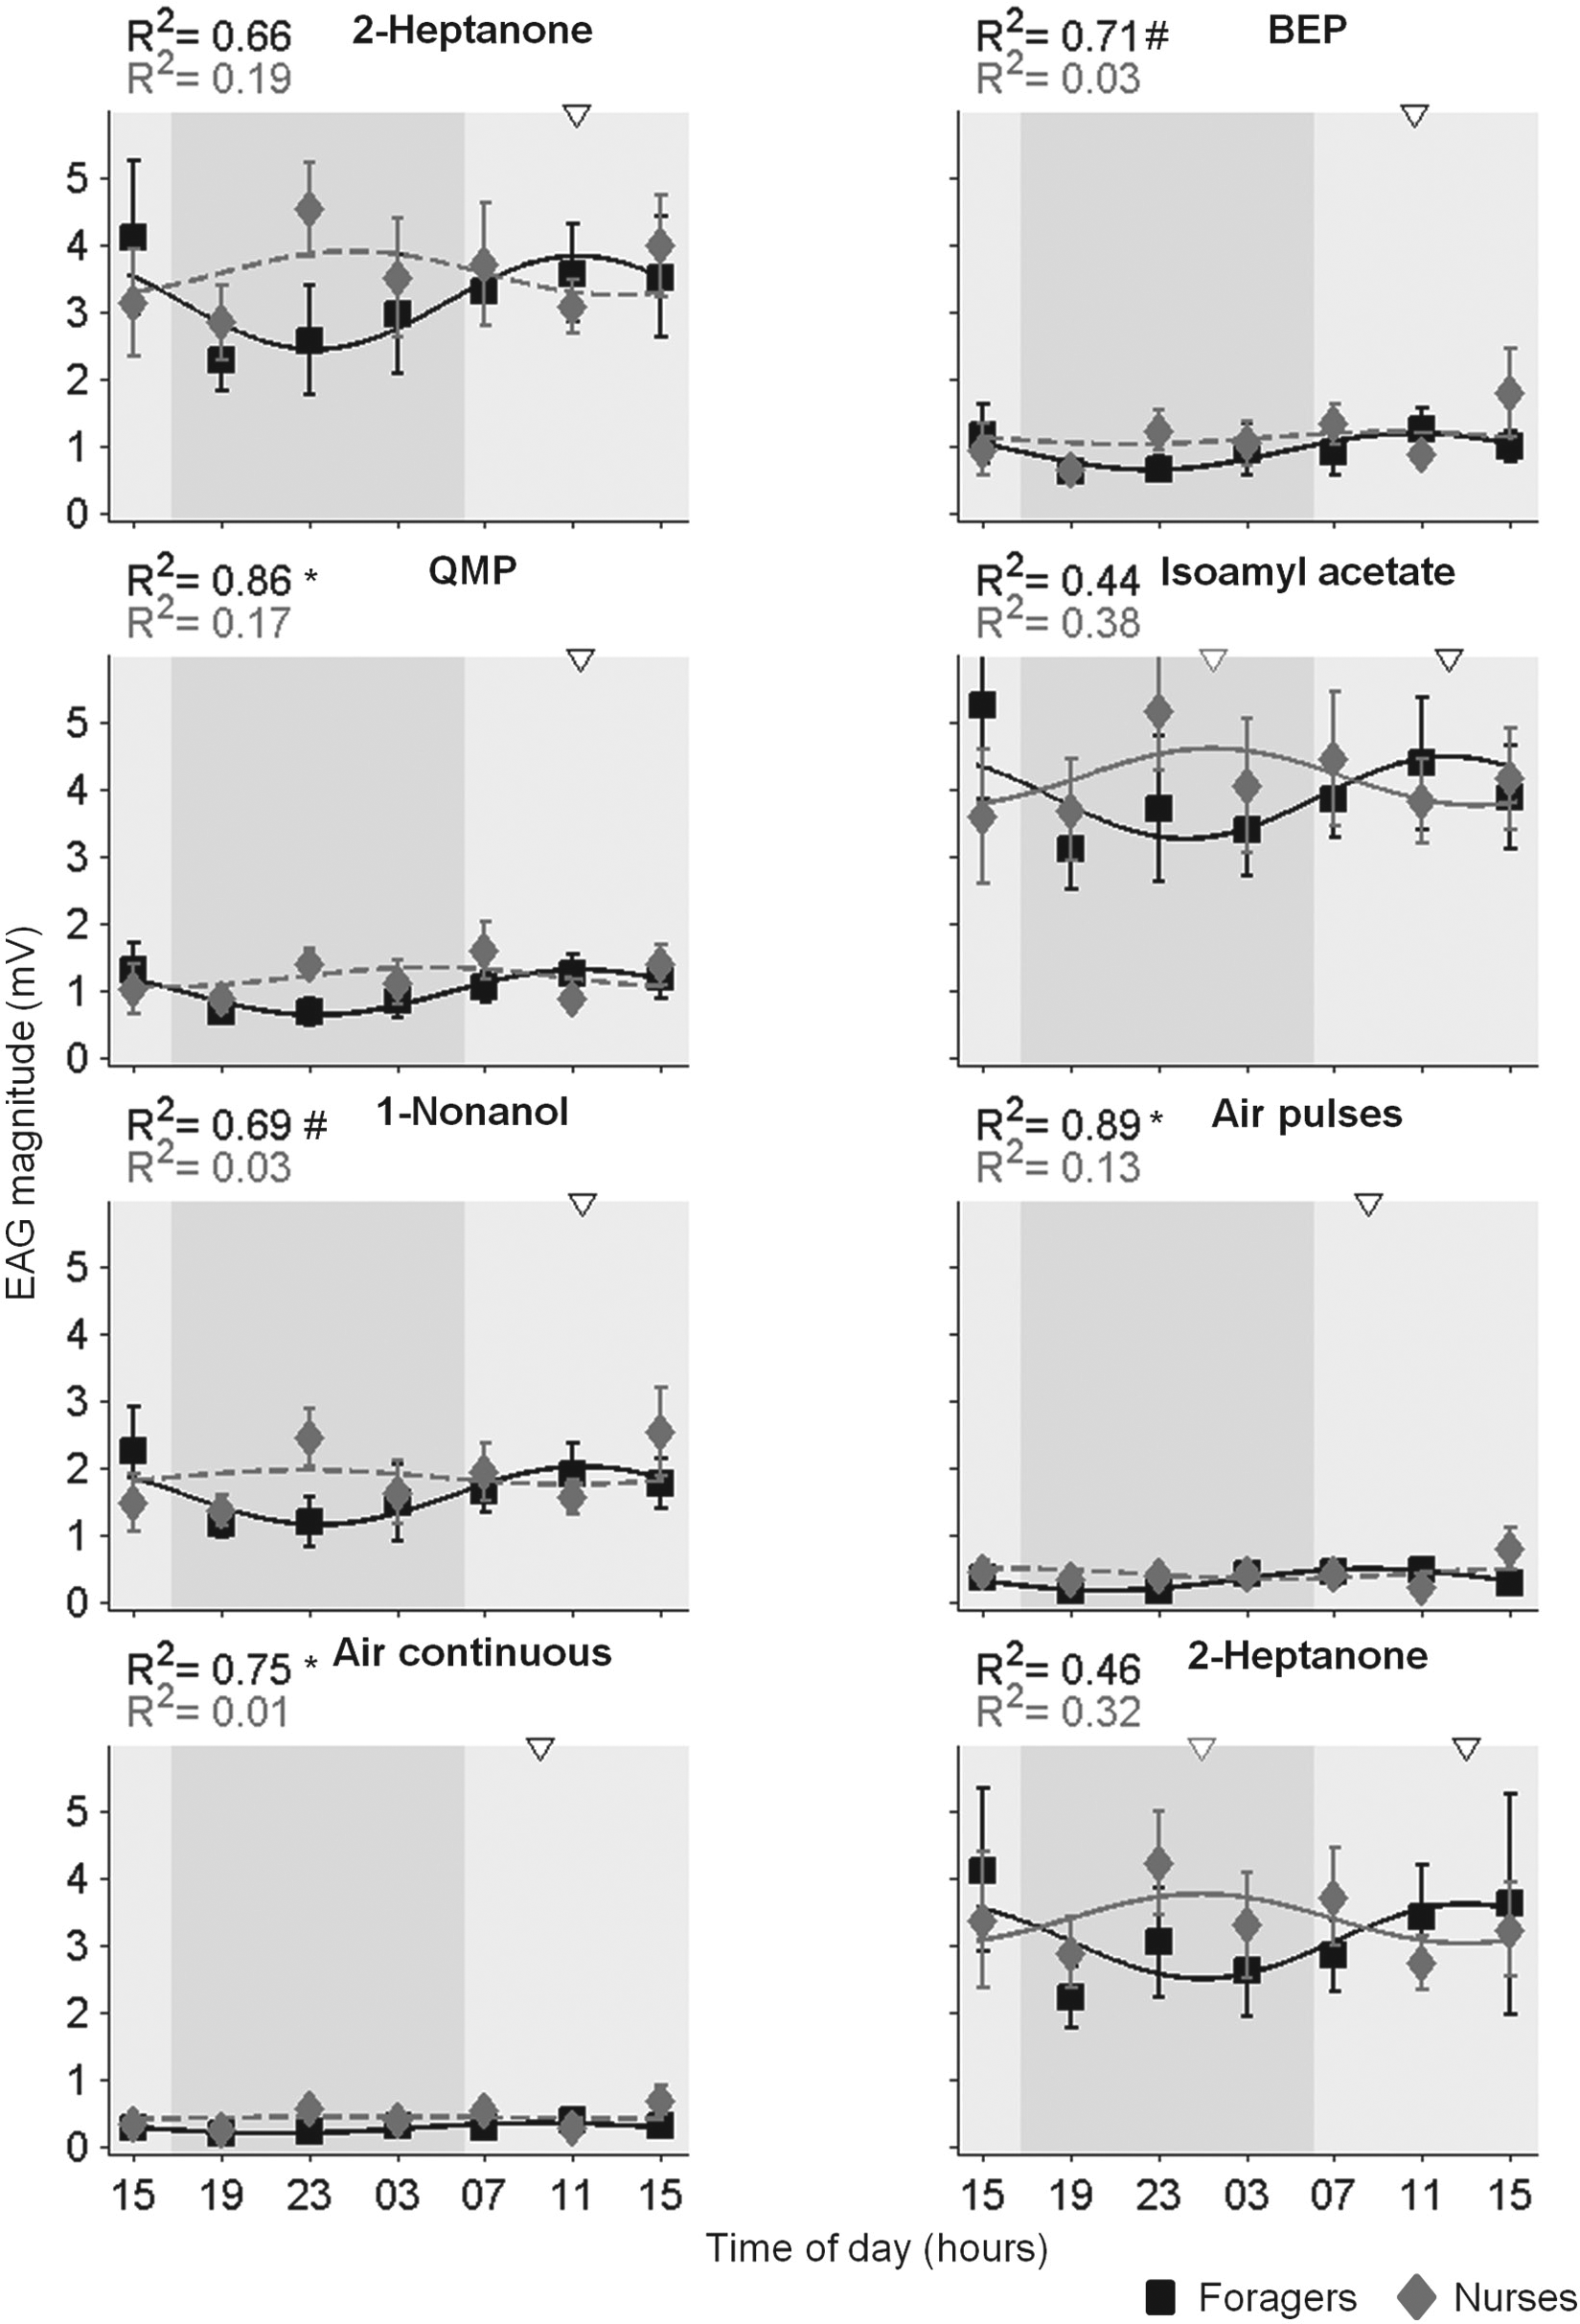
Circadian and task-related variation in electroantennogram (EAG) response magnitude. Each plot summarizes the EAG response magnitude (M ± SE) for foragers (black squares) and nurses (gray diamonds). The curved lines show the best-fit cosine models with 24-h periods for each task group. Dashed lines depict fits with R2 < 0.2. The R2 values in corresponding shades are indicated on the top left of each plot. R2 values with a p value lower than α = 0.1, α = 0.05, or α = 0.01 are marked with (#), (*), or (**), respectively (see Supplementary Material). The open black and gray triangles above the plots mark the estimated acrophases, based on the cosine fits (only for R2 > 0.2) for foragers and nurses. Light and dark gray backgrounds correspond to the subjective day and night, respectively. BEP = brood ester pheromone; QMP = queen mandibular pheromone. The results of complementary 2-way analyses of variance are summarized in Table 3.
Summary of 2-way analyses of variance. a
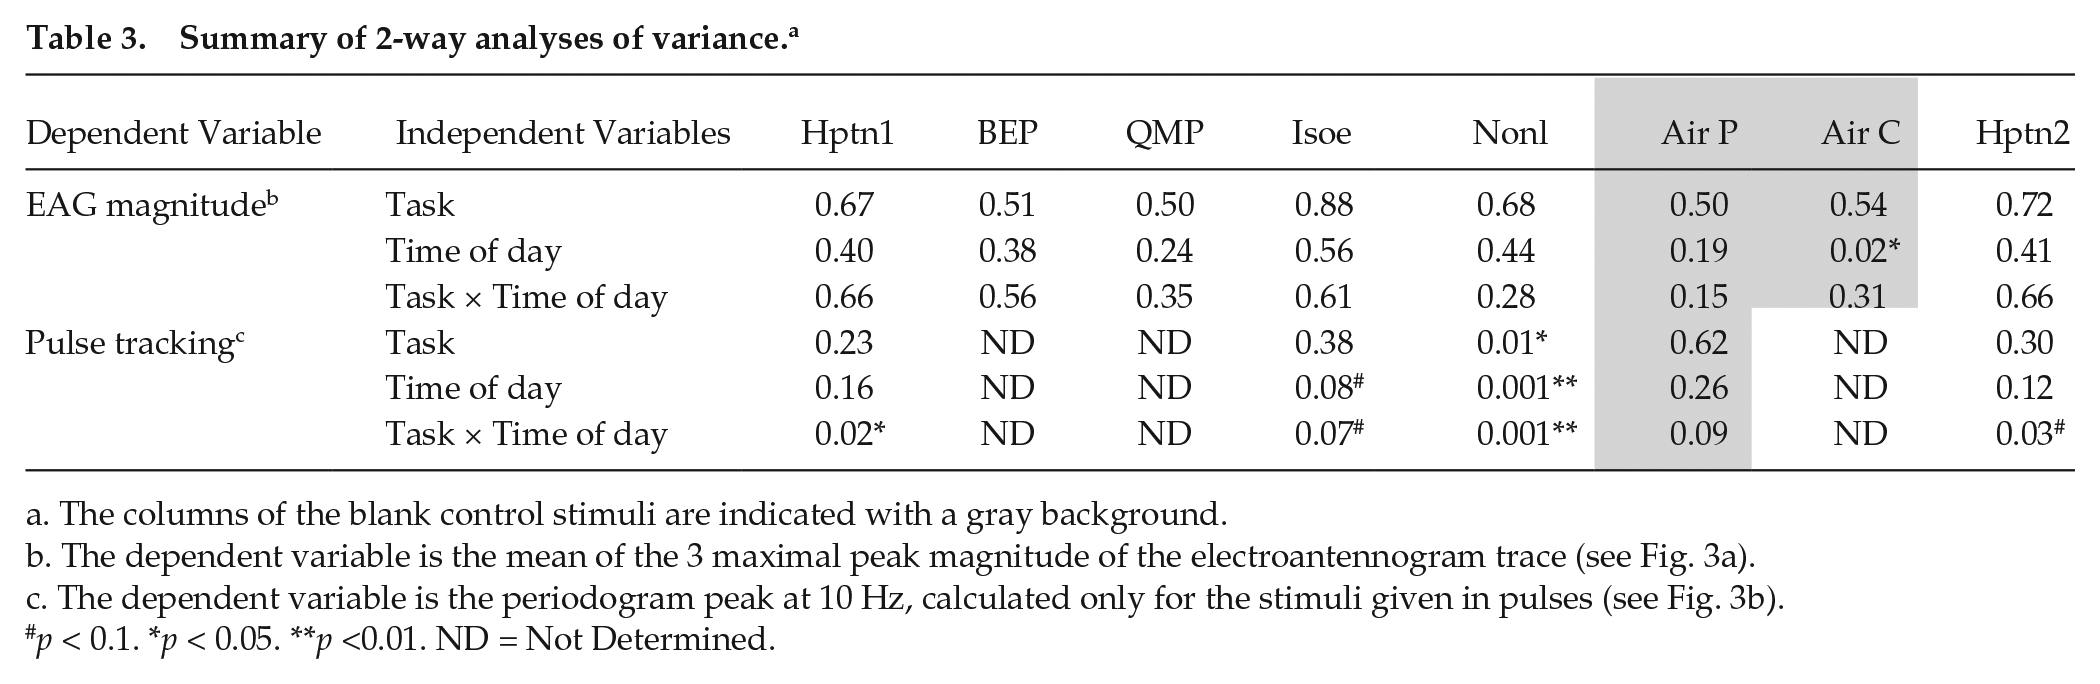
The columns of the blank control stimuli are indicated with a gray background.
The dependent variable is the mean of the 3 maximal peak magnitude of the electroantennogram trace (see Fig. 3a).
The dependent variable is the periodogram peak at 10 Hz, calculated only for the stimuli given in pulses (see Fig. 3b).
p < 0.1. *p < 0.05. **p <0.01. ND = Not Determined.
Task-Related and Circadian Variation in Pulse-Tracking Accuracy
We stimulated the antennae with a train of 10-Hz odorant pulses for a duration of 1.5 s and estimated the pulse-tracking capacity using the 10-Hz peak of the Fourier transform periodogram (Fig. 3). The overall pulse-tracking capacity did not differ between nurses and foragers, with the exception of Nonl, for which tracking was better in nurses (2-way ANOVA; Fig. 5; Table 3). However, 2-way ANOVA produced a significant Time × Task group interaction for 3 of the 4 tested odorants and p = 0.07 for the fourth (Isoe; Table 3). Pulse-tracking capacity varied with time of day, and cosine regression models with a period of 24 h explained large proportions of the variation among the mean values (R2 = 0.5-0.93), for all the stimuli besides the air pulses in nurses (Fig. 5). The R2 values were typically higher for foragers. Simulations with random permutations showed that in foragers, the fits for 2 stimuli (air pulses and the second Hptn stimulus) were statistically significant at the p < 0.05 and the p < 0.01 levels, respectively; the p value for Isoe was p < 0.1 (Suppl. Fig. S1c). Similar analyses for nurses produced R2 values with 0.05 < p < 0.1 for all the stimuli except the air pulses control (Suppl. Fig. S1d). Another finding consistent with circadian cycling in pulse-tracking accuracy is that the mean values measured at 1500 h on the first and second day of the experiment were similar for all tested stimuli, for both nurses and foragers (with the exception of Nonl for foragers, see Fig. 5). The acrophases of the fitted cosine models occurred during the day for foragers (Fig. 5a) and during the night for nurses (Fig. 5b), consistent with the significant Time × Task group interaction (Table 3).
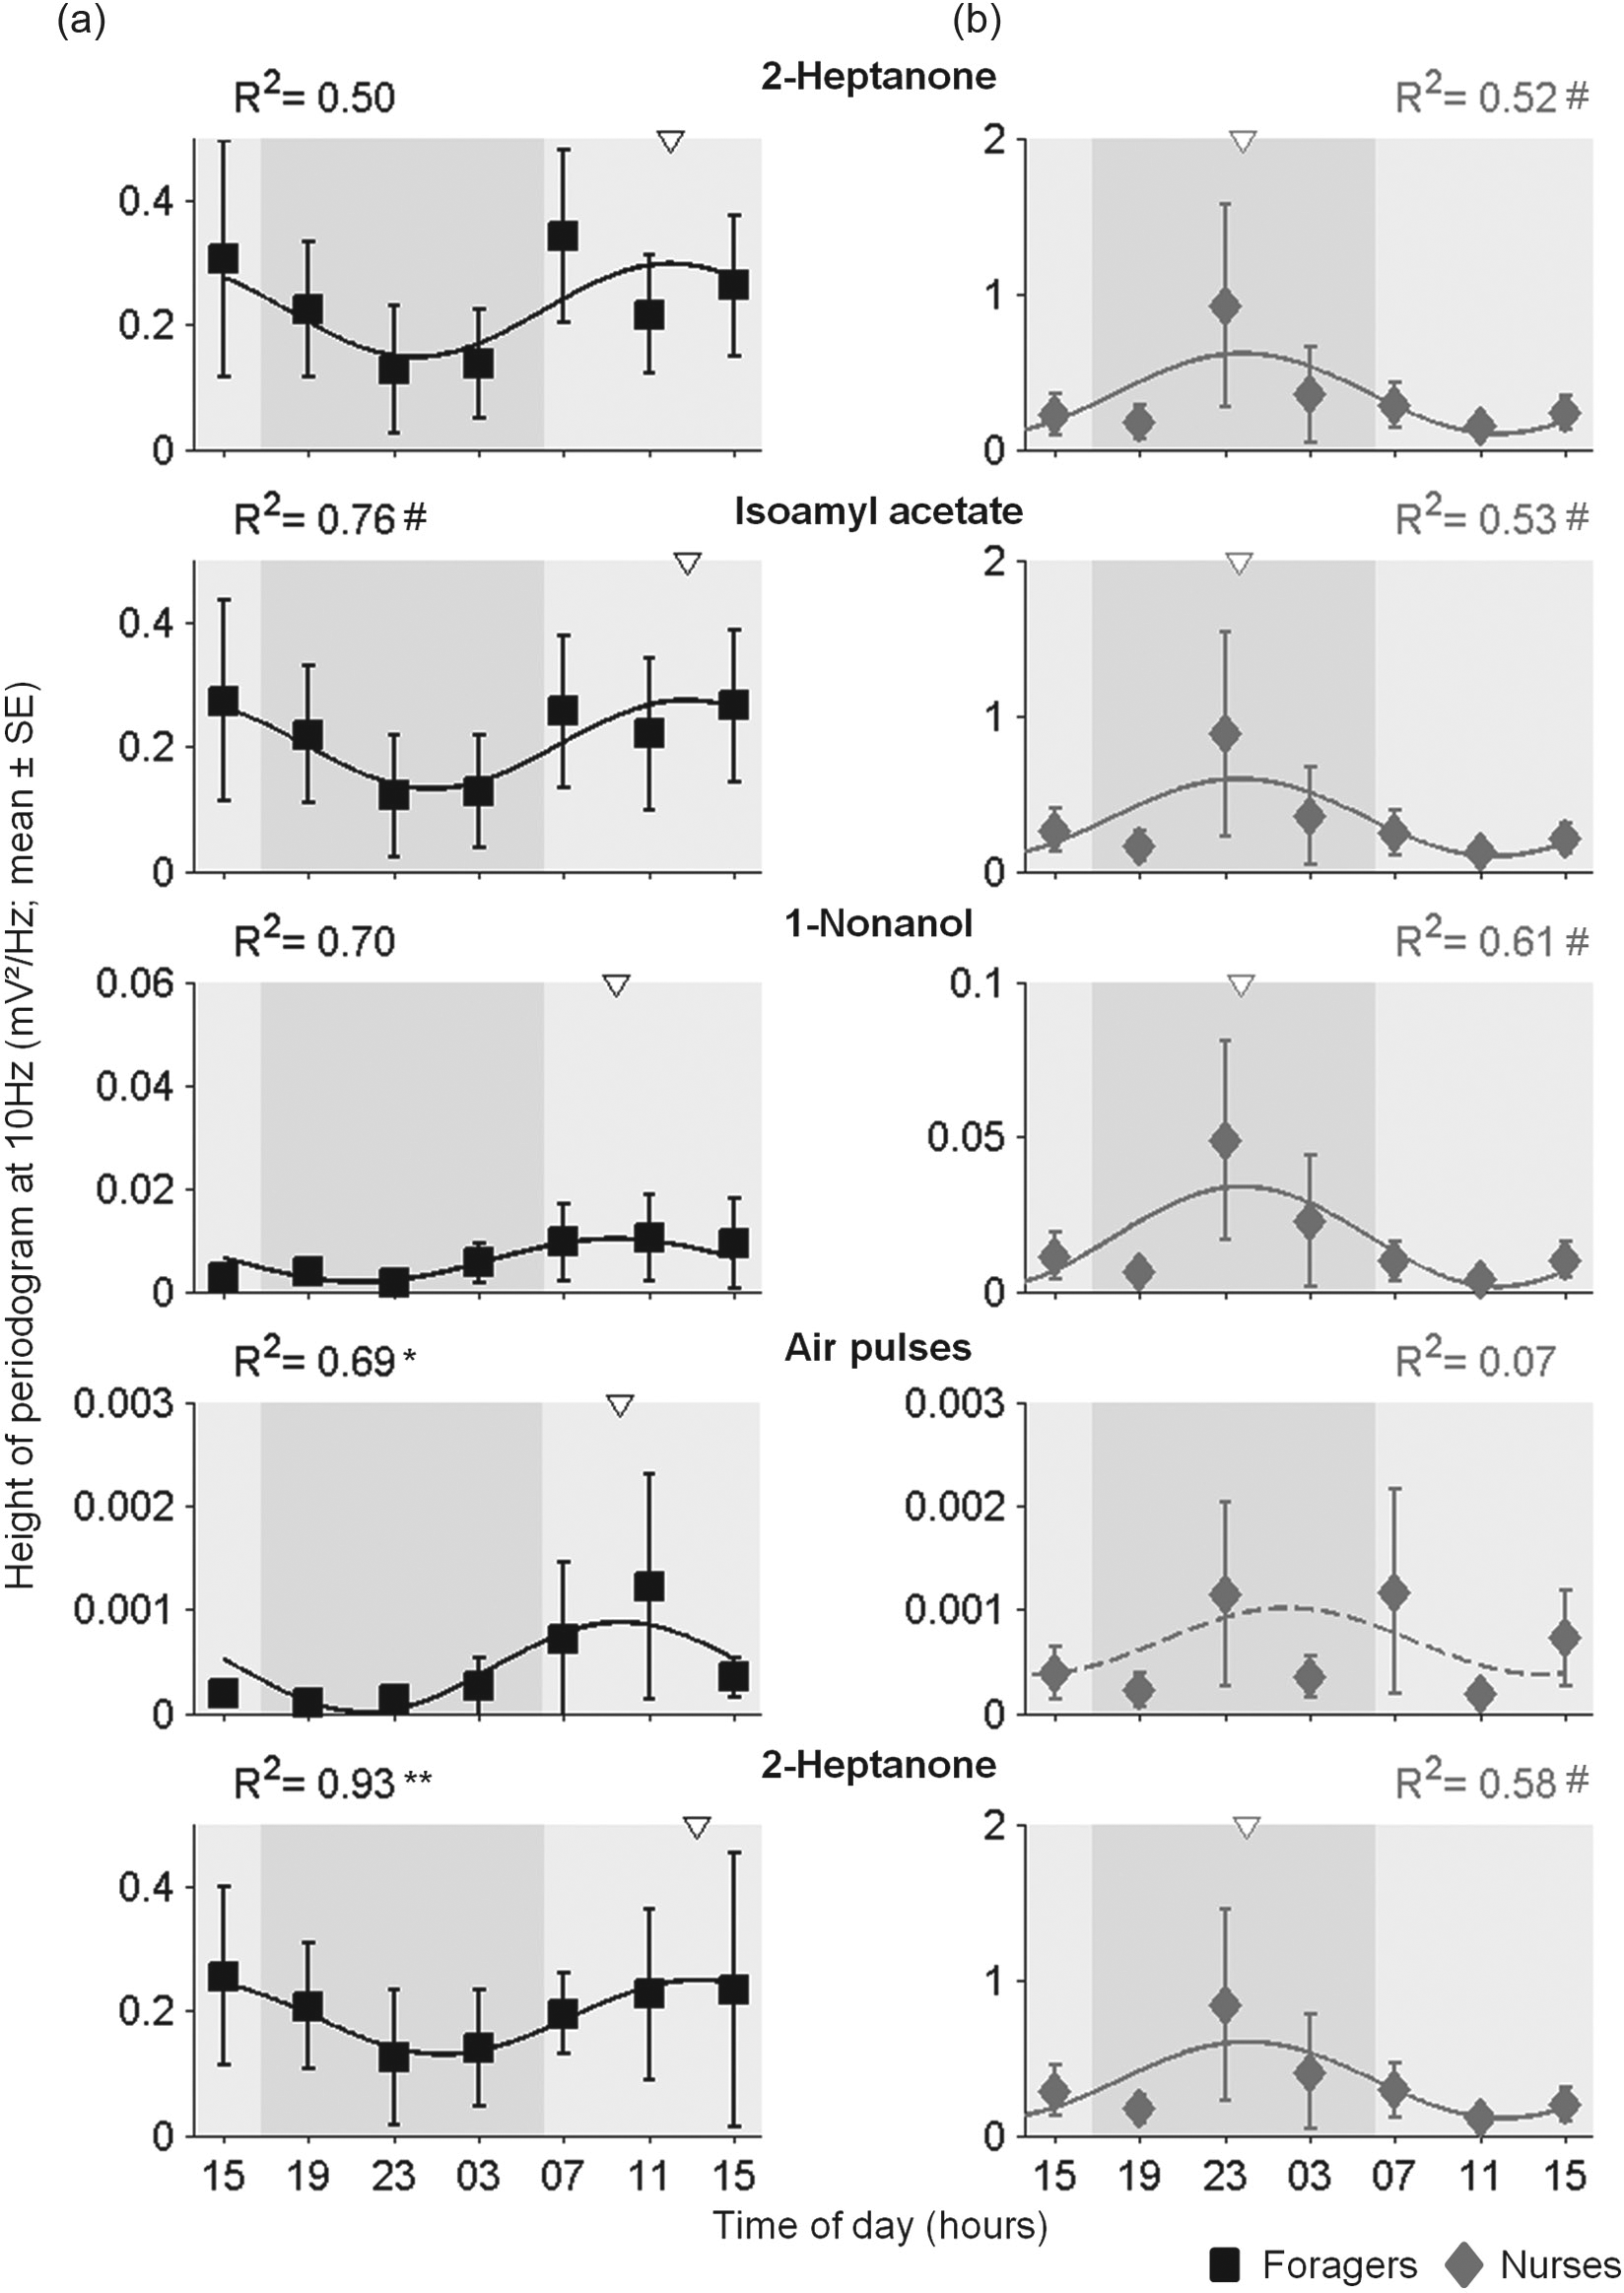
Circadian and task-related variation in pulse-tracking capacity. (a) Foragers. (b) Nurses. Each plot summarizes the 10-Hz power, obtained from a Fourier transform periodogram (see Fig. 3), of the electroantennogram responses to different stimuli (M ± SE). The statistical analyses are summarized in Table 3. Other details are as in Figure 4.
Figure 6 summarizes the EAG analyses for foragers and nurses in relation to the acrophase of circadian rhythms in locomotor activity of sister nurses and foragers that were removed from the hive. It shows that the acrophase of circadian rhythms for both the response magnitude and pulse-tracking capacity occurred during the day for foragers, consistent with the phase of their locomotor activity rhythms. For the 2 stimuli in which the cosine model explained more than 30% of the variation in EAG response magnitude in nurses (Isoe and the second Hptn; Fig. 4), the estimated cosine peak occurred during the night. The acrophases of the nurse antennal pulse-tracking capacity rhythms occurred during the night as well, almost in antiphase with the locomotor activity rhythm (it should be noted, however, that the permutations analyses produced p values of 0.05 < p < 0.1 for all odorants). These results are consistent with the premise that the task the worker performs (nursing or foraging) influences the circadian phase of the antennal responsiveness to odorants.
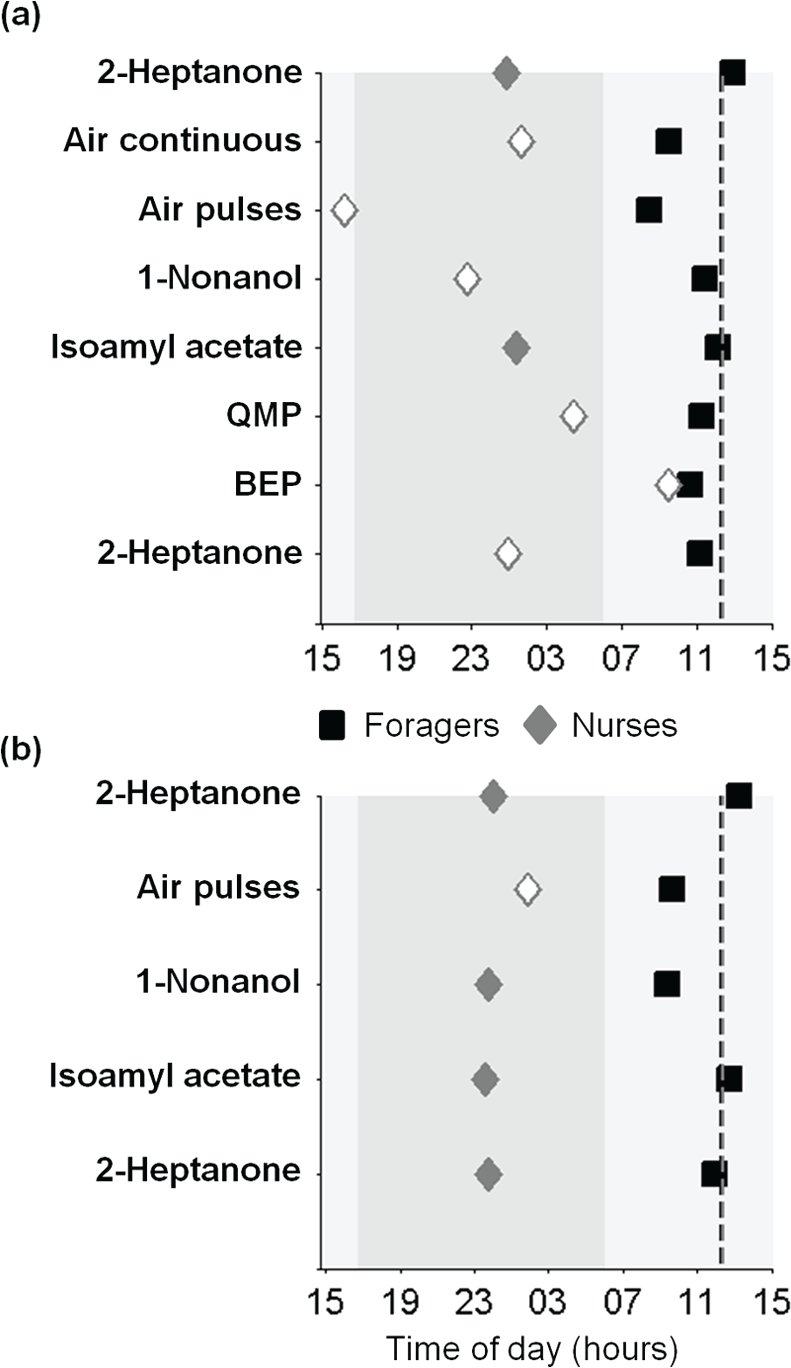
The phase relationships between circadian rhythms in electroantennogram (EAG) responses and in locomotor activity. Black squares = foragers; gray diamonds = nurses. (a) Acrophases estimated from cosine fits to the EAG response magnitude. (b) Acrophases estimated from cosine fits to pulse-tracking capacity. The odorants and pheromones are displayed from bottom to top in the order of their presentation during the measurements. Opened symbols indicate regression analyses with R2 < 0.2. The vertical dashed lines depict the acrophases of the locomotor activity rhythms for foragers and nurses in corresponding shades (the lines overlap). Light and dark gray backgrounds represent the subjective day and night, respectively. Abbreviations are as in Figure 4.
Discussion
We used EAG recordings to assess time-of-day and task-related variation in the honeybee antennal responsiveness to various odorants. To our knowledge, our findings present the first evidence for circadian influence on antennal responsiveness to odorants in any insect from the order Hymenoptera (bees, ants, and wasps). The EAG response was highly variable even for bees of the same task group measured at the same time window. Nonetheless, cosine regression models with 24-h periods accounted for a high proportion of the variation among mean values as a function of time of day, for both nurse and forager bees (Figs. 4 and 5). Oscillations with good cosine fits were seen in the EAG magnitude for foragers and in pulse-tracking capacity for both foragers and nurses, and they were similar across tested stimuli. The effect of time of day on the EAG pulse-tracking capacity, however, differed between nurses and foragers. Pulse-tracking capacity was highest during the mid-day for the day-active foragers and during the night for the around-the-clock active nurses for all the tested stimuli (except for the air control stimulus in nurses; Fig. 6b). There were similar trends across the stimuli for the EAG magnitude index, but the cosine model fits explained only little variation in the magnitude of the nurse antennal response (Fig. 6a). These findings add to earlier evidence that nurse bees that are active around-the-clock nevertheless do have functional clocks “ticking” in their body. Further, they show that the clocks influencing antennal responsiveness differ in phase between nurses and foragers. Taken together, our findings show that social factors associated with division of labor can modulate the circadian phase of responsiveness in a sensory modality.
In addition to recording the EAG response magnitude, as done in previous circadian studies with insects (reviewed in Gadenne et al., 2016), we assessed, for the first time, the antennal capacity to track pulsatile odorant stimuli. The EAG pulse-tracking capacity relates to the temporal resolution of olfactory receptor neurons, which is crucial for segregating odor objects from the background of numerous airborne chemicals in the environment (reviewed in Szyszka and Stierle, 2014). The function of pulse tracking in the antennae of nurses inside the relatively stable nest environment is currently unknown. However, olfaction, like many other sensory systems, is optimized for detecting changes of a stimulus. Therefore, testing pulse tracking provides useful information about the sensory capacity of the olfactory system, in both nurses and foragers. Honeybee workers have excellent olfactory temporal resolution, allowing them to segregate 2 odorants separated by only a few milliseconds (Szyszka et al., 2012, Szyszka et al., 2014). This ability requires fast olfactory transduction and processing, which may come with energetic costs (Niven and Laughlin, 2008). These costs may be reduced by lowered olfactory responsiveness at times of reduced arousal or activity (Gadenne et al., 2016). Our finding that in both foragers and nurses the mean pulse-tracking capacity (as well as overall EAG magnitude for foragers) measured over the day fitted well to cosine models with 24-h periods is consistent with this hypothesis.
It is notable that the pulse-tracking capacity and response magnitude to clean air (only in foragers) varied over time, and mean values fitted cosine models with similar phases to the odorant stimuli. Although the responses to clean air (continuous or pulsatile) were minute relative to those provoked by odorant stimuli, they are nevertheless puzzling. At least 2 factors may account for these time-dependent responses to clean air. First, although the antennal preparations were exposed to constant airflow throughout the EAG recordings to minimize mechanical stimuli (see the Materials and Methods section), during the switch itself, a small mechanical stimulus could not be avoided. Therefore, the responses to blank air stimuli may be due to activation of antennal mechanoreceptors that are influenced by circadian clocks. A second possible explanation is that traces of odorants triggered weak responses in olfactory receptors that are circadianly regulated. Our data do not enable us to distinguish between these 2 possible explanations. For nurses, the control air stimuli did not produce high fits to circadian cosine models, consistent with their typically lower cosine fits in response to most stimuli, compared with foragers (except for the pulse-tracking capacity in the first Hptn stimulus).
It is commonly assumed that high olfactory responsiveness helps guide behavior when the animal is aroused and active. The pattern that we found for foragers is consistent with this premise. Their EAG magnitude and pulse-tracking capacity peaked at around midday, corresponding with their activity phase in free foraging colonies and in isolation (Moore et al., 1998; Bloch and Robinson, 2001; Shemesh et al., 2007; Shemesh et al., 2010), as well as with their circadian rhythm in olfactory conditioning (Lehmann et al., 2011). The phase of circadian rhythms of the EAG response magnitude and pulse tracking was similar across odorants (Figs. 4, 5, and 6; although tracking capacity was about an order of magnitude lower for Nonl) with a peak similar to the acrophase in locomotor activity rhythms (Figs. 2 and 6). Perhaps the elevated responsiveness during the day helps foragers locate floral resources or is associated with their overall increased arousal during this time (Kaiser and Steinerkaiser, 1983; Kaiser, 1988; Eban-Rothschild and Bloch, 2008; Klein et al., 2008; Klein et al., 2014). Similar alignments for the phase of activity and olfactory responsiveness have been also reported for blood-feeding insects (reviewed in Gadenne et al., 2016) and mice (Granados-Fuentes et al., 2006; Granados-Fuentes et al., 2011).
The temporal pattern of the EAG response in nurses was more complex and less consistent across stimuli. The mean EAG response magnitude over time showed no significant fit with a circadian cosine model (Fig. 4; Suppl. Fig. S1b). Mean pulse-tracking capacity, on the other hand, showed a good fit overall with the cosine models for all the odorants but not for the clean air pulses (Fig. 5; Suppl. Fig. S1d; 0.52 < R2 < 0.61). The phase for the fitted cosine models of the pulse-tracking capacity rhythm in nurses was almost in antiphase compared with that in foragers, as was also reflected by a Time × Task interaction in 2-way ANOVAs (Table 3). Given that nurse bees care for the brood around-the-clock these findings are surprising (see below). Earlier studies have already established that nurses, which tend brood around-the-clock do have functional pacemakers that are socially entrained to the ambient day-night cycles (Shemesh et al., 2010; Fuchikawa et al., 2016). One possible explanation for our results is that the entire clock system of nurses is entrained to a different phase than that in foragers. Our locomotor activity analyses, however, are not consistent with this premise because nurses and foragers that were removed from the hive showed the same phase when monitored individually in the laboratory (Fig. 2). Thus, rhythms that are in phase in foragers show diverse patterns in nurses. Some are entrained to a similar phase as in foragers (e.g., locomotor activity rhythms when removed from the hive), others are in a different phase (antennal pulse-tracking rhythms), and yet others are absent (locomotor activity rhythms and brain clock gene mRNA levels while tending brood in the hive). A brain microarray study provided molecular support to this model by showing that fewer transcripts in the nurse brain exhibited circadian oscillations relative to foragers and that those transcripts that cycle in nurses could have a phase similar to or different (even opposite) from that of foragers (Rodriguez-Zas et al., 2012). It should be noted that foragers and nurses differ not only in the tasks they perform but also in factors such as age and the environment they experience. Additional experiments are needed to uncouple the effects of all these factors on the EAG rhythms.
Why do nurses have increased olfactory pulse-tracking capacity during the night? At this stage, we can only speculate. For example, perhaps in nurses, the elevated nighttime responses are associated with some specific odor-guided behaviors that are performed at night, as was suggested for D. melanogaster (Zhou et al., 2005; Fujii et al., 2007). Some evidence is consistent with this premise. For example, in response to cold, worker bees cluster to warm the brood more often during the night, even under constant illumination and temperature (Kronenberg and Heller, 1982). Worker clustering on the brood is thought to be induced by a brood pheromone, glyceryl-1,2-dioleate-3-palmitate (Koeniger, 1978; Koeniger and Veith, 1983). Given that foragers and middle-aged bees typically sleep at night with a low thoracic temperature (Klein et al., 2008; Klein et al., 2014), one can speculate that nurses contribute more to nest thermoregulation during the night, and this may be mediated by their increased nighttime olfactory responsiveness. An alternative explanation is that the nurse elevated olfactory responsiveness (specifically to alarm pheromones) serves for the detection and response to threats at night, as during this time guard workers may be less responsive to intruders (Troen et al., 2008). Although these ideas are speculative at this stage, we suggest that it is worth testing whether nurses differ from foragers in the circadian regulation of odor-guided behaviors such as aggression and thermoregulation. This phase variability may be related to variation in the environments experienced by nurses (who spend most of their time inside the nest) and foragers (who spend a significant proportion of their time outside the nest), or to some internal task-regulated mechanisms.
The overall similar phase of the EAG response to the different stimuli (including air) tested in this study suggests that most or all of the responses we recorded are influenced by the same clock or by multiple tightly coupled clocks. An important line of future research is to distinguish between these 2 possible mechanisms, as well as to determine whether the circadian influence on the EAG response is the output of peripheral clocks in the antennae, central clocks in the brain, or both. The influence of central clocks on antennal responsiveness may be mediated by neuroendocrine signals such as hormones and neuromodulators (Bloch et al., 2013). Studies with other insect species suggest that both mechanisms are feasible. For example, in Manduca sexta moths, circadianly regulated levels of the biogenic amine octopamine may regulate both the overall response and the temporal resolution of antennal receptor-neurons (Flecke and Stengl, 2009; Schendzielorz et al., 2015). This is consistent with central circadian control over olfaction. On the other hand, studies with D. melanogaster show that peripheral clocks in the antennae are necessary and sufficient for supporting olfaction rhythms (Krishnan et al., 1999; Tanoue et al., 2004). Peripheral or central clocks may regulate rhythms in the levels of odorant-binding proteins and odorant-degrading enzymes (Rund et al., 2013a, 2013b), thereby affecting the rate of odorant deactivation (Vogt and Riddiford, 1981; Vogt et al., 1985) and the temporal resolution of odor transduction (Kaissling, 2013). These hypotheses are yet to be tested.
To sum, our study provides evidence that circadian clocks, distinct from the ones controlling locomotor activity rhythms, influence the olfactory responsiveness of the honeybee antenna. The coupling of these different pacemakers seems to be influenced by the worker task group (i.e., nurse or forager). This variability in sensory responsiveness between workers performing different activities may facilitate the integration of thousands of individuals into a coherently functional unit (“superorganism”) in an environment that constantly changes during the day.
Footnotes
Acknowledgements
We thank Professor Benny Hochner and Dr. Guy Levy, The Hebrew University of Jerusalem, for sharing with us electrophysiological equipment and for valuable technical advice. We also thank Sophie Silverstein and Dr. Adam Siegel for helping in performing the EAG recordings and Rafi Nir for professional beekeeping assistance. This study was financially supported by a Minerva short-term research grant (to M.N., G.B., and G.G.) and grants from the Israel Science Foundation (1274/15 to G.B.) and the German-Israeli Foundation for Scientific Research and Development (822/2004 and 2064-1205 13/2002 to G.B.).
Conflict of Interest Statement
The author(s) have no potential conflicts of interest with respect to the research, authorship, and/or publication of this article.
Notes
References
Supplementary Material
Please find the following supplemental material available below.
For Open Access articles published under a Creative Commons License, all supplemental material carries the same license as the article it is associated with.
For non-Open Access articles published, all supplemental material carries a non-exclusive license, and permission requests for re-use of supplemental material or any part of supplemental material shall be sent directly to the copyright owner as specified in the copyright notice associated with the article.