
Abstract
The identification and investigation of novel clock-controlled genes (CCGs) has been conducted thus far mainly in model organisms such as nocturnal rodents, with limited information in humans. Here, we aimed to characterize daily and circadian expression rhythms of CCGs in human peripheral blood during a sleep/sleep deprivation (S/SD) study and a constant routine (CR) study. Blood expression levels of 9 candidate CCGs (SREBF1, TRIB1, USF1, THRA1, SIRT1, STAT3, CAPRIN1, MKNK2, and ROCK2), were measured across 48 h in 12 participants in the S/SD study and across 33 h in 12 participants in the CR study. Statistically significant rhythms in expression were observed for STAT3, SREBF1, TRIB1, and THRA1 in samples from both the S/SD and the CR studies, indicating that their rhythmicity is driven by the endogenous clock. The MKNK2 gene was significantly rhythmic in the S/SD but not the CR study, which implies its exogenously driven rhythmic expression. In addition, we confirmed the circadian expression of PER1, PER3, and REV-ERBα in the CR study samples, while BMAL1 and HSPA1B were not significantly rhythmic in the CR samples; all 5 genes previously showed significant expression in the S/SD study samples. Overall, our results demonstrate that rhythmic expression patterns of clock and selected clock-controlled genes in human blood cells are in part determined by exogenous factors (sleep and fasting state) and in part by the endogenous circadian timing system. Knowledge of the exogenous and endogenous regulation of gene expression rhythms is needed prior to the selection of potential candidate marker genes for future applications in medical and forensic settings.
Daily lives of all organisms, including humans, are governed by the endogenous circadian timing system. Circadian clocks are present in virtually every cell and exert their functions via a transcriptional-translational autoregulatory feedback loop composed of genes such as PER1, PER2, PER3, CRY1, CRY2, BMAL1, CLOCK, and their protein products (Lowrey and Takahashi, 2004, 2011). A number of studies have reported that these core clock genes are rhythmically expressed in human peripheral tissues, such as skin tissue culture and oral mucosa (Bjarnason et al., 2001), adipose tissue explants (Gómez-Santos et al., 2009), and peripheral blood mononuclear cells (PBMCs) (Takata et al., 2002; Boivin et al., 2003; Archer et al., 2008; Ackermann et al., 2013). However, to date, the identification of novel clock-controlled genes (CCGs) has been conducted mainly in nocturnal rodents (Ripperger et al., 2000; Bozek et al., 2009; Zhang et al., 2009).
These CCGs, despite being regulated by the core clock elements listed above, are not part of the clock’s mechanism but are thought to be the means by which the clock adapts the body’s physiological and metabolic processes to recurring environmental changes (Duffield, 2003; Lamont et al., 2007). The CCGs encode a diverse group of molecules, such as ion channels, metabolic enzymes, or transcription factors (Lamont et al., 2007). However, even though the expression patterns of the core clock genes have been experimentally confirmed in humans (Bjarnason et al., 2001; Takata et al., 2002; Gómez-Santos et al., 2009; Ackermann et al., 2013), the information regarding clock-related or clock-controlled genes in humans is limited. Transcriptome studies report that approximately 3% to 10% of genes in a given mammalian tissue are rhythmic (Cermakian and Boivin, 2009); nevertheless, the overlap between various tissues can be very small.
More recently, human studies have started investigating the functions of CCGs and the external factors influencing their expression to better understand the mechanisms linking the circadian clock, sleep, and diseases such as cardiovascular disease (Takeda and Maemura, 2011; Portaluppi et al., 2012), cancer (Sahar and Sassone-Corsi, 2009; Savvidis and Koutsilieris, 2012), sleep disorders (Archer et al., 2003; Lu and Zee, 2006; Sack et al., 2007), hypertension (Scheer et al., 2009), diabetes and obesity (Laposky et al., 2008; Scheer et al., 2009), and metabolic syndrome (Turek et al., 2005; Maury et al., 2010). Knowledge about the expression of CCGs in human blood, however, remains scarce.
In this study, the temporal expression patterns of 9 CCGs were assessed in human peripheral blood samples collected during sleep/sleep deprivation (S/SD) and constant routine (CR) studies: Sterol Regulatory Element-Binding Transcription Factor 1 (SREBF1) (Bozek et al., 2009; Zhang et al., 2009), Signal Transducer and Activator of Transcription 3 (STAT3) (Bozek et al., 2009; Hughes et al., 2009), Tribbles Homolog 1 (TRIB1) (Ollila et al., 2012), Upstream Transcription Factor 1 (USF1) (Shoulders and Naoumova, 2004; Shimomura et al., 2013), MAP Kinase Interacting Serine/Threonine Kinase 2 (MKNK2) (Chudova et al., 2009), Thyroid Hormone Receptor Alpha (THRA1) (Zandieh Doulabi et al., 2004; Zhu and Cheng, 2010; Vollmers et al., 2012), Sirtuin 1 (SIRT1) (Rodgers et al., 2005; Longo and Kennedy, 2006; Asher et al., 2008; Nakahata et al., 2008; Nakahata et al., 2009), Cell Cycle Associated Protein 1 (CAPRIN1) (Panda et al., 2002), and Rho-Associated, Coiled-Coil Containing Protein Kinase 2 (ROCK2) (Saito et al., 2013). These genes were selected as representative CCGs, rather than to determine any mechanistic pathways. Instead, our selection of candidate genes was motivated by findings from a number of rodent studies, which have shown that these genes either exhibited daily expression patterns (Zandieh Doulabi et al., 2004; Chudova et al., 2009; Vollmers et al., 2012) or were directly (Ollila et al., 2012; Shimomura et al., 2013) or indirectly (Panda et al., 2002; Asher et al., 2008; Saito et al., 2013) linked to the circadian timing system and/or sleep/wake processing, while knowledge on their expression in human blood was mostly absent.
Using 2 different study protocols, we aimed to determine whether the selected candidate genes are expressed in a rhythmic manner in human blood and, if so, to distinguish the genes that exhibit daily 24-h rhythmicity (S/SD study) from those that show circadian rhythmicity (CR study). Additionally, in the CR samples, we analyzed the expression of 4 core clock genes, PER1, PER3, REV-ERBα, and BMAL1, and the HSPA1B heat shock gene, previously observed to be significantly rhythmic in the S/SD study (Ackermann et al., 2013), to assess their circadian rhythmicity.
Materials and Methods
Sleep Laboratory Study
Two studies, the S/SD study and CR study, were conducted at the Surrey Clinical Research Centre (CRC) at the University of Surrey (United Kingdom). All procedures were conducted in accordance with the Declaration of Helsinki, and a favorable opinion was obtained from the University of Surrey Ethics Committee. Written and oral informed consent was obtained from the participants prior to any procedures being performed, and they were allowed to withdraw from the study at any time. All subject information was coded and held in strictest confidence according to the Data Protection Act (United Kingdom, 1998).
Eligibility criteria for the S/SD study have been previously described in detail (Ackermann et al., 2012). The eligibility of the subjects for the CR study was determined by completion of validated sleep questionnaires (Pittsburgh Sleep Quality Index (PSQI) ≤5, Beck Depression Inventory <10, Epworth Sleepiness Scale <10, and Horne-Östberg and Munich Chronotype questionnaire [extreme chronotypes were ineligible]), medical and physical assessments, and analysis of blood and urine screening samples. Inclusion criteria included the following: age between 18 and 35 years; completion and fulfillment of the defined criteria of the prestudy questionnaires; taking the combined oral contraceptive pill if female and being in the active phase of the menstrual cycle (i.e., taking the hormone pills) during the in-laboratory session; passing a medical assessment; consent to contacting the candidate’s general practitioner for confirming the candidate’s medical history; agreement to refrain from alcohol, caffeine, exercise, and bright light for 72 h before and during the in-laboratory session; agreement to eat standardized meals for the 48 h prior to the laboratory session; refraining from taking any over-the-counter (including nonsteroidal anti-inflammatory drugs) or prescribed medication (apart from oral contraceptives) for a washout period of 7 days prior to the laboratory session; reporting a habitual, regular sleep-wake cycle for the month preceding screening that involved going to bed between 2200 and 0100 h and getting up between 0600 and 0900 h with 6 to 9 h in bed; agreement to keep a regular sleep/wake schedule for the duration of the study; and wearing Actiwatches (AWL) and completing written sleep diaries for the duration of the study. Exclusion criteria included significant medical history or taking specific medication. Participants were excluded for the following: ever having a history of systemic, psychiatric, or neurological disease or drug and alcohol abuse; taking regular medication that affects melatonin synthesis or circadian rhythms (antihypertensive drugs, nonsteroidal anti-inflammatory drugs, hypnotic drugs, benzodiazepines, antidepressants, antipsychotic drugs, barbiturates, antiepileptic drugs) in the past 6 months; having donated over 400 mL of blood within 3 months (90 days) of screening for the study; working night shifts or traveling across more than 2 time zones within 1 month of and throughout the study; being a smoker or having been a smoker in the 6 months prior to their screening visit; being a vegetarian or having other dietary restrictions as this can affect metabolism; drinking >21 units of alcohol per week if male and >14 units per week if female; having a body mass index (BMI) <19 or >30 kg/m2 or a total body weight <50 kg as assessed at the screening visit; having a positive drugs of abuse urine screen at screening or upon entry into the laboratory session; having a positive cotinine urine screen at screening or upon entry into the laboratory session; having a positive alcohol breath test at screening or upon entry into the laboratory session; having abnormal blood biochemistry and/or hematology as deemed significant by the study physician; being positive for human immunodeficiency virus or hepatitis B or C; having a clinically significant allergy (e.g., to food stuffs such as shellfish, peanuts); being pregnant; being considered unsafe to participate as determined by the medical investigator; or having received any investigational drug and/or participated in any clinical trial within 3 months of the screening assessment.
For 7 days before the in-laboratory session for both studies, participants maintained a regular sleep/wake schedule aligned with their habitual sleep patterns. For the S/SD study, participants maintained a 2300 to 0700 h schedule; for the CR study, the participants were asked to select an 8-h sleep period going to bed between 2200 and 0100 h and waking up between 0600 and 0900 h. Compliance for both studies was confirmed by using activity/light monitors (Actiwatch; CamNtech, Cambridge, UK), sleep logs, and time-stamped voicemail. During the final 72 h of this baseline period, the participants were required to refrain from consuming alcohol/caffeine and taking any medication. This baseline period ensured that the participants beginning the clinical study were not sleep deprived and that their circadian phase was stabilized. A detailed schematic representation of the S/SD and CR study protocols is shown in Figure 1.
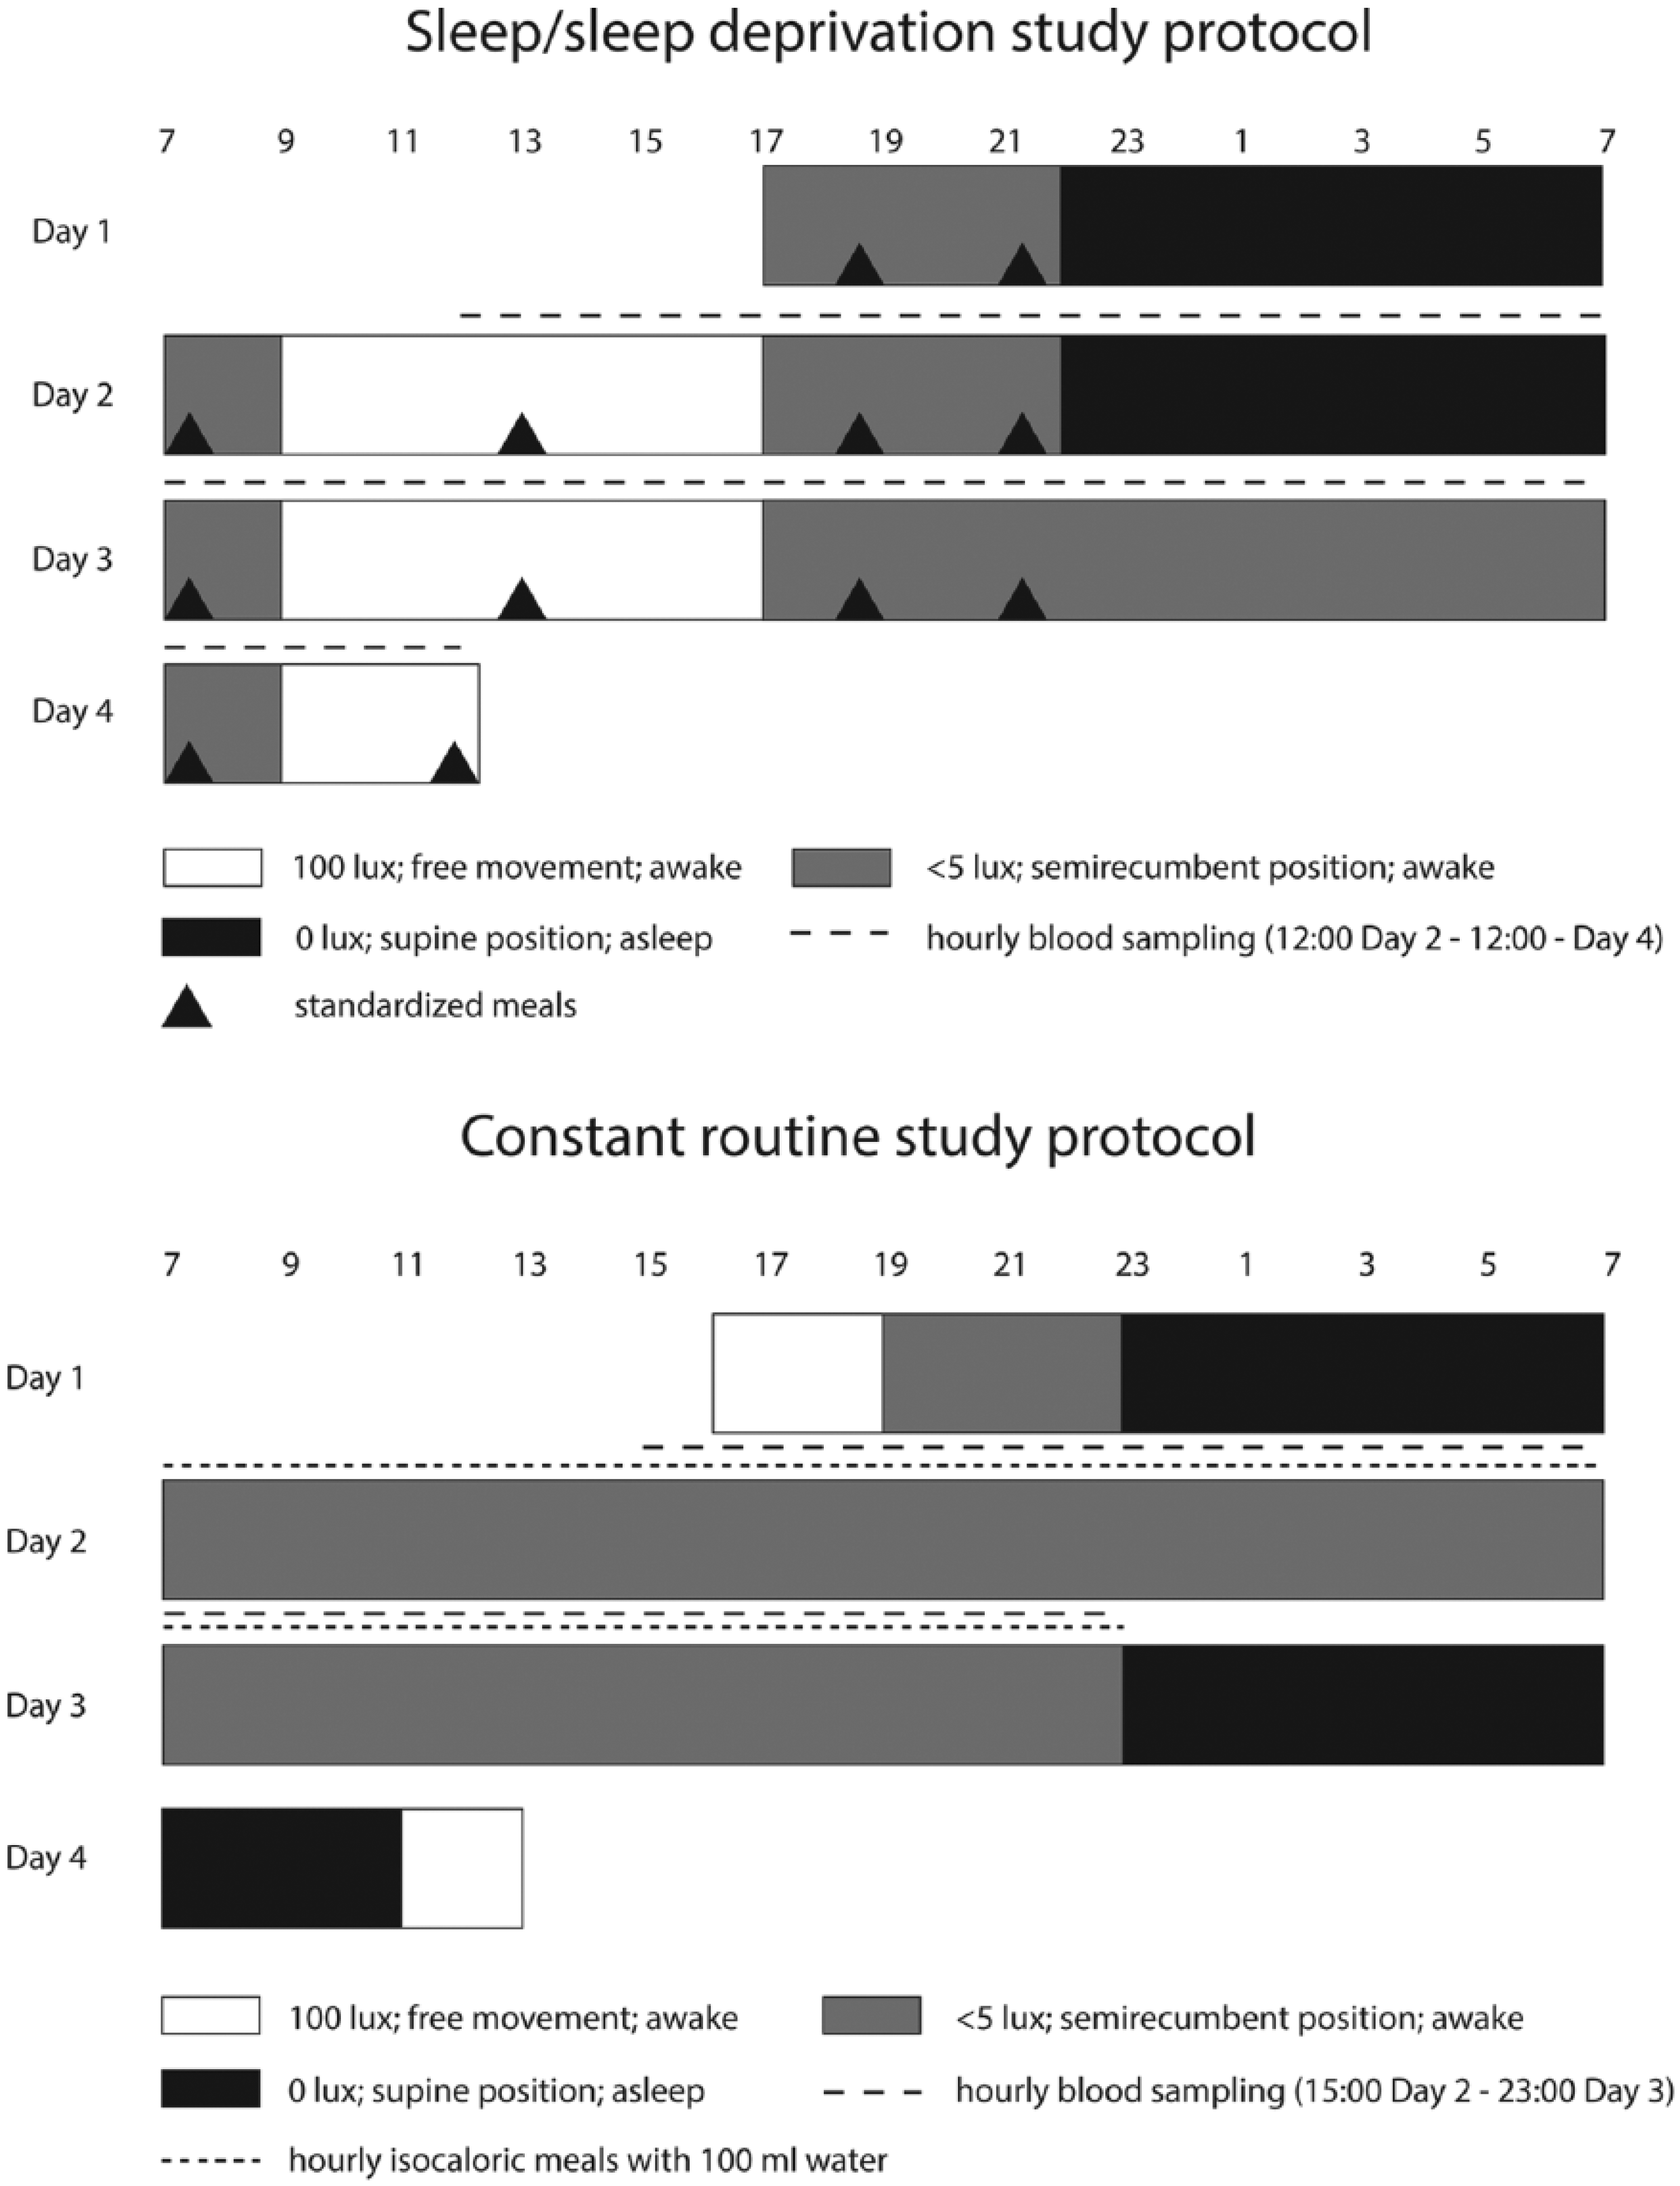
The sleep/sleep deprivation (S/SD) and constant routine (CR) study protocols. The S/SD study scheme is modified from Figure 1 in Ackermann et al. (2012).
Sleep/sleep deprivation study (S/SD)
A detailed description of the S/SD study protocol has been reported elsewhere (Ackermann et al., 2012; Ackermann et al., 2013). In brief, the participants (15 healthy, young males aged 24 ± 5 years [mean ± standard deviation (SD)]) participated in a 66-h in-laboratory session, which included 3 night periods: adaptation (N1) and baseline (N2) nights with normal sleep and a sleep deprivation night 3 (N3), when the participants remained awake and supine in dim light conditions (<5 lux in the direction of gaze). Environmental light and posture were controlled before and after a sleep episode as samples were also being taken for measurement of plasma melatonin, which is highly influenced by such factors (Deacon and Arendt, 1994, Zeitzer et al., 2000). The participants were aware of clock time during the duration of the S/SD study. Blood samples were collected every hour via a catheter. Samples from 12 participants (age 23 ± 5 years [mean ± SD]) at 2 hourly intervals (25 samples per participant) from 1200 h on day 2 (D2) to 1200 h on day 4 (D4) were selected for analysis.
Constant routine (CR) study
Healthy subjects between 18 and 35 years of age participated in the CR study. After the baseline-at-home period, the participants were admitted into the laboratory, where abstinence from alcohol, nicotine, and drugs of abuse was confirmed. The in-laboratory session included an adaptation night with habitual sleep times followed by continual wakefulness until 2300 h on day 3. Electroencephalography monitoring occurred from 1200 h on day 2 until 2300 h on day 3 to ensure the subjects remained awake throughout the CR protocol. The participants were subjected to strictly controlled constant routine conditions, including dim lighting (<5 lux in the direction of gaze), semirecumbent posture, and hourly intake of isocaloric snacks with 100 mL of water. They were not aware of clock time during the study period. Hourly blood samples were collected via an intravenous catheter. For the current gene expression study, 2 hourly samples (from 1500 h on day 2 until 2300 h on day 3; 17 samples per participant) were collected into PAXgene RNA tubes (Qiagen, Crawley, UK) from 12 participants (6 males, age 25 ± 6 years [mean ± SD] and 6 females, age 23 ± 3 years). These participants were selected based on the quality of their extracted RNA, as assessed using the RIN (RNA Integrity Number) with values ≥7.6. Four females were taking 30 µg ethinylestradiol and 150 µg progestin, 1 was taking 0 µg ethinylestradiol and 75 µg progestin, and 1 was taking 30 µg ethinylestradiol and 3000 µg progestin.
Melatonin Concentration and DLMO Assessment
Radioimmunoassay analysis was performed on plasma samples to measure melatonin concentration (Stockgrand Ltd., University of Surrey, Surrey, UK) as described (Fraser et al., 1983; Sletten et al., 2009). The data were used to calculate dim light melatonin onset (DLMO), using a defined 25% threshold, for each individual for both the sleep (night 2 [N2]) and sleep deprivation (night 3 [N3]), as described previously (Sletten et al., 2009; Ackermann et al., 2012). The calculated DLMO was used to phase-adjust the gene expression data, for determination of the 24-h rhythmicity, amplitude, and acrophase with the nonlinear mixed model method.
RNA Isolation
Blood samples were stored at −80 °C prior to RNA extraction during both studies (S/SD and CR). PAXgene Blood RNA Kit 50 (PreAnalytiX, Hombrechtikon, Switzerland) was used for RNA extraction from CR study blood samples, and the PAXgene 96 Blood RNA Kit (PreAnalytiX, Hombrechtikon, Switzerland) was used to isolate RNA from the S/SD study blood samples (Ackermann et al., 2013). According to the manufacturer, the differences in the kit protocols (binding columns and centrifuge vs. 96-well plate and vacuum pump) do not affect the RNA yield and quality. Both extraction procedures were performed according to the enclosed manufacturer’s protocols. Nanodrop ND-2000 (NanoDrop Technologies, Wilmington, DE, USA) was used to measure RNA concentration in the extracted samples, and the quality was assessed with Bioanalyzer 2100 (Agilent Technologies, Waldbronn, Germany). Total RNA samples were kept at −80 °C until assayed.
Reverse Transcription (RT) Reaction
The RevertAid H Minus First Strand cDNA Synthesis Kit (Thermo Fisher Benelux, Amsterdam, Netherlands) was used for complementary DNA (cDNA) synthesis, following the manufacturer’s protocol for First Strand cDNA Synthesis. Random hexamer primers were used and the optional denaturation step was included. The reaction was performed on an MJ Research Thermal Cycler PTC-200 (GMI, Ramsey, MN, USA) with the following program: 5 min at 25 °C, 60 min at 42 °C, and 5 min at 70 °C. The cDNA was kept at −20 °C until assayed.
Real-Time Quantitative PCR Reaction
cDNA samples were diluted to a final concentration of 2.5 ng/µL (based on RNA input) and used in subsequent real-time quantitative polymerase chain reaction (qPCR), with a final volume of 10 µL. Each reaction contained 2 µL diluted cDNA, 5 µL LightCycler480 SYBR Green I Kit (Roche Diagnostics, Mannheim, Germany), 1 µL of appropriate forward and reverse primer mix (3 µM), and 2 µL nuclease-free water. Negative controls with nuclease-free water instead of cDNA were included in each run.
Expression of SREBF1, TRIB1, USF1, MKNK2, THRA1, SIRT1, STAT3, CAPRIN1, ROCK2, and ACTB genes was analyzed in the S/SD study samples (in total 300 samples, 25 samples per subject, n = 12) and in CR samples (in total 204 samples, 17 samples per subject, n = 12). Additionally, in the CR study samples, expression of PER1, PER3, REV-ERBα, BMAL1, and HSPA1B was assessed to compare with the daily expression profiles reported previously in our S/SD study samples (Ackermann et al., 2013).
ACTB was chosen as the reference gene, based on the results from the same sample set (S/SD study) where 5 different housekeeping genes (GAPDH, ACTB, HPRT, PPIB, and UBC) were tested and compared against each other both alone and in combinations (Ackermann et al., 2013). As confirmation, a single cosinor test was performed on the ACTB expression data (z-scored, averaged across individuals) from the S/SD and CR studies. The expression levels of ACTB during the CR and S/SD were not significantly rhythmic (pCR = 0.40; pS/SD = 0.39). All primers were acquired from Metabion (Martinsried, Germany), and their efficiency as well as target specificity was tested prior to their use in the experiments. Primer-BLAST was used for primer design, the option of spanning an exon-exon junction included. Sequences of PER1, PER3, REV-ERBα, BMAL1, HSPA1B, and ACTB primers were taken from previously published studies (Archer et al., 2008; Kimura et al., 2011; Visser et al., 2011; Ackermann et al., 2013). The sequences of all the primers used are presented in Supplemental Table S1.
All real-time qPCR reactions were run in triplicate on a Light Cycler 480 II platform (Roche Diagnostics) in 384-well plates. The reaction protocol consisted of denaturation at 95 °C for 10 min and 45 cycles of denaturation (95 °C, 10 sec), annealing (60 °C, 10 sec), and extension (72 °C, 10 sec), followed by a melting curve step with continuous data acquisition from 65 °C to 97 °C.
Real-Time qPCR Data Analysis
The second derivative maximum method, implemented in the Light Cycler 480 software (Roche Diagnostics), followed by the delta-delta-cycle-threshold (ΔΔCT) method (Livak and Schmittgen, 2001), was used to quantify relative gene expression in the S/SD and CR samples. Afterward, ACTB-normalized, relative gene expression values were z-scored (per individual), and 3 different analyses of gene expression were conducted.
Statistical Analyses
Analysis of variance
A 2-way, repeated-measures analysis of variance (ANOVA) with a Bonferroni correction was performed to determine the significance of changes in gene expression levels between the 2 different conditions (sleep vs. sleep deprivation) and the time of day, as well as their interaction (time of day × condition) for the S/SD study data without considering a circadian rhythm model. Subsets for analysis were determined as follows: 1) 12-h periods using samples collected from 0000 h on day 3 to 1200 h on day 3 versus samples from 0000 h on day 4 to 1200 h on day 4, to assess expression changes covering the sleep and sleep deprivation periods, and 2) 24-h periods using samples from 1400 to 1200 h (first 24 h) versus samples from 1400 to 1200 h (second 24 h), to examine the expression changes between the two 24-h days. The first time point (1200 h) was omitted to obtain the same sample numbers in both comparisons. To account for missing samples (<1.5%), linear interpolation based on non–z-scored, ACTB-normalized expression data from the same subject and gene was applied to simulate gene expression levels. Determination of the expression changes across time for genes tested in the CR study samples was performed using a 1-way ANOVA with Bonferroni correction.
Single individual cosinor analysis
To ascertain whether the changes in gene expression levels over time followed a 24-h sinusoidal pattern in each individual, single cosinor analysis was performed separately for S/SD samples divided into 2 subsets (“sleep” and “sleep deprivation”). Each of the subsets included one of the following conditions: either normal wake/sleep (first 24 h: samples from 1200 h on day 2 to 1200 h on day 3—“sleep” subset) or sleep deprivation (second 24 h: samples from 1200 h on day 3 to 1200 h on day 4—“sleep deprivation” subset). Single cosinor analysis for the CR sample set was performed for the 33-h period comprising the whole set of samples (from 1500 h on day 2 to 2300 h on day 3).
Estimation of amplitude and acrophase with a nonlinear mixed model
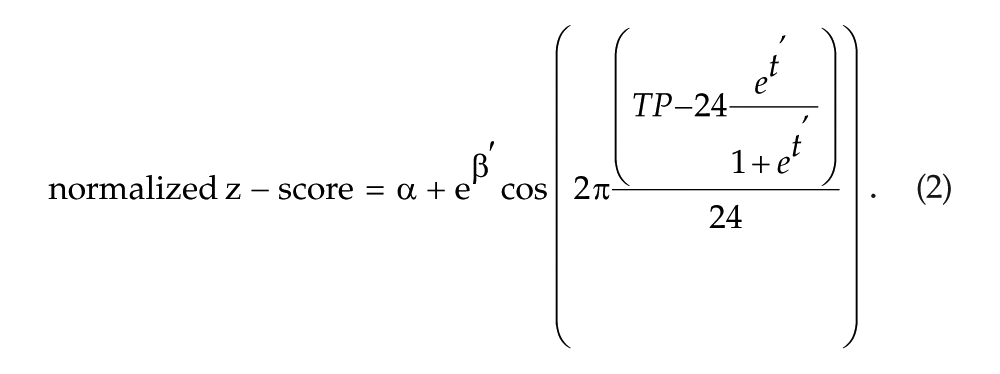
To estimate the amplitude and acrophase for each gene across all individuals participating in the S/SD and CR studies, a nonlinear mixed model was used. For these analyses, the difference between an individual’s DLMO and the average DLMO (for all individuals) was calculated. This value was used to obtain DLMO-corrected amplitude and acrophase values. To ascertain whether the changes in gene expression levels over time followed a 24-h sinusoidal pattern, a cosinor analysis was performed as done previously (Ackermann et al., 2013):

where β is the amplitude, t is the acrophase, and α is the independent term.
To avoid multiple solutions due to the periodicity of the cosine function and to reduce the amount of correlation between β and t, a variable transformation of (1) was applied:
Repeated measures for each individual in the estimation of α, β, and t were incorporated as a random effect in the model. A nonlinear mixed model (Davidian and Giltinan, 1995; Lindstrom and Bates, 1990) with fixed and random effects was implemented using the nlmer function from the R package lme4 (Bates et al., 2014, 2015) on z-scored, ACTB-normalized data for both studies.
The effect of sleep deprivation on β and t was included as a fixed effect in (2) by comparing it against the sleep condition:
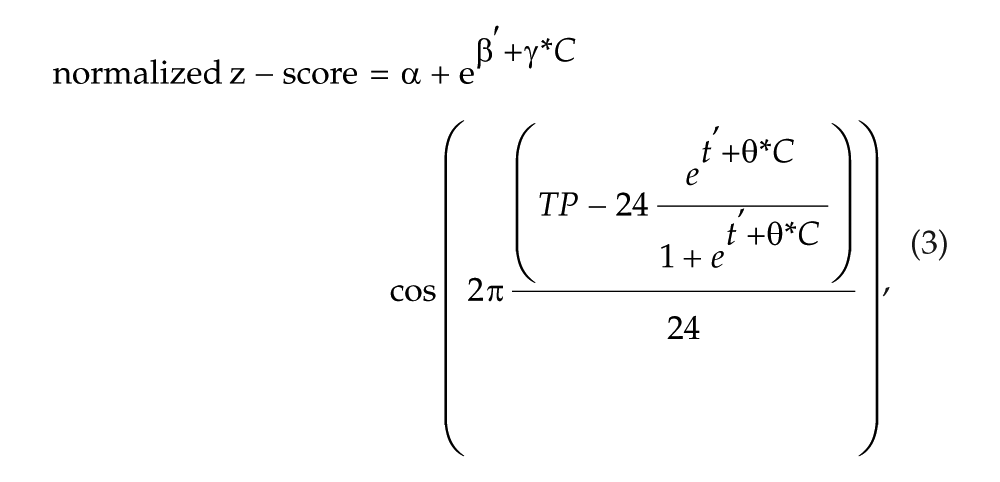
where C takes 1 in sleep deprivation, 0 otherwise.
The statistical significance of differences of amplitude and acrophase depending on sleep condition was estimated by comparing the likelihood of the nested models (2) and (3) by means of ANOVA using the anova() command from R.
The most statistically supported model was then compared with the nested null model:

using the same ANOVA framework.
After multiple testing correction (Bonferroni) was applied, the new significance level for ANOVA performed in the S/SD study samples was set at p < 0.006 and in the CR study samples at p < 0.004. For the nonlinear mixed model test, the new significance level for analyses in the S/SD and CR study samples was set at p < 0.004. For the single cosinor tests, the significance level was set at p < 0.05. In all the tests, nonstatistical values that were obtained are designated as ns.
Results
Daily Rhythms in Gene Expression Levels in the S/SD Study Samples
Averaged expression levels for 8 selected genes analyzed in the S/SD study are presented in Figure 2 and for all genes tested in Supplemental Figure S1. Individual expression profiles of all the genes analyzed in the S/SD study are presented in Supplemental Figure S2.
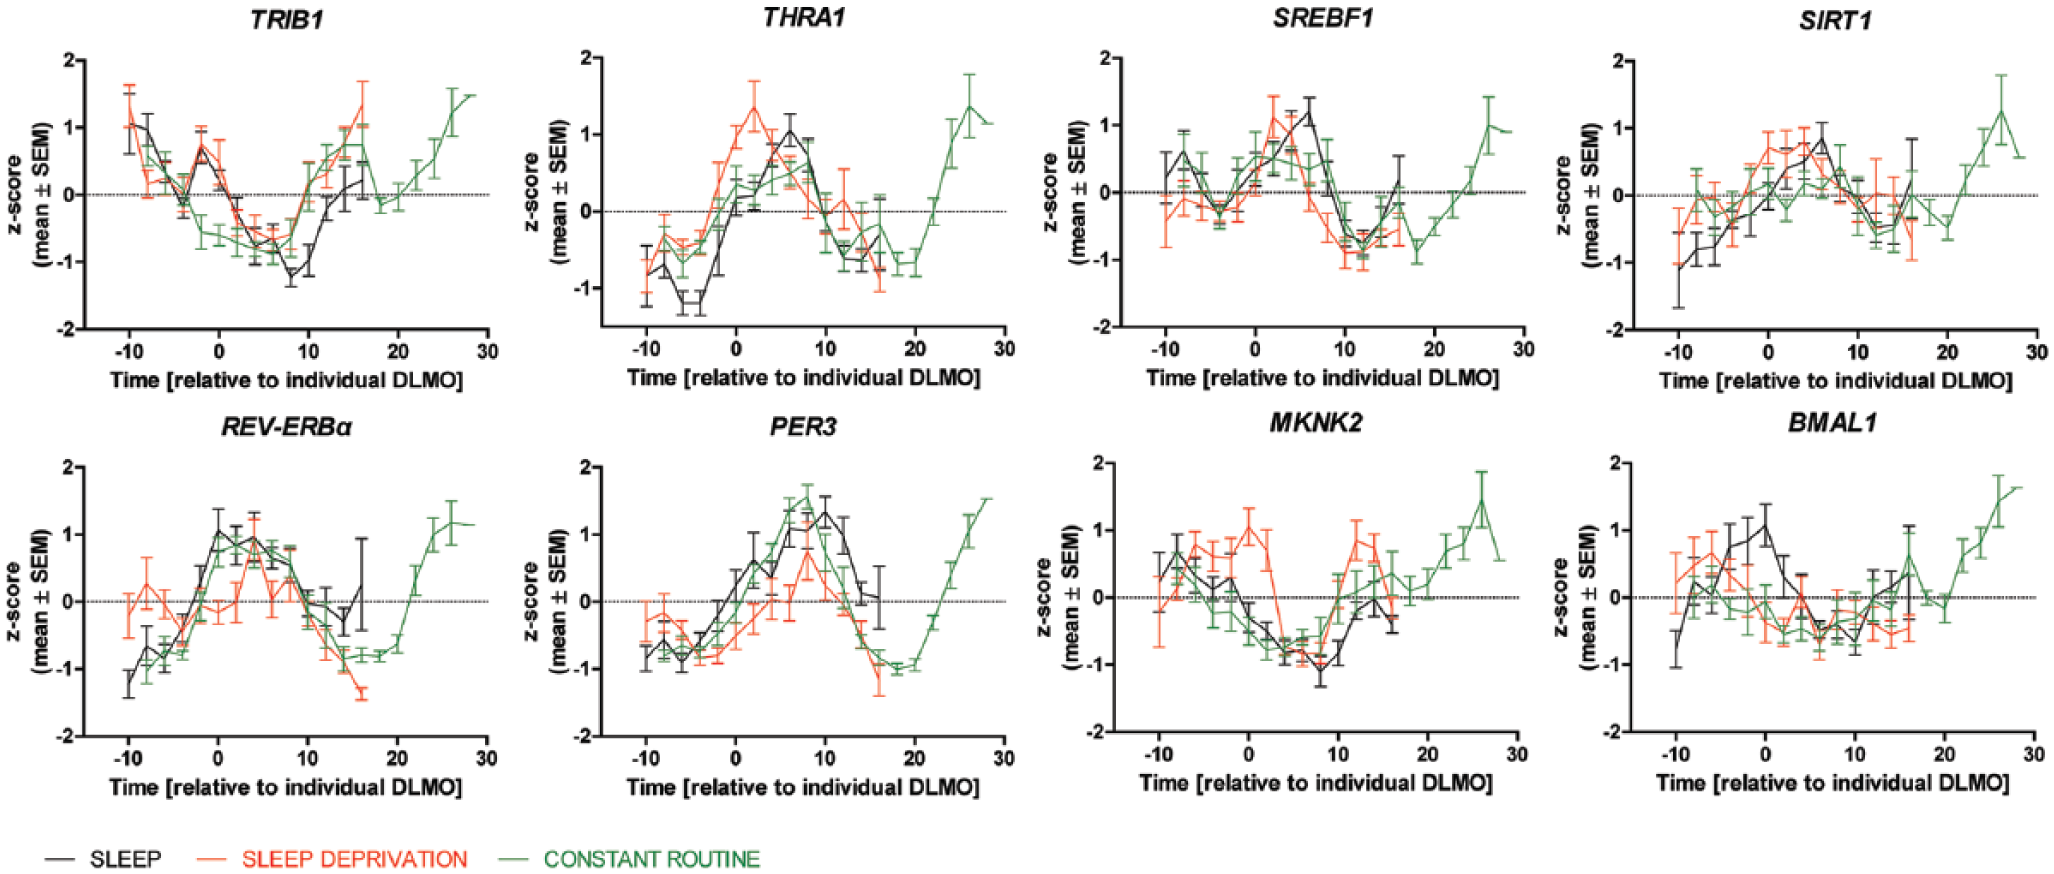
Plots of mean, z-scored, ACTB-normalized expression levels of 8 selected genes (TRIB1, THRA1, SREBF1, SIRT1, REV-ERBα, PER3, MKNK2, and BMAL1) tested in the subjects from the sleep/sleep deprivation (S/SD) and constant routine (CR) studies. Results from 3 different conditions (sleep, sleep deprivation, constant routine) are overlaid together per each gene in a color-coded way as follows. Black, the first 24 h of the S/SD study, including the sleep night; red, the second 24 h of the S/SD study, including the sleep deprivation night; and green, the CR study, 33 h, no sleep permitted. The time axis is presented as time in hours relative to individual DLMO.
With the ANOVA, we found that MKNK2 showed a statistically significant time-of-day variation during the first and second 24 h of the S/SD study (p < 0.006, after Bonferroni correction), as well as during 2 shorter time periods, one comprising the sleep night with half a day afterward (from 0000 to 1200 h on day 3) and the other comprising the sleep deprivation night and half a day afterward (from 0000 to 1200 h on day 4) (p < 0.006, after Bonferroni correction). Analysis of MKNK2 with the nonlinear mixed model revealed that the cosinor model was better than the null model, and the obtained estimates of acrophase and amplitude were statistically significant after Bonferroni correction (p < 0.004) (Table 1). The single cosinor method showed that MKNK2 was rhythmic in 5 of the 12 individuals tested (42%) during the sleep condition and in 4 (33%) individuals during the sleep deprivation condition (Table 2).
Results of the Nonlinear Mixed Model Curve-Fitting Analysis for S/SD Study Samples.
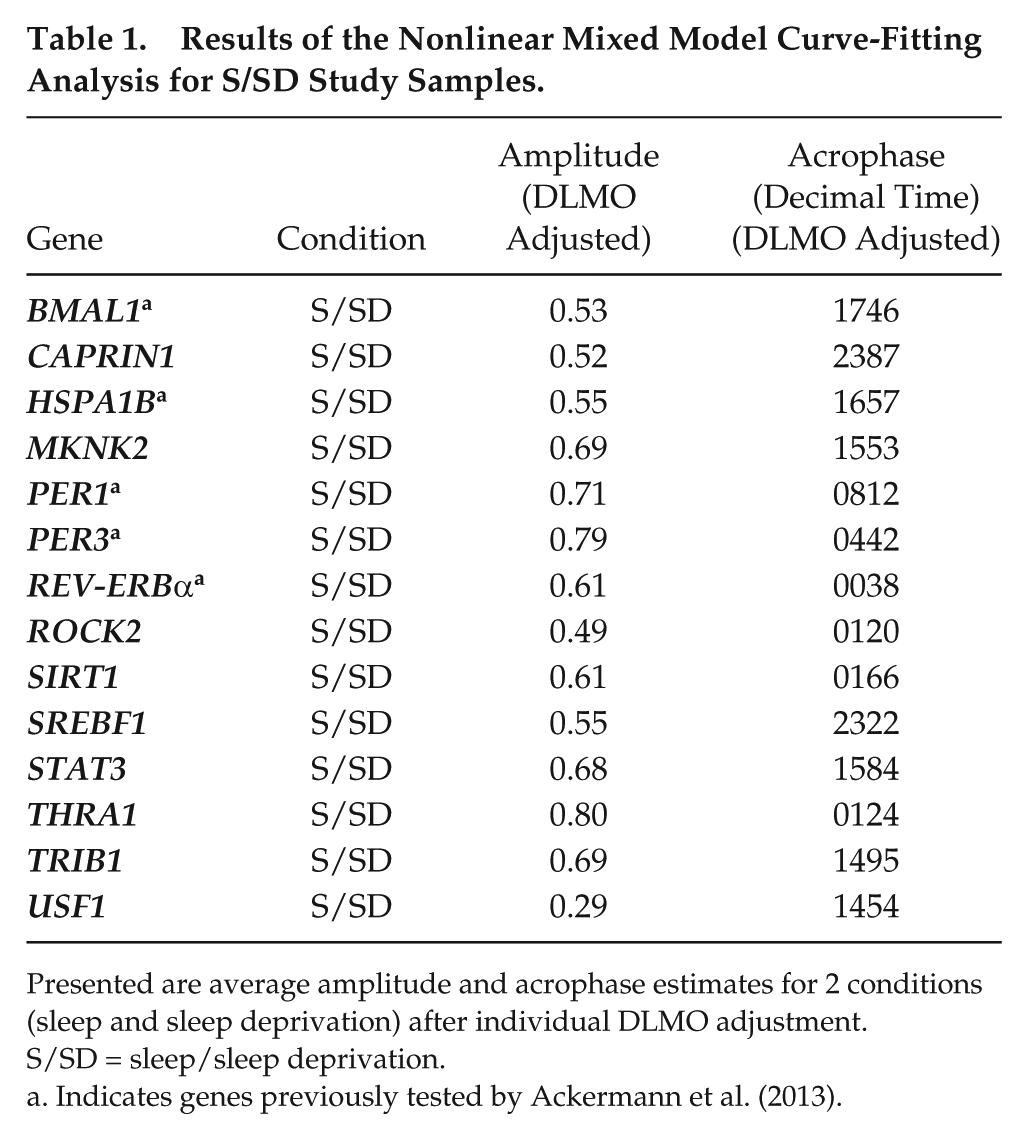
Presented are average amplitude and acrophase estimates for 2 conditions (sleep and sleep deprivation) after individual DLMO adjustment. S/SD = sleep/sleep deprivation.
Indicates genes previously tested by Ackermann et al. (2013).
Results of the Single Cosinor Analysis for Genes Tested in the Sleep/Sleep Deprivation Study Samples.
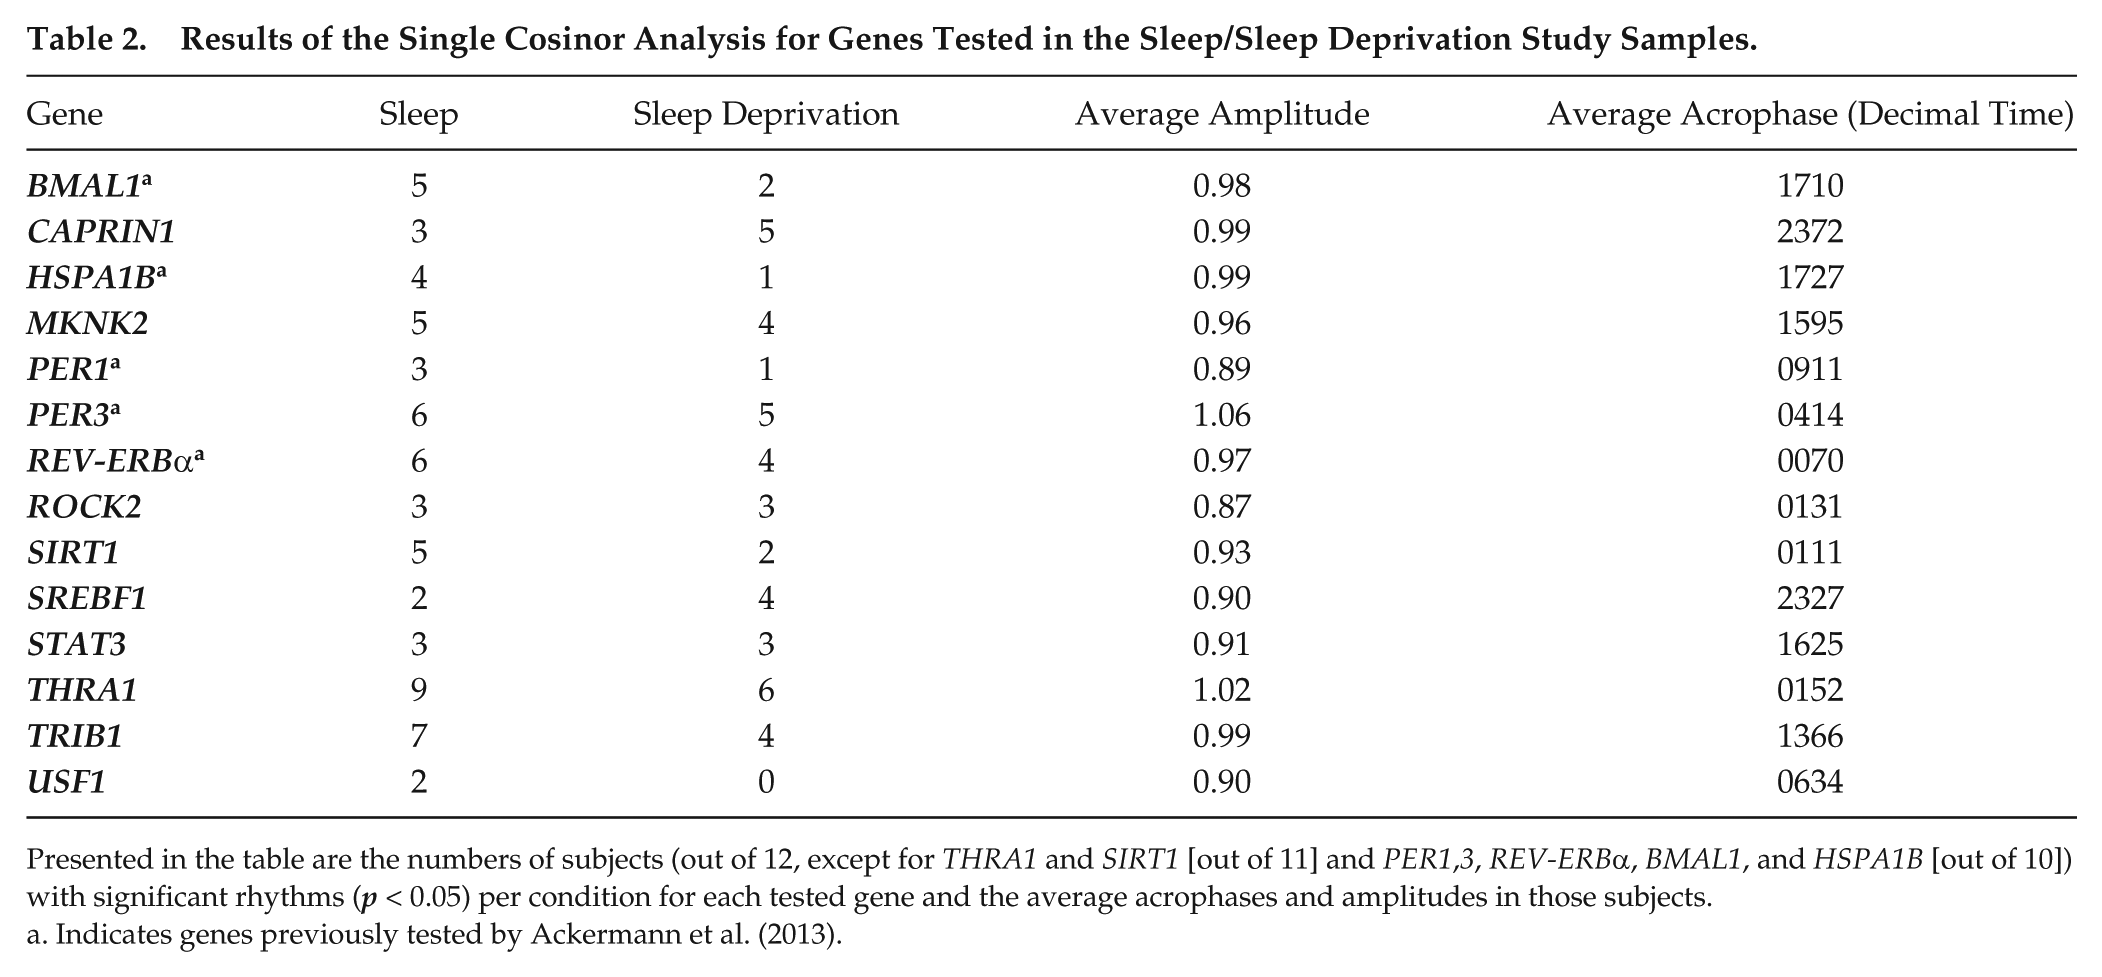
Presented in the table are the numbers of subjects (out of 12, except for THRA1 and SIRT1 [out of 11] and PER1,3, REV-ERBα, BMAL1, and HSPA1B [out of 10]) with significant rhythms (p < 0.05) per condition for each tested gene and the average acrophases and amplitudes in those subjects.
Indicates genes previously tested by Ackermann et al. (2013).
The genes SREBF1, STAT3, and TRIB1 exhibited significant time-of-day variation in expression during the first and second 24 h of the S/SD study, as well as during the shorter time periods (ANOVA; p < 0.006, after Bonferroni correction). Nonlinear mixed model analysis showed that the acrophase and amplitude estimates were statistically significant during the S/SD study (Table 1). Single cosinor analysis found that SREBF1 expression was significantly rhythmic in 2 (17%) and 4 (33%) individuals and TRIB1 in 7 (58%) and 4 (33%) individuals during sleep and sleep deprivation conditions, respectively (Table 2). STAT3 was rhythmic in 3 (25%) individuals during sleep and in 3 (25%) individuals during sleep deprivation.
THRA1 showed significant time-of-day variation during the first and second 24 h of the study, as well as during the shorter time periods (ANOVA; p < 0.006, after Bonferroni correction). ANOVA also revealed a statistically significant interaction between time of day and sleep condition for THRA1 (pTHRA1 = 0.006, after Bonferroni correction). Furthermore, an overall increase in THRA1 expression levels during sleep deprivation, based on total sum of z scores (−27.36 during sleep vs. 22.88 during sleep deprivation), was observed. Not all of the tests of the nonlinear mixed model analysis could be performed for THRA1 because of the limitations of the algorithm regarding the starting values of the parameters. Thus, we could not compare the second and third nested models of the nonlinear mixed model method (see Materials and Methods) together. Because of this, the effect of condition on the gene expression could not be assessed. When only applying the second model, however, which assumes that condition does not influence the expression of THRA1, we obtained statistically significant acrophase and amplitude estimates during the S/SD study (Table 1). Single cosinor analysis showed that THRA1 expression was significantly rhythmic in 9 (82%) and 6 (55%) individuals during the sleep and sleep deprivation conditions, respectively (Table 2).
For SIRT1, ROCK2, and CAPRIN1, ANOVA revealed a statistically nonsignificant time-of-day variation in expression for all the time periods analyzed. The amplitude and peak estimates, as obtained with the nonlinear mixed model method, were statistically significant for the 3 genes (Table 1). The single cosinor method revealed that SIRT1 was significantly rhythmic in 5 (45%) and 2 (18%) individuals; CAPRIN1 was significantly rhythmic in 3 (25%) and 5 (42%) individuals during sleep and sleep deprivation, respectively; and ROCK2 was significantly rhythmic in 3 (25%) individuals during sleep and in 3 individuals (25%) during sleep deprivation (Table 2).
USF1 did not exhibit a significant time-of-day expression for any of the tested periods; the estimates obtained with the nonlinear mixed model method were also not significant (Table 1). Single cosinor analysis showed USF1 to be rhythmic in only 2 (17%) individuals during sleep and in none during sleep deprivation (Table 2).
Additionally, the amplitude and acrophase parameters were estimated by means of the nonlinear mixed model method for the clock genes PER1, PER3, BMAL1, and REV-ERBα, as well as a heat shock gene HSPA1B, for which the expression data were generated in our previous study (Ackermann et al., 2013) in the same S/SD study samples. The nonlinear mixed model method supported the cosinor model better than the nested null model for PER1, PER3, BMAL1, and HSPA1B during the S/SD study. The REV-ERBα results were incomplete (the same situation as with THRA1 occurred, where the second and third nested models of the nonlinear mixed model method could not be compared), and thus assuming no effect of condition on the data, the nonlinear mixed model method showed that the amplitude and peak estimates were statistically significant in the S/SD study data (Table 1).
Circadian Rhythms in Gene Expression Levels in the CR Study Samples
Averaged expression levels for 8 selected genes analyzed in the CR study are presented in Figure 2 and for all genes tested in Supplemental Figure S1. Individual expression profiles of all the genes analyzed in the CR study are presented in Supplemental Figure S3.
MKNK2 had a statistically significant circadian variation of expression (as shown with 1-way ANOVA; p < 0.004, after Bonferroni correction) but statistically not significant estimates for amplitude and acrophase, calculated with the nonlinear mixed model analysis (Table 3). The single cosinor method also showed that MKNK2 was significantly rhythmic in only 1 (8%) individual (Table 4).
Results of the Nonlinear Mixed Model Curve-Fitting Analysis for the Constant Routine Study Samples.
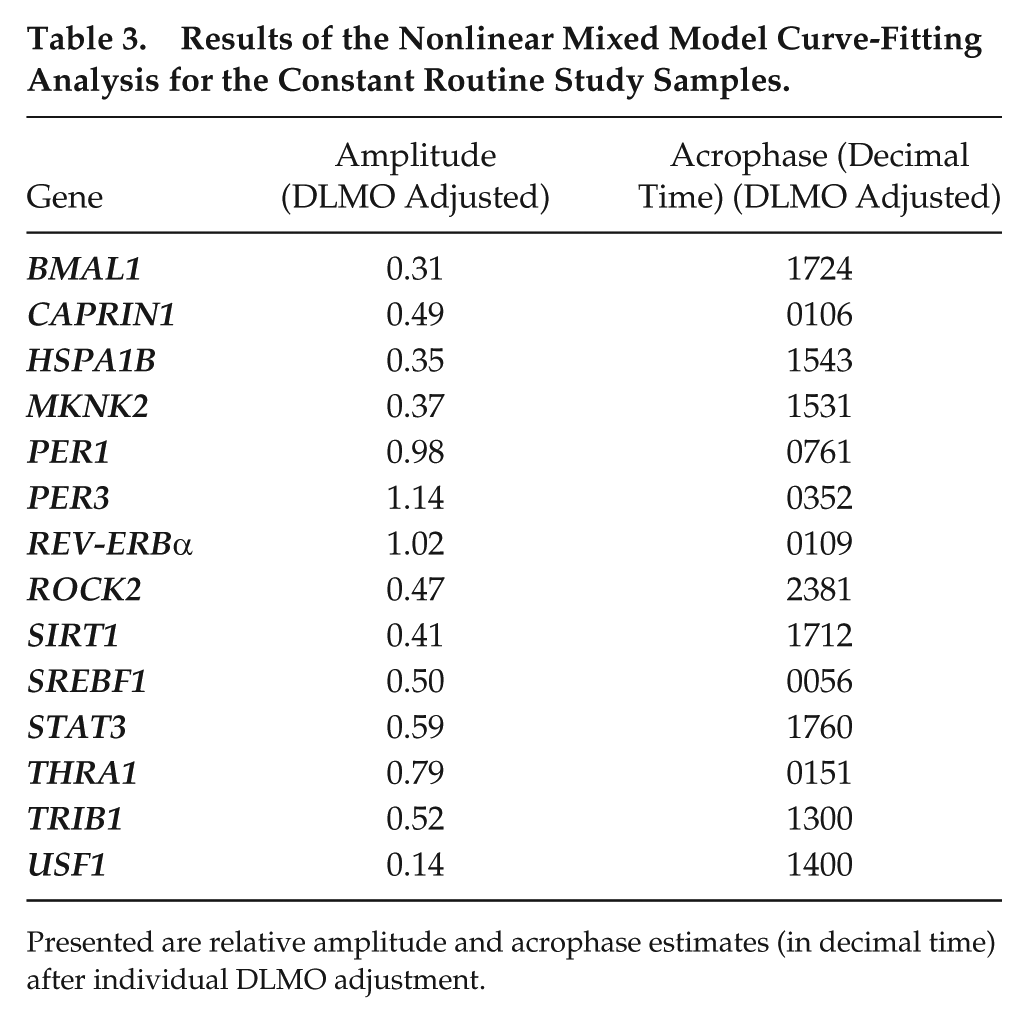
Presented are relative amplitude and acrophase estimates (in decimal time) after individual DLMO adjustment.
Results of the Single Cosinor Analysis for Genes Tested in the Constant Routine Study Samples.
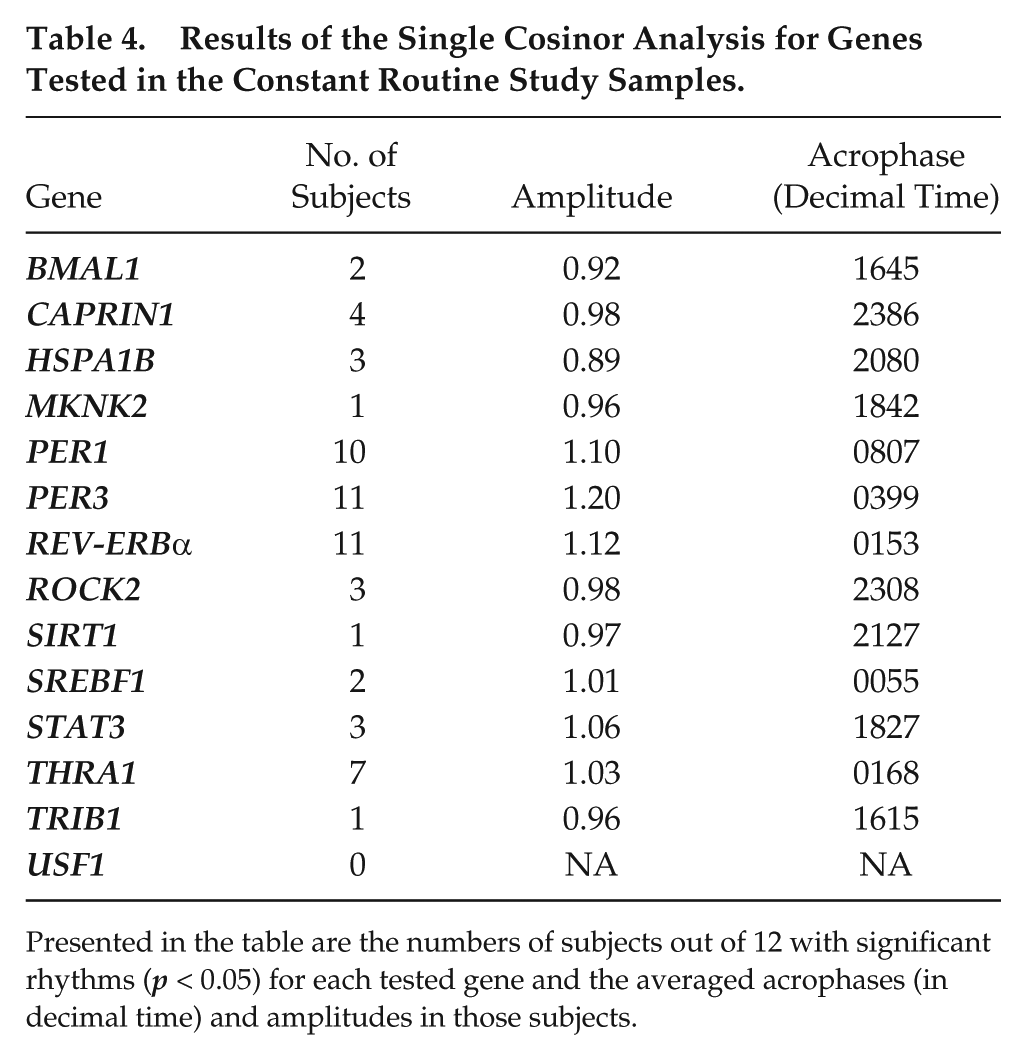
Presented in the table are the numbers of subjects out of 12 with significant rhythms (p < 0.05) for each tested gene and the averaged acrophases (in decimal time) and amplitudes in those subjects.
SREBF1 also had a statistically significant circadian variation of expression, as shown by the ANOVA; the nonlinear mixed model method showed that both amplitude and peak estimates of SREBF1 were significant (Table 3). However, with single cosinor analysis, only 2 individuals showed statistically significant SREBF1 expression (Table 4).
The genes STAT3, TRIB1, and THRA1 also showed significant circadian variation in expression by ANOVA. Both amplitude and acrophase estimates obtained with the nonlinear mixed model were also statistically significant (Table 3). However, single cosinor analysis showed that STAT3 expression was significant in 3 (25%) individuals and TRIB1 expression was significantly rhythmic in only 1 (8%) individual (Table 4). By contrast, expression of THRA1 was significantly rhythmic in 7 (58%) individuals (Table 4).
SIRT1 and ROCK2 had statistically nonsignificant circadian variation in expression (ANOVA) and nonsignificant acrophase and amplitude estimates (Table 3). Single cosinor analysis showed that SIRT1 was significantly rhythmic in only 1 (8%) individual, and ROCK2 was rhythmic in 3 (25%) individuals (Table 4).
Likewise, CAPRIN1 had no significant circadian variation in expression (ANOVA), but the nonlinear mixed model results revealed that the amplitude and acrophase estimates were statistically significant (Table 3). CAPRIN1 was significantly rhythmic in 4 (33%) individuals according to the single cosinor analysis (Table 4).
The results of ANOVA and nonlinear mixed model analyses (Table 3) for USF1 were all statistically nonsignificant, with no circadian variation in expression being observed. In addition, no significant rhythms in any of the study participants were detected with single cosinor analysis (Table 4).
The 4 clock genes BMAL1, PER1, PER3, and REV-ERBα and the heat shock protein gene HSPA1B, previously studied in the S/SD study samples (Ackermann et al., 2013), were also tested in the CR study samples. The ANOVA and nonlinear mixed model method results were statistically significant for the genes PER1, PER3, and REV-ERBα (Table 3). The expression of PER1, PER3, and REV-ERBα was significantly rhythmic in 10 (83%), 11 (92%), and 11 (92%) individuals, respectively, as shown by the single cosinor analysis (Table 4). In the CR study samples, the genes HSPA1B and BMAL1 had statistically significant time-of-day variation (ANOVA), but the nonlinear mixed model revealed that both estimates were not statistically significant (Table 3). In addition, HSPA1B expression was significantly rhythmic in only 3 (25%) individuals, while BMAL1 was significantly rhythmic in only 2 (17%) individuals (Table 4).
Discussion
The expression patterns of 9 candidate clock-controlled genes (SREBF1, TRIB1, USF1, THRA1, SIRT1, STAT3, CAPRIN1, MKNK2, and ROCK2) were determined in human Peripheral Blood Cells (PBCs) from blood samples collected during controlled S/SD and CR studies.
Overall, we found that at the group level, the clock-controlled genes SREBF1, STAT3, THRA1, and TRIB1 exhibited statistically significant circadian rhythms in expression in human PBCs under CR conditions; furthermore, results of the nonlinear mixed model method suggest that the expression and rhythmicity of these genes were unaffected by sleep deprivation (S/SD).
To our knowledge, this is the first study reporting expression patterns of TRIB1, USF1, THRA1, SIRT1, STAT3, CAPRIN1, MKNK2, and ROCK2 in human blood samples collected during 2 different laboratory protocols designed to distinguish daily from circadian rhythmicity. Of the candidate gene set investigated, only SREBF1 gene expression has been previously measured during sleep deprivation in a study by Arnardottir et al. (2014). This study, however, included participants who were behaviorally resistant and sensitive to sleep deprivation, which does not reflect the normal human situation studied here. Our nonlinear mixed model analysis revealed that on a group level, THRA1, TRIB1, MKNK2, SREBF1, and STAT3 exhibited significant daily rhythmicity during the S/SD study. Furthermore, the expression of SREBF1, STAT3, THRA1, and TRIB1 was also significantly rhythmic in the CR study. The S/SD study design included timed meals, light/dark, and wake/sleep conditions, and these exogenous factors likely influence the daily rhythmic expression of the above-mentioned genes. Results of the nonlinear mixed model analysis for MKNK2, STAT3, SREBF1, THRA1, and TRIB1 during the S/SD study imply that the sleep condition (i.e., sleep or sleep deprivation) does not influence the rhythmic expression of these genes to a large extent. However, there was a decrease in the number of subjects with significant rhythms during SD for THRA1, TRIB1, STAT3, and MKNK2 and an increase in the number of subjects with significant rhythms in SREBF1 expression during SD, as estimated by single cosinor analysis (Table 2). Therefore, even though at the group level, the nonlinear mixed model did not indicate any statistically significant influence of the condition on the expression of these genes, results from the single cosinor analysis suggest some effect of 24-h wakefulness and increased sleep pressure on the expression of these genes in individual subjects.
In a recent study, Arnardottir et al. (2014) found that on average, the expression of SREBF1 decreased during SD in subjects selected based on their behavioral resistance or sensitivity to sleep deprivation. We also observed that in healthy individuals of our S/SD study, the overall expression of SREBF1 decreased during the SD condition (total sum of z scores, 24.08 in S vs. –24.44 in SD). However, we also found an increase in the number of subjects with significant rhythms (Table 2) during sleep deprivation. In animal studies, it has been suggested that the SREBP1 protein can play a role in restricted feeding-induced phase shifting of the circadian clock (Zhang et al., 2009).
We have shown that THRA1 had a significant daily rhythm during the S/SD study (Tables 1 and 2). Literature reports regarding rhythmicity of the THRA1 transcript in mice or rats are conflicting (Zandieh Doulabi et al., 2004; Vollmers et al., 2012). In one study, the authors found that the transcript does not oscillate in the mouse liver (Vollmers et al., 2012), but in another study, THRA1 messenger RNA (mRNA) has been shown to be rhythmic in rat liver (Zandieh Doulabi et al., 2004). Moreover, the findings implied that the amplitude of THRA1 mRNA might be modified by restricted feeding.
The TRIB1 gene encodes a highly conserved pseudokinase protein that functions as an adaptor in signaling processes in the cell. Our findings on TRIB1 support the work of Ollila et al. (2012), who proposed TRIB1 as a link between sleep and lipid metabolism regulation in humans and suggested that sleep duration and lipid metabolism may in part be controlled by the same genes in humans. On an individual level, our data indicate that TRIB1 expression, exhibiting 24-h rhythmicity in the S/SD study, is likely dependent on the sleep/wake state, since the number of individuals with significant rhythms decreased by 25% during total sleep deprivation (Table 2), suggesting an effect of increasing sleep pressure on TRIB1 expression.
Previously, we reported changes in the expression of 4 clock genes PER1, PER3, BMAL1, and REV-ERBα and a heat shock gene HSPA1B during sleep and SD (Ackermann et al., 2013) by means of a nonlinear curve-fitting analysis. In the current study, we reanalyzed the expression data of the aforementioned genes by means of a nonlinear mixed model analysis, which, in addition to nonlinearity, models the random effects of repeated measures from different individuals. This analysis has shown that, on a group level, there was no statistically significant effect of condition on these genes. However, a decrease in the number of subjects with significant rhythmicity during the SD condition (Ackermann et al., 2013) was found with a single cosinor for PER1, PER3, BMAL1, REV-ERBα, and HSPA1B. A similar effect of SD was recently demonstrated for the human metabolome in the same S/SD study, with less rhythmic metabolites observed during 24 h of wakefulness (Davies et al., 2014).
We have found that PER1, PER3, and REV-ERBα genes were rhythmic in CR conditions, consistent with the results from previously reported studies (Takata et al., 2002; Archer et al., 2008), thus confirming their status as core clock genes in PBCs. The results obtained for BMAL1, however, were not so straightforward. In the S/SD study, BMAL1 expression was not influenced by the sleep condition (Table 1), but single cosinor analysis showed a 30% decrease in number of subjects with significant rhythms during the sleep condition (Ackermann et al., 2013). However, during the CR study, only 2 of the 12 subjects had significant circadian rhythms in BMAL1 expression. Amplitude and acrophase estimates for BMAL1, calculated using the nonlinear mixed model, were not statistically significant in CR, although both estimates were rhythmic in S/SD. James et al. (2007) reported large interindividual variability in BMAL1 expression in PBMCs during CR conditions. Other reports (Teboul et al., 2005; Kusanagi et al., 2008) also noted much larger interindividual variation in the expression of BMAL1 during CR conditions compared to other clock genes. These results are in agreement with the data obtained for BMAL1 in our CR study, where only 17% of subjects displayed significant circadian rhythmicity. Further studies are needed to better understand the time-wise expression changes of BMAL1 and its large interindividual variation. For the HSPA1B gene, a statistically significant effect of time of day on gene expression was found with ANOVA, and statistically significant rhythms were detected in 3 individuals (single cosinor analysis) during the CR study.
Despite the strengths of the CR protocol to minimize the exogenous factors that may confound assessment of circadian phase, our CR study is not without caveats. The group of individuals participating in the CR study comprised equal numbers of young males (n = 6) and females (n = 6). Thus, the differences between individuals observed might be due to sex differences and the fact that the female participants were required to take combination oral contraceptive pills to minimize any possible variations in response due to different phases of the menstrual cycle. The overall small sample size of the analyzed group did not allow statistical testing of the effect of sex on gene expression to be performed but should be investigated in future studies. One possible explanation for the observed discrepancies between the single cosinor and the nonlinear mixed models is the lack of statistical power of the nonlinear mixed model for detecting S/SD differences. In particular, the nonlinear mixed model can be considered overparameterized given that it considered 5 parameters, which were estimated from repeated measures on only 12 individuals.
Many of the PBCs are known to be involved in immunity, and some of the genes we analyzed have also been implied to play a direct or indirect role in various immune processes. TRIB1, which functions as an adaptor in signaling pathways in the cells, has been identified as a myeloid oncogene and implied in human leukemia as well as in nonneoplastic disorders (Yokoyama and Nakamura, 2011; Yokoyama et al., 2010). Inhibition of ROCK2 causes a decrease in the ability of T cells to secrete proinflammatory cytokines interleukin (IL)–17 and IL-21, thus implicating a role for ROCK2 in their regulation (Zanin-Zhorov et al., 2014). We observed an increase in ROCK2 expression during sleep deprivation (total sum of z scores, –21.7 in S vs. 19.58 in SD), which might cause an increase in proinflammatory cytokine secretion promoting systemic inflammation. SREBF1 gene encodes a protein (SREBP1c) that regulates genes required for glucose metabolism and fatty acid and lipid production (Bozek et al., 2009). Thus, regulation of intracellular lipid metabolism is critical for proper lymphocyte growth and function. Furthermore, SREBF1 has been demonstrated to play an important role in acquisition of specific metabolic programs by T lymphocytes, required for their clonal expansion, which is necessary for effective adaptive immunity (Kidani et al., 2013). In our study, the observed decrease in SREBF1 during sleep deprivation (total sum of z scores, 24.08 in S vs. –24.44 in SD) suggests a suppression of the gene’s expression during SD, which might be related to a decrease in T-lymphocyte expansion and compromised adaptive immunity responses. More detailed studies, incorporating cytokine and cell measurements, however, are needed to determine the actual involvement of the mentioned genes in immune responses during sleep deprivation.
Few studies have investigated the effect of total sleep deprivation on gene expression in humans (Cirelli et al., 2004; James et al., 2007; Ackermann et al., 2013; Möller-Levet et al., 2013; Arnardottir et al., 2014). Direct comparisons between the studies are very difficult because of the differences in the SD protocols. For example, timing or composition of meals can influence the expression of metabolism-related genes, as meal composition and timing influence gene expression (Leonardson et al., 2010) and entrain the peripheral clocks, leading to phase shifts and even to uncoupling between the central and peripheral oscillators in mammals (Kräuchi et al., 2002; Hirao et al., 2010; Schoeller et al., 1997). Other differences include study participant selection criteria, as for example in the Arnardottir et al. (2014) study, where participants were selected on the basis of their resistance to sleep deprivation from a preselected group of twin-pairs, as well as the applied methodology (i.e., microarrays or transcriptome sequencing) (James et al., 2007; Möller-Levet et al., 2013).
In summary, we have been able to characterize and differentiate both the daily and circadian rhythms of a number of genes related to circadian timing, sleep, and metabolism in human PBCs and assess changes in their expression and rhythmicity during sleep, sleep deprivation, and constant routine conditions. Our data provide valuable high-resolution baseline information about clock-controlled genes, including their daily and circadian expression patterns in human blood cells and the effect of sleep status on their rhythmic expression. Our results will be beneficial for future research on the molecular mechanisms linking circadian timing and sleep/wake processing, as well as in future studies investigating clock and clock-controlled genes as potential candidate marker genes for medical and forensic applications.
Footnotes
Acknowledgements
The authors thank Daniel Barrett, Sarah Davies, and the Surrey CRC medical and clinical research teams for their help conducting the sleep and circadian laboratory studies and in sample collection; Cheryl Isherwood for help in designing the study meals; and Benita Middleton and Stockgrand Ltd for the melatonin analysis. This study was supported in part by the Netherlands Organization for Scientific Research (NWO) Forensic Science Program Grant 27.011.001, the European Union 6th Framework project EUCLOCK (018741), the UK Biotechnology and Biological Sciences Research Council (BBSRC) grant BB/I019405/1, and Erasmus MC University Medical Center Rotterdam. D.J.S. is a Royal Society Wolfson Research Merit Award holder.
Conflict of Interest Statement
The author(s) have no potential conflicts of interest with respect to the research, authorship, and/or publication of this article.
Notes
References
Supplementary Material
Please find the following supplemental material available below.
For Open Access articles published under a Creative Commons License, all supplemental material carries the same license as the article it is associated with.
For non-Open Access articles published, all supplemental material carries a non-exclusive license, and permission requests for re-use of supplemental material or any part of supplemental material shall be sent directly to the copyright owner as specified in the copyright notice associated with the article.