
Abstract
The intrinsic skeletal muscle core clock has emerged as a key feature of metabolic control and influences several aspects of muscle physiology. Acute alcohol intoxication disrupts the core molecular clock, but whether chronic consumption, like that leading to alcoholic myopathy, is also a zeitgeber for skeletal muscle remains unknown. The purpose of this work was to determine whether chronic alcohol consumption dysregulates the skeletal muscle core molecular clock and clock-controlled genes (CCGs). C57BL/6Hsd female mice (14 weeks old) were fed a control (CON) or alcohol (EtOH) containing liquid diet for 6 weeks. Gastrocnemius muscles and serum were collected from CON and EtOH mice every 4-h for 24-h. Chronic alcohol consumption disrupted genes of the core clock including suppressing the rhythmic peak of expression of Bmal1, Per1, Per2, and Cry2. Genes involved in the regulation of Bmal1 also exhibited lower rhythmic peaks including Reverb α and Myod1. The CCGs, Dbp, Lpl, Hk2, and Hadh were also suppressed by alcohol. The nuclear expression patterns of MYOD1, DBP, and REVERBα were shifted by alcohol, while no change in BMAL1 was detected. Overall, these data indicate that alcohol disrupted the skeletal muscle core clock but whether these changes in the core clock are causative or a consequence of alcoholic myopathy requires future mechanistic confirmation.
In the United States, excessive alcohol consumption is common and contributes to numerous health issues as well as deaths each year (Esser et al., 2014). Although alcohol impacts various tissues, skeletal muscle is of particular importance because skeletal muscle comprises 40% of the total body mass and 50% to 75% of total body protein stores, and is central to overall health due to its role in metabolic homeostasis (i.e. insulin signaling/glucose disposal; amino acid storage/release) as well as physical function (Frontera and Ochala, 2015). Skeletal muscle is sensitive to both acute and chronic alcohol consumption, and alcoholic myopathy, or alcohol muscle disease characterized by muscle weakness, cramping, altered gait, and atrophy, is present in up to 50% of chronic alcoholic patients (Preedy et al., 2001). Molecular perturbations that lead to alcoholic myopathy include an imbalance in rates of protein synthesis and degradation and associated molecular markers, as well as oxidative stress and mitochondrial dysfunction, impaired regenerative capacity, and anabolic resistance (Steiner and Lang, 2015; Kumar et al., 2019). Use of techniques like proteomics, metabolomics, and RNA deep sequencing has revealed that alcohol use alters the expression of a large number of genes, proteins, and metabolites in skeletal muscle, indicating that alcohol disrupts a multitude of factors and signaling pathways, many of which remain to be defined and characterized (Singh et al., 2021).
The core molecular clock is a transcription/translation feedback system comprised of positive and negative arms that regulate diurnal expression patterns of over 2,300 genes (Pizarro et al., 2013). The positive arm of the clock is comprised of the basic helix-loop-helix (bHLH) transcription factors Brain muscle arnt like-1 (BMAL1) and Circadian locomotor output cycles kaput (CLOCK), which dimerize and bind to the E-box regions of target genes to regulate expression of clock-controlled genes (CCGs). The negative arm of the clock is comprised of the Periods (PER1-3) and Cryptochromes (CRY1-2) (Gekakis et al., 1998; Yoo et al., 2005; Ohno et al., 2007; Hogenesch et al., 1998; Kume et al., 1999). The PER and CRY proteins dimerize to inhibit CLOCK:BMAL1 transcriptional activity, thereby forming the negative arm of the clock (Kume et al., 1999; Griffin et al., 1999; Sangoram et al., 1998; Sato et al., 2006). The transcriptional activity of the BMAL1:CLOCK dimer can also be influenced by a number of factors including the expression of certain transcriptional targets of the BMAL1:CLOCK dimer. For instance, RORE binding elements RAR related orphan receptor (Rorα) and nuclear receptor subfamily 1 group D member 1 (Nr1d1 or Reverbα), as well as myogenic differentiation 1 (Myod1) are not only transcribed by the BMAL1:CLOCK dimer, but their protein products can feed back to positively (i.e. RORα and MYOD1) or negatively (i.e. REVERBα) influence the transcriptional activity of the BMAL1:CLOCK dimer. Alternatively, post-translational modifications (acetylation, phosphorylation, etc.) and adrenal stress hormones such as glucocorticoids can also influence the muscle clock. For example, SIRT1-mediated deacetylation can influence CLOCK:BMAL1 heterodimer binding, while treatment with dexamethasone synchronizes the core molecular clock of skeletal muscle (Nakahata et al., 2008; Kemler et al., 2020). Genetic disruptions to core clock components in mice disrupt circadian rhythms and result in differential gene expression, including alterations to several metabolic genes (Hodge et al., 2015; Dyar et al., 2014). Transgenic core clock mutation models have exemplified the central role of the skeletal muscle core clock in the maintenance of muscle function and structure as alterations in specific tension, grip strength, thick and thin filament organization, fiber-type distribution and cross-sectional area, mitochondria volume and function, and metabolic gene expression have been reported (Hodge et al., 2015; Schroder et al., 2015; Dyar et al., 2014; Andrews et al., 2010). Therefore, proper core clock functioning is central to maintaining skeletal muscle health.
We previously showed that an acute alcohol binge leads to disruption of core clock components and CCGs for at least 48 hours post binge in the skeletal muscle (Tice et al., 2021). The binge style of drinking may not be like that which occurs in alcoholics as it does not account for the cumulative effects of prolonged drinking nor the more moderate intake over the course of the day. These different characteristics of alcohol consumption may therefore have divergent effects on the molecular pathways altered in the skeletal muscle, including the core molecular clock. For instance, acute alcohol intoxication and chronic exposure cause differential changes to the core molecular clock in the liver (Gaucher et al., 2019). Therefore, the goal of this work was to determine whether chronic alcohol consumption disrupts the core molecular clock in the skeletal muscle.
Methods and Materials
Animals
Female C57BL/6Hsd mice (14 weeks old) were purchased from Envigo (Indianapolis, IN) and housed individually in the Biomedical Research Facility vivarium at Florida State University (Tallahassee, FL) for at least 2 weeks prior to the start of the experiment. Mice were housed on a 12:12 light-dark cycle in a temperature-controlled (25°C) environment with ad libitum access to food and water. Female mice were chosen for experimentation as females have an increased propensity to develop chronic alcohol related injuries at lower cumulative doses of alcohol (Urbano-Marquez et al., 1995; Shenkman et al., 2016; DeGroat et al., 2018) and because the acute circadian studies had been performed in females allowing for comparisons to be made (Tice et al., 2021). This substrain of C57BL/6 mice was used to match our acute alcohol circadian experiments and we are not aware of any differences across substrain in skeletal muscle circadian response to alcohol to validate use of one substrain over another.
Experimental Design
Mice were randomized into two groups of equal body weight. All mice were acclimated to an alcohol-free Lieber DeCarli liquid diet (#710260, Dyets, Bethlehem, PA) for 2 days prior to beginning the experiment. Mice randomized to the alcohol group had alcohol added to the Lieber DeCarli liquid diet using the following schedule: 2 days of 6% kcal ethanol, 2 days of 12% kcal ethanol, 7 days of 22% kcal ethanol, 7 days of 27% kcal ethanol, and 25 days of 32% kcal ethanol (Figure 1a). Mice randomized to the control diet consumed the Lieber DeCarli liquid diet with maltose dextrin used to replace calories from alcohol so that diets were isocaloric by volume. Diets were replaced at the start of the dark cycle each day. At the end of the alcohol treatment period and starting at the beginning of the dark cycle, a subset of mice from the control and alcohol groups (n = 3/4 per treatment) were euthanized every 4 h for 24 h to complete a 24 h diurnal cycle as described previously (Tice et al., 2021). During this 24-h period, mice continued to have ab libitum access to the liquid diet which was freshly added at the start of the dark cycle. The euthanasia room was maintained on the same 12:12 light-dark cycle as the housing room, and dark cycle tissue collections were done under red light. Mice euthanized during the dark hours were transported from the housing room to the euthanasia space in their home cages placed into a light proof container. Gastrocnemius (GAS) muscle tissues were collected, immediately frozen in liquid nitrogen, and stored at -80°C. Blood was collected in untreated tubes and allowed to clot for 15 min prior to centrifugation at 2000 g for 10 min for isolation of serum. Plasma was isolated by collecting blood into ethylenediaminetetraacetic acid (EDTA)-treated tubes, which were stored on ice until centrifugation at 10,000 g for 10 min.
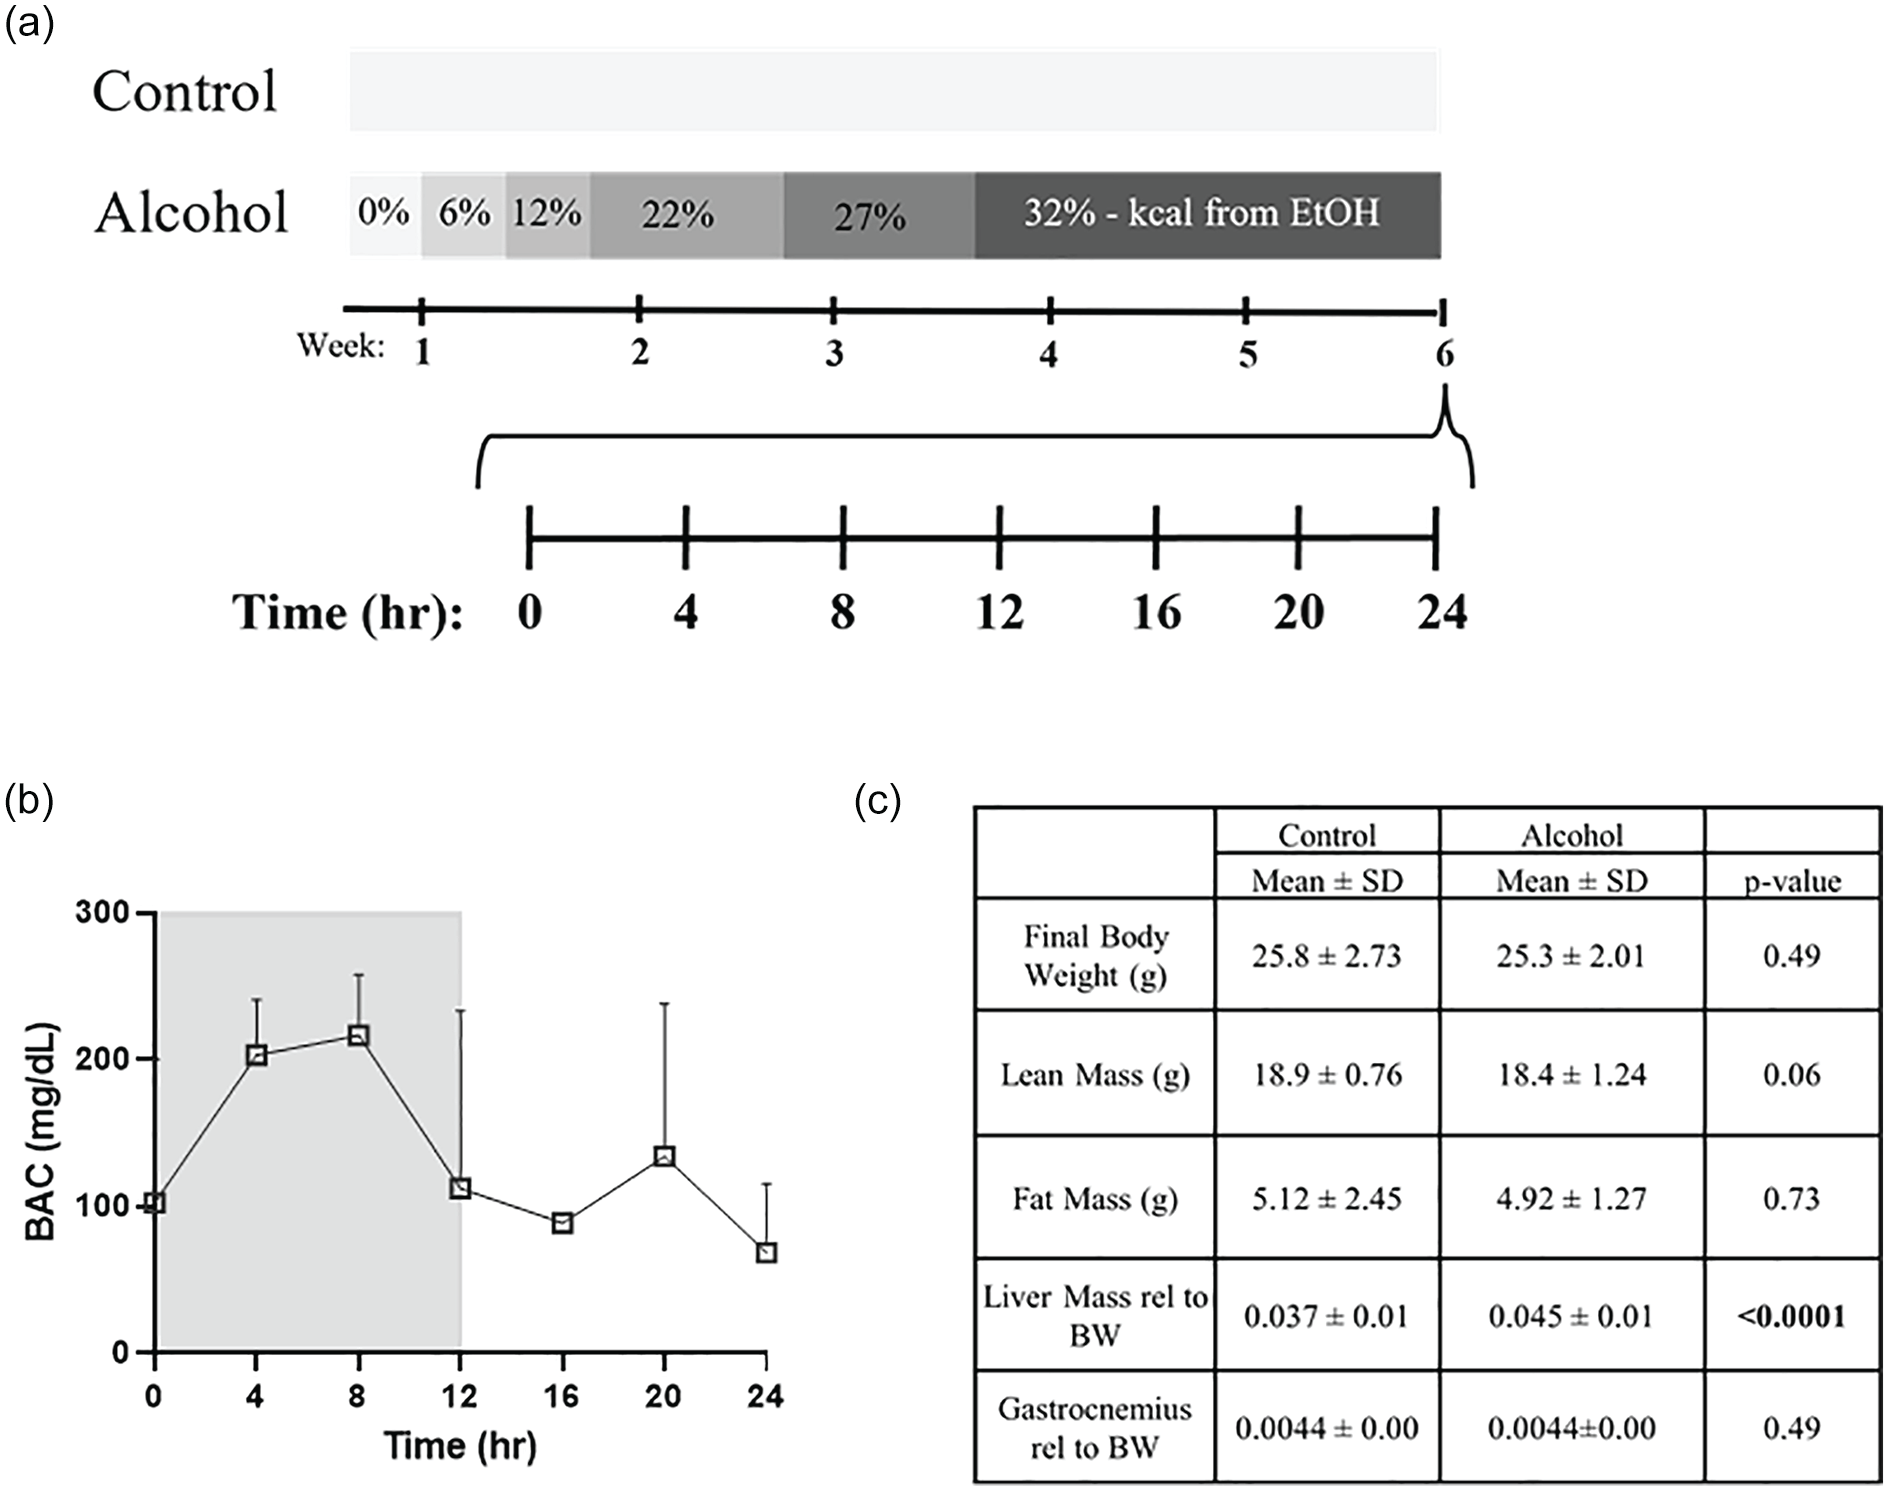
Experimental design and descriptive characteristics of chronic alcohol use. Alcohol was gradually increased in the liquid diet until 32% kcals from ethanol was reached. Alcohol diet was continued for 6 weeks, and muscle and blood samples were collected every 4 h for 24 h from control (CON, n = 3-4 per timepoint) and alcohol (EtOH, n = 3-4 per timepoint) mice on the last day of the diet (a). BAC (b) in mg/dl was measured in EtOH mice collected at each timepoint on day of tissue collection. Descriptive characteristics including body weight, lean mass, fat mass, liver mass, and gastrocnemius mass are displayed in (c). T-tests were performed between control and alcohol mice for these measures. Abbreviations: BAC = Blood alcohol concentration; BW = Body Weight.
Body Composition Measures
Body composition, including lean mass, fat mass, free water, and total water was measured using the EchoMRI (Houston, TX) before alcohol was introduced in the liquid diet and 2 days prior to euthanasia.
RNA Extraction, cDNA Synthesis, and RT-PCR
Protocol for RNA extraction, cDNA synthesis, and RT-PCR of gastrocnemius muscle tissue were performed as previously described (Tice et al., 2021). All primer sequences used with Powerup SYBR-green master mix (Cat. #A25776; Applied Biosystems, Foster City, CA) are listed in Supplementary Table 1. Measurement of Thyrotrophic Embryonic Factor (Tef) (assay ID Mm00457513), Basic Helix-Loop-Helix-Family Member E40 (Bhlhe40) (assay ID Mm00478593), and Hexokinase 2 (Hk2) (assay ID Mm00443385) were quantified using TaqMan predesigned primer probes (Applied Biosystems) and TaqMan fast advanced master mix (Cat. #4444557; Applied Biosystems, Foster City, CA). RT-PCR results were analyzed using the delta, delta CT method and referenced to the tata-binding protein gene (Tbp) gene, which did not significantly change with treatment or time.
Western Blotting and Analysis
Western blotting was performed as previously described (Steiner et al., 2017). Powdered GAS (~40 mg) was homogenized using a glass-on-glass homogenization in 10 volumes of buffer (10 µl/mg of muscle) consisting of 50 mM 4-(2-hydroxyethyl)-1-piperazineethanesulfonic acid (HEPES) (pH 7.4), 0.1% Triton-X 100, 4 mM egtazic acid (EGTA), 10 mM EDTA, 15 mM Na4P2O7, 100 mM β-glycerophosphate, 25 mM NaF, 5 mM Na3VO4, and 10 µl/ml protease inhibitor cocktail (Cat. # P8340, Sigma-Aldrich, St. Louis. MO). Muscle extracts were centrifuged for 10 min at 10,000 g at 4 °C, and the supernatant fraction was quantified via the Bradford method (Cat. #5000006, Bio-Rad, Hercules CA). All samples were diluted to the same concentration in 2X sample buffer. For each time point, an equal amount of protein and volume from each sample within a group (control or alcohol) was pooled together to generate overall circadian expression patterns within that group at each time point as previously described for large data sets (Jacobi et al., 2015; Rossetti et al., 2019). Proteins were fractionated on 4%–20% Bio-Rad Criterion precast gels (Hercules, CA) and transferred to PVDF membranes. Ponceau-S staining was used to assess effective transfer and equal protein loading. Membranes were blocked (1 h) with 5% nonfat dried milk in Tris-buffered saline + 0.1% Tween20 (Tris-buffered saline-Tween 20). Membranes were then incubated overnight at 4 °C with primary antibody. Antibodies against BMAL1 Ser42 (#13936), REVERBα (#13418), HISTONE H2B (#8135), GSK3β Ser9 (#5558), GSK3β (#12456), and SIRT1 (#2028) were obtained from Cell Signaling Technology (Danvers, MA). Antibodies against GAPDH (cat. # sc-32233) and MYOD1 (cat. # sc-71629) were purchased from Santa Cruz Biotechnology (Dallas, TX). Antibodies against BMAL1 (SAB4300614) were purchased from Sigma Aldrich (St. Louis, MO). DBP (cat #PM079) was from Medical & Biological Laboratories (Japan). After incubation with the appropriate secondary antibody at 1:10,000 (Cat. # A120–101 and Cat. # A90-116 P; Bethyl Laboratories; Montgomery, TX) the antigen-antibody complex was visualized by enhanced chemiluminescence using Clarity reagent (Bio-Rad, Hercules CA) on a Bio-Rad ChemiDoc Touch imaging system. Image J software (National Institutes of Health, Bethesda, MD) was used to quantify all images, including Ponceau-S stain.
Nuclear-Cytosolic Fractionation
Powdered GAS samples (~25 mg) were homogenized in 10 volumes (10 ul/mg of tissue) of glycerol buffer comprised of 5M NaCl, 500mM MgCl2, 500mM HEPES, 20% glycerol, 0.1% Triton-X 100, 1 mM DTT, and protease inhibitor cocktail using the glass-on-glass technique. Homogenates were then centrifuged at 2,400 g for 15 min at 4°C. Supernatants were collected as the cytosolic fraction, and 400µL of glycerol buffer was added to the nuclear fraction. The supernatant was then centrifuged at 3,500 g for 5 min at 4 °C and recollected. This “cleaning” process was repeated 3 times, and the final supernatant was collected as the cytosolic enriched fraction. The pellet generated from the original centrifuged homogenate was resuspended in 400 µL of glycerol buffer and then centrifuged at 2,400 g for 5 min at 4 °C. This “cleaning” process was repeated 3 times, and the final pellet was homogenized in 200 µL of HEPES buffer (described above in Western Blotting) via the glass-on-glass technique. After centrifuging the homogenate at 10,000 g for 10 min at 4 °C, the supernatant was collected as the nuclear fraction. As described above, the Bradford method (Cat. #5000006, Bio-Rad, Hercules, CA) was used to quantify the fractions, and all samples were diluted to the same concentration in 2X sample buffer. For each time point, an equal amount of protein and volume from each sample within a group (CON, or ETOH) was pooled together to determine the overall circadian expression patterns within that group at each time point as this requires all samples be run on a single gel at the same time. However, individual samples were also run across multiple gels to verify patterns and those data are included as supplementary figures.
Blood Alcohol Concentration (BAC)
The BAC was measured in plasma using the Analox System (AM-1) (Stourbridge, UK) as previously described (Tice et al., 2021).
Blood Glucose and Plasma Ketones
Blood glucose and plasma ketones were measured using the Precision Xtra Blood Glucose & Ketone Monitoring System (Abbott Laboratories, Chicago, IL).
Serum Corticosterone Concentration
Corticosterone concentration was measured in serum samples via enzyme linked immunosorbent assay (ELISA) as per the manufacturer’s instructions (Product #501320; Cayman Chemical, Ann Arbor, MI).
Statistics
Statistics for clock-gene expression were performed as previously described using GraphPad Prism (San Diego, CA) (Tice et al., 2021). Briefly, a one-way analysis of variance (ANOVA) for time was performed to determine change over time, with a significant p-value (p < 0.05) indicating that gene expression was not equivalent across time points. Cosinor analyses was then performed to determine oscillation and related parameters (MESOR, Amplitude, and Acrophase), along with whether there were differences in rhythms between treatment groups. Finally, unpaired t-tests using the group averages, standard errors and sample sizes obtained following analysis of all individual data points using the cosinor equation Y = MESOR + Amplitude x cos(Frequency x X + Acrophase), were performed for MESOR, Amplitude, and Acrophase to compare differences between control and alcohol for each of these parameters. This allowed for standard error to be accounted for. A two-way ANOVA (Time, EtOH) was also performed with Bonferroni post hoc comparisons to determine differences between treatment groups at each time-point over the 24 h collection period for all genes presented (p ≤ 0.05). For MRI data and muscle mass data, unpaired t-tests were employed to determine group differences. Food consumed, serum corticosterone, blood glucose and ketones, and BAC were analyzed using a two-way ANOVA (Time, EtOH) with Bonferroni post hoc testing for comparisons between control and alcohol treated groups.
Results
Descriptive Characteristics and the Effects of Chronic Alcohol Intoxication on Body Composition
Throughout the 6-week treatment period, overall food intake was similar across groups; however, mice given alcohol consumed slightly less than control while adjusting to the higher concentration of alcohol during the ramp up procedure (Suppl. Fig. 1A). BAC in alcohol consuming mice was elevated across the diurnal cycle (Figure 1b). Plasma glucose and β-hydroxybutyrate were not different between groups at select experimental time points (Suppl. Fig. 1B and 1C). At experimental end point, control and alcohol groups had similar body weights (p = 0.49), as well as fat mass (p = 0.73) (Figure 1c). Lean mass tended to be reduced in alcohol-fed mice (p = 0.06), although no significant differences in gastrocnemius weight were detected (Figure 1c). Liver weight was significantly increased following alcohol feeding (p = 0.0001) (Figure 1c).
Chronic Alcohol Ingestion Disrupts the Diurnal Gene Expression Patterns of Core Clock Genes and Clock-Controlled Genes
Using one-way ANOVA, the mRNA expression pattern of each of the core clock genes was deemed to change over time except for Cry1 (Figure 2a). Cosinor analysis indicated that long-term alcohol consumption changed the rhythmic expression of Bmal1, Per1, Per2, and Cry2, while a main effect of alcohol, as determined by two-way ANOVA, was not observed for Clock and Per3 mRNA expression (Figure 2a-2 h). Furthermore, chronic alcohol consumption decreased the average baseline of expression (MESOR) of Bmal1, Per1, Per2, and Cry 2 (Figure 2b and 2e-2 g and Supplementary Table 2). Long-term alcohol also suppressed the amplitude, or the absolute value of the distance from the midline to the peak or trough, of Bmal1, Per1, and Per2 (Figure 2b, 2f, and 2 g and Supplementary Table 2). Despite these changes to baseline expression and amplitude, only Per1 and Cry2 showed a shift in the time of peak expression (Acrophase) following long-term alcohol consumption (Figure 2e and 2f and Supplementary Table 2).
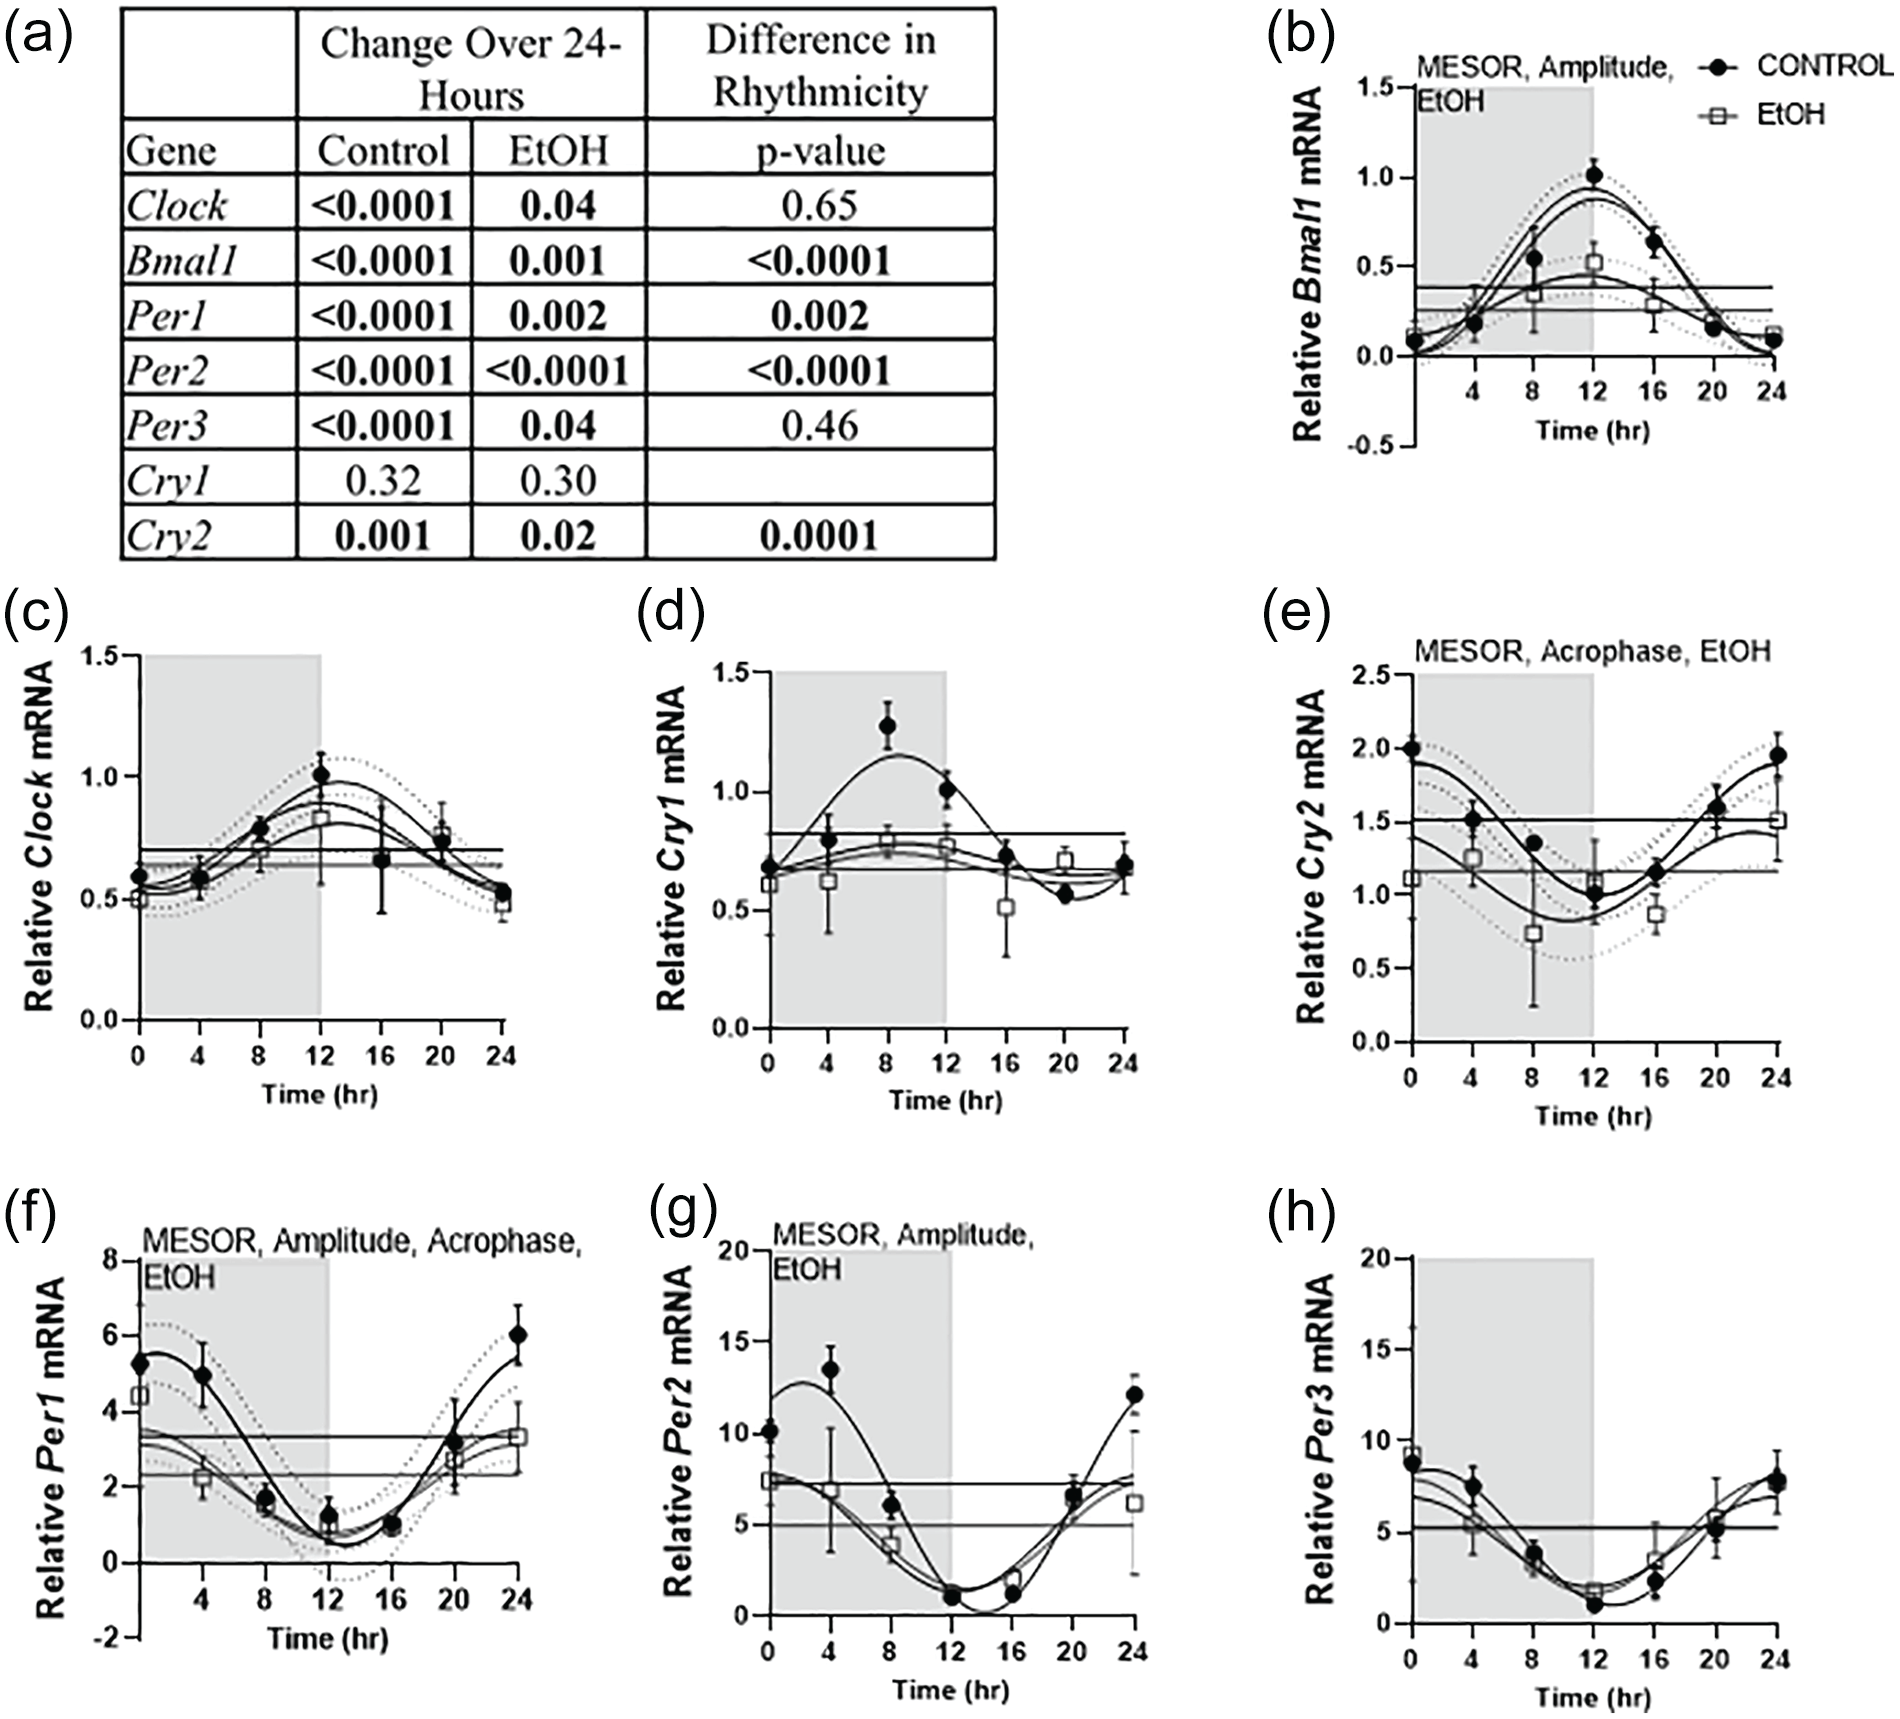
Changes over the 24 h cycle were assessed via one-way ANOVA for time within each treatment, while alterations in rhythmicity induced by alcohol (p < 0.05) were assessed using Cosinor analysis and are shown in the Difference in Rhythmicity column (a). If changes over 24-h were not significant, differences in rhythmicity were not reported. Effects of alcohol on skeletal muscle core clock gene expression, including Bmal1 (b), Clock (c), Cry1 (d), Cry2 (e), Per1 (f), Per2 (g), and Per3 (h), are presented. Black circles represent control (n = 4) and open gray squares represent EtOH (n = 3-4). The white box indicates the light cycle, while the gray box indicates the dark cycle. Data are presented as mean ± SD for each time point. Cosinor analysis was performed to determine circadian differences with alcohol, and Two-way ANOVA (Time, EtOH) was performed to investigate main effects and interactions, where p ≤ 0.05. Dashed lines indicate the 95% confidence interval. Main effect of alcohol is displayed as EtOH on the graph and differences between control and alcohol in MESOR, amplitude and acrophase (p < 0.05) is also indicated on the corresponding graph by writing the corresponding word on the top of the graph in which a change was detected.
Alcohol did not significantly alter serum corticosterone concentrations over the diurnal cycle (Figure 3a). Myod1, Dbp, Reverbα, and Bhlhe40 changed significantly over time in control and alcohol treated skeletal muscle, while no change over time was observed for Tef regardless of treatment (Figure 3b). Rorα trended to change over time in both control and alcohol treated skeletal muscle (p = 0.06) (Figure 3b). Alcohol induced disruption in rhythmicity compared to control was observed for Myod1 and Dbp and trended closely for Reverbα (p = 0.07) (Figure 3b). Alcohol decreased the baseline of expression (MESOR), of Dbp and Myod1, as well as decreased the distance from the midline to the peak or trough (amplitude) of these genes and Reverbα (Supplementary Table 2 and Figure 3e and 3f). Alcohol also increased Acrophase in Reverbα (Supplementary Table 2 and Figure 3d)
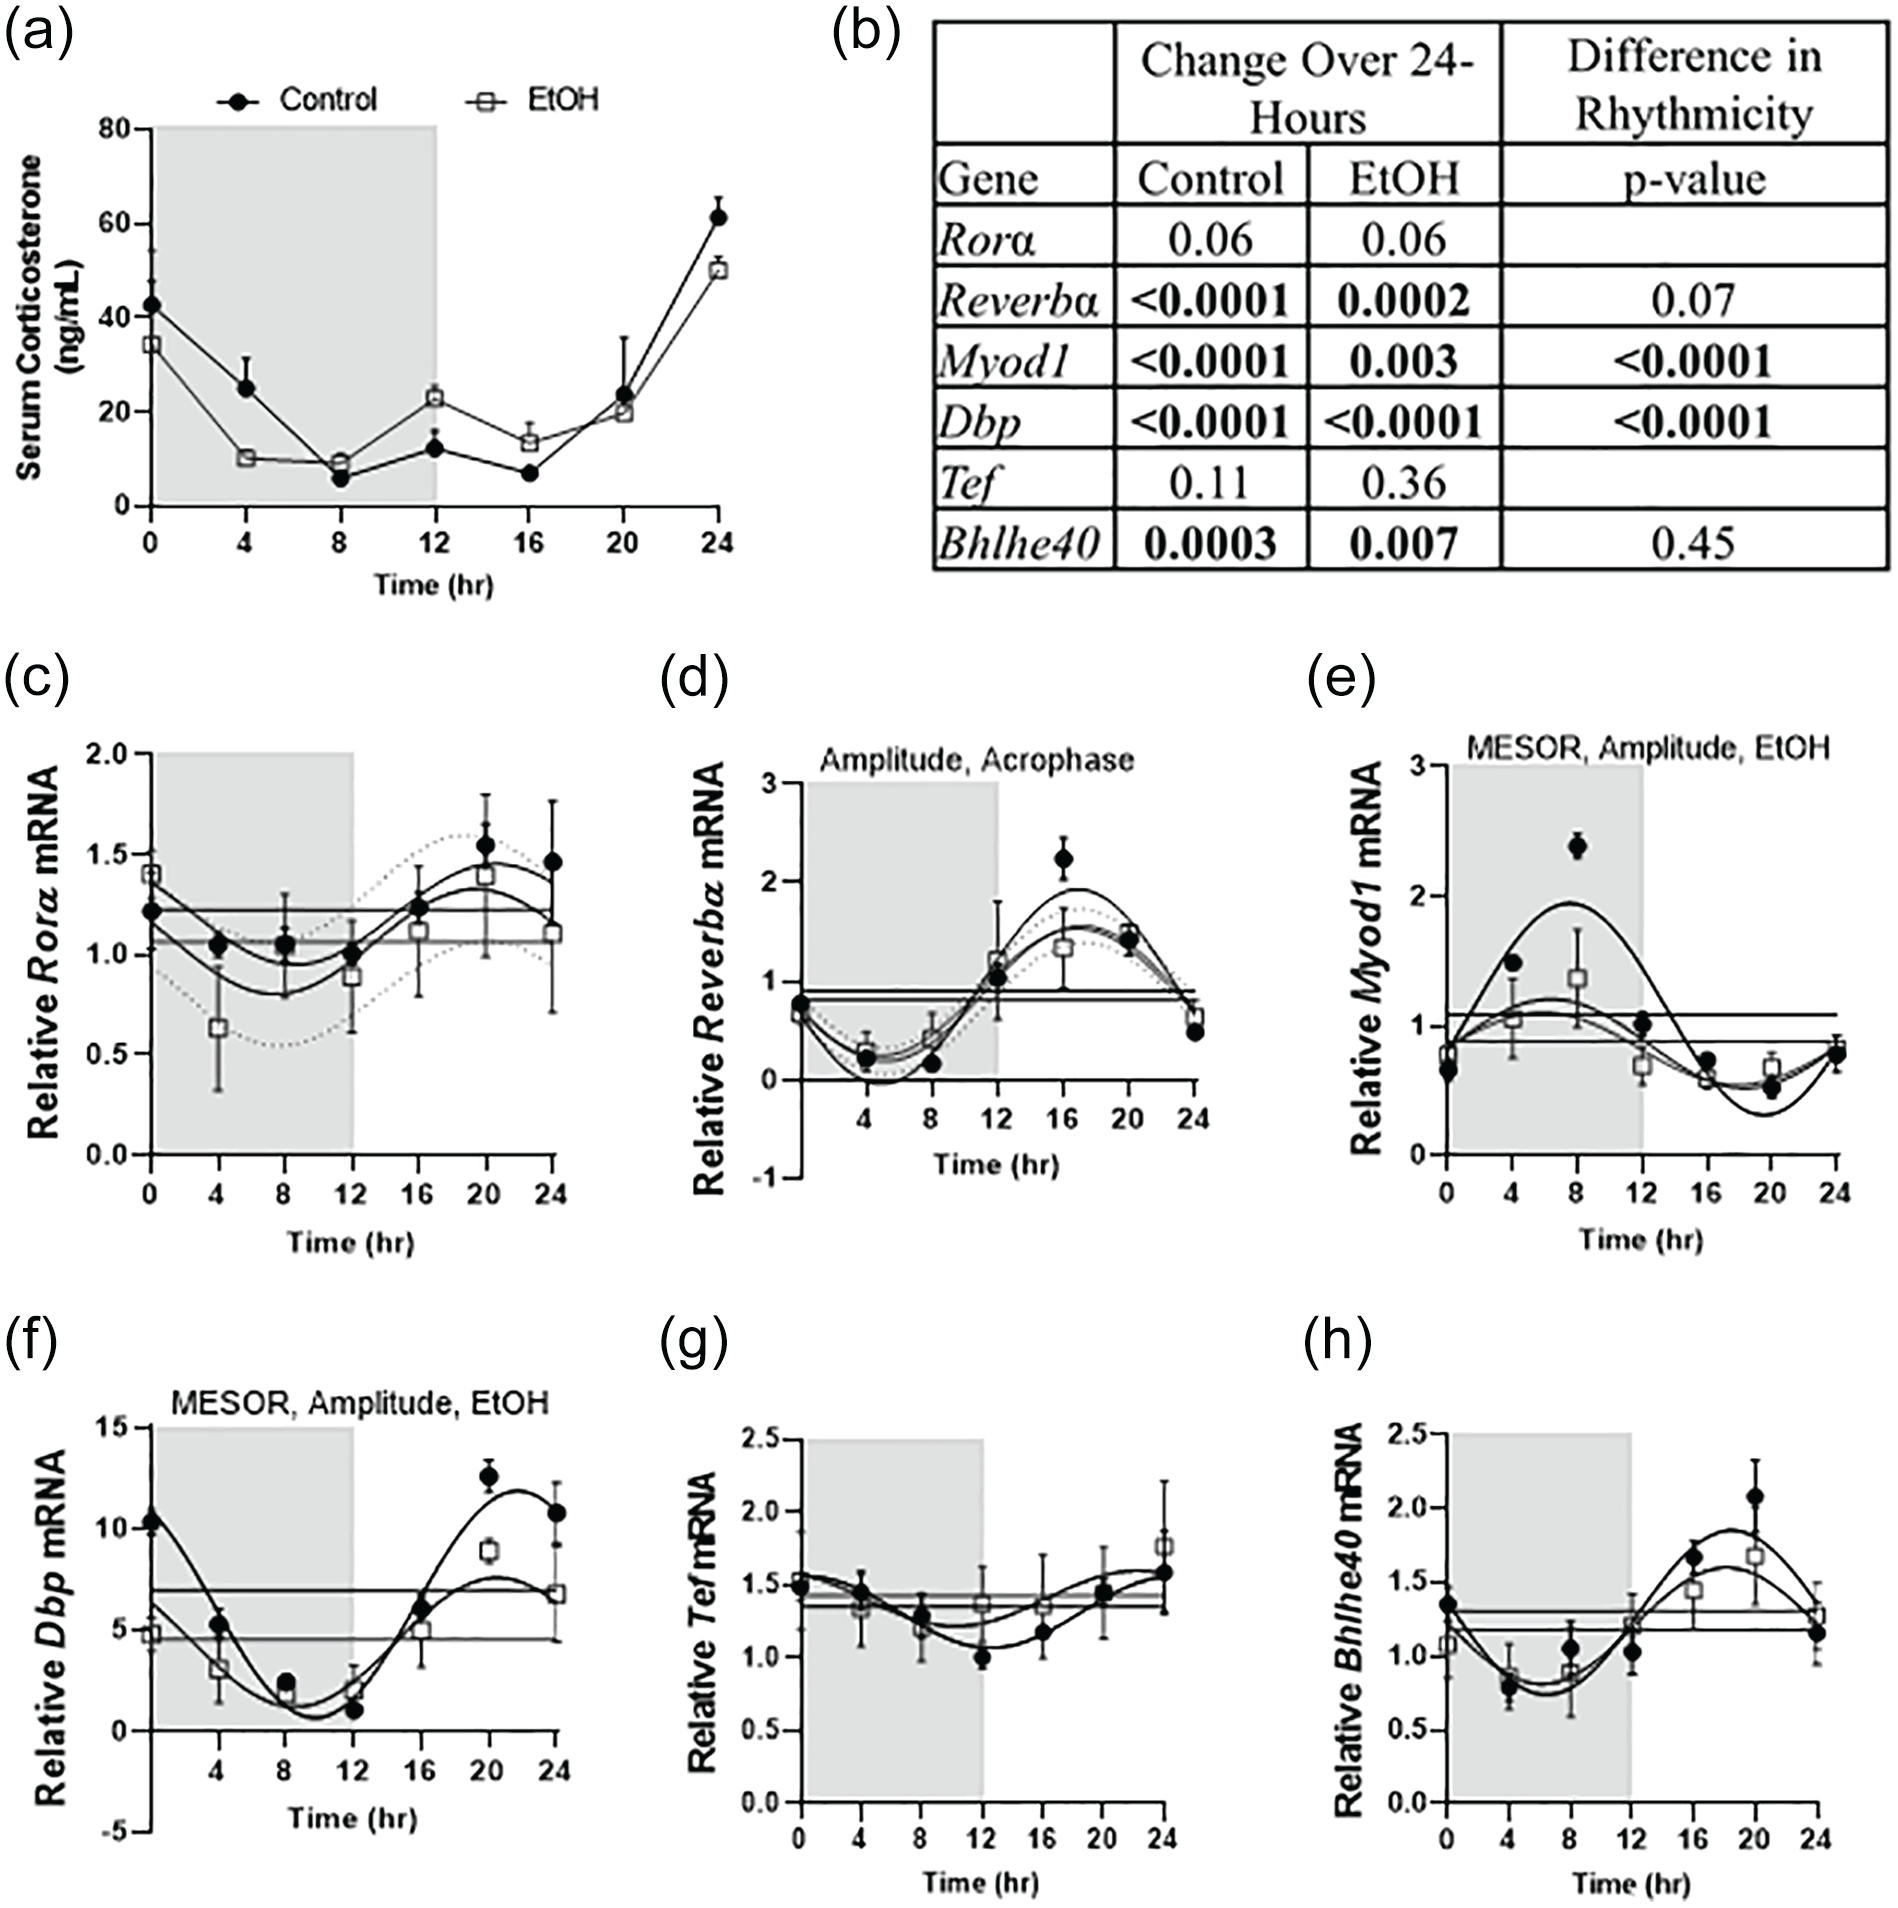
Chronic alcohol intoxication did not alter serum corticosterone concentrations (a). If changes over 24-h were not significant, differences in rhythmicity were not reported. Effects of alcohol over time across the 24 h day were assessed via one-way ANOVA and are displayed in (b) along with results of Cosinor analysis in which differences between control and alcohol are shown under the Difference in Rhythmicity column (b). Effects of alcohol on skeletal muscle clock gene expression is shown in the remaining panels including Rorα (c), Reverbα (d), Myod1 (e), Dbp (f), Tef (g), and Bhlhe40 (h). Black circles represent control (n = 4), and open gray squares represent alcohol EtOH (n = 3-4). The white box indicates the light cycle, while the gray box indicates the dark cycle. Data is presented as mean ± SD for each time point. Cosinor analysis was performed to determine circadian differences with alcohol, and Two-way ANOVA (Time, EtOH) was performed to investigate main effects and interactions, where p ≤ 0.05. Dashed lines indicate the 95% confidence interval. Main effect of alcohol is displayed as EtOH on the graph and differences between control and alcohol in MESOR, amplitude and acrophase (p < 0.05) is also indicated on the corresponding graph by writing the corresponding word on the top of the graph in which a change was detected. Abbreviations: Rorα = RAR related orphan receptor; Myod1 = myogenic differentiation 1; Tef = Thyrotrophic Embryonic Factor; Bhlhe40 = Basic Helix-Loop-Helix-Family Member E40.
Chronic Alcohol Ingestion Shifts the Timing of Core Clock Regulatory Protein Patterns
The content of BMAL1 protein in the nuclear-enriched fraction of skeletal muscles was largely unchanged by long-term alcohol consumption, despite small occasional elevations (Figure 4a and 4e, Suppl. Figs. 2A and 3A). The abundance pattern of REVERBα in the nuclear-enriched fraction was altered in alcohol treated muscle, with levels peaking 8 h earlier in alcohol treated muscles compared to control (Figure 4b and 4e, Suppl. Figs. 2B and 3B). Similarly, DBP was higher in the dark cycle with alcohol, and peak nuclear abundance of MYOD1 also occurred sooner in the dark cycle in alcohol treated mice compared to control (Figure 4c-4e, Suppl. Figs. 2 C, 2D, 3 C, and 3D).
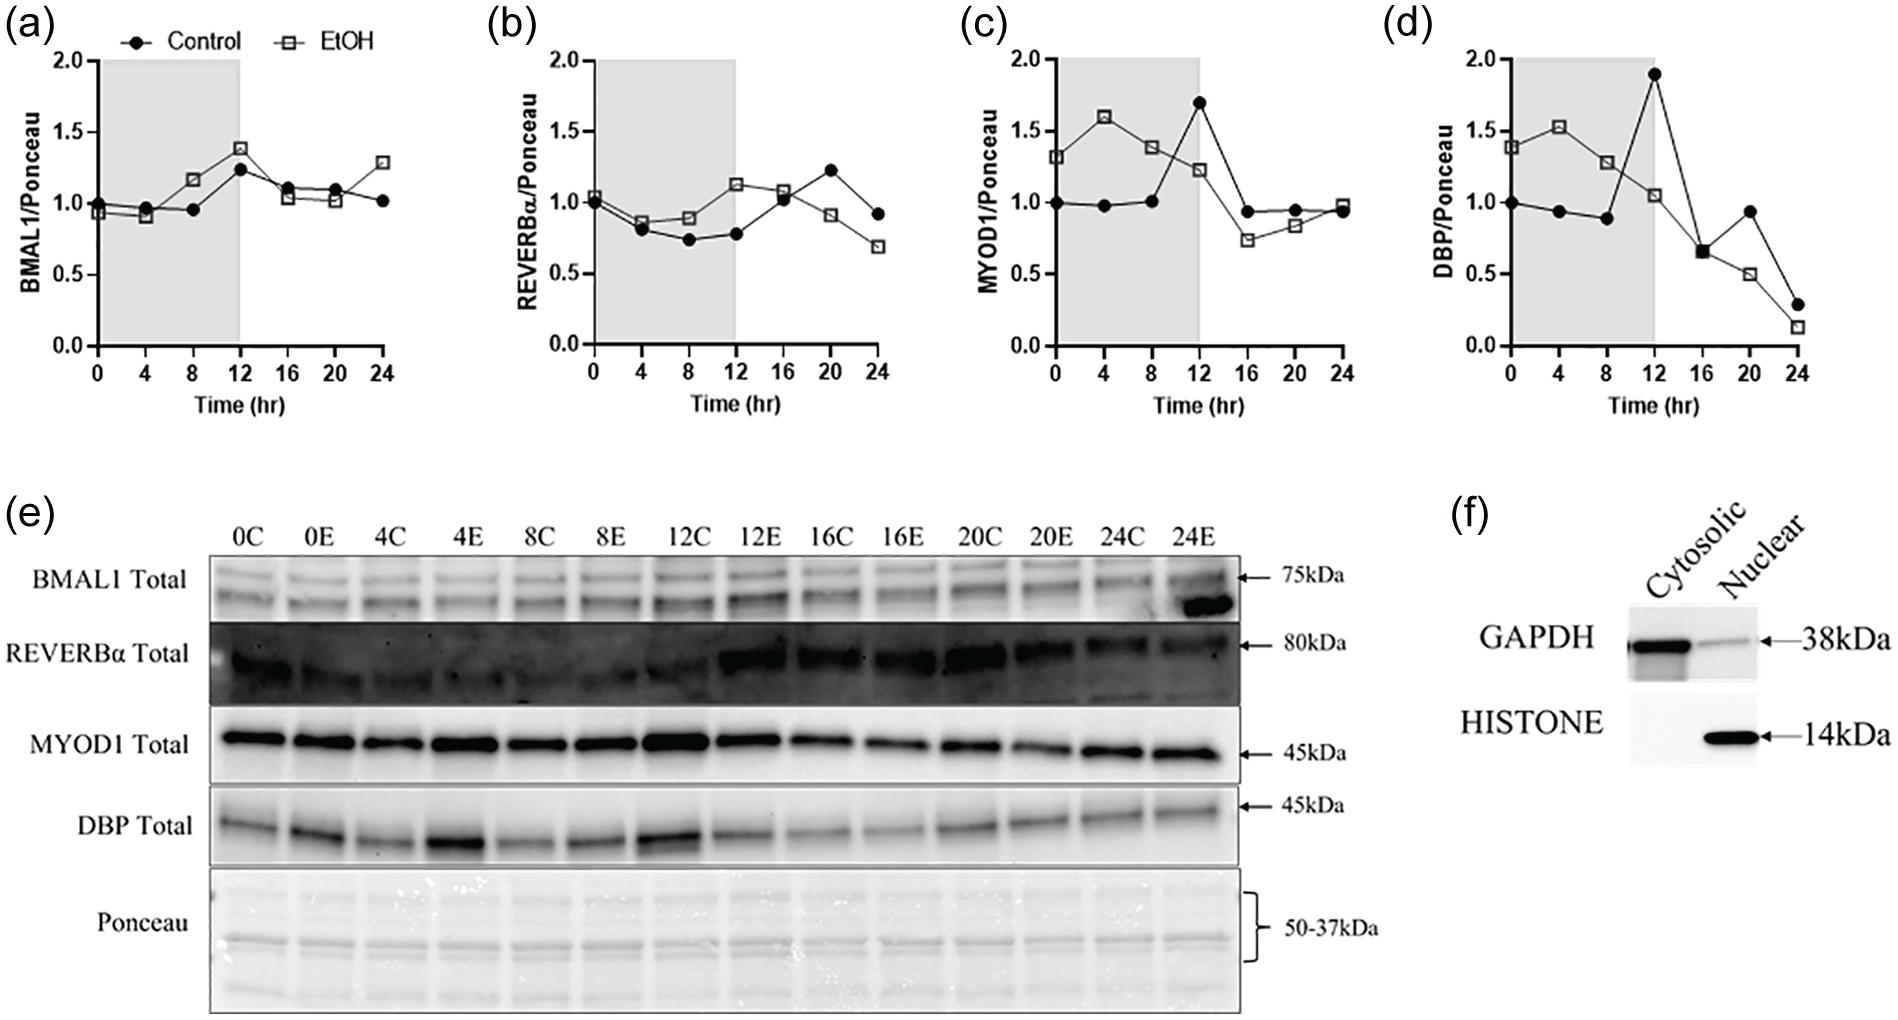
Effects of chronic alcohol ingestion on nuclear expression of core clock transcription factors BMAL1 (a), REVERBα (b), MYOD1 (c), and DBP (d), along with corresponding blot images (e). The solid black circles represent CON, and the open gray squares represent EtOH. Samples for each time-point were pooled together within each treatment group. The white box indicates the light cycle, while the gray box indicates the dark cycle. No statistical tests were conducted. Panel f is a representative image of the purity of the nuclear and cytosolic fractions and their specificity for either nuclear (histone) or cytosolic (GAPDH) proteins. Abbreviations: BMAL1 = Brain muscle arnt like-1; MYOD1 = myogenic differentiation 1; CON = control; GAPDH = glyceraldehyde-3-phosphate dehydrogenase.
We next examined post-translational modifiers that can influence circadian protein activity or binding. Despite no alterations in Sirt1 mRNA expression (data not shown), the abundance of SIRT1 protein was greatest in the dark cycle in alcohol treated mice while control mice exhibited a greater level at the transition of the light to dark cycle (Figure 5a and 5d). Measurement of total acetylated lysine was not different between the treatment groups indicating the shift in SIRT1 did not correspond to global acetylation changes (data not shown). The phosphorylation pattern of GSK3β was also unaltered by chronic alcohol ingestion (Figure 5b and 5d, Suppl. Fig. 4A). Finally, chronic alcohol did not change the phosphorylation of BMAL1 on Ser42 (Figure 5c and 5d, Suppl. Fig. 4B).
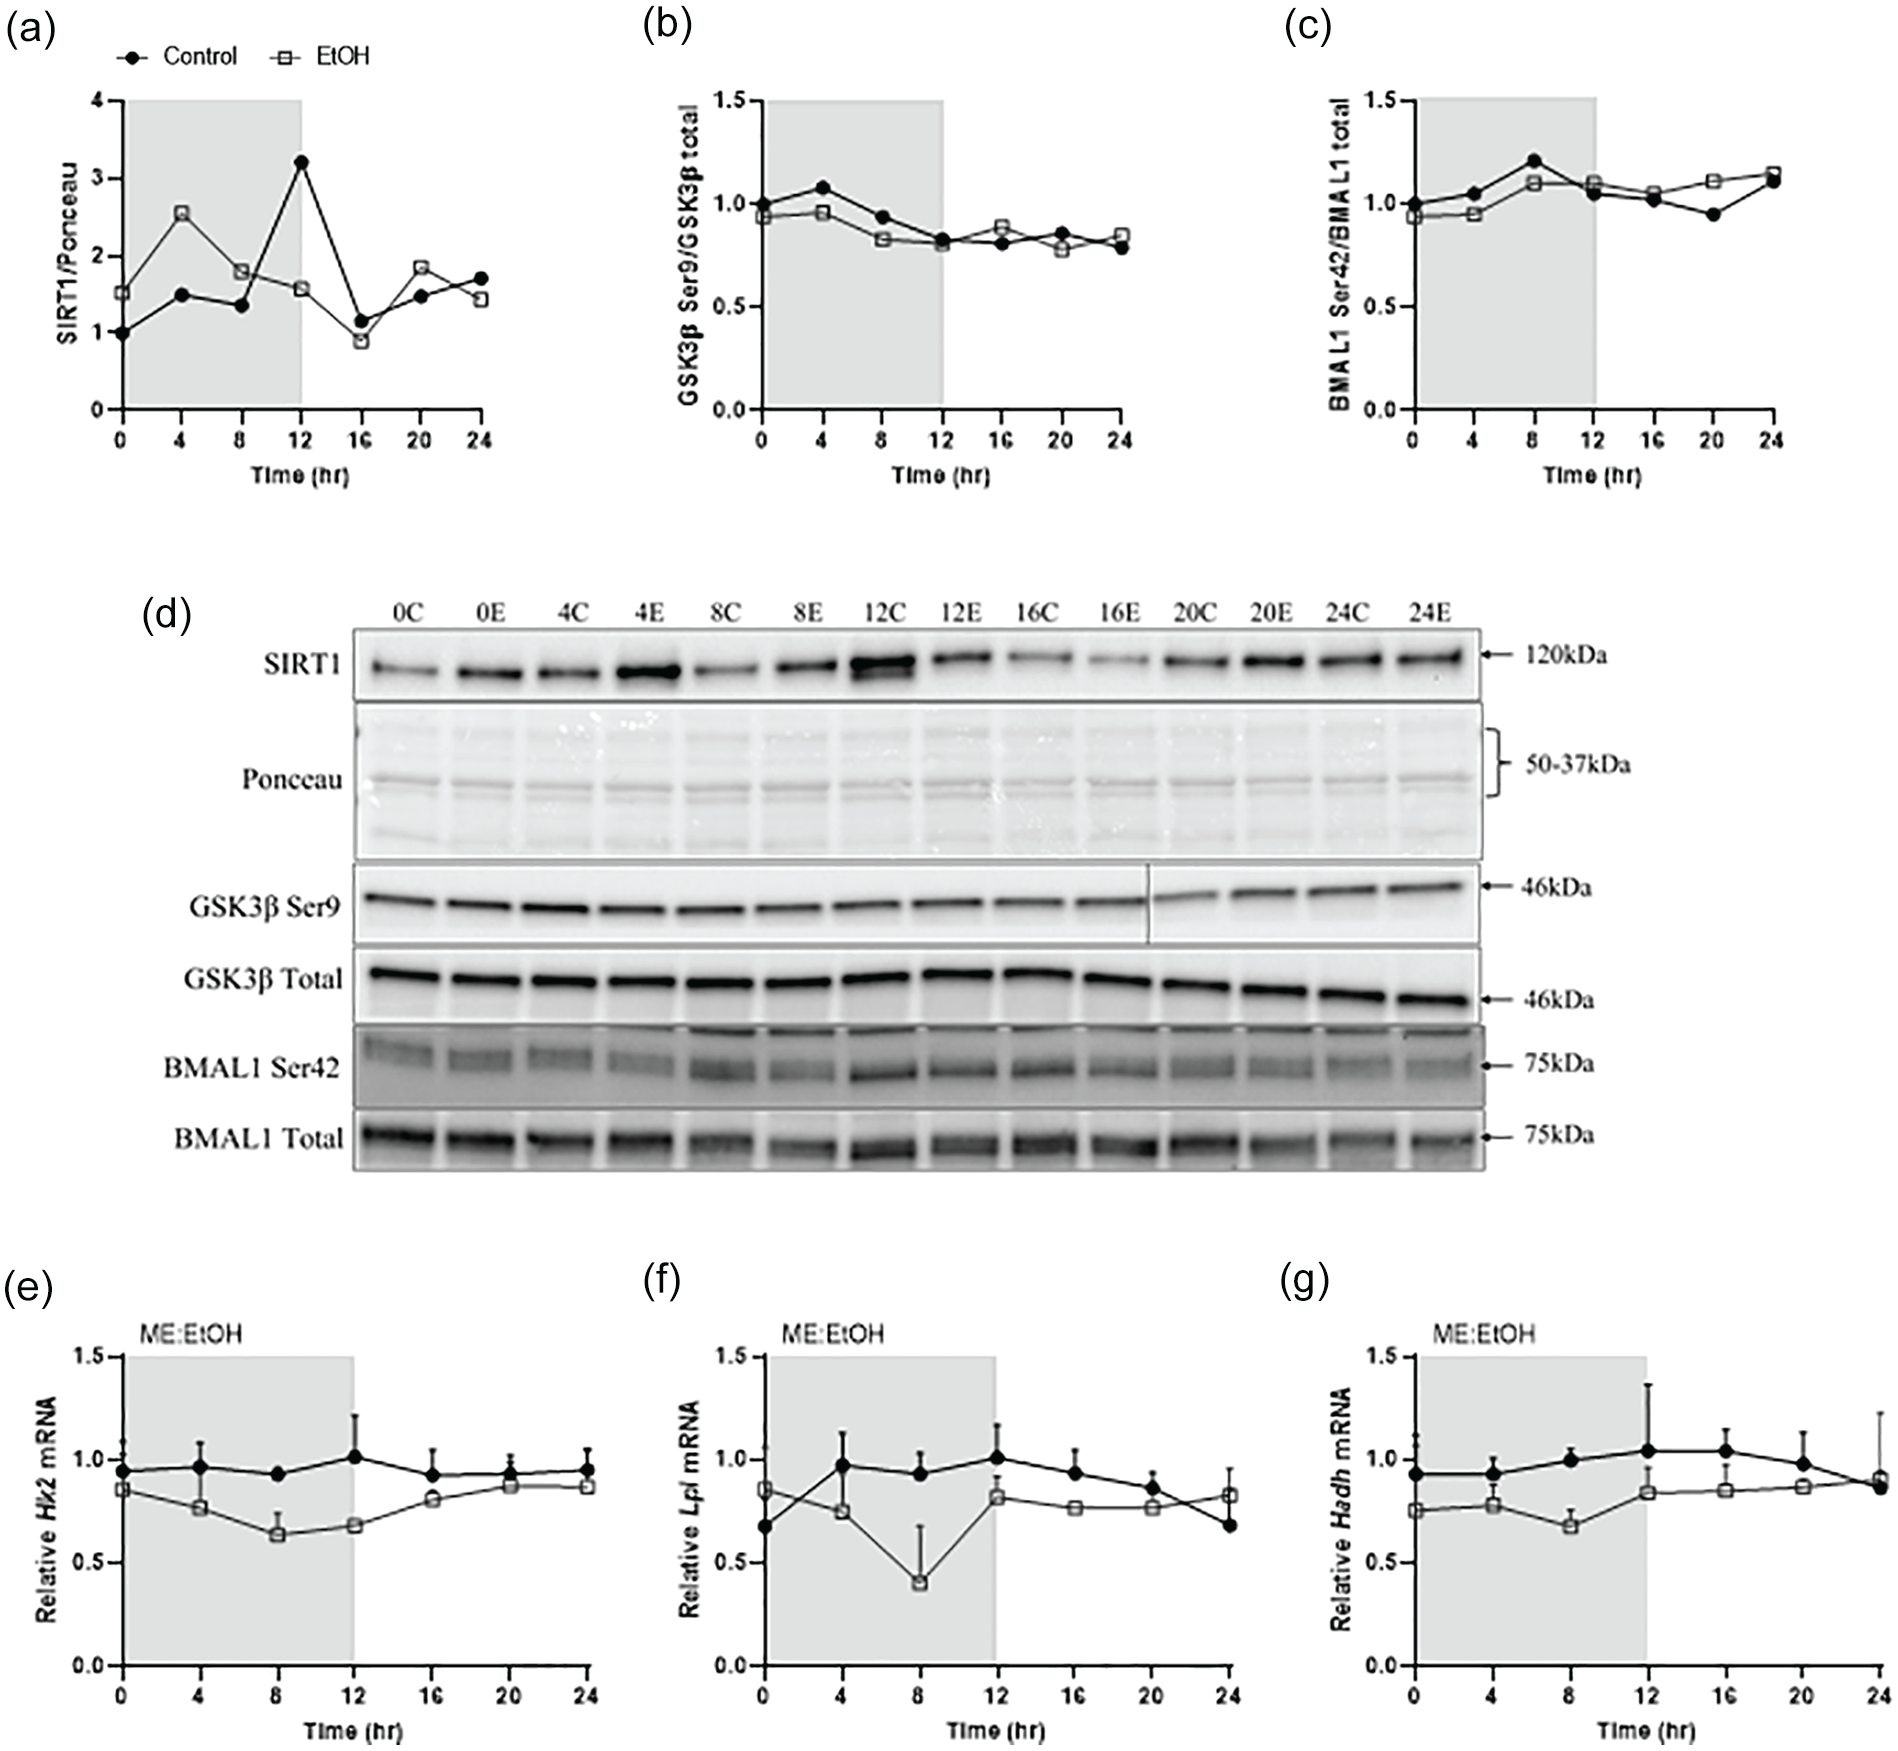
Effects of chronic alcohol treatment on core clock post-translational modifiers, including SIRT1 (a), GSK3β Ser9 (b), and BMAL1 Ser42 (c), along with the corresponding blot images (d). In (d), a single lane was removed from the blot shown due to a faulty well in the gel having to be skipped upon loading. The solid black circles represent CON (n = 4/timepoint), and the open gray squares represent EtOH (n = 3-4/timepoint). Protein expression samples for each time-point are pooled together for each treatment group. Effects of alcohol on expression of clock-controlled genes including Hk2 (e), Lpl (f) and Hadh (g) are also displayed. Two-way ANOVA (Time, EtOH) was performed to investigate main effects and interactions of gene expression, where p ≤ 0.05. No statistical tests were conducted on protein expression. For genes expression, main effect of alcohol is displayed as ME: EtOH. The white box indicates the light cycle, while the gray box indicates the dark cycle. Abbreviations: BMAL1 = Brain muscle arnt like-1; CON = control.
Finally, the expression of a subset of clock-controlled metabolic genes were assessed to determine if core clock target genes with no known influence on core clock function, were also disrupted by chronic alcohol intake. Alcohol suppressed the expression of hexokinase 2 (Hk2), throughout the dark cycle (Figure 5e), as well as lipoprotein lipase (Lpl), and hydroxyacyl-Coenzyme A dehydrogenase (Hadh) across much of the 24 h cycle (Figure 5f and 5 g). Therefore, the alcohol-induced suppression of core clock gene expression coincides with suppression of clock-controlled target gene expression.
Discussion
The current study demonstrates that chronic alcohol ingestion results in disruptions to the oscillatory behavior of core clock genes Bmal1, Per1, Per2, and Cry2 in the skeletal muscle despite the maintenance of normal light/dark cues and levels of corticosterone, two well-characterized clock modifiers. In addition, circadian oscillation of multiple skeletal muscle clock-controlled and clock-regulating genes including Myod1, Reverbα, and Dbp, were disrupted with chronic alcohol intoxication. We further demonstrated alterations in the pattern of expression of the nuclear abundance of several proteins related to core clock function including REVERBα, MYOD1, and DBP following alcohol consumption. Finally, despite a greater abundance of SIRT1 during the dark cycle in alcohol consuming animals, no differences in other post-translational modifications were observed following alcohol intoxication. Therefore, alcohol suppressed core clock and target gene expression while also disrupting the diurnal timing of several core clock modulators.
Presently, we demonstrate that chronic alcohol ingestion results in disruptions to the skeletal muscle core clock including suppression of the amplitude of core clock genes, most notably, Bmal1 and the Period genes. Alcohol’s inhibitory effects on Bmal1 transcription were also associated with decreased transcription of its downstream targets Myod1, Dbp and Rev-erbα (Triqueneaux et al., 2004; Hodge et al., 2019). This is in line with, but not as marked as, the abolishment of Dbp and Rev-erbα expression noted in skeletal muscle of muscle specific Bmal1 knockout mice indicating the alcohol induced suppression of Bmal1 may be contributing to this effect (Hodge et al., 2015). However, as we did not detect a change in overall protein levels of BMAL1, it remains to be determined exactly how the decrease in Bmal1 transcription is reducing these gene products. Dbp and Rev-erbα are also transcriptional targets of MYOD1, which can feed back to enhance Bmal1 transcription (Hodge et al., 2019). MYOD1 expression peaked earlier in the dark cycle in the alcohol-treated mice suggesting disruption to the timing of MYOD1 binding to not only the Bmal1 promoter, but also those of other circadian genes it directly targets potentially resulting in widespread transcriptional disruption (Hodge et al., 2019). Furthermore, peak expression of REVERBα also occurred earlier representing another consequence of MYOD1 disruption that may contribute to reduced Bmal1 expression, as REVERBα contributes to the regulation of Bmal1 transcription (Buhr and Takahashi, 2013). Phase advancement or earlier peak abundance of whole cell and nuclear core clock-related proteins has also been observed in the liver following chronic alcohol consumption indicating it may be a central factor contributing to the alcohol induced circadian desynchrony across various organ systems (Gaucher et al., 2019).
Post-translational modifications to core clock proteins contribute to the regulation of core clock function (Lefta et al., 2011). For instance, the histone deacetylase SIRT1 aids in the regulation of CLOCK: BMAL1 heterodimer binding to the promoter region of CCGs through the deacetylation and “closing” of the chromatin (Nakahata et al., 2008). Presently, SIRT1 expression peaked earlier in the dark cycle indicating a possible disruption in the timing and co-localization of CLOCK, BMAL1 and SIRT1 at the promoters of CCGs, thereby contributing to the observed downregulation of CCG gene transcription (Nakahata et al., 2008). Phosphorylation also contributes to the regulation of BMAL1 and occurs on several sites by different kinases. For example, both S6K1 and AKT can phosphorylate Ser42 on BMAL1 leading to disruption of DNA binding and suppression of basal transcriptional activity as well as nuclear positioning (Dang et al., 2016; Lipton et al., 2015). Despite prior work showing alcohol induced suppression of S6 K1 and AKT, no change in BMAL1 Ser42 phosphorylation was observed presently, indicating this is an unlikely mechanism explaining the alcohol induced decrease in Bmal1 expression (Steiner and Lang, 2015). Finally, GSK3β regulates transcriptional activation of CLOCK and BMAL1 in the early day, and transcriptional repression in the early night via phosphorylation of PER and CRY proteins (Sahar et al., 2010; Spengler et al., 2009; Iitaka et al., 2005). However, no changes in GSK3β phosphorylation and presumably activity, were noted presently. Therefore, aside from a potential SIRT1 mediated effect, it does not appear that the posttranslational modifiers assessed presently contributed to the observed suppression of the core clock following chronic alcohol consumption.
The link between skeletal muscle core clock disruption by alcohol and the induction of alcoholic myopathy remains to be mechanistically determined. Presently, no change in gastrocnemius muscle mass was observed despite the nearly significant decrease in overall lean mass indicating that core clock disruption resulting from alcohol consumption may have other consequences not currently assessed including decrements in muscle function or histopathological features. For example, alcohol ingestion and disruption of the skeletal muscle core clock have each independently altered aspects of myopathy including muscle fiber type distribution and cross-sectional area, muscle strength, and muscle metabolism (Martin et al., 1985; Freilich et al., 1996; Dyar et al., 2014; Andrews et al., 2010; Hodge et al., 2015; Schroder et al., 2015). In addition, as the clock serves as a major regulator of skeletal muscle mRNA transcription, regulating over 2300 circadian transcripts, including those involved in skeletal muscle cell signaling, transcription, and metabolism, it is probable that alcohol induced manipulation of the core molecular clock is contributing to a multitude of transcriptional changes (Hodge et al., 2015; Schroder et al., 2015; Andrews et al., 2010; Dyar et al., 2014; McCarthy et al., 2007).
Finally, the dose and duration of alcohol intoxication appears to dictate the response of the skeletal muscle core molecular clock to alcohol. Our prior work showed that binge alcohol intoxication increased the mRNA expression of several core clock genes including Bmal1, Per1, Per2 and Cry2, enroute to inducing circadian disruption within the skeletal muscle, while presently, these genes are suppressed by chronic alcohol intake (Tice et al., 2021). Therefore, we can only speculate that the dose and duration of exposure to alcohol influences the skeletal muscle response and whether the chronically induced suppression reported herein would be relieved or reversed following cessation of intake remains unknown.
In conclusion, we have demonstrated that chronic alcohol intoxication not only alters gene expression and whole-cell and nuclear protein abundance of the skeletal muscle core clock, and regulatory proteins like REVERBα, but we also show alcohol induced disruptions to CCGs, including those involved in metabolic regulation. Several questions remain related to aspects of core clock regulation not assessed presently including things like heterodimerization of CLOCK-BMAL1 and their subsequent attachment to E-box sequences, or regulation of BMAL1 by PERs-CRYs and RORE binding elements (Sato et al., 2006; Guillaumond et al., 2005; Andrews et al., 2010). Furthermore, as the skeletal muscle clock is implicated in maintaining skeletal muscle function and structure, future work is needed to mechanistically determine its role in the development of alcoholic myopathy by directly investigating aspects of the disease that were not currently assessed. Finally, as these experiments were only conducted in female mice, replication of these findings is required to determine if similar effects will be observed in male mice.
Supplemental Material
sj-pdf-1-jbr-10.1177_07487304221141464 – Supplemental material for Chronic Alcohol Consumption Disrupts the Skeletal Muscle Circadian Clock in Female Mice
Supplemental material, sj-pdf-1-jbr-10.1177_07487304221141464 for Chronic Alcohol Consumption Disrupts the Skeletal Muscle Circadian Clock in Female Mice by Abigail L. Tice, Joseph A. Laudato, Bradley S. Gordon and Jennifer L. Steiner in Journal of Biological Rhythms
Footnotes
Acknowledgements
This research received no specific grant from any funding agency in the public, commercial, or not-for-profit sectors, however start-up funds from Florida State University to JLS and BSG were used to support the current project.
Conflict of Interest Statement
The author(s) have no potential conflicts of interest with respect to the research, authorship, and/or publication of this article.
Notes
References
Supplementary Material
Please find the following supplemental material available below.
For Open Access articles published under a Creative Commons License, all supplemental material carries the same license as the article it is associated with.
For non-Open Access articles published, all supplemental material carries a non-exclusive license, and permission requests for re-use of supplemental material or any part of supplemental material shall be sent directly to the copyright owner as specified in the copyright notice associated with the article.