
Abstract
The current study characterized the temporal dynamics of ocular indicators of sleepiness during extended sleep restriction. Ten male participants (mean age ± SD = 23.3 ± 1.6 years) underwent 40 h of continuous wakefulness under constant routine (CR) conditions; they completed the Karolinska Sleepiness Scale (KSS) and a 10-min auditory psychomotor vigilance task (aPVT) hourly. Waking electroencephalography (EEG) and ocular measures were recorded continuously throughout the CR. Infrared-reflectance oculography was used to collect the ocular measures positive and negative amplitude-velocity ratio, mean blink duration, the percentage of eye closure, and a composite score of sleepiness levels (Johns Drowsiness Scale). All ocular measures, except blink duration, displayed homeostatic and circadian properties. Only circadian effects were detected in blink duration. Significant, phase-locked cross-correlations (p < 0.05) were detected between ocular measures and aPVT reaction time (RT), aPVT lapses, KSS, and EEG delta-theta (0.5-5.5 Hz), theta-alpha (5.0-9.0 Hz), and beta (13.0-20.0 Hz) activity. Receiver operating characteristic curve analysis demonstrated reasonable sensitivity and specificity of ocular measures in correctly classifying aPVT lapses above individual baseline thresholds (initial 16 h of wakefulness). Under conditions of sleep restriction, ocular indicators of sleepiness paralleled performance impairment and self-rated sleepiness levels, and demonstrated their potential to detect sleepiness-related attentional lapses. These findings, if reproduced in a larger sample, will have implications for the use of ocular-based sleepiness-warning systems in operational settings.
Keywords
Eye and eyelid movements have proven useful in quantifying levels of sleepiness that can reflect performance or attentional impairment (Cajochen et al., 1999; Lockley et al., 2004; Torsvall and Åkerstedt, 1987). Eye blinks associated with the onset of sleep or microsleeps, often experienced by sleep-deprived individuals, display unique properties that reflect sleep- and wake-related central nervous system (CNS) changes (Stern et al., 1984). This consequential change to distinct blink characteristics is linked to the close proximity of neural centers regulating the facial nerves that control eye movements and the medullary structures associated with the sleep-wake process (Morris and Miller, 1996; Stern et al., 1984). Independent studies have assessed the sleepiness-related changes in ocular measures, such as the amplitude-velocity ratio of blinks (Anderson et al., 2013; Johns et al., 2008; Michael et al., 2008; Picot et al., 2012; Vadeby et al., 2010), blink duration (Anund et al., 2008; Caffier et al., 2003; Häkkänen et al., 1999; Picot et al., 2012; Schleicher et al., 2008), blink closing and reopening durations (Caffier et al., 2003; Picot et al., 2012), and percentage of eye closures (PERCLOS) (Abe et al., 2011; Chua et al., 2012; Dinges and Grace, 1998; Schleicher et al., 2008; Wierwille and Ellsworth, 1994), in relation to well-researched methods of sleepiness quantification. These ocular measures correspond to increases in a marker of sleep onset, slow eye movements (Cajochen et al., 1999; De Gennaro et al., 2005; Henn et al., 1984; Picot et al., 2012), and measures of sleep propensity, such as the multiple sleep latency test and maintenance of wakefulness test (De Gennaro et al., 2005; Häkkänen et al., 1999). As such, sleepiness-detection systems have been developed around ocular measures (Bergasa et al., 2006; Johns et al., 2008; Johns et al., 2007) based on their temporal relationship with sleep onset and associated performance decline (Anderson et al., 2013; Chua et al., 2012; Michael et al., 2008; Van Dongen et al., 2003).
While ocular measures regulated by the CNS are described as reliable state measures of sleepiness (Stern et al., 1984), it is yet to be established whether ocular measures are regulated by the same physiological processes that regulate the sleep-wake cycle. The temporal dynamics of alertness are regulated by the endogenous rhythm of sleep propensity, which peaks at night and is generated by the circadian pacemaker (Process C), and sleep pressure, which is generated by a homeostatic process (Process S) and predicts increased sleepiness with increased time awake (Borbely, 1982). Although various papers have examined the many ocular measures available in relation to sleepiness, fewer have assessed the temporal variations in ocular measures derived from sleepiness-detection devices developed for operational settings, as well as their association with changes in alertness and neurobehavioral performance (Abe et al., 2011; Anderson et al., 2013; Chua et al., 2012; Dinges and Grace, 1998). Therefore, the aim of this study was to assess changes in ocular measures derived from a sleepiness-detection device (Optalert; Optalert Pty Ltd, Melbourne, Australia), over 40 h of sleep deprivation under highly controlled laboratory conditions, to characterize the circadian and time awake-dependent (homeostatic) changes in these measures. The time course of these variables was correlated with the time course of attentional performance, electroencephalogram (EEG)-based measures of alertness, and subjective sleepiness. In addition, the study aimed to assess the predictability of ocular measures in detecting lapses in performance.
Materials and Methods
Ethical Approval
The study was approved by the Partners Human Research Committee and the Monash University Human Research Ethics Committee. All participants gave written informed consent prior to the study.
Participants and Prestudy Conditions
Ten healthy males (mean age ± SD = 23.3 ± 1.6 years; range 20-25 years) were studied in the Intensive Physiology Monitoring Unit in the Centre for Clinical Investigation at Brigham and Women’s Hospital. All had comprehensive physical, psychological, and ophthalmologic examinations, including a negative Ishihara color-blindness test (Ishihara, 1996). For at least 3 weeks prior to entering the Intensive Physiology Monitoring Unit, participants maintained a self-selected, constant 8 h sleep/rest/dark schedule confirmed with calls to a time- and date-stamped voicemail at bedtime and wake time for 3 weeks, and with actigraphy (Actiwatch-L, Mini-mitter, Inc., Bend, OR) for at least 7 days prior to entering the unit. Participants were asked to refrain from use of any prescription or non-prescription medications, supplements, recreational drugs, caffeine, alcohol, or nicotine. Compliance with these instructions was verified by urine and blood toxicology during screening and urine toxicology upon entry to the unit.
Study Protocol
Participants were studied for 7 days in an environment free of time cues (no access to windows, clocks, watches, live TV, radio, internet, telephones, and newspapers, and continually supervised by staff trained not to reveal information about the time of day). The schedule consisted of a 3-day baseline (8:16 h sleep:wake cycle based on average sleep times in the 7 days prior to study entry), a 40 h constant routine (CR), a 16 h experimental light exposure day, followed by 8 h of sleep, and then discharge. Only data recorded during the CR are reported here. During the CR, participants were asked to remain awake while supervised under constant dim light, in a semi-recumbent posture, with daily nutritional intake divided into hourly portions (150 mEq Na+/100 mEq K+ (±20%) controlled-nutrient, isocaloric [basal energy expenditure × 1.3] diet, 2500 mL fluids/24 h).
Sleepiness and Performance Assessments
Participants rated their sleepiness using the Karolinska Sleepiness Scale (KSS; 9-point scale from 1 = “very alert” to 9 = “very sleepy, fighting sleep”) (Åkerstedt and Gillberg, 1990) by pressing the appropriate number on a computer keyboard when prompted. Performance was assessed using an auditory 10-min psychomotor vigilance task (aPVT), in which an auditory signal was presented at random intervals (1-9 sec) and the participant was asked to press a button as soon as possible after hearing the sound. No simultaneous visual stimulus was presented.
The auditory version of the psychomotor vigilance task was used as it was more appropriate for administration during the light exposure phase of the study that followed the CR (data not included here). The aPVT is a validated measure of sustained attention and a reliable index of objective sleepiness (Jung et al., 2010; Lisper and Kjellberg, 1972), and it correlates with the visual psychomotor vigilance task during sleep deprivation (Jung et al., 2010). KSS and aPVT were assessed every 60 min beginning 2 h after waking.
Oculography
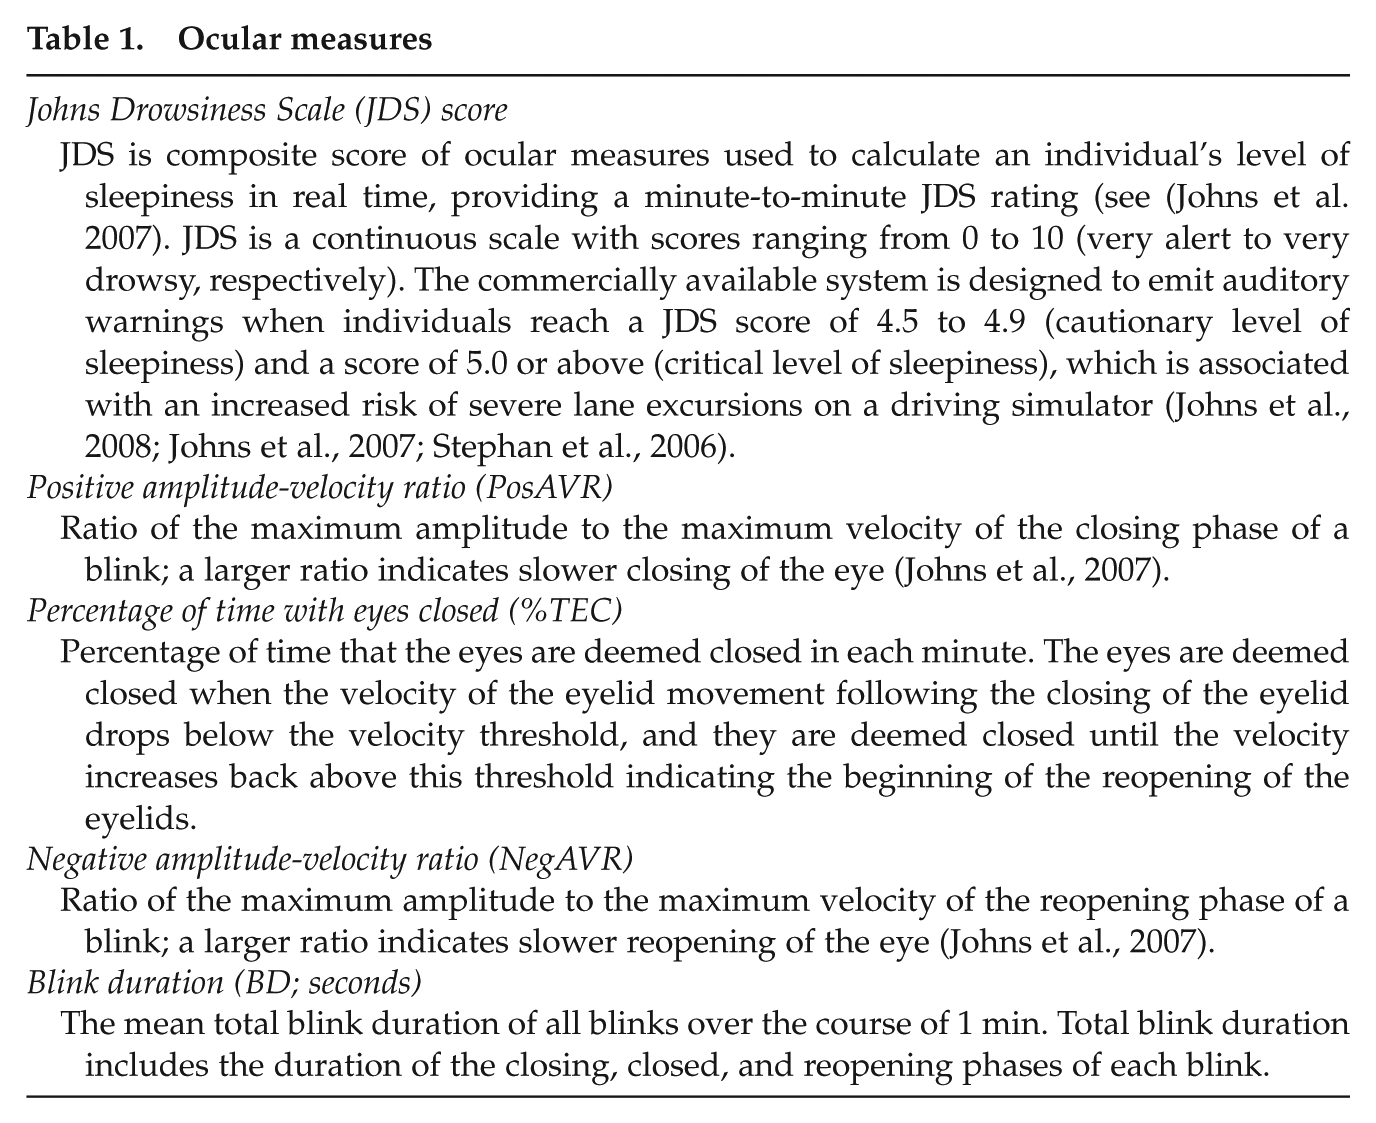
Participants’ eyelid movements were monitored by infrared (IR) reflectance oculography (Optalert) to record sleepiness levels continuously throughout the CR (Johns et al., 2007). IR transducers fitted to spectacle frames were positioned toward the top eyelid to capture 3 phases of the eye blink: (1) the closing phase, (2) closed phase, (3) and reopening phase. The system provides 13 ocular measures sampled each minute, of which the following were selected based on previous work (Åkerstedt et al., 2010; Caffier et al., 2003; Ftouni et al., 2013) (detailed description of each measure provided in Table 1): positive and negative amplitude-velocity ratio of each blink (PosAVR, NegAVR), Johns Drowsiness Scale (JDS) score, the percentage of time with eyes closed (%TEC), and mean total blink duration (BD). Increasing values indicate increasing sleepiness.
Ocular measures
Waking EEG Recordings
Polysomnographic recordings were made continuously throughout the CR using a portable, modular, battery-operated, ambulatory, digital polysomnographic recorder (Vitaport-3 digital recorder, TEMEC Instruments B.V., Kerkrade, The Netherlands). Recordings consisted of EEG, electrooculogram, and a 2-lead electrocardiogram. Electrodes were positioned according to the International 10-20 System, with linked mastoid references (Ax) used for wake recordings from the z-line, Fz-Ax, Cz-Ax, Pz-Ax, and Oz-Ax. Only data from the Cz-Ax derivation (central position on the nasion-inion midline) are presented in this report. All EEG signals were high-pass filtered (time constant: 0.33 sec), low-pass filtered (–6 dB at 70 Hz, 24 dB/octave), and digitized (resolution: 12-bit, sampling rate: 256 Hz, storage rate: 128 Hz). The raw signals were stored on a Flash RAM Card (SanDisk, Sunnyvale, CA) and downloaded off-line. Electrode impedances were checked using a GRASS F-EZM4 impedance meter (Grass-Telefactor, Astro-Med, Inc., West Warwick, RI) every 8 h throughout the CR. Electrode impedances were documented, and electrode applications were repeated until the impedances were all less than 10 kΩ. Participants were asked to complete the Karolinska Drowsiness Test (KDT) hourly, following the KSS and aPVT test battery, during which participants were instructed to relax and fixate on a 5 cm black dot attached to a computer screen 1 m away for 3 min with their eyes open. EEG data in the report were sampled during the 3 min KDT.
Data Analysis
Mean aPVT reaction time (RT) and number of lapses (responses >500 msec) over the 10 min test were calculated for each session. aPVT RT scores were transformed with a logarithmic function, and a square root transformation was applied to aPVT lapses (Dinges and Kribbs, 1991). Waking EEG signals derived from Cz/Ax during the KDT were visually inspected, and 2-sec epochs containing muscle artifact, eye blinks, and eye movements were discarded from further analysis. Artifact-free 2-sec epochs were subjected to off-line spectral analysis using a fast-Fourier transformation and a 10% cosine window. Data were reduced by discarding spectra above 20 Hz. Absolute power densities were log-transformed, and to minimize the effects of interindividual variation, log-transformed power density at each sampling point was expressed as a percentage of the log-transformed power density of the entire CR for each participant individually before comparing between individuals. EEG power densities were grouped into the following frequency bands: delta-theta (0.5-5.5 Hz), theta-alpha (5.0-9.0 Hz), high-alpha (9.5-12.0 Hz), and beta (13.0-20.0 Hz) (Cajochen et al., 2002; Lockley et al., 2006).
Ten-minute recordings of each ocular measure were extracted during the 10 min aPVT and used for cross-correlation and receiver operating characteristic (ROC) area under the curve (AUC) analyses. Data were aligned based on recorded aPVT start and end times. Ocular measures recorded during aPVT were selected for analysis to reduce variance across participants as participants were instructed to remain still with eyes directed at the screen ahead and concentrate on the task. Ocular measures recorded during the KDT could not be used in the analysis as participants were instructed to blink as little as possible during the 3 min task. As ocular measures are derived from eye blinks, ocular measures recorded during this task may be inaccurate representations of the participants’ sleepiness level.
Data were averaged within the individual for each session and then averaged across the group. Group averages were calculated by aligning individuals with respect to their habitual wake time for analysis of homeostatic effects and by the core body temperature (CBT) minimum for circadian effects.
Linear mixed model (SAS 4.3; SAS Institute Inc., Cary, NC) analyses were used to assess the elapsed time-dependent changes of each variable in 2 h bins, as this approach accommodates missing data. Participant was modeled as a random effect, and time awake was modeled as a fixed effect, using the Kenward-Rogers method to calculate degrees of freedom. An auto-regressive covariance structure was used for repeated measures (Littell et al., 2000). Post- hoc comparisons for any main effect of time awake were made using pairwise comparisons with Bonferroni-Holm corrections for multiple comparisons. Each 2 h bin was compared with the mean of the first 16 h (Anderson et al., 2013; Van Dongen et al., 2003) to reduce type 1 error. To assess the circadian component of the ocular measures, a cosinor model with a fixed period of 24 h was fitted to the data (Nelson et al., 1979).
Cross-correlation analyses were performed to assess the phase correlations between ocular measures with aPVT RT and lapses, KSS, and EEG power density waveforms. Data were grouped by habitual wake time in 1 h bins with natural logarithm transformation. Significance was set at p < 0.05.
ROC curve analysis was performed to evaluate and compare the performance of ocular measures (JDS, PosAVR, %TEC, NegAVR, and BD) and subjective sleepiness (KSS) at predicting aPVT lapses above 3 threshold increases of each subject’s baseline level of lapses (first 16 h of wakefulness): 25%, 50%, and 75% (Chua et al., 2012). Three threshold levels were selected to assess the ability of ocular measures to predict mild to severe levels of performance impairment. KSS was not used as the predictor because an objective measure of sleep-related neurobehavioral impairment was preferred rather than a subjective measure of sleepiness. ROC curve analysis was performed using SigmaPlot 12.3 software (ROC Curves Module; Systat Software Inc., San Jose, CA). Optimal cutoff values were selected based on maximum sensitivity and specificity values. The χ2 statistic and associated p value for pairwise AUC comparisons are presented to assess the relative performance of the ocular measures in relation to subjective sleepiness reports at correctly classifying whether the participant had performed above or below his baseline threshold on the aPVT.
Results
Of the 380 total testing sessions (38 sessions × 10 participants), 319 (83.9%) KDT sessions and 379 (99.7%) KSS sessions were retained. A total of 353 (92.9%) aPVT sessions were recorded, and 314 (82.6%) with coincident ocular data. Ocular data loss was primarily due to missing data (glasses off), excluded system-generated interpolated data (when no signal is identified for 2 min), and blinks not recognized resulting in zero values. Intervals with poor signal quality were removed on an individual basis.
Time Course of Ocular Measures
The time course of ocular measures for 40 h under CR conditions is presented in Figure 1. The first 16 h were averaged to form 1 value in order to examine the effect of elapsed time awake. Linear mixed-model analysis revealed that ocular measures displayed significant main effects of time awake across the 40 h CR (JDS scores: F12,78.9 = 1.91, p = 0.046; PosAVR: F12,80.9 = 3.32, p = 0.001; %TEC: F12,81 = 2.09, p = 0.026; NegAVR: F12,80.6 = 2.39, p = 0.011). No significant main effect for elapsed time awake was detected for BD. Ocular measures remained low during the first ~16 h of CR, after which all began to increase. Paired t tests showed that ocular measures were significantly higher after 24 to 25 h of wakefulness compared with the first 16 h (baseline) mean (JDS: t47.8 = 4.17, p < 0.001; TEC: t52.9 = 3.80, p < 0.001; PosAVR: t79.3 = 4.40, p < 0.001; NegAVR: t65.2 = 4.42, p < 0.001; Fig. 1, A-E). Following this peak, ocular measures decreased until approximately 36 h of CR before scores began to increase again.
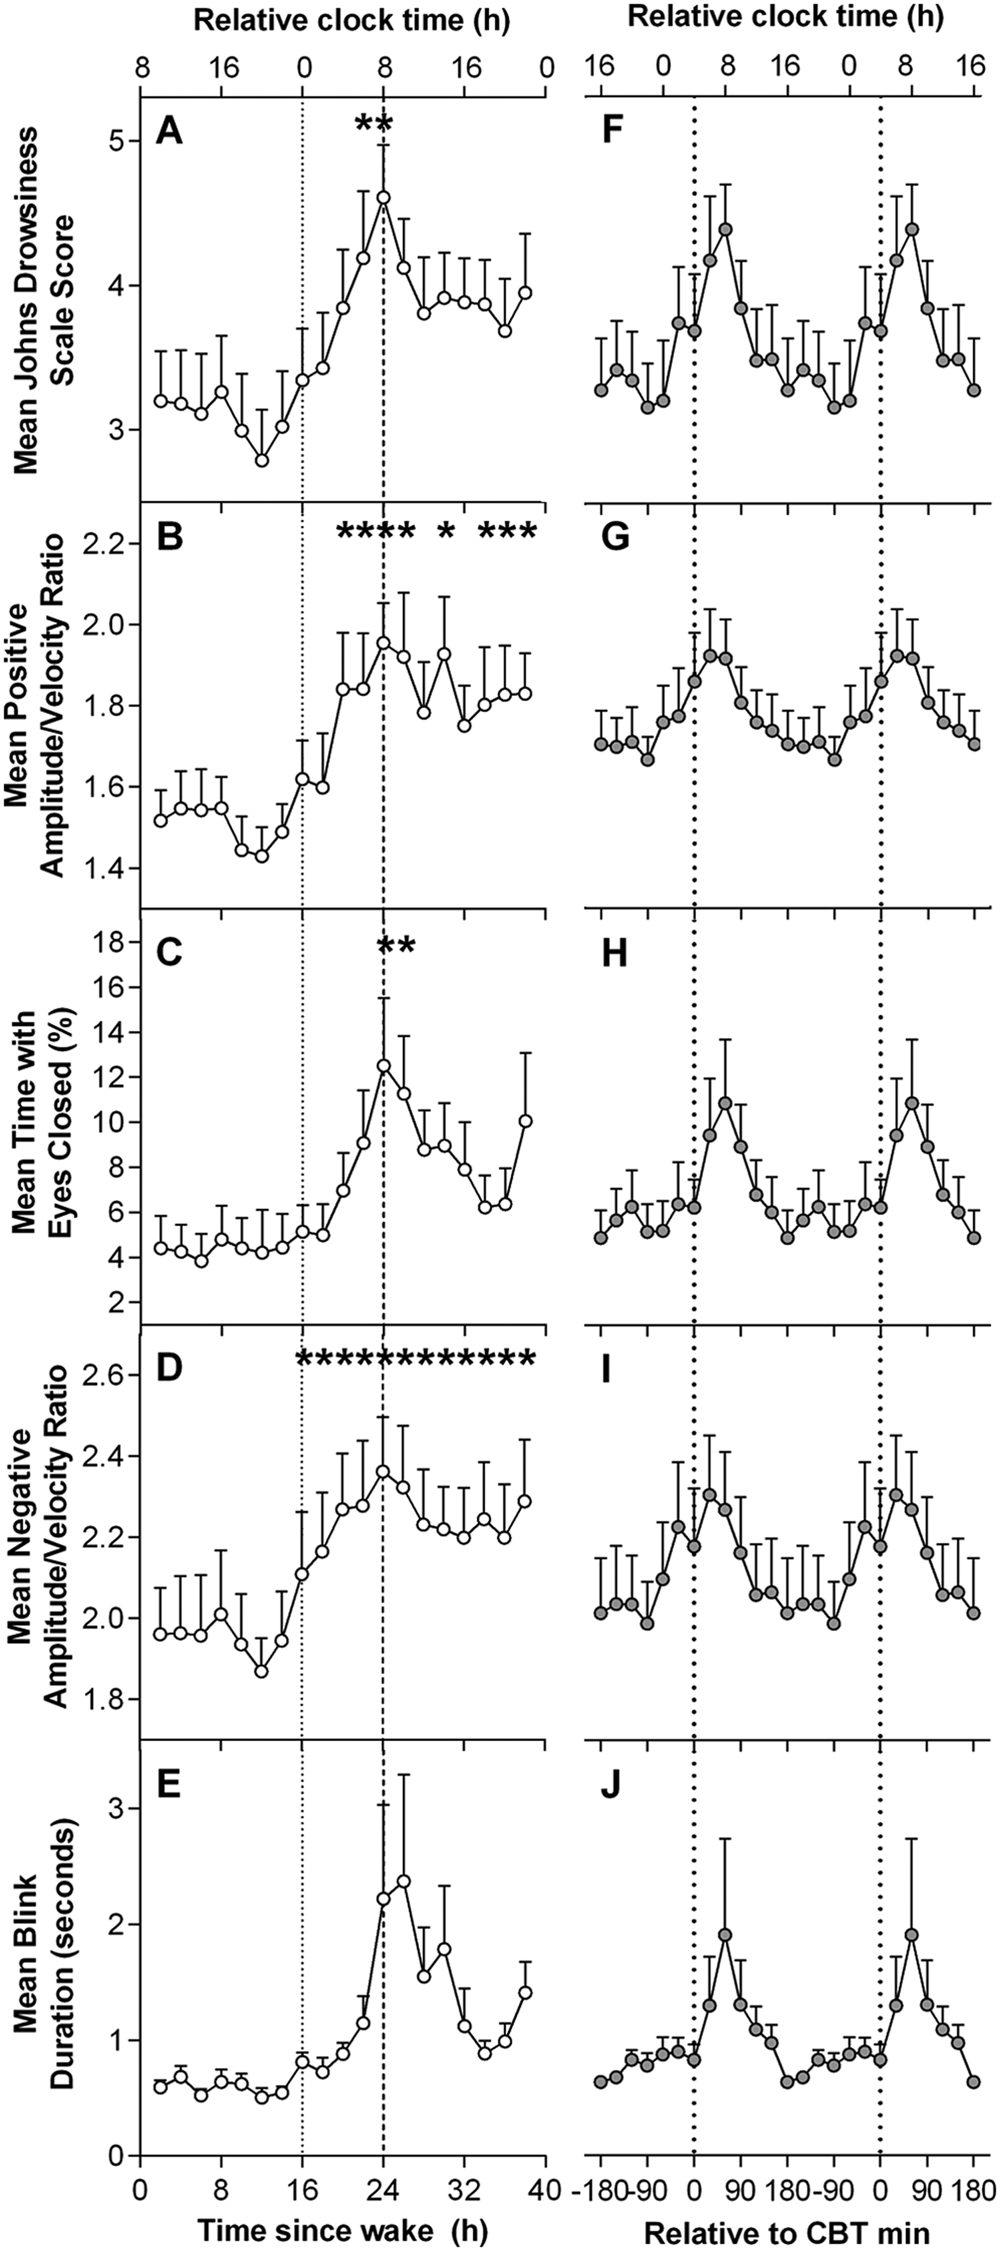
Time course of ocular sleepiness measures during a 40 h constant routine. (A-E) Grouped means of the time course of ocular measures. (F-J) Grouped means of ocular measures aligned by core body temperature (CBT) minimum. Relative clock time was calculated based on the mean scheduled wake time. *Significant difference compared with baseline 16 h mean with Bonferroni-Holm correction (p < 0.05).
Cosinor analysis with a fixed period of 24 h was used to assess the circadian component of each ocular variable (Fig. 1, F-J). All ocular measures demonstrated significant cosinor regression as determined by a non-zero slope (JDS adjusted r2 = 0.60, p < 0.001; PosAVR adjusted r2 = 0.71, p < 0.001; %TEC adjusted r2 = 0.51, p < 0.001; NegAVR adjusted r2 = 0.66; BD adjusted r2 = 0.40, p = 0.002).
Time Course of Performance, Subjective Sleepiness, and EEG Power Densities
The time courses of aPVT RT and lapses and KSS are presented in Figure 2. Data from the first 16 h were averaged to form one value in order to examine the effect of elapsed time awake. Linear mixed-model analyses detected significant main effects of time awake in KSS scores and aPVT RT and lapses (KSS: F12,87.8 = 6.54, p < 0.001; mean aPVT RT: F12,80.6 = 5.56, p < 0.001; aPVT lapses: F12,86.2 = 5.52, p < 0.001). KSS scores remained low over the first 16 h awake and peaked at 26 h of CR (Fig. 2A). Mean scores showed a transient decline and then remained relatively high for the remainder of the CR and did not recover to baseline levels. This difference was reflected in the paired t tests, which showed significantly higher KSS scores consistently over 17 to 40 h of wakefulness compared with first 16 h of wakefulness, peaking at 24 to 25 h of wakefulness (t49.1 = 7.55, p < 0.001). Paired t tests of aPVT RT and lapses revealed a similar pattern across the 40 h of wakefulness (Fig. 2, B and C), both peaking between 26 and 27 h (aPVT RT: t49.9 = 6.56, p < 0.001; aPVT lapses: t81.5 = 6.16, p < 0.001), followed by a decrease in RT and lapses after approximately 32 h of wakefulness.
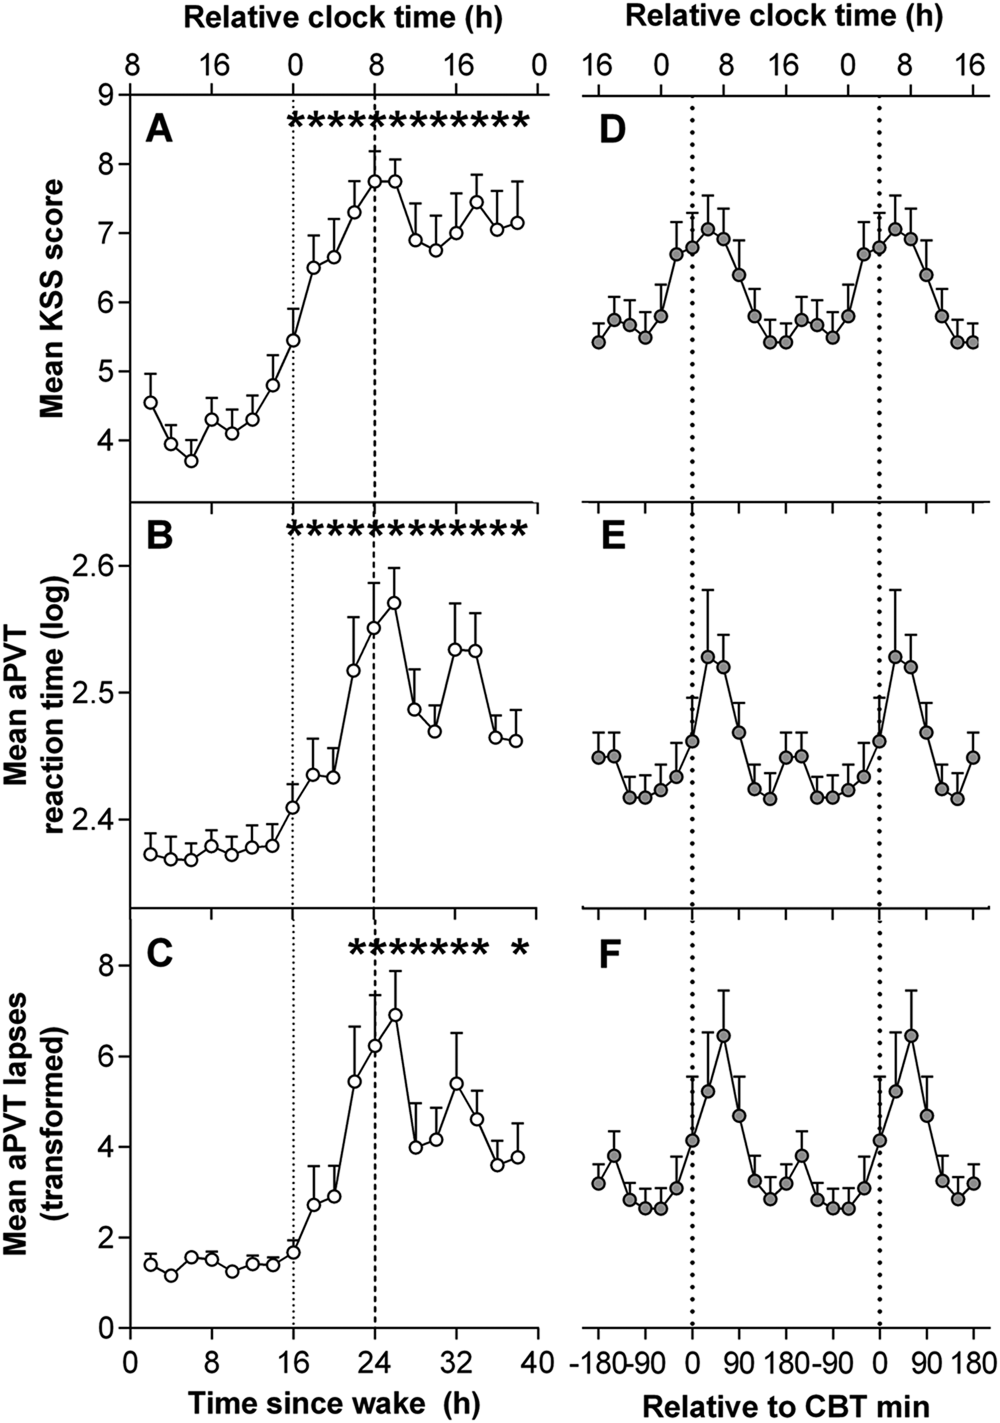
Time course of subjective sleepiness and performance during a 40 h constant routine. (A-C) Grouped means of the time course of subjective sleepiness and performance. (D-F) Grouped means of subjective sleepiness and performance aligned by core body temperature (CBT) minimum. Relative clock time was calculated based on the mean scheduled wake time. *Significant difference compared with baseline 16 h mean with Bonferroni-Holm correction (p < 0.05). KSS = Karolinska Sleepiness Scale; aPVT = auditory psychomotor vigilance task.
The time courses of EEG power density frequency bands are presented in Figure 3. Data from the first 16 h were averaged to form one value in order to examine the effect of elapsed time awake. Linear mixed-model analyses detected a significant main effect of elapsed time awake in delta-theta (F12,77 = 4.65, p < 0.001), theta-alpha (F12,81 = 4.97, p < 0.001), and beta (F12,89.8 = 2.36, p = 0.011) frequency bands. No significant main effect for elapsed time awake was detected for the high-alpha frequency band. Delta-theta and theta-alpha frequency bands remained low over the initial 16 h of CR, peaked after 26 to 27 h of wake (delta-theta: t88.8 = 4.96, p < 0.001; theta-alpha: t86.1 = 5.04, p < 0.001), and then did not decrease to baseline levels over the remaining hours. The beta frequency band demonstrated a similar pattern, with beta peaking after 24 to 25 h of wake (t105 = 4.14, p < 0.001).
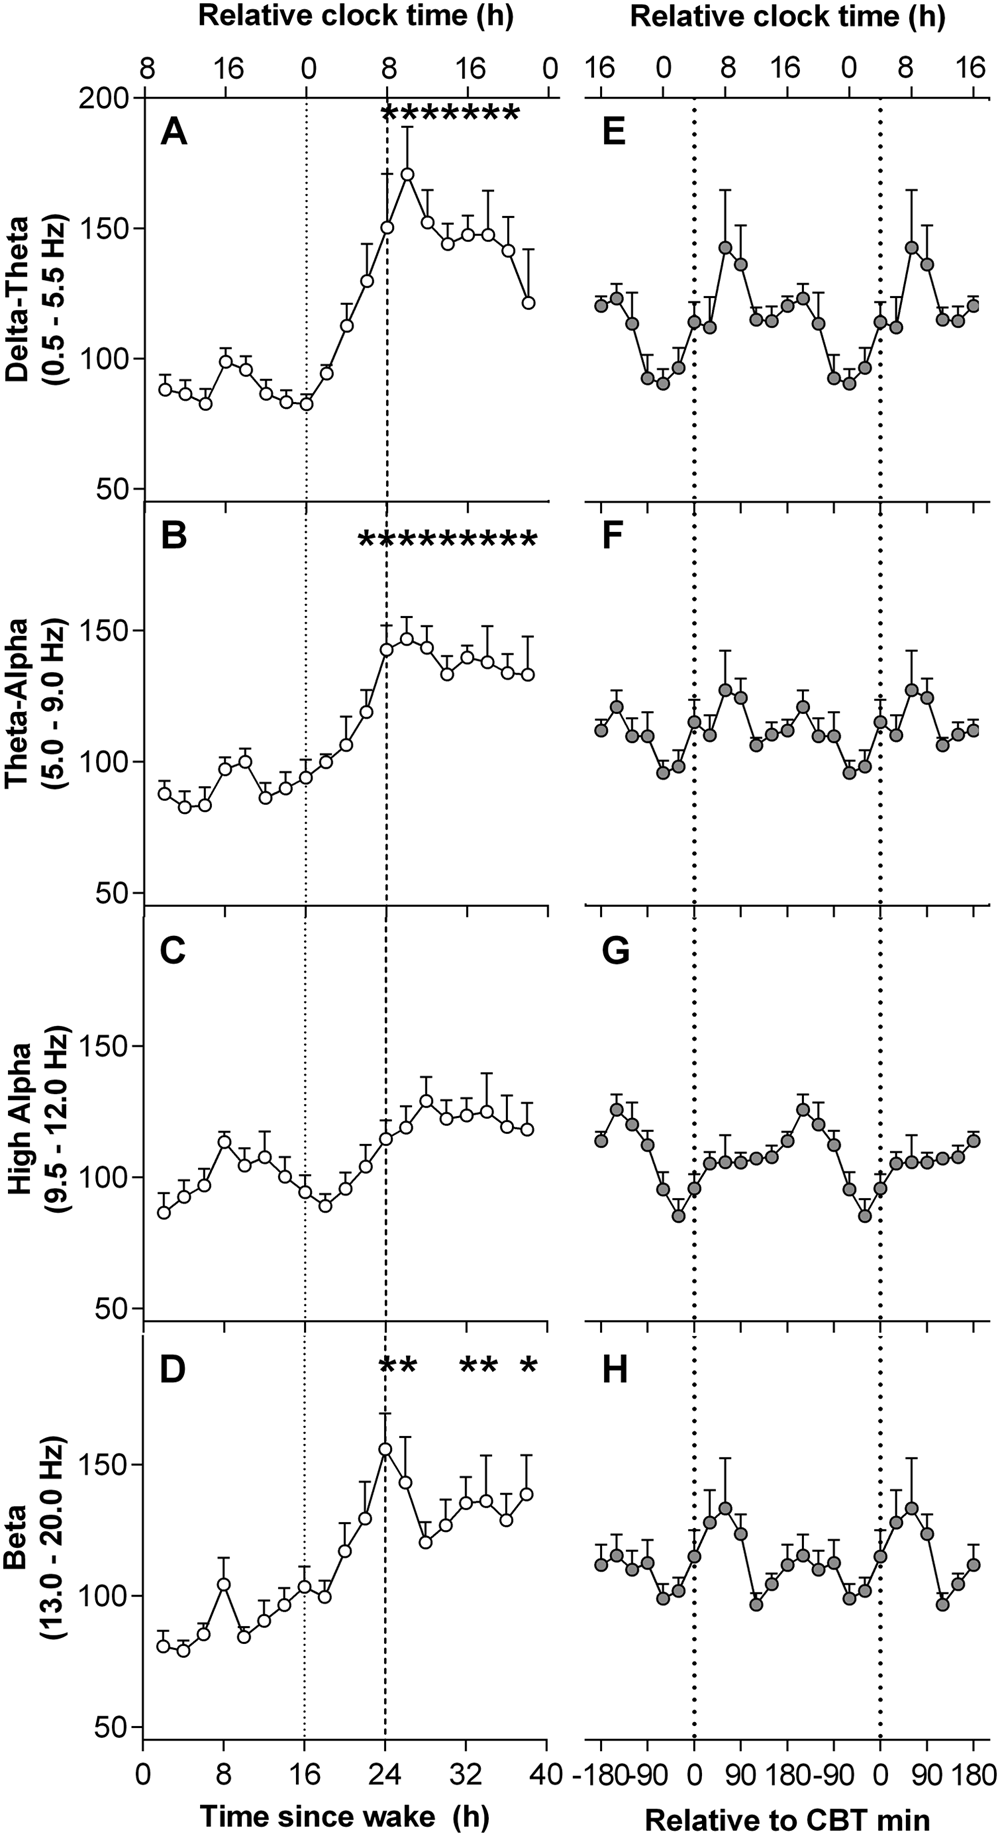
Time course of electroencephalograph (EEG) power during a 40 h constant routine. (A-D) Grouped means of the time course of EEG power densities. (E-H) Grouped means of EEG power densities aligned by core body temperature (CBT) minimum. Relative clock time was calculated based on the mean scheduled wake time. *Significant difference compared with baseline 16 h mean with Bonferroni-Holm correction (p < 0.05).
Correlations between Ocular Measures and Performance, Sleepiness, and EEG Power Densities
The phase relationships between subjective sleepiness, aPVT RT, aPVT lapses, and EEG power densities versus ocular measures were quantified by cross-correlation analyses. The peaks in KSS scores and the aPVT RT and lapses versus ocular measures demonstrated significant maximal correlations with all ocular measures at zero to –1 h lag (r range = 0.66-0.88; see supplementary online material [SOM] Fig. S1). Significant maximal correlation coefficients for EEG power density in the delta-theta range (0.5-5.5 Hz) and theta-alpha range (5.0-9.0 Hz) with all ocular measures were observed at lags of –1 h (r range = 0.66-0.81; see SOM Fig. S2), suggesting that ocular measures of sleepiness lag EEG power densities. Maximal correlation coefficients for EEG power density in the beta range (13.0-20.0 Hz) and ocular measures were observed at –1 to 1 h lag. No significant correlation coefficients were detected at any time lag for any of the ocular measures with EEG power density in the high-alpha range (9.5-12.0 Hz).
Predictability of Ocular Measures
To assess the performance of ocular measures and subjective sleepiness in predicting increases in aPVT lapses in performance, ROC curves for JDS, PosAVR, %TEC, NegAVR, and BD, and KSS were constructed (see SOM Table S1). aPVT lapses were dichotomized based on individual participants’ increase in lapses above thresholds defined as >25%, >50%, and >75% during the 40 h of wakefulness, relative to the first 16 h of wakefulness.
For predicting a 25% increase in aPVT lapses, ocular measures were not significantly different from KSS. Mean PosAVR yielded the greatest AUC (0.80 ± 0.03), with a cutoff of 1.70 correctly classifying a lapse in attention with 80% sensitivity and 76.5% specificity. KSS yielded similar results with correct classification sensitivity of 80.9% and specificity of 63.7% at reported KSS scores of 6.5 and above.
Similar results were produced for the 50% and 75% threshold, with PosAVR, JDS, KSS, and BD the strongest predictors. Mean PosAVR was a significantly stronger predictor of aPVT lapses compared with KSS at both 50% and 75% thresholds (p = .02). Mean PosAVR correctly classified lapses above the 50% and 75% thresholds with more than 80% sensitivity and 74% specificity. JDS scores demonstrated less precision with 71% sensitivity and 65% specificity at a cutoff of 4.2. BD showed similar predictability with 71% sensitivity and specificity at a cutoff of 658 msec mean blink duration.
Discussion
The study demonstrated the potential utility of ocular measures as indicators of sleepiness during extended wakefulness. From a well-rested state during 40 h of sustained wakefulness, ocular measures—JDS, amplitude-velocity ratios of the opening and closing phase of blinks, and the percentage of time spent with eyes closed—displayed homeostatic and circadian influences and correlated highly with other measures of sleepiness (KSS) and performance (aPVT). Ocular measures also demonstrated their ability to predict sleepiness-related attentional lapses with reasonable accuracy.
Elapsed time-dependent influences were observed in ocular measures across the 40 h of extended wakefulness. As expected, ocular-derived sleepiness measures, particularly JDS scores, PosAVR and NegAVR, and %TEC, increased with elapsed time awake, consistent with EEG-derived measures of sleepiness. A modest improvement in alertness in JDS, PosAVR, and NegAVR was noted at approximately 2000 h following 12 h of wakefulness, likely reflecting the wake maintenance zone (Shekleton et al., 2013). The results corroborate previous findings demonstrating significant increases in the duration of the eyelid closing, closed, and reopening phases of a blink with time awake, in line with other well-established sleepiness indicators (Åkerstedt et al., 2010; Anund et al., 2008; Caffier et al., 2003; Häkkänen et al., 1999; Schleicher et al., 2008; Stern et al., 1996). Mean blink duration per minute was not found to differ significantly with elapsed time awake. Similar results were found by Åkerstedt et al. (2010), who observed only a weak effect of time awake and time on task of blink duration. This finding may in part be due to the variability in blink duration with increasing sleepiness (Anund et al., 2008), and thus no significant differences are detected over time.
All ocular measures displayed strong temporal relationships with subjective sleepiness (KSS) levels and attentional performance (aPVT RT and lapses), with the exception of NegAVR and PosAVR. The latter two measures demonstrated lags of within 1 h from subjective sleepiness and attentional performance. This lag suggests that measures of AVR may be delayed in the detection of sleepiness compared with other measures, and it requires further examination with more frequent sampling to determine the true extent of any lag.
Strong cross-correlations between auditory attentional performance and ocular measures provide a unique examination of the ocular-sleepiness-performance paradigm. The use of a visual task to assess the utility of oculometrics as measures of sleepiness and associated performance impairment can be confounded by the occlusion of vision, whereby increases in the frequency and duration of eye closures will increase the number of task-related errors due to undetected stimuli (Anderson et al., 2010). Concurrently, greater eye closures will increase oculometric sleepiness ratings. By contrast herein, the use of an auditory task to assess performance circumvents this confounding factor of visual occlusion. The strong cross-correlations between oculometrics and an auditory performance task further substantiate the distinct link between ocular measures and attentional performance.
Overall, oculometrics demonstrated comparable increases in subjective sleepiness and attentional performance deterioration with time awake (Cajochen et al., 1999; Dijk et al., 1992). Participants who are sleep-deprived under controlled laboratory conditions have repeatedly demonstrated awareness of their physiological level of sleepiness, particularly when allowed the opportunity to sit quietly prior to providing their assessments (Åkerstedt et al., 2008; Horne and Burley, 2010; Yang et al., 2004). This relationship has not been found reliably outside the laboratory, however (Anund et al., 2009; Anund et al., 2008; Horne and Baulk, 2004). Furthermore, self-assessment of sleepiness in situations where people are often chronically and variably sleep restricted rather than totally sleep deprived does not reliably reflect neurobehavioral performance impairment (Van Dongen et al., 2003). Consequently, this incongruence limits the use of self-ratings of sleepiness in occupational settings, whereas objective sleepiness measures by nature do not rely upon subjective introspection. We suggest, therefore, that objective measures of sleepiness be further tested in field settings with the aim of developing systems to predict fitness to perform occupational and other safety critical tasks.
Cosinor analyses demonstrated circadian modulation in all ocular measures. JDS, PosAVR, %TEC, and NegAVR displayed strong circadian influences in addition to homeostatic patterns over time. Cross-correlations with EEG frequency bands provided indirect evidence for circadian- and wake-dependent modulation of these ocular measures. Aeschbach and colleagues (1999) demonstrated the influence of the circadian pacemaker and duration of time awake in the various EEG frequency bands across 40 h of sustained wakefulness. EEG frequencies below 9 Hz (delta, 0.75-4.0 Hz; theta, 4.25-8.0 Hz) displayed strong circadian and wake-dependent components, while higher frequencies above 12 Hz (beta, 13.25-20.0 Hz) displayed only a significant wake-dependent component (Aeschbach et al., 1999). In contrast, the high-alpha frequency band (10.25-12.0 Hz) displayed only a strong circadian component. All ocular measures correlated significantly with delta-theta (0.50-5.5 Hz), theta-alpha (5.0-9.0 Hz), and beta (13.0-20.0 Hz) frequency bands, providing additional evidence to suggest that ocular measures of sleepiness reflect both circadian and wake-dependent properties. The absence of a significant correlation of any ocular measures with the high-alpha frequency band (9.5-12.0 Hz) may suggest that ocular measures are more strongly influenced by a wake-dependent process relative to circadian variation. Supporting this suggestion is the lack of a significant effect of the high-alpha band with elapsed time awake. A forced desynchrony protocol could be used in future studies to quantify the relative contributions of the two processes to ocular measures. Nonetheless, the current data display a basis for homeostatic and circadian rhythms in ocular measures of sleepiness across extended wakefulness.
Overall, ocular measures demonstrated reasonable accuracy in predicting performance lapses above the threshold set during the first 16 h of wakefulness. This finding has applied implications to driving performance, which requires vigilance and psychomotor reaction (Doran et al., 2001; Jung et al., 2010; Van Dongen et al., 2003). Positive amplitude-velocity ratio (PosAVR) was the strongest predictor of performance lapses at threshold levels of 25%, 50%, and 75% in the current study, classifying lapses as well as, or better than, subjective reports of sleepiness. A number of recent studies have used the AVR of blinks as indicators of sleepiness and prediction of performance (Johns et al., 2007; Picot et al., 2010; Vadeby et al., 2010). The amplitude and velocity of a blink are known to be closely related; with increases in blink amplitude, there is also an increase in the velocity of the closing and reopening phase of a blink (Evinger et al., 1991). Johns and colleagues (2003, 2007) demonstrated increases in the AVR of the closing and reopening phases of a blink with sleep deprivation. Specifically, however, the blink reopening duration (Caffier et al., 2003) and reopening AVR (Johns et al., 2007) are believed to change more reliably with sleepiness compared with the closing phase properties. The current study found that both PosAVR (closing phase) and NegAVR (reopening phase) increased significantly from an alert state (<16 h of wakefulness) to a drowsy state (wakefulness of ≥16 h) in similar proportions. Previous studies, however, primarily found a proportionally greater difference in the duration and amplitude-velocity ratio in the reopening phase rather than in the closing phase (Caffier et al., 2003; Johns et al., 2007). In the current study, PosAVR was the strongest predictor of performance lapses, while NegAVR classified lapses with moderate accuracy. At all levels of impairment, PosAVR at a cutoff of 1.7 correctly detected attentional impairment with at least 80% sensitivity and correctly identified below-threshold performance no less than 74% of the time. Conversely, NegAVR demonstrated more modest detection levels near 67% and 62% sensitivity and specificity, respectively. A study by Vadeby and colleagues (2010) used both the closing and reopening AVR in the prediction of performance on a driving simulator. The study found that the use of peak opening phase AVR combined with driving performance measures was only a slightly better indicator of impairment than the peak closing AVR combined with driving performance measures. Additionally, Åkerstedt and colleagues (2010) found that the closing phase AVR was a predictor of severe subjective sleepiness (KSS ≥8) with 70% sensitivity and 73% specificity. PosAVR also demonstrated the strongest phase-locked relationships with subjective sleepiness ratings (KSS), reaction time (aPVT RT), and performance lapses (aPVT lapses) above all other ocular variables. The closing phase AVR should be considered as a potentially useful indicator of sleepiness levels, in line with other indicators of sleep onset.
The JDS score, a composite score of sleepiness levels by a propriety algorithm of ocular indicators such as AVR and blink durations, demonstrated reasonable accuracy in detecting performance lapses. Although this combination of ocular measures did not yield as high sensitivity and specificity as PosAVR, it was not significantly different from self-reported sleepiness. The recommended cutoff level of 4.5 suggested by Optalert is indicated as a cautionary level of sleepiness, with an increased risk of experiencing severe lane excursions (Stephan et al., 2006). The current study demonstrated that at a JDS score cutoff of 4.2, lapses over the 50% threshold were correctly classified with 71.4% sensitivity and 64.8% specificity. Similar results were seen at the 25% and 75% thresholds. Higher JDS scores may yield higher sensitivity (correctly classifying lapses) yet at the expense of specificity (false positives). Within a driving context, high sensitivity and specificity are essential to correctly identify a driver’s risk of attentional lapses, which may affect driving performance and safety, but also to correctly identify no risk in order to maintain a driver’s confidence in the accuracy and safety of a sleepiness detection system.
A number of studies have found that blink duration and the percentage of time with eyes closed are promising measures of sleepiness level (Anund et al., 2009; Anund et al., 2008; Caffier et al., 2003; Chua et al., 2012; Häkkänen et al., 1999; Ingre et al., 2006; Wierwille and Ellsworth, 1994). Chua and colleagues (2012) found that PERCLOS (percentage of eyelid closure over the pupil over time) was a strong predictor of psychomotor vigilance task lapses at 25%, 50%, and 75% thresholds and by comparison outperformed self-reported sleepiness at all threshold levels. The current study, however, did not find %TEC (a measure of the percentage of eye closure, similar to PERCLOS) to be the strongest indictor of performance. This may be related to two important differences in methods: the use of visual psychomotor vigilance task in the Chua study, and slight differences in eye closure measurement, with PERCLOS a measure of the percentage per minute that the eyes are at least 80% closed, rather than full eye closures as used here. Morris and Miller (1996) found high correlations between blink durations and long eye closure rates (eye closures >500 msec/min) with errors on a flight maneuvers task in sleep-deprived pilots. Stepwise regression analysis revealed that blink durations and long eye closure rates were able to significantly predict error on the flight task. In comparison to other available ocular measures, however, BD and %TEC were not the strongest indicators of performance in the current study, although they classified lapses with reasonable accuracy.
Although the sensitivity and specificity levels found may not reach clinical significance, they display the positive trends in a laboratory setting of the ability of ocular measures to detect attentional lapses. Further studies should build on the physiological basis of ocular measures and their potential to detect the performance decrements assessed here.
While the study demonstrated an association between ocular measures and both neurobehavioral performance and sleepiness, the sample involved only 10 young healthy males, and as such, results should be interpreted with caution in relation to women and older adults. In a laboratory setting, ocular measures displayed homeostatic and circadian changes consistent with measures used to assess performance, sleepiness, and attention across the spectrum of wakefulness. Ocular indices further demonstrated their potential in detecting lapses in performance on a sustained attention task that has relevance to driving and other safety-sensitive activities. This study provides a deeper understanding of the changes in ocular measures in parallel with widely used measures of sleepiness, alertness, and performance in the laboratory, and it has wider implications with regard to the use of ocular measures in sleepiness detection systems in operational settings.
Footnotes
Acknowledgements
The authors thank Peter Dearborn, research staff, and research participants at the Division of Sleep Medicine, Brigham and Women’s Hospital; the technical, dietary, nursing and medical staff at the Center for Clinical Investigation at the Brigham and Women’s Hospital, and Jonathan Williams, MD, for medical supervision; and Dr. Gershon Spitz at Monash University for statistical analysis assistance.
This work was supported by the National Space Biomedical Research Institute (HPF01301). The content is solely the responsibility of the authors and does not necessarily represent the official views of the National Center for Research Resources or the National Institutes of Health. The project described was supported by Brigham and Women’s Hospital General Clinical Research Center grant M01 RR02635 and by Clinical Translational Science Award UL1RR025758 to Harvard University and Brigham and Women’s Hospital from the National Center for Research Resources. Optalert equipment was supported by grant FA9550-05-1-0197 (Czeisler) and grant FA9550-07-1-0242 (Czeisler) from the Air Force Office of Scientific Research (AFOSR): Defense University Research Instrumentation Program (DURIP). S.A.R. and S.W.L. were supported in part by the National Space Biomedical Research Institute through NASA NCC 9-58. S.F. was supported by student funding provided by the Australian Victoria Government Fellowship. K.E.C. was supported in-part by an unrestricted fellowship to SWL from Optalert Pty Ltd.
Conflict of Interest Statement
S.W.L. reports that he received 2 investigator-initiated research grants from the ResMed Foundation and an unrestricted equipment gift from ResMed Inc., in support of the studies described in this article; receiving consulting fees from Apollo Lighting, Naturebright, Sound Oasis, and Wyle Integrated Science and Engineering, and federally funded projects at Brigham and Women’s Hospital, Thomas Jefferson University, and Warwick Medical School; lecture fees from Takeda Pharmaceuticals North America, I Slept Great/Euforma, LLC, and Emergency Social Services Association Conference, UK; unrestricted equipment gifts from Philips Lighting and Bionetics Corporation; an unrestricted monetary gift to support research from Swinburne University of Technology, Australia; a fellowship gift from Optalert Pty Ltd, Melbourne, Australia; advance author payment and royalties from Oxford University Press, and honoraria from Servier Inc. for writing an article for Dialogues in Clinical Neuroscience and from AMO Inc., for writing an educational monograph, neither of which refer to the companies’ products; honoraria or travel and accommodation support for invited seminars, conference presentations or teaching from the Second International Symposium on the Design of Artificial Environments, Eighth International Conference on Managing Fatigue, American Academy of Sleep Medicine, American Society for Photobiology, Apollo Lighting, Bar Harbor Chamber of Commerce, Bassett Research Institute, Canadian Sleep Society, Committee of Interns and Residents, Coney Island Hospital, FASEB, Harvard University, Illinois Coalition for Responsible Outdoor Lighting, International Graduate School of Neuroscience, Japan National Institute of Occupational Safety and Health, Lightfair, National Research Council Canada, New York Academy of Sciences, North East Sleep Society, Ontario Association of Fire Chiefs, Philips Lighting, Thomas Jefferson University, University of Montreal, University of Tsukuba, University of Vermont College of Medicine, Utica College, Vanda Pharmaceuticals, Velux, Warwick Medical School, Woolcock Institute of Medical Research, and Wyle Integrated Science and Engineering (NASA); investigator-initiated research grants from Respironics Inc., Philips Lighting, Apollo Lighting, and Alcon Inc.; and a service agreement and sponsor-initiated research contract from Vanda Pharmaceuticals. S.W.L. also holds a process patent for the use of short-wavelength light for resetting the human circadian pacemaker and improving alertness and performance, which is assigned to the Brigham and Women’s Hospital per hospital policy, and has received revenue from a patent on the use of short-wavelength light, which is assigned to the University of Surrey. In addition, S.W.L. has served as a paid expert witness on behalf of 2 public bodies on arbitration panels related to sleep, circadian rhythms, and work hours.
C.A. has served as consultant to the Rail, Bus and Tram Union through an agreement between Monash University and the Rail, Bus and Tram Union. She has also received research support from VicRoads, and research funds from Sanofi-Aventis. She has received lecturing fees from Brown Medical School/Rhode Island Hospital and Ausmed. Her affiliated institution has received equipment donations or other support from Optalert.
S.F.’s institution has received equipment donations or other support from Optalert.
K.E.C. reports being an Optalert employee in the past, prior to her involvement in the study. She has not been an employee of Optalert during the study or after its study conclusion.
S.A.R. received research funding from Government of Ontario/Pharmacia Canada Inc./Genesis Research Foundation/OBGYN Graduate Scholarship in Science and Technology at the University of Toronto, Faculty of Medicine and the Frederick Banting and Charles Best Canada Graduate Scholarships Doctoral Award from Canadian Institutes of Health Research. S.A.R. has Intellectual Property (IP) filed for prevention of circadian rhythm disruption by using optical filters. S.A.R. owns shares in ZiircLight Inc.
S.M.W.R. reports that he has served as a consultant through his institution to Vanda Pharmaceuticals, Philips Respironics, EdanSafe, The Australian Workers’ Union, and National Transport Commission, and has through his institution received research grants and/or unrestricted educational grants from Vanda Pharmaceuticals, Takeda Pharmaceuticals North America, Philips Lighting, Philips Respironics, Cephalon, and ResMed Foundation, and reimbursements for conference travel expenses from Vanda Pharmaceuticals. His affiliated institution has received equipment donations or other support from Optalert, Compumedics, and Tyco Healthcare. He has also served as an expert witness and/or consultant to shift work organizations.
Notes
References
Supplementary Material
Please find the following supplemental material available below.
For Open Access articles published under a Creative Commons License, all supplemental material carries the same license as the article it is associated with.
For non-Open Access articles published, all supplemental material carries a non-exclusive license, and permission requests for re-use of supplemental material or any part of supplemental material shall be sent directly to the copyright owner as specified in the copyright notice associated with the article.