
Abstract
In mammals, circadian rhythms in peripheral organs are impaired when animals are maintained in abnormal environmental light-dark cycles such as constant light (LL). This conclusion is based on averaged data from groups of experimental animals sacrificed at each time point. To investigate the effect of LL housing on the peripheral clocks of individual mice, an in vivo imaging system was used to observe the circadian bioluminescence rhythm in peripheral tissues of the liver, kidney, and submandibular salivary gland in PER2::LUCIFERASE knock-in mice. Using this technique, we demonstrated that the majority of individual peripheral tissues still had rhythmic oscillations of their circadian clocks in LL conditions. However, LL housing caused decreased amplitudes and a broad distribution of peak phases in PER2::LUCIFERASE oscillations irrespective of the state of the animals’ behavioral rhythmicity. Because both scheduled feeding and scheduled exercise are effective recovery stimuli for circadian clock deficits, we examined whether scheduled feeding or scheduled exercise could reverse this impairment. The results showed that scheduled feeding or exercise could not restore the amplitude of peripheral clocks in LL. On the other hand, the LL-induced broad phase distribution was reversed, and peak phases were entrained to a specific time point by scheduled feeding but only slightly by scheduled exercise. The present results demonstrate that LL housing impairs peripheral circadian clock oscillations by altering both amplitude and phase in individual mice. The broad distribution of clock phases was clearly reversed by scheduled feeding, suggesting the importance of scheduled feeding as an entraining stimulus for impaired peripheral clocks.
Circadian clock systems are important for the control of multiple physiological functions and rhythms, including sleep-wakefulness, feeding, autonomic nervous activity, and endocrine release (King and Takahashi, 2000). In the mammalian circadian system, a central clock in the suprachiasmatic nucleus (SCN) of the anterior hypothalamus coordinates peripheral oscillators that are present in most peripheral organs (Mohawk et al., 2012). Maintaining synchrony between the SCN and peripheral oscillators is important for normal biological functions, and disruption of this synchrony is correlated with several severe pathologies (Filipski et al., 2004; Mahoney, 2010; Marcheva et al., 2010; Schernhammer et al., 2001). At the molecular level, both the SCN and peripheral oscillators consist of interconnected positive and negative transcription-translation feedback loops that regulate the 24-h expression patterns of clock genes (Dunlap, 1999; Reppert and Weaver, 2002; Zhang and Kay, 2010). Clock and Bmal1 are positive elements of the feedback loop, whereas Per1, Per2, Cry1, and Cry2 are negative elements.
Peripheral clocks receive information from the SCN through multiple pathways, including the autonomic nervous system, endocrine signals, and body temperature rhythms (Brown et al., 2002; Buhr et al., 2010; Guo et al., 2005; Ishida et al., 2005; Le Minh et al., 2001; Terazono et al., 2003; Menaker et al., 2013). The lack of SCN signaling to peripheral clocks leads to arrhythmicity in circadian functions such as plasma glucose, body temperature, locomotion, and stool output (Cailotto et al., 2005; Warren et al., 1994; Malloy et al., 2012). Arrhythmicity can be caused by SCN lesions or prolonged exposure to constant light (LL) or irregular and frequent shifting of the light-dark (LD) cycle (Polidarová et al., 2011). Exposure to LL results in a gradual loss of overt circadian rhythms in locomotor activity and body temperature (Moriya et al., 2000; Wideman and Murphy, 2009; Chiesa et al., 2010). Although Polidarová et al. (2011) have reported that rat hepatic, duodenal, and colonic peripheral clocks were also disturbed by LL housing, their data were not derived from individual animals but rather by averaging data from several rats at each sampling time. If the circadian rhythms of the peripheral clocks across animals are out of phase, then averaging circadian rhythm data from several animals at each time point may flatten the rhythm. A longitudinal circadian profile of SCN clock gene expression or firing rhythm recorded in vivo or in vitro in individual mice suggests that LL housing affects both the amplitude and phase of the SCN clock (Ohta et al., 2005; Coomans et al., 2013). We recently developed a method using an in vivo imaging system (IVIS) to detect the circadian bioluminescence rhythm of peripheral organs, including the liver, kidney, and submandibular gland, in individual PER2::LUC knock-in mice (Tahara et al., 2012). Therefore, the current study aimed to use IVIS to elucidate the PER2 expression profiles in peripheral organs of individual mice exposed to LL.
Scheduled feeding (SF) and exercise are powerful synchronizers of peripheral clocks. The SF regimen entrains circadian clocks in the liver, kidney, lung, heart, salivary gland, and pancreas (Challet et al., 2003; Damiola et al., 2000; Hara et al., 2001; Kobayashi et al., 2004; Schibler et al., 2003; Stokkan et al., 2001; Kuroda et al., 2012). The SF regimen reverses not only SCN clock impairment but also peripheral clock impairment under LL conditions. However, the magnitude of the reversal varies with clock gene (Per1, Per2, Bmal1, and Rev-erba) and organ/tissue (liver, duodenum, and colon) (Nováková et al., 2011; Polidarová et al., 2011). Scheduled exercise (SE) or stimulated activity induced direct and immediate changes in clock gene expression and neuronal firing in the SCN (Schaap and Meijer, 2001; Houben et al., 2009; Maywood et al., 1999), as well as clock gene expression in peripheral tissues (Schroeder et al., 2012). However, there have been no studies on the effect of SE on LL-induced impairment of circadian systems in individual mice. Thus, the purpose of the current study is to determine whether exposure to LL disrupts peripheral circadian clocks in a longitudinal evaluation of individual animals, as well as whether SF or SE can reverse such disruption.
Materials and Methods
Ethics Statement
All experimental protocols were approved by the Committee for Animal Experimentation of the School of Science and Engineering at Waseda University (Permission Protocol Nos. 2013-A059, 2013-A060). Experiments were performed in accordance with the law (No. 105) and notification (No. 6) of the Japanese government.
Animals
To facilitate the penetration of bioluminescence through skin, we used male heterozygous PER2::LUC knock-in institute of cancer research (ICR) mice aged 9 to 15 weeks (at the start of experiment), backcrossed more than 5 times with PER2::LUC C57BL/6J mice (courtesy of Dr. Joseph Takahashi, UT Southwestern Medical Center, Dallas, TX) and ICR mice as described previously (Kuroda et al., 2012; Tahara et al., 2012). Mice were bred and maintained on a fixed, local-time light-dark cycle (lights-on from 0800 to 2000 h) at a room temperature of 25 ± 0.5 °C, humidity of 60% ± 5%, and cage light intensity of 200 lux during the light period and 0.1 lux during the dark period. Prior to the experiments, mice were fed a standard diet (MF; Oriental Yeast Co. Ltd., Tokyo, Japan) and water ad libitum.
Experimental Design
Mice were separated into 4 groups. Mice in the first group (LD) were housed under 12-h LD conditions (lights-on from 0800 to 2000 h) for 5 weeks (n = 17). Mice in the second group (LL) were exposed to LL conditions for 5 weeks (n = 39; n = 21 under LL housing for the SF experiment, n = 18 under LL housing for the SE experiment). Because of the limited number of chambers, 25 mice carrying PER2::LUC were moved to individual chambers to record their locomotor activity under LL housing. Other mice were housed in groups with 2 to 4 mice per cage. For the third group (LL + SF group), the mice were housed under LL conditions for 5 weeks, and SF (12 h, from 2000 to 0800 h) was conducted during the last week in LL housing (n = 12). Mice in the fourth group (LL+ SE group) were housed under LL conditions for 5 weeks, and SE (1 h, from 1200 to 1300 h) was carried out during the last 4 days in LL housing (n = 8).
Scheduled Feeding and Scheduled Exercise
Mice assigned to the SF schedule were housed individually in separate cages, and each cage was equipped with a timer-operated automatically rotating food dispenser (Natsume Seisakusho Co., Ltd., Tokyo, Japan) that the mouse could access for 12 h. SF mice were kept in the same cage during food-access time. SE mice were removed from their cages and placed in light boxes for treadmill exercise. SE mice were trained on the treadmill for 10 min 7 days prior to initiating the experimental treatment. SE was then carried out for 60 min using a treadmill with a speed of 12 m/min (Exer-6R treadmill; Columbus Instruments, Columbus, OH). Control mice for SF or SE were removed from their home cages for the same period under LL conditions.
Locomotor Activity Analysis
General locomotor activity was recorded with an infrared radiation sensor (F5B; Omron, Tokyo, Japan) according to the method of our previous study (Tahara et al., 2012). Double-plotted actograms of locomotor activity were recorded in 6-min epochs using ClockLab software (Actimetrics Ltd., Wilmette, IL). Chi-squared periodogram analysis was used to examine the rhythmicity of behavioral data (the last 7 days of LD or LL housing) with the threshold (p = 0.001) and the period (20-30 h).
In Vivo Monitoring of PER2::LUC Rhythms
We monitored the PER2::LUC activity rhythm waveform in peripheral tissues (kidney, liver, and submandibular salivary gland) of mice using IVIS. In vivo imaging was performed as previously described (Tahara et al., 2012; Kuroda et al., 2012) using an IVIS kinetics system (Caliper Life Sciences, Hopkinton, MA). Mice were placed inside a black box and anesthetized with isoflurane (Mylan, Inc., Tokyo, Japan) and concentrated oxygen (SO-005B; Sanyo Electronic Industries Co. Ltd., Okayama, Japan) using a gas anesthesia system (XGI-8; Caliper Life Sciences). While under anesthesia, mice were injected subcutaneously with D-luciferin potassium salt (Promega, Madison, WI) in the back near the neck, at a dosage of 15 mg/kg (30 mg in 10 mL phosphate-buffered saline [PBS]; 0.05 mL/10 g body weight). Images were taken in the dorsal view for the kidney 8 min after injection and in the ventral view for the liver and submandibular gland 10 min after injection. Images were captured with a 1-min exposure time. For each time point, the bioluminescence image was merged with the gray-scale image.
Images were obtained 6 times per day at 4-h intervals in mice housed under LD, LL, LL + SF, and LL + SE conditions. Data on some mice housed under LD conditions were recorded at local times of 1300, 1700, 2100, 0100, 0500, and 0900 h, and data on other mice housed under LD or LL conditions were recorded at local times of 1700, 2100, 0100, 0500, 0900, and 1300 h. Mice were returned to their home cages after each experiment. The total time under isoflurane anesthesia, from which the mice recovered quickly, was approximately 20 min per experiment. Anesthesia and bioluminescence analysis every 4 h did not affect the behavior of the mice or the luciferase activity in the peripheral tissues (Tahara et al., 2012).
Analysis of Data from In Vivo Monitoring
Data from in vivo monitoring were analyzed as described previously (Tahara et al., 2012). The bioluminescence emitted from each organ was calculated using Living Image 3.2 software (Caliper Life Sciences). The region of interest for individual organs was set to the same shape and size throughout all experiments. In the case of the kidneys, data from the right and left kidneys were combined before analysis. The average value (photon/sec) from the 6 time points for each day was designated as 100%, and the bioluminescence rhythm for the entire day was expressed as a percentage of each set of 6 time points for the individual organs.
Statistical Analysis
Data are expressed as means ± SEM values. Statistical analysis was performed using GraphPad Prism version 6.03 (GraphPad Software, San Diego, CA). We determined whether data showed a normal or nonnormal distribution and equal or biased variance using the D’Agostino-Pearson/Kolmogorov-Smirnov test and Bartlett’s test or F test, respectively. Parametric and nonparametric analyses were conducted using the Student t test and the Mann-Whitney test, respectively. Analysis of 2 proportions was performed with Fisher’s exact test (JavaScript Star ver. 5.5.7j) and 2-sided p values are shown. Rhythmic or arrhythmic, peak phase, and amplitude of PER2::LUC data were determined using the single cosine fitting analysis (Acro.exe, version 3.5, designed by Dr. Refinetti) (Tahara et al., 2012) with a 24-h period, and the data with p < 0.05 were considered rhythmic oscillations. Peak phase and amplitude were further analyzed using only data with significant rhythmicity.
Results
Locomotor Activity and Peripheral PER2::LUC Rhythms in LD and LL
LL-induced free-running behavior appeared after starting the LL condition. After 4 weeks of LL housing (Fig. 1 and Suppl. Fig. S1), 9 mice became arrhythmic (LL#1 in Fig. 1A), and 16 mice were still rhythmic (LL#2 in Fig. 1A). Peripheral PER2::LUC rhythms in the kidney, liver, and submandibular salivary gland were monitored after 4 weeks of LL housing (Fig. 1C). To understand the relationship between behavioral rhythmicity and peripheral rhythmicity, we divided the LL mice into 2 groups according to the arrhythmic (n = 9) or rhythmic (n = 16) behavior evaluated by chi-squared periodogram analysis (Suppl. Fig. S1). Comparing the 2 groups (arrhythmic or rhythmic behavior), we found no differences in PER2::LUC rhythms corresponding to the number of rhythmic tissues (Suppl. Fig. S1A), bioluminescence rhythm pattern (Suppl. Fig. S1B), amplitude (Suppl. Fig. S1C), or phase distribution (Suppl. Fig. S1D) in all tissues. Rhythmicity of peripheral clock oscillations was evaluated by cosinor analysis. The majority of peripheral tissues showed rhythmic PER2::LUC oscillations in LL: in kidney (rhythmic 21/25 for LL, 17/17 for LD, p > 0.05) and liver (rhythmic 22/25 for LL, 17/17 for LD, p > 0.05), while in the submandibular gland, a significantly larger number were arrhythmic in LL (rhythmic 18/25 for LL, 17/17 for LD, p < 0.05 by Fisher’s exact probability test) (Table 1). When LD (n = 17) peripheral clocks were compared with LL peripheral clocks showing rhythmicity by cosinor analysis (n = 21 for kidney, n = 22 for liver, and n = 18 for submandibular gland), the amplitude of PER2::LUC rhythms in LL was significantly decreased compared to that in LD in all tissues (Fig. 2B). In addition, a large distribution of phases of PER2::LUC rhythms in the LL condition appeared in all tissues compared with the LD group (Fig. 2C).
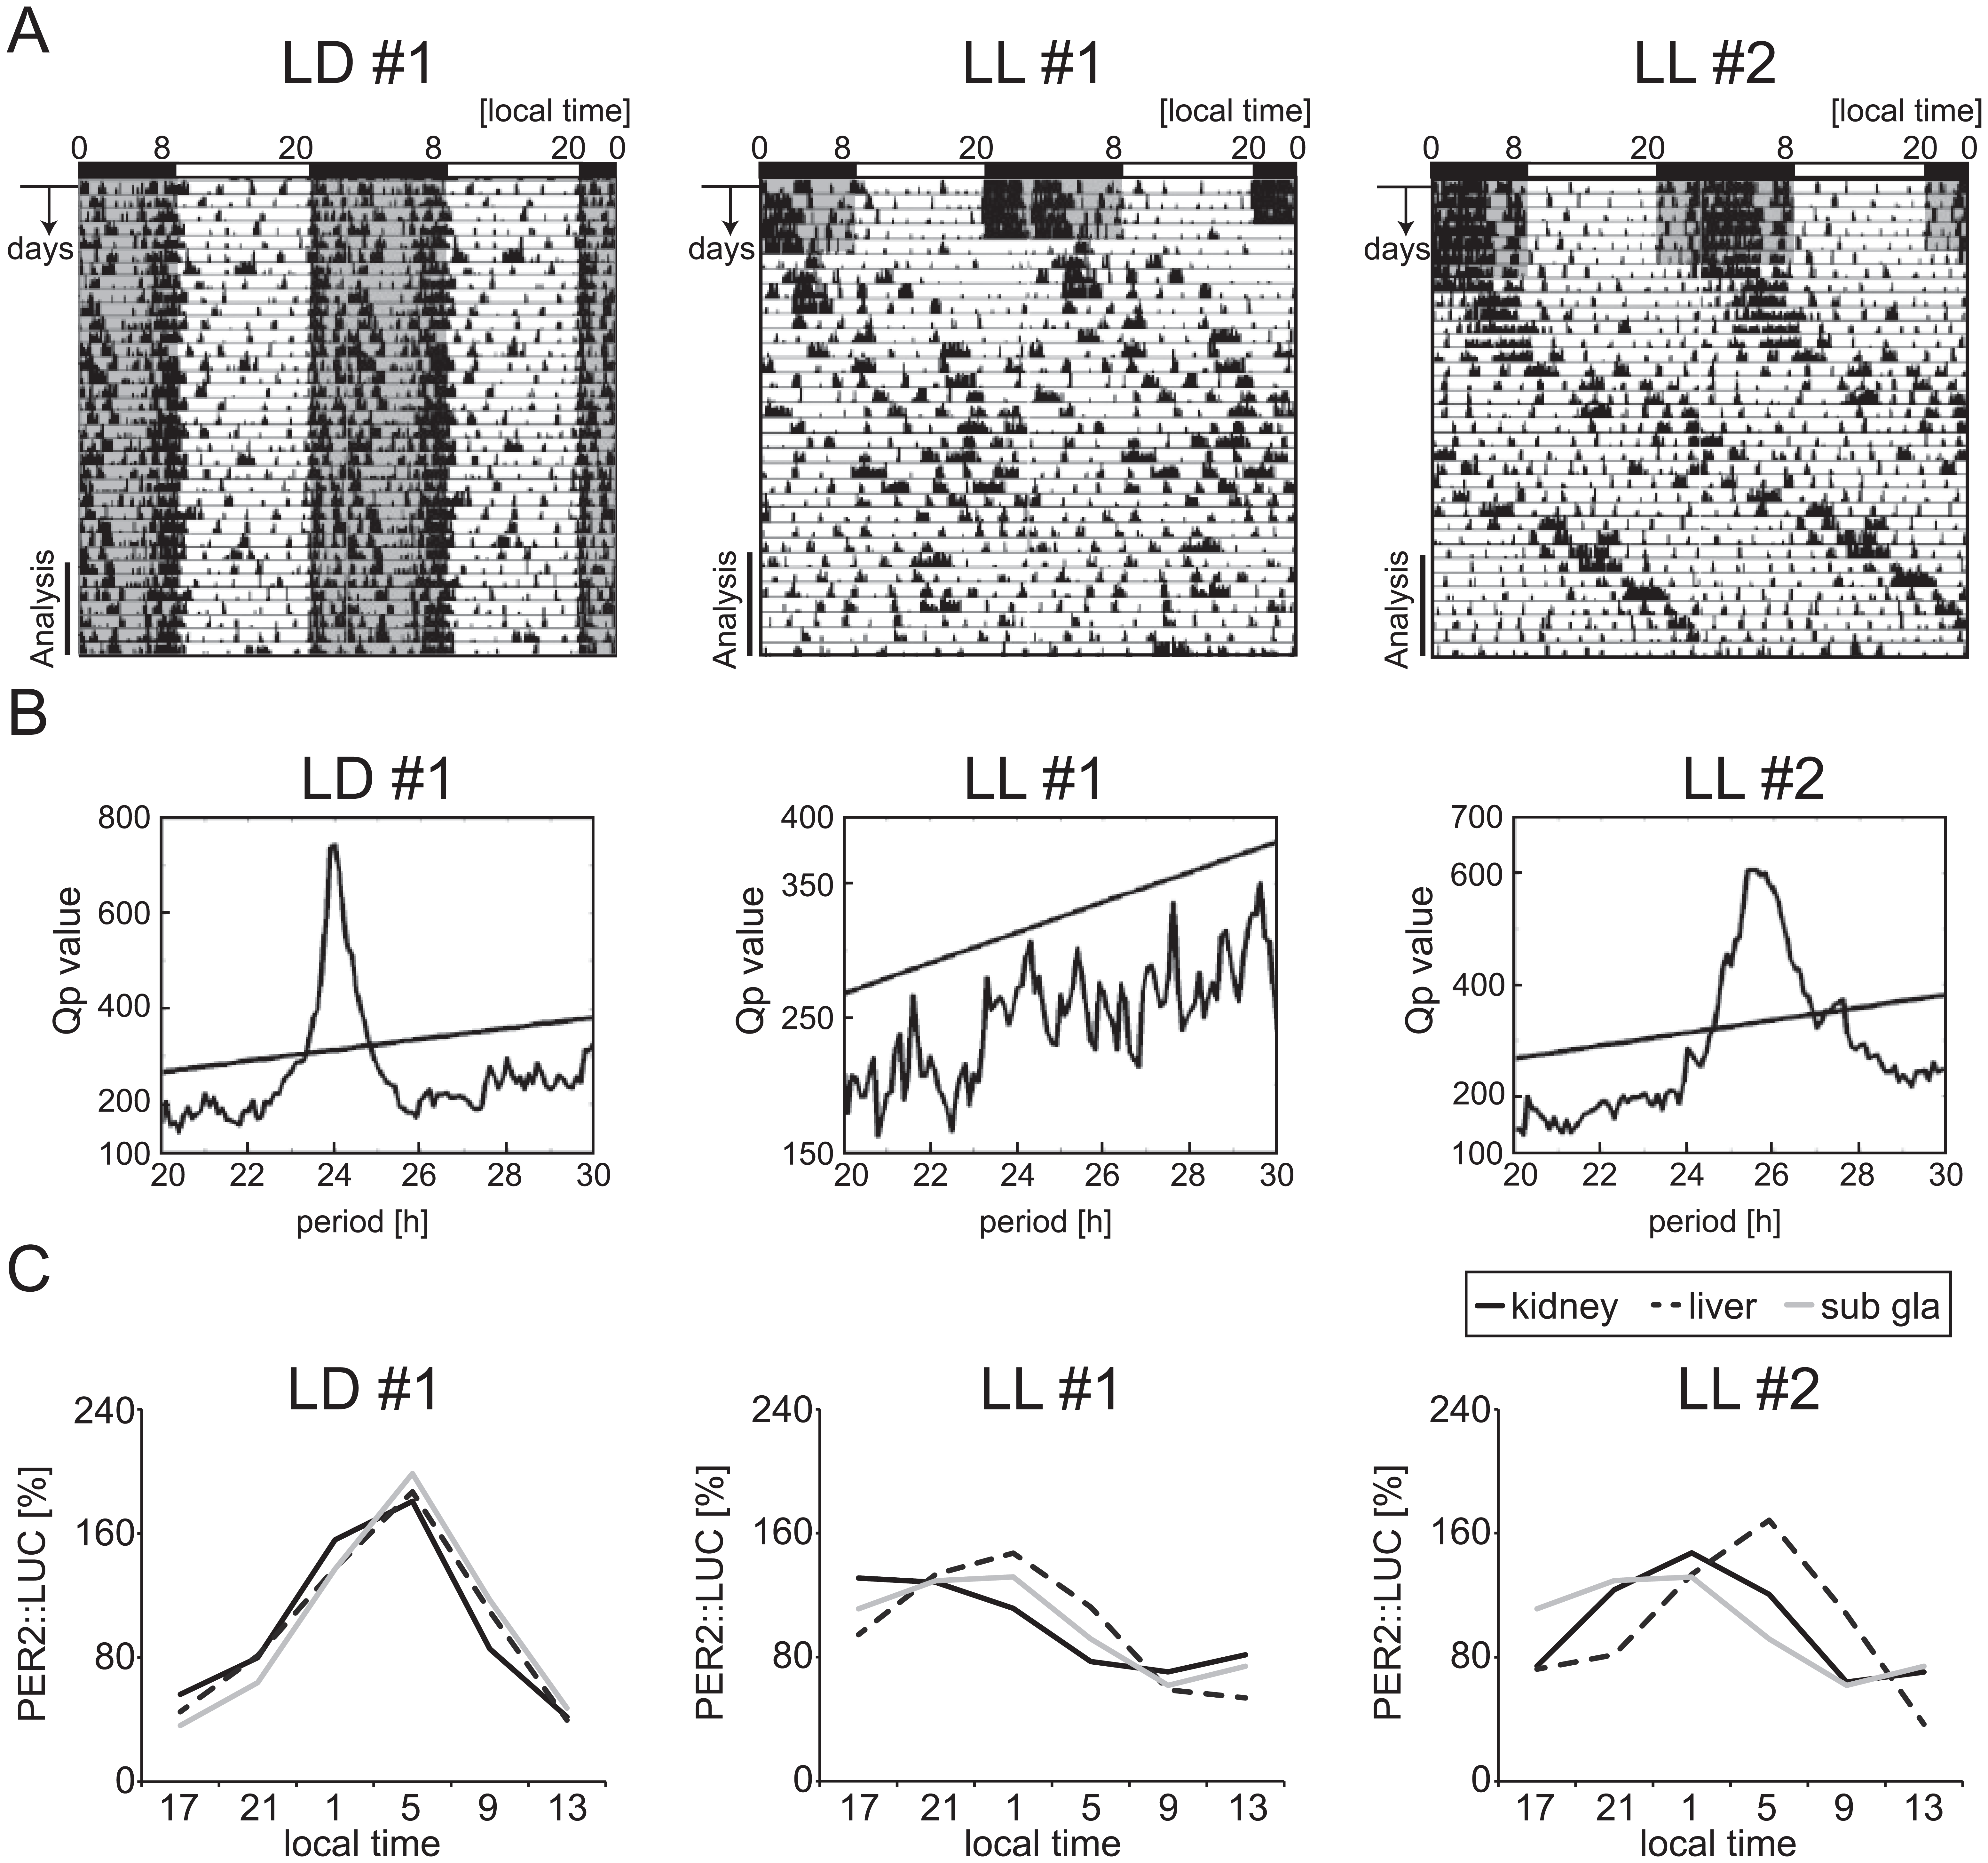
Locomotor activities and PER2::LUC rhythms in light-dark (LD) or constant light (LL) conditions. (A) Representative double-plotted actograms of locomotor activity for 1 LD-housed mouse (LD#1) and 2 LL-housed mice (LL#1 and LL#2). The horizontal bar indicates local time and the vertical lines indicate the passing day. The last 7 days (analysis) were used for chi-squared analysis. Gray shadow on the actograms indicates the dark period. (B) Chi-squared periodogram analysis of behavioral data. Straight lines in each figure indicate statistical significance, p < 0.001. (C) PER2::LUC bioluminescence rhythms in the kidney, liver, and submandibular gland (sub gla), monitored on the last day of 4 weeks of each condition.
Number of Tissues Showing Rhythmic Oscillation of PER2::LUC Analyzed by Cosinor Curve Fitting.
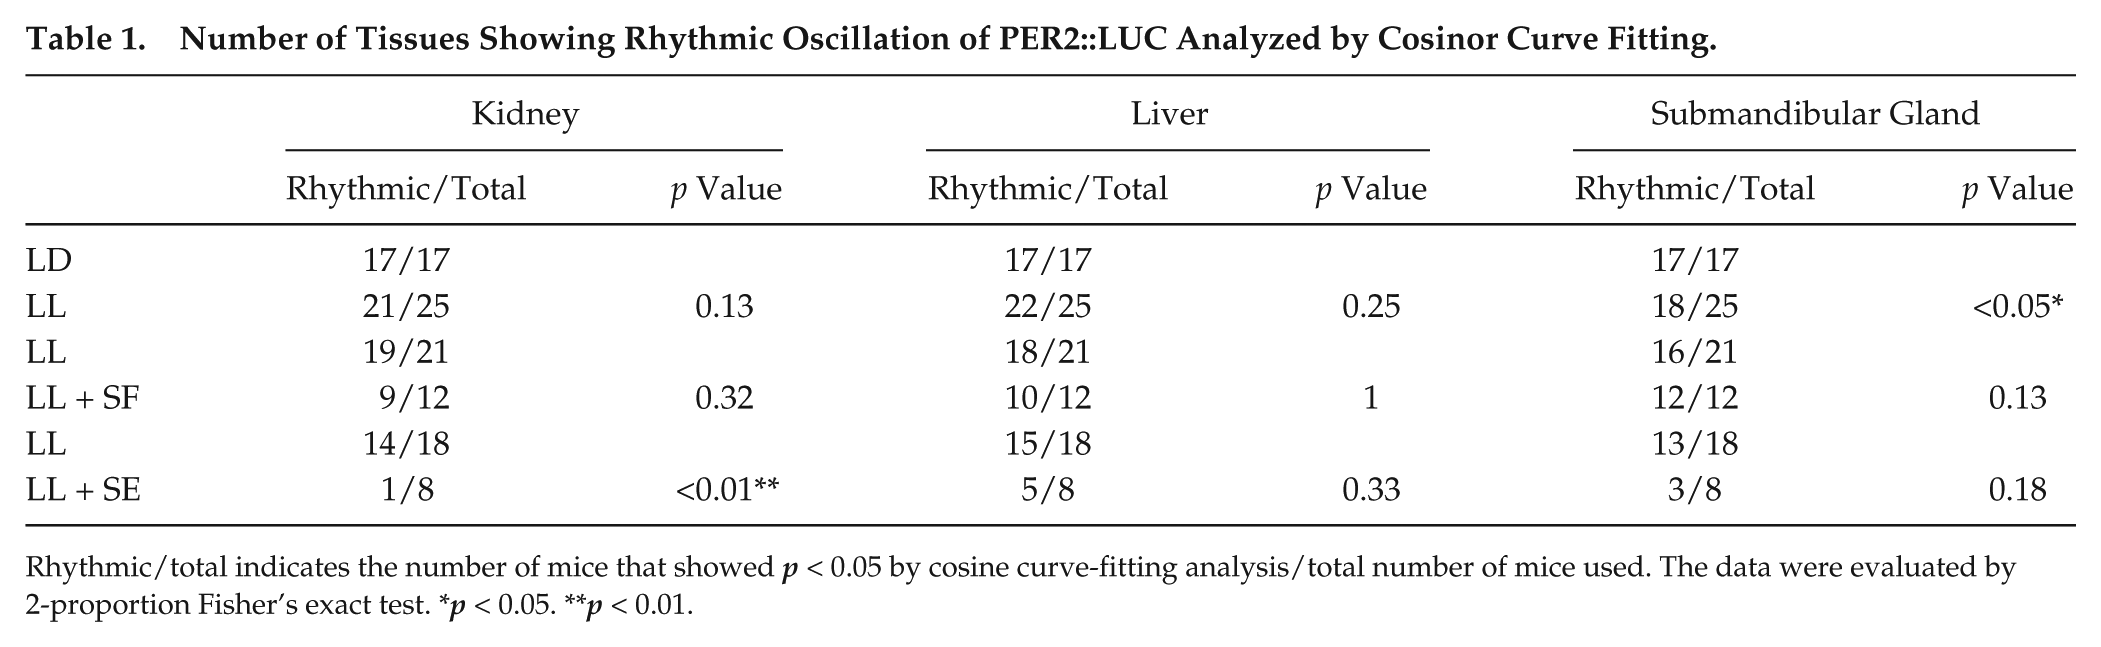
Rhythmic/total indicates the number of mice that showed p < 0.05 by cosine curve-fitting analysis/total number of mice used. The data were evaluated by 2-proportion Fisher’s exact test. *p < 0.05. **p < 0.01.
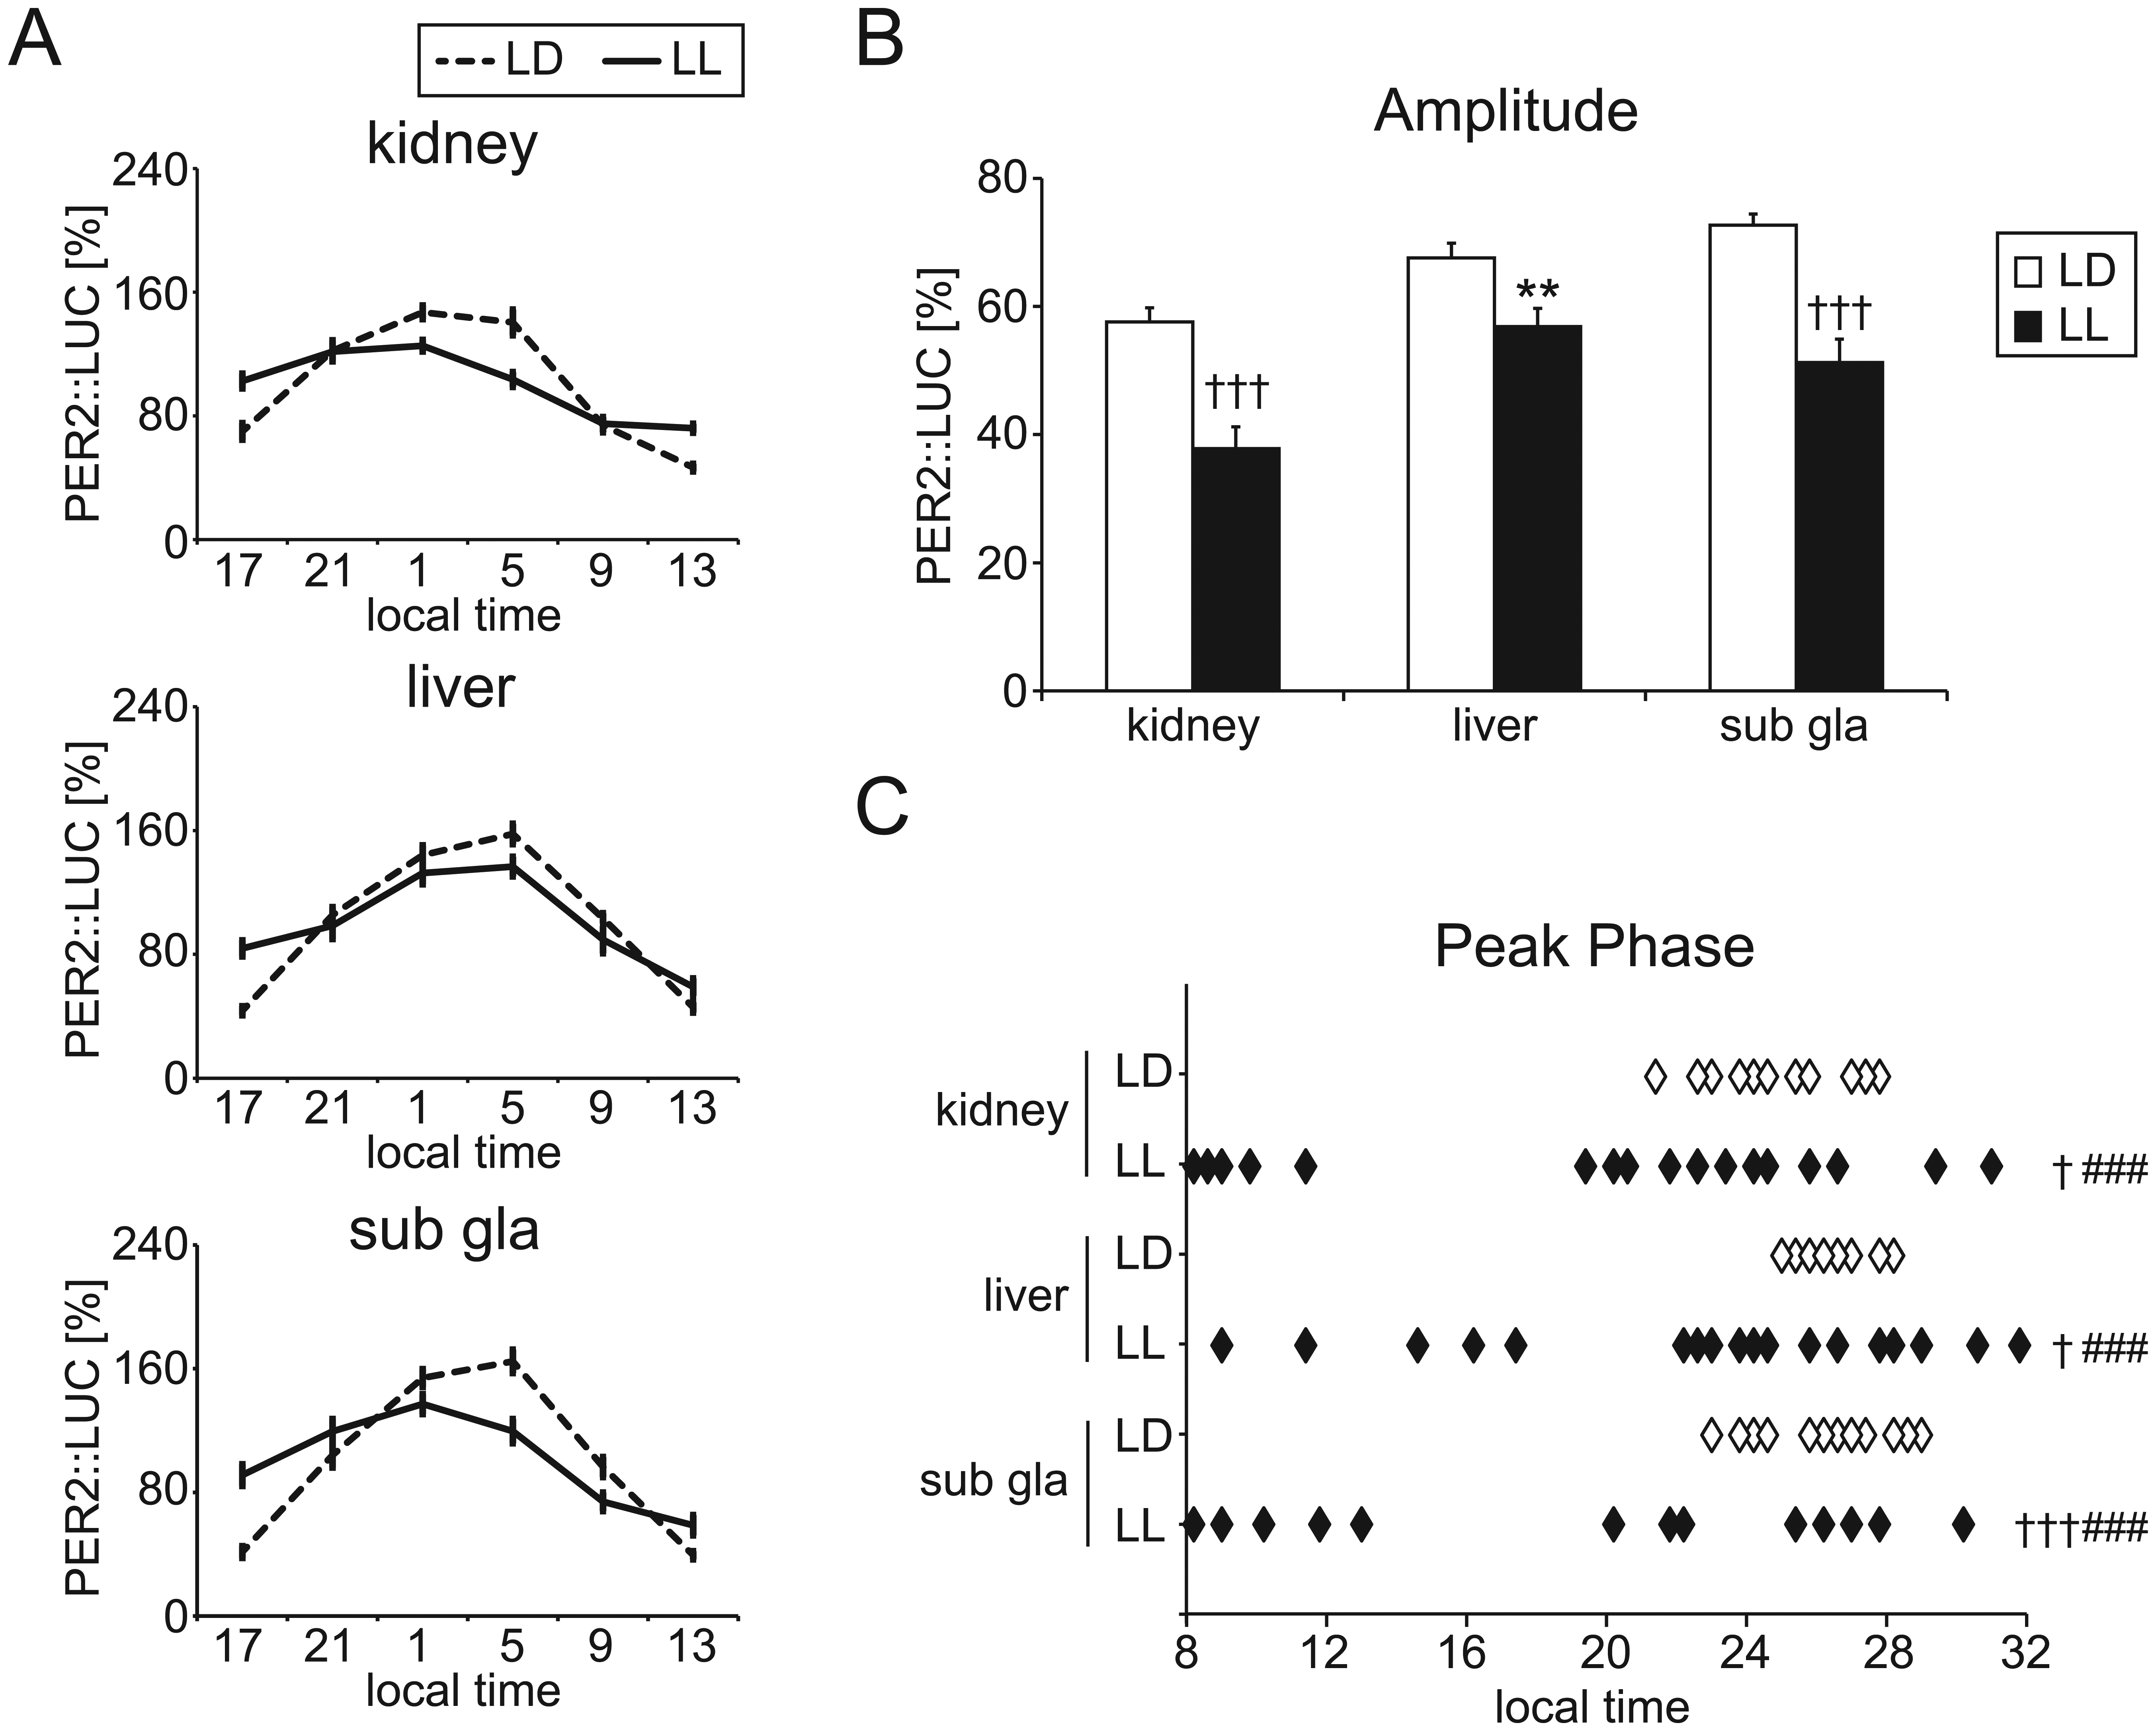
Amplitude and peak phase of PER2::LUC rhythm in light-dark (LD) or constant light (LL) conditions. (A) Averaged PER2::LUC rhythms in the kidney, liver, and submandibular gland (sub gla) of LD and LL mice. (B) Averaged amplitude of PER2::LUC rhythms. Data are means ± SEM. (C) Peak phase of PER2::LUC rhythms in individual mice. The number of mice in each condition is indicated in Table 1. **p < 0.01 by Student t test; +p < 0.05, +++p < 0.001 by Mann-Whitney test; ###p < 0.001 by F test (test for equality of variance) vs. LD condition in each tissue.
Effect of SF and SE on Peripheral PER2::LUC Rhythms under LL
To reduce the impairment of peripheral clock oscillations in LL mice, mice underwent either a week of SF or 4 days of SE after 4 weeks of LL housing (Figs. 3A and 4A). The ratios of rhythmic/arrhythmic tissues were not affected by SF (Table 1). Using only tissues exhibiting rhythmicity, peripheral PER2::LUC rhythms were compared between LL and LL + SF groups (Fig. 3). The bioluminescence rhythm pattern (Fig. 3B) and amplitude (Fig. 3C) were similar between the LL and LL + SF groups. However, the significantly abnormal phase distribution of PER2::LUC rhythms in the LL condition was reversed by SF in the liver and kidney (Fig. 3D).
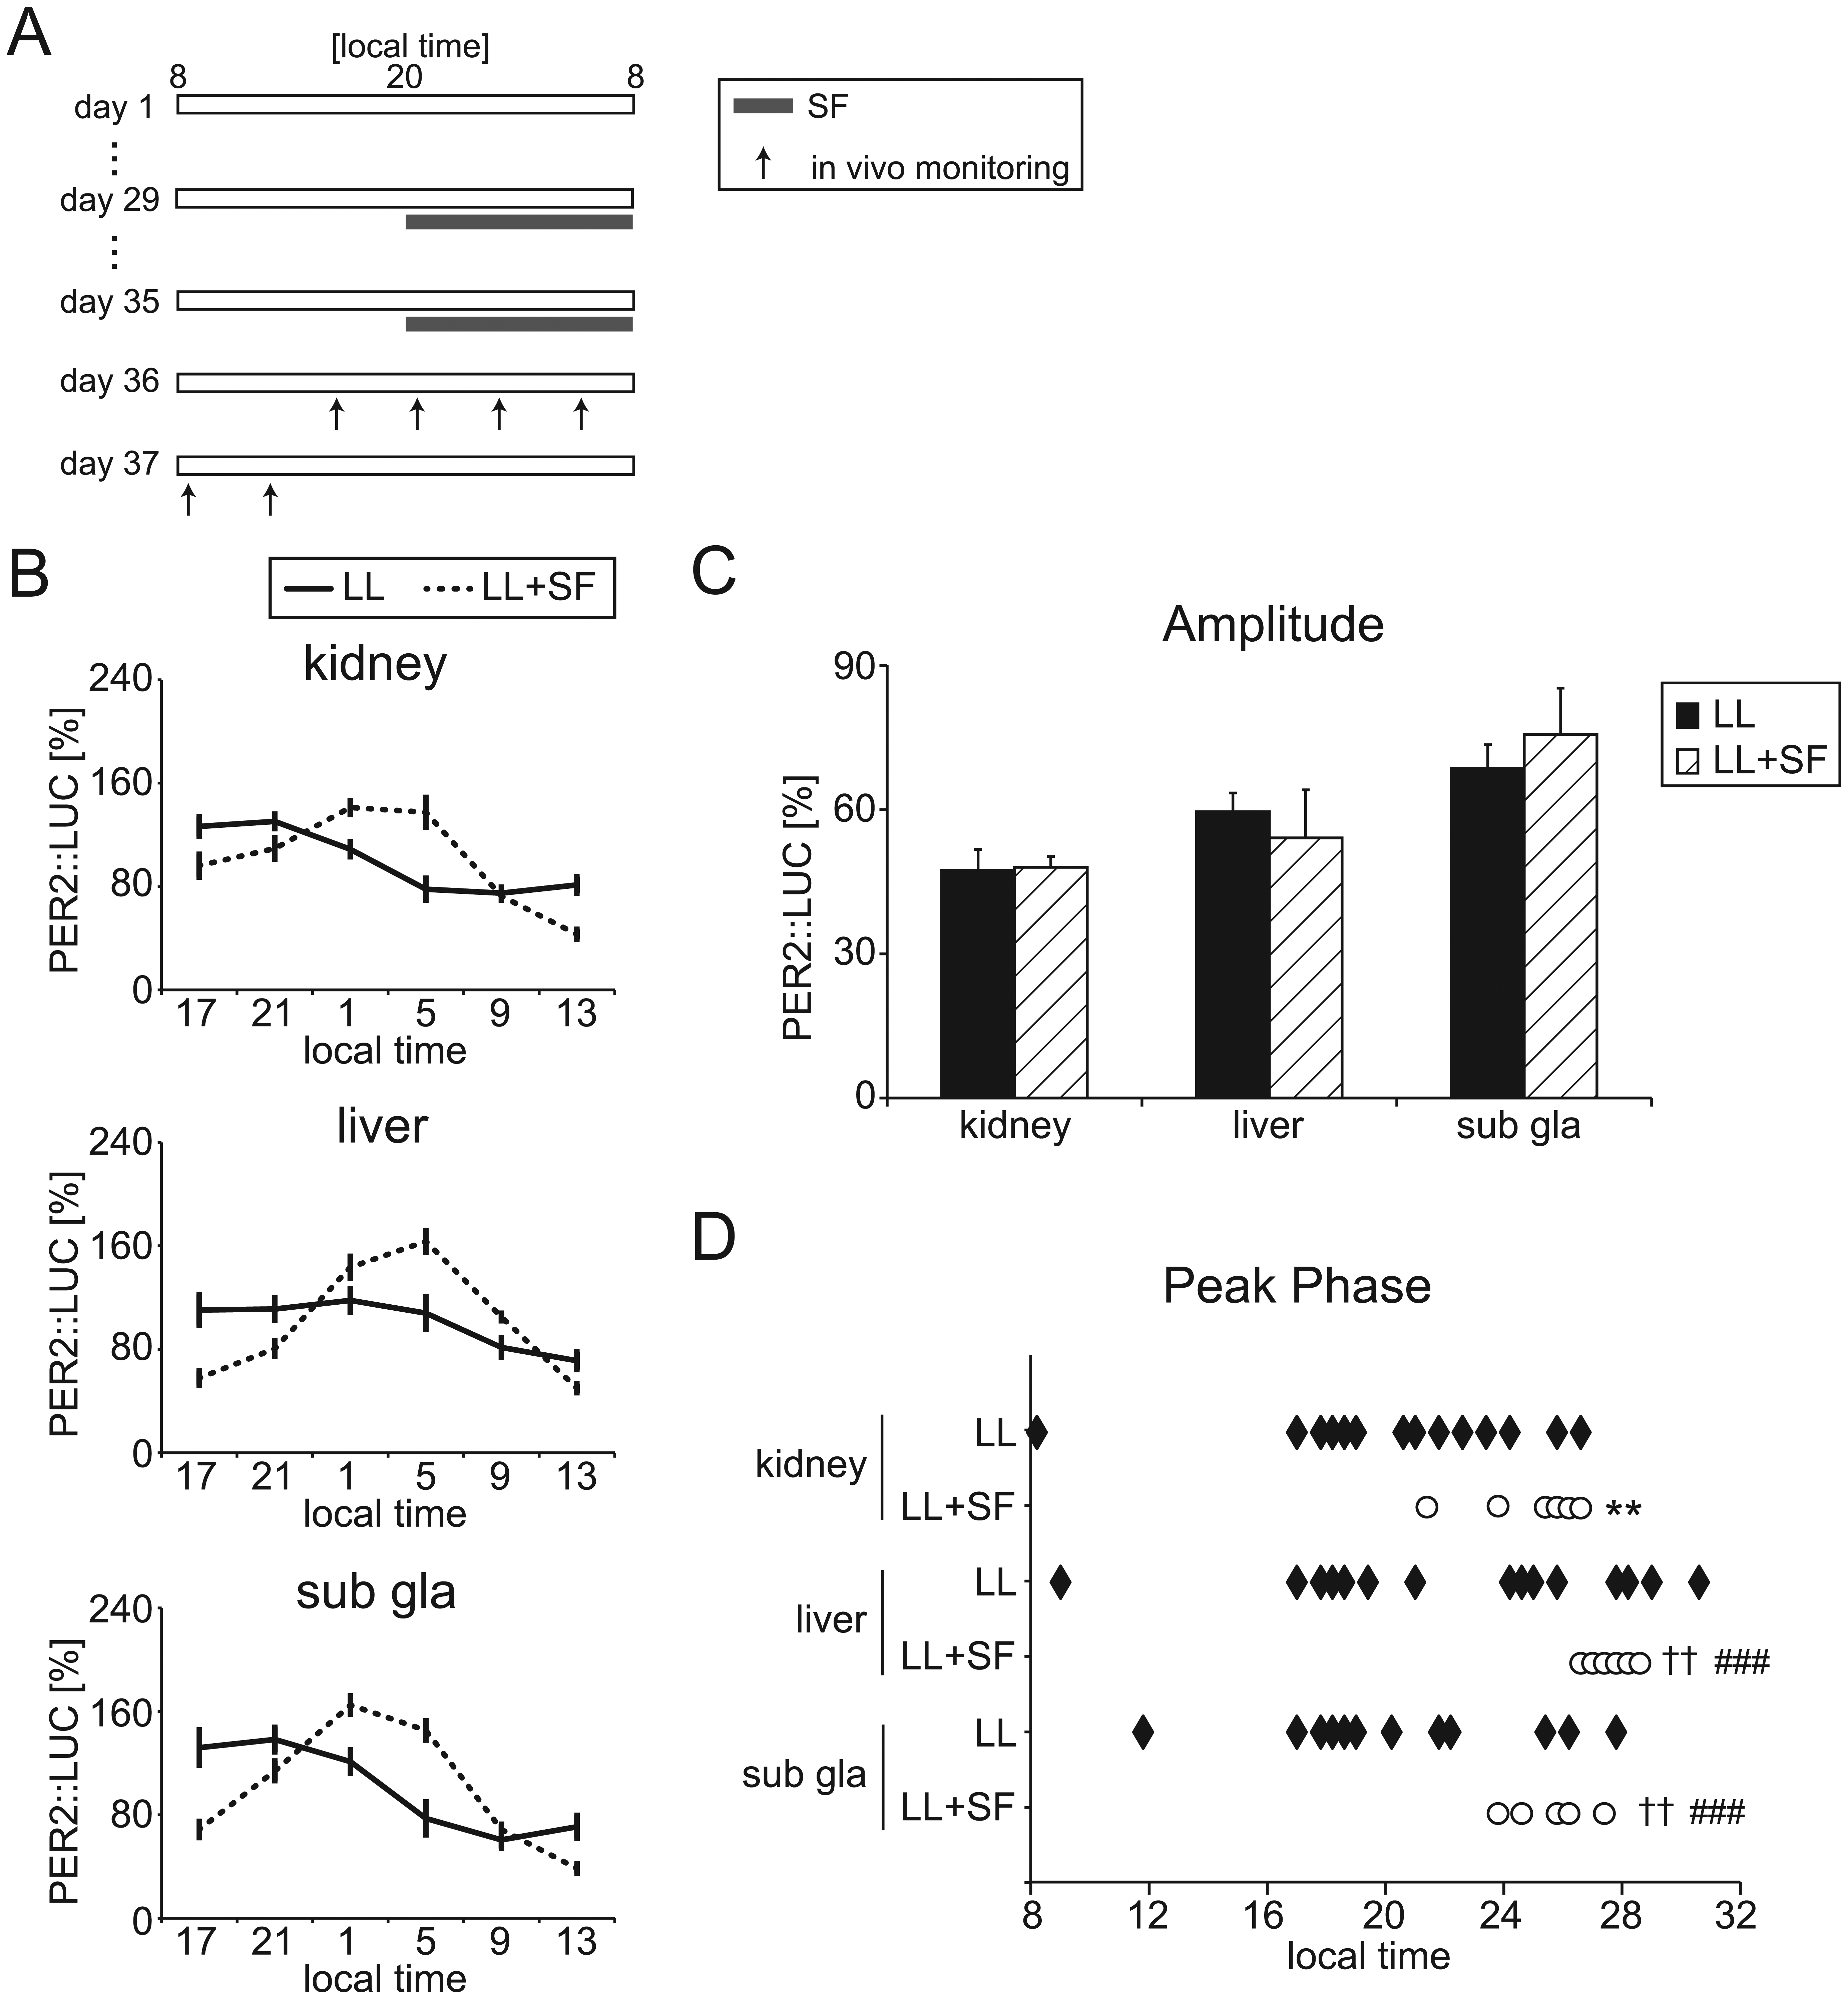
PER2::LUC rhythms under constant lighting (LL) with scheduled feeding (SF) conditions. (A) The experimental protocol. Horizontal bar represents the light period. (B) Averaged PER2::LUC rhythms in the kidney, liver, and submandibular gland (sub gla) of LL and LL + SF mice. (C) Averaged amplitude of PER2::LUC rhythms. Data are means ± SEM. (D) Peak phase of PER2::LUC rhythms in individual mice. The number of mice in each condition is indicated in Table 1. **p < 0.01 by Student t test. ++p < 0.01 by Mann-Whitney test. ###p < 0.001 by F test (test for equality of variance) vs. LL condition in each tissue.
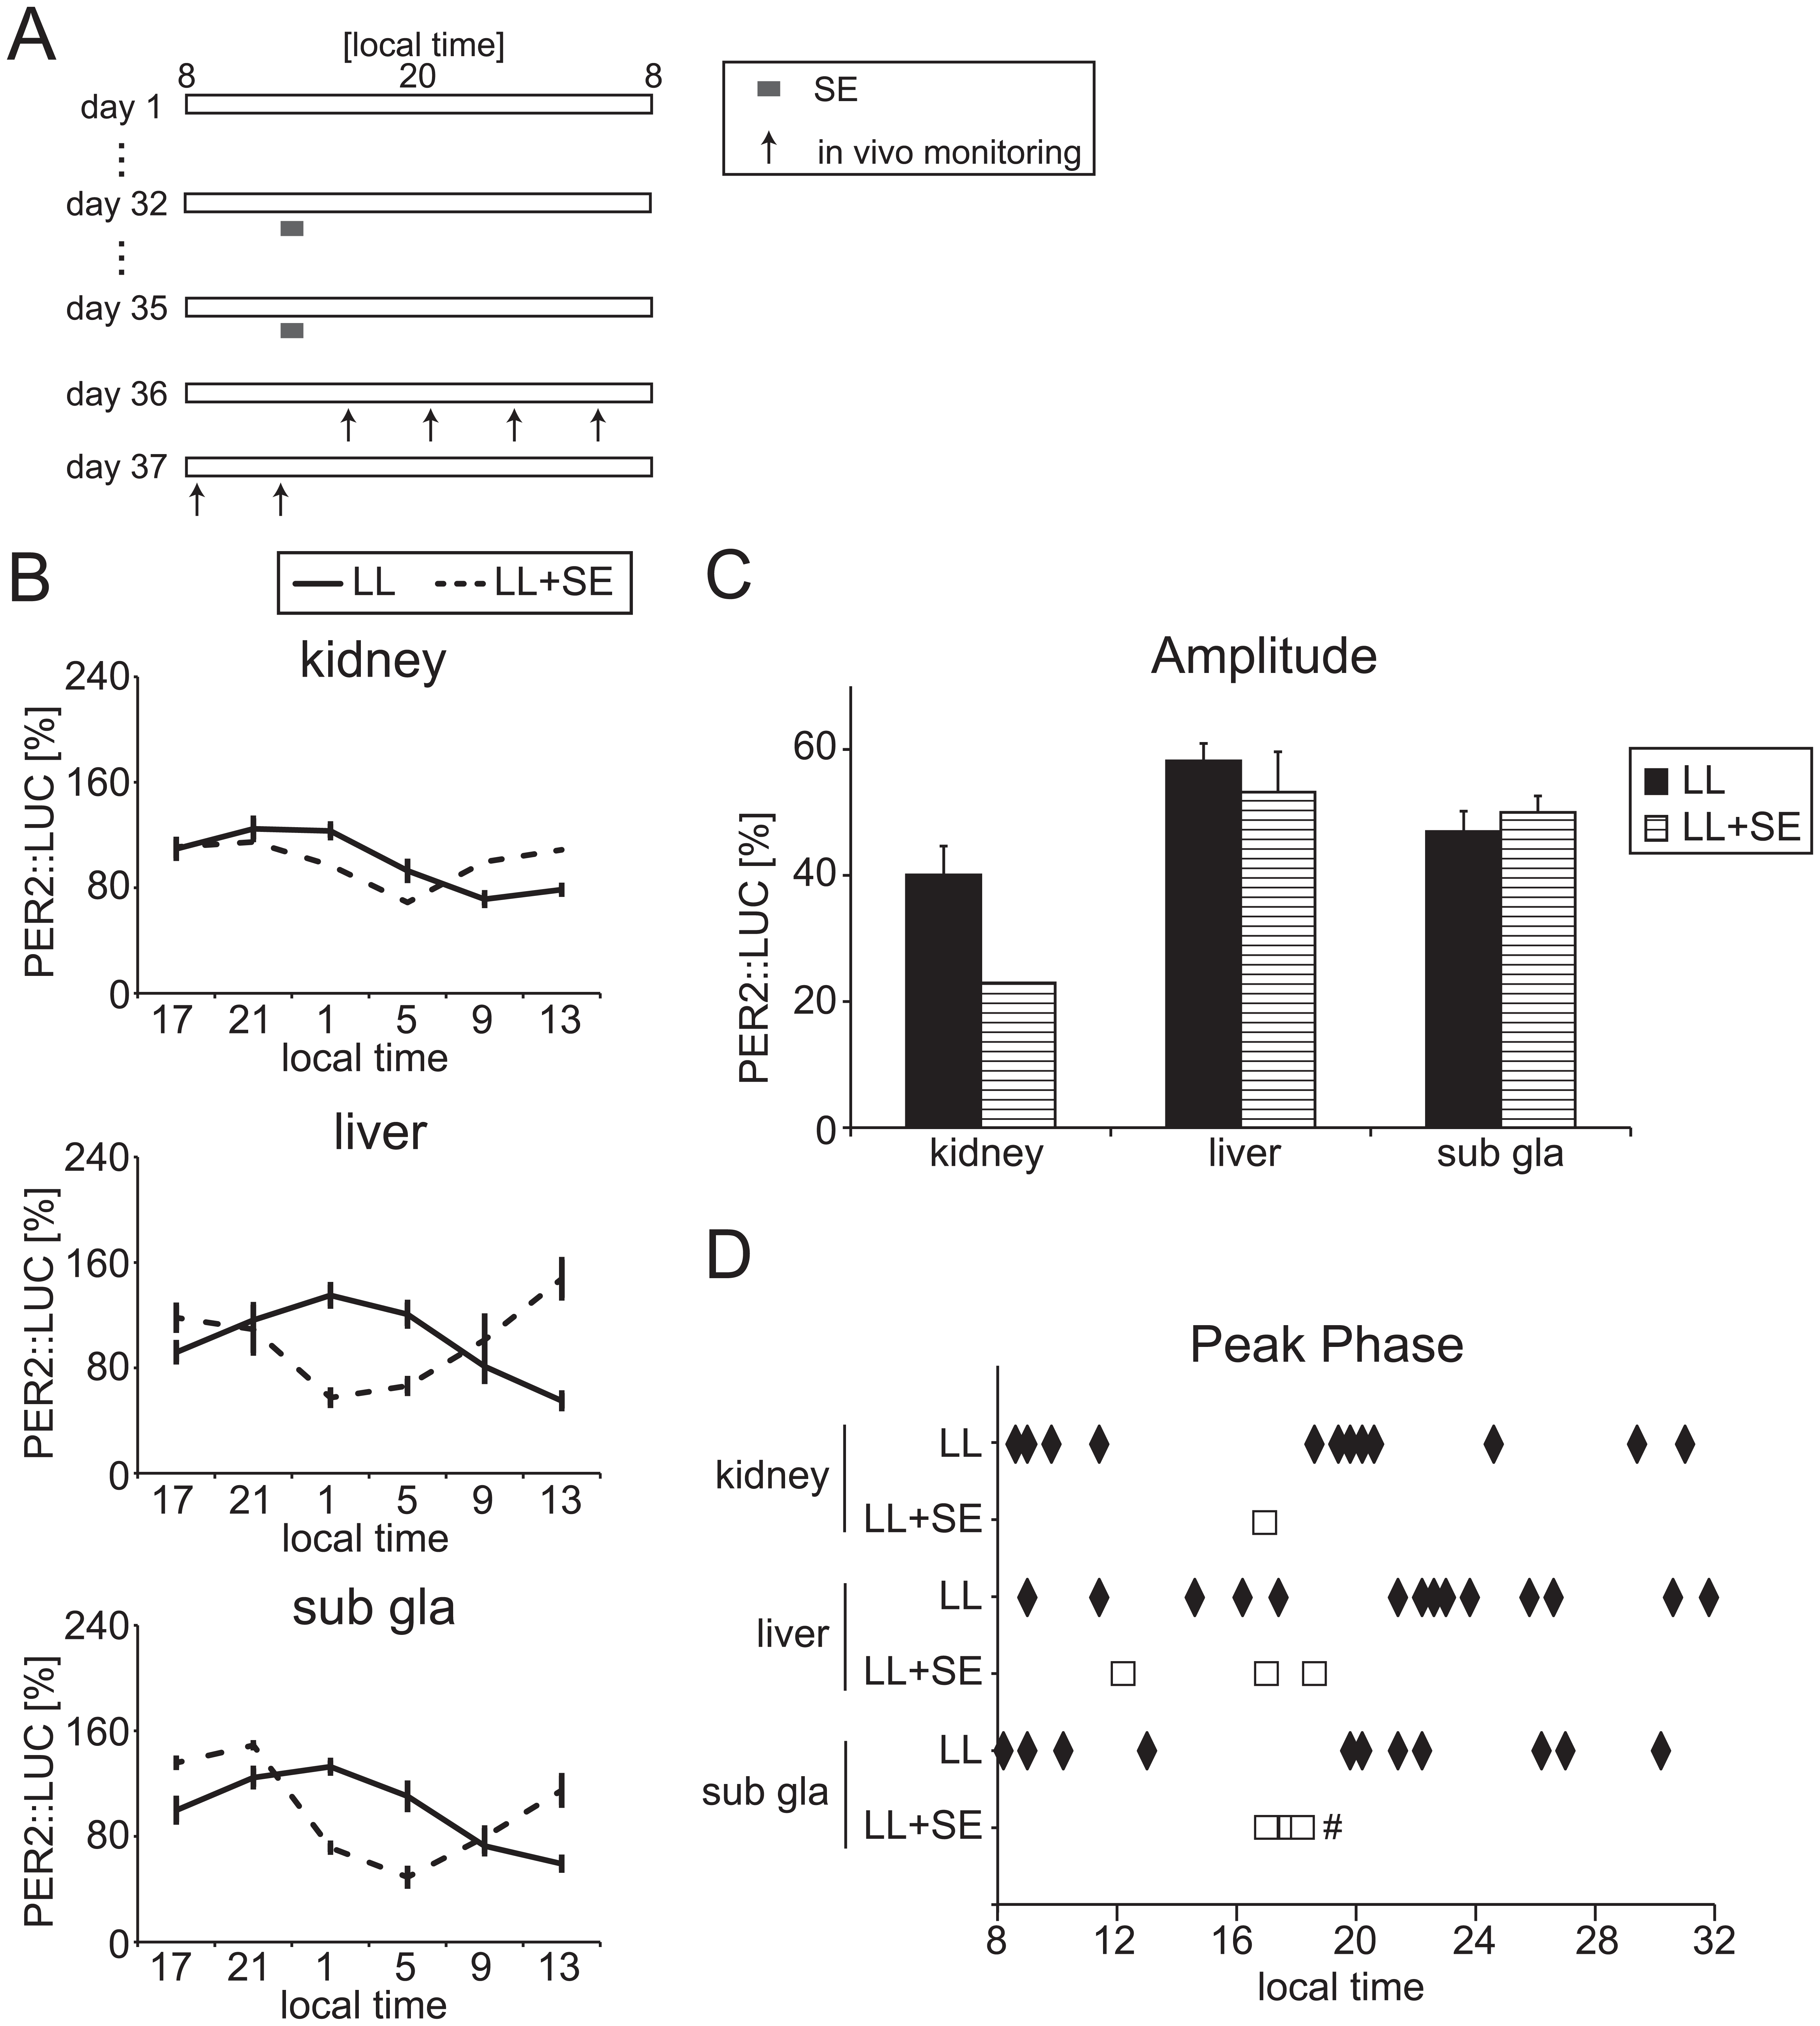
PER2::LUC rhythms under constant lighting (LL) with scheduled exercise (SE) conditions. (A) The experimental protocol. Horizontal bar represents the light period. Mice performed scheduled exercise from 1200 to 1300 h. (B) Averaged PER2::LUC rhythms in the kidney, liver, and submandibular gland (sub gla) of LL and LL + SE mice. (C) Averaged amplitude of PER2::LUC rhythms. Data are means ± SEM. (D) Peak phase of PER2::LUC rhythms in individual mice. The number of mice in each condition is indicated in Table 1. #p < 0.05 by F test (test for equality of variance) vs. LL condition in each tissue.
In control LL mice for SE treatment, numbers of tissues exhibiting rhythmicity by cosinor analysis were 14 (kidney), 15 (liver), and 13 (submandibular gland) in 18 tissues. In LL + SE mice, the number of rhythmic tissues in 8 mice was significantly low in the kidney (1/8 for LL + SE, 14/18 for LL; p < 0.01 by Fisher’s exact probability test), but the numbers were similar in the liver (5/8) and submandibular gland (3/8) (Table 1). Using only tissues exhibiting rhythmicity, peripheral PER2::LUC rhythms were compared between LL and LL + SE groups (Fig. 4). The bioluminescence rhythm pattern showed some difference (Fig. 4B), but amplitude (Fig. 4C) was similar between the LL and LL + SE groups. The reduced phase distribution in LL + SE appeared only in the submandibular gland (Fig. 4D).
Discussion
In this study, we used in vivo imaging of clock gene expression in peripheral tissues to examine whether LL housing impaired peripheral clocks in individual mice. In a previous study, group-averaged expression levels of clock genes from samples pooled at each circadian time point were evaluated, and dampened circadian oscillations were observed in the peripheral clocks of LL-housed rats (Polidarová et al., 2011; Nováková et al., 2011). The present study evaluated the oscillations of peripheral clocks in individual mice. The rhythmicity of peripheral clocks in the LL group was evaluated by cosinor analysis; kidney and liver maintained rhythmicity, but rhythmicity was impaired in the submandibular gland. Although LD tissues and rhythmic LL tissues are comparable (Fig. 2), our results clearly demonstrate that LL housing reduces the amplitude of the PER2::LUC rhythm and broadens the phase distribution. Thus, the dampened circadian oscillations observed in averaged data from pooled samples in previous studies (Polidarová et al., 2011; Nováková et al., 2011) may reflect the decrease in amplitude from individual animals as well as the broadened distribution of the clock phases.
We do not know the reason for impaired submandibular gland rhythmicity under LL housing as compared to kidney and liver. Previously, Vujovic et al. (2008) demonstrated that the circadian rhythm of the submandibular gland was under strong sympathetic influence from the SCN. LL housing produces a decrease in the activity of the sympathetic nerves efferent to salivary glands (Dellavia and Gallara, 2000; Gallara and Bellavia, 1995). Thus, in the current experiment, LL housing may have impaired clock rhythmicity in the submandibular gland through a decrease of sympathetic activity from the SCN.
In the current experiments, behavioral rhythmicity was evaluated by chi-squared periodogram analysis, and rhythmicity, amplitude, and phase distribution of peripheral clocks were compared between behavioral rhythmic (16/25) and arrhythmic (9/25) LL-housed mice (Suppl. Fig. S1). There were no differences in peripheral clock rhythms between behaviorally arrhythmic and rhythmic mice in LL, suggesting dissociated mechanisms controlling behavior and peripheral clock rhythms in LL. Uncoupling of behavioral rhythms and peripheral clock rhythms has been observed by restricted feeding in mice with dorsomedial hypothalamic lesions. Lesions in this brain area impaired the anticipatory behavioral rhythm but did not affect the expected phase shift of the liver clock (Tahara et al., 2010). Although the mechanisms of LL-induced impairment of peripheral clocks in individual mice are unknown at present, it may be caused by impairment of corticosterone/sympathetic pathways from the SCN to peripheral organs (Guo et al., 2005; Ishida et al., 2005; Le Minh et al., 2001; Terazono et al., 2003; Menaker et al., 2013). Because light exposure increases corticosterone release through SCN activity (Ishida et al., 2005), LL may disturb the circadian rhythm of corticosterone release and result in impaired peripheral clock rhythmicity. Overall, the present results imply that impairment of behavior and peripheral clocks is controlled by distinct mechanisms in LL.
SF is one of the most powerful entrainment signals. SF may entrain the rhythms of locomotor activity and corticosterone secretion as well as clock gene expression in the peripheral tissues but not in the SCN (Damiola et al., 2000; Hara et al., 2001; Tahara and Shibata 2013). A shortage of food energy in the SF regimen caused phase advancement of peripheral clocks as well as the SCN clock (Kuroda et al., 2012; Caldelas et al., 2005). To avoid energy shortage-induced phase changes, mice in the current experiments were allowed to consume food during the 12-h period each day. As it is unknown whether 12-h SF entrains the SCN in LL, further experiments are required to confirm that 12-h SF does not entrain the SCN in LL. Nevertheless, the present experimental protocol reversed the LL housing-induced broad distribution of phases of the kidney and liver clocks but not that of the submandibular gland clock, without recovery of amplitude. This may be explained by a report that demonstrated a weak effect of restricted feeding on entrainment of the submandibular gland clock (Vujoric et al., 2008). If we had used a 4-h restricted feeding protocol similar to that in the report of Polidarová et al. (2011), we might expect strong recovery from LL-induced impairment of rhythmicity.
Both voluntary and involuntary exercise for 2 h during the light period daily during the LD cycle caused phase advancement of skeletal muscle and lung clocks (Wolff and Esser, 2012). In the present study, exercise for 1 h on a treadmill for 4 days reversed the LL housing-induced broad distribution of phases in submandibular gland but not in kidney or liver clocks, without recovery of amplitude. The inadequate recovery of rhythmicity, broad distribution of phases, and amplitude following treadmill exercise in the present study may be partially explained by a shorter treatment duration (1 h vs. 2 h) and days (4 days vs. 2-4 weeks). In future experiments, a more stringent protocol of restricted feeding and exercise may be required to clarify the present results.
In the current study, we monitored the rhythm of PER2 expression using IVIS. Previous studies have demonstrated differences in sensitivity to LL housing among clock genes expressed in both the SCN and peripheral tissues. For example, Per1 and Per2 expression loses rhythmicity, but Rev-erbα expression maintains rhythmicity in the liver of rats under LL housing (Polidarová et al., 2011). Thus, it may be necessary to monitor other clock genes in future studies.
In summary, LL housing caused a deficit in peripheral clock rhythmicity in the submandibular gland, as well as in amplitude and phase distribution in the kidney, liver, and submandibular gland, in individual mice irrespective of the state of their locomotor rhythmicity. SF or SE treatments may help to partially reverse the broad phase distribution of impaired peripheral clocks.
Footnotes
Acknowledgements
This work was partially supported by the Council for Science, Technology and Innovation, SIP, “Technologies for Creating Next-Generation Agriculture, Forestry and Fisheries” (funding agency: Bio-oriented Technology Research Advancement Institution, NARO) (S.S.), and by a Grant-in-Aid for Scientific Research (S) (26220201) from the Ministry of Education, Culture, Sports, Science and Technology of Japan (S.S.).
Conflict of Interest Statement
The author(s) have no potential conflicts of interest with respect to the research, authorship, and/or publication of this article.
Notes
References
Supplementary Material
Please find the following supplemental material available below.
For Open Access articles published under a Creative Commons License, all supplemental material carries the same license as the article it is associated with.
For non-Open Access articles published, all supplemental material carries a non-exclusive license, and permission requests for re-use of supplemental material or any part of supplemental material shall be sent directly to the copyright owner as specified in the copyright notice associated with the article.