
Abstract
Previous analysis of Drosophila circadian behavior under natural conditions has revealed a number of novel and unexpected features. Here we focus on the oscillations of per and tim mRNAs and their posttranscriptional regulation and observe significant differences in molecular cycling under laboratory and natural conditions. In particular, robust per mRNA cycling from fly heads is limited to the summers, whereas tim RNA cycling is observed throughout the year. When both transcripts do cycle, their phases are similar, except for the very warmest summer months. We also study the natural splicing profiles of per and tim transcripts and observe a clear relationship between temperature and splicing. In natural conditions, we confirm the relationship between accumulation of the perspliced variant, low temperature, and the onset of the evening component of locomotor activity, first described in laboratory conditions. Intriguingly, in the case of tim splicing, we detect the opposite relationship, with timspliced expression increasing at higher temperatures. A first characterization of the 4 different TIM protein isoforms (resulting from the combination of the natural N-terminus length polymorphism and the C-terminus alternative splicing) using the 2-hybrid assay showed that the TIMunspliced isoforms have a stronger affinity for CRY, but not for PER, suggesting that the tim 3′ splicing could have physiological significance, possibly in temperature entrainment and/or adaptation to seasonal environments.
Introduction
Most studies concerning circadian clocks have been carried out in simplified laboratory conditions that cannot reflect the complexity of the stimuli that are present in nature. In the wild, circadian clocks must respond to continuous variations of major parameters such as light intensity/spectral composition, and temperature, both in terms of daily and seasonal changes. Recent studies conducted in mice, hamsters, and Drosophila under seminatural conditions have shown that a number of established findings from the laboratory may not recapitulate the situation in the wild (Gattermann et al., 2008; Daan et al., 2011; Vanin et al., 2012; Bywalez et al., 2012). Indeed, natural conditions appear to mask many of the behavioral defects reported in some of the major Drosophila clock mutants (Vanin et al., 2012). In the fruit fly particularly, a number of novel features have been revealed in seminatural conditions, which require some revisions of our current understanding of how the clock responds to natural entraining stimuli (Vanin et al., 2012).
Natural polymorphic variants of period (per) and timeless (tim) have been described that appear to be under selection and adapt fruit flies to various thermal and photoperiodic seasonal environments (Rosato et al., 1997; Sawyer et al., 1997, 2006; Sandrelli et al., 2007; Tauber et al., 2007). However a more dynamic flexibility to respond to daily or seasonal changes in temperature has been observed in per splicing patterns, where a thermosensitive alternative splicing of an 89-bp intron in the 3′ UTR yields perspliced as opposed to the perunspliced form generated at higher temperatures (Majercak et al., 1999, 2004; Collins et al., 2004; Low et al., 2012). The splicing of per results in earlier accumulation of the mRNA, which correlates with earlier evening activity at colder temperatures (Majercak et al., 1999), whereas at higher temperatures, the nonspliced transcript results in later evening activity. Under natural conditions, the splicing of per is linearly correlated with mean daily temperature (Vanin et al., 2012); however, only when the mean daily temperature rises above a ~21 °C to 22 °C threshold is there an effect on evening behavior. In addition, comparison of per 3′ UTR splicing among tropical and cosmopolitan Drosophila species of the melanogaster subgroup reveals that suboptimal per splice sites are found in cosmopolitan/temperate species such as D. melanogaster. In contrast, optimal per splice sites found in tropical species are not intrinsically thermosensitive (Low et al., 2008). Taken together, these data suggest that per splicing provides adaptive behavior to the fly at hotter rather than colder temperatures, possibly to avoid dessication during the hotter parts of the day, and that this remarkable feature evolved as flies colonized more challenging thermal environments, such as Europe, more than 10,000 years ago (Kyriacou et al., 2008).
A thermosensitive splicing is also observed in tim, where at colder temperatures, the last 858-bp intron is retained and the corresponding transcript, timunspliced, gives rise to a TIM protein 33 amino acids shorter than the full-length timspliced isoform, due to a premature STOP codon (Boothroyd et al., 2007). However, no functional studies have been performed to investigate the influence of environmental parameters on tim mRNA oscillations and on relative levels of splicing variants in the wild. In this study, we have determined both per and the less well-understood tim mRNA profiles in natural conditions throughout the seasons, focusing on the different isoforms regulated by the thermosensitive splicing. We report features of the seasonal transcriptional patterns of per and tim and a first functional characterization of the TIMUNSPLICED isoforms.
Materials And Methods
Fly Strains
The Drosophila strain WT-ALA (Wild-Type Alto Adige; Vanin et al., 2012) is a strain established from several natural isolates collected as isofemale lines from Northern Italy (Val Venosta-Alto Adige, 46° 30′ N) in 2004. To maintain levels of initial natural genetic variability in the WT-ALA strain, individuals from the original isofemale lines (maintained in the lab as independent cultures) were routinely added to the strain in use.
Flies were reared on a standard yeast-glucose/agar or cornmeal/agar medium and maintained at 23 °C, 18 °C, or 10 °C, 70% relative humidity, on a 12-h light:12-h dark cycle (LD 12:12). For the experiments in natural conditions, flies were raised to adulthood at 23 °C before being placed outside at 2 to 3 d of age.
Behavior
Locomotor activity of individual flies was recorded photoelectrically in 5-min intervals using the Drosophila Activity Monitoring System (TriKinetiks, Inc, Waltham, MA). Males 3 to 5 d old were transferred into recording tubes one-third filled with standard cornmeal/agar medium and closed by air-penetrable plugs.
The natural field station was located in a suburban garden in Villorba, Treviso (Italy; 45° 41′ 28″ N, 12° 15′ 11″ E), 22 m above sea level well away from street lighting and roads. Environmental monitors (DEnM, TriKinetics Inc) were used to record temperature (°C) and light intensity (lux, minimum ~1 lux) during all the experiments performed in the wild (Vanin et al., 2012). Locomotor activity was quantified by using TriKinetics activity monitors as in Vanin et al. (2012). Monitors were shielded from direct sunlight and from rain. Morning (Monset) and evening (Eonset) onsets were determined for each fly on each day of every experiment as reported previously (Vanin et al., 2012).
Twilights
Twilight times were obtained from the online database of the United States Naval Observatory Astronomy Application Department.
Gene Expression Analysis
The relative quantification of mRNA was performed by a semiquantitative reverse transcription-polymerase chain reaction (RT-PCR). Flies were collected every 3 h for a 24-h time course and fixed in liquid nitrogen. Total head RNA was extracted using Trizol Reagent (Gibco, Grand Island, NY) as recommended by the kit protocol, and any contaminating genomic DNA was removed with DNase (Promega, Madison, WI). Reverse transcription was initiated on total RNA using the SuperscriptII (Invitrogen, Carlsbad, CA) reverse transcriptase with the 17-bases oligo(dT). The reaction was performed for 1 h at 42 °C and for 15 min at 75 °C. perspliced, perunspliced, timspliced, and timunspliced isoforms and the control gene Cbp20 (Cap binding protein 20) were amplified by PCR with a PTC-100 Peltier Thermal Cycler (MJ Research, St. Bruno, Quebec, Canada) using primers listed in Supplemental Table S1. PCR was performed as follows: initial denaturation at 95 °C for 3 min, then 28 cycles (per) or 30 cycles (tim) consisting of 95 °C for 1 min, 62.1 °C (per) or 63 °C (tim) for 1 min, and 72 °C for 45 s. The reaction was completed by an elongation step of 10 min at 72 °C. Amplifications were carried out in 20-µL reaction mixtures containing 25, 50, 75, and 1 ng of cDNA target, 1 µL of each primer (10 µM), 1.6 µL of dNTPs (2 mM), 4 µL of Green Buffer (5×), and 0.4 µL of GoTaq DNA polymerase (Promega). PCR products were separated on a 2% agarose (Eurobio, Courtaboeuf, France) gel under ultraviolet radiation. Images were collected with the Quantity One 4.6 (Bio-Rad, Hercules, CA). The final quantification was obtained with ImageJ software (available at http://rsb.info.nih.gov/ij; developed by Wayne Rasband, National Institutes of Health, Bethesda, MD). Relative abundance of each transcript (perspliced, perunspliced, timspliced, timunspliced) was defined as a ratio with Cap binding protein 20 (cbp20). Three biological replicates (independent RNA extraction and retrotranscription) were performed, and for each of them, four technical replicates were carried out.
Yeast 2-Hybrid Assays
All of the experiments were performed in the EGY48 yeast strain (MATα, ura3, trp1, his3, 3LexA-operator-LEU); full-length dCRY or a large fragment of dPER (residues 233 to 685) were in fusion to the LexA moiety in the bait vector (pEG202), while different isoforms of dTIM (4 different isoforms originated by combinations between N- and C-termini) were in fusion with the “acid-blob” portion of the prey vector (pJG4-5) carrying an HA tag (Golemis and Brent, 1997). The coding sequences of the different isoforms of TIM were amplified from cDNA extracted from fly heads with primers that add the XhoI restriction site at both ends (Suppl. Table S1). Phusion High-Fidelity DNA Polymerase (New England Biolabs, Ipswich, MA) was used. The PCR product was digested with XhoI and cloned in the pJG4-5 vector linearized with the same enzyme. All of the constructs were fully sequenced to assess the in-frame insertion of the cDNA and to control for unwanted mutations. The reliable expression of prey fusions in the EGY48 yeast strain (MATα, ura3, trp1, his3, 3LexA-operator-LEU) transformed with the bait vector and LacZ reporter plasmid pSH18-34 was confirmed by immunoblot. For the quantification of fusion protein expression levels by Western blot, protein extracts were obtained as in Ausubel et al. (1989), subjected to sodium dodecyl sulfate polyacrylamide gel electrophoresis (NuPAGE, Invitrogen), and probed with a specific anti-HA antibody (1:5000; Sigma, St. Louis, MO), for the detection of the prey fusions, and an anti-beta Actin antibody (ab8224, abcam, 1:1000) as loading control. Quantification of β-galactosidase activity was performed in liquid culture as in Ausubel et al. (1989), and each experiment was repeated at least 3 times.
Statistical Analyses
All data concerning per and tim mRNA profiles were analyzed and plotted using Microsoft Excel 2007, whereas the statistical analyses were performed using Statistica 8 (Statsoft). Data were analyzed for statistical differences by 1- or 2-way analysis of variance (ANOVA) followed by a least significant difference post hoc test after testing for normal distribution. Regression analyses were performed using Minitab 14 and R (available as Free Software at http://www.r-project.org/).
Results
per and tim Expression in Laboratory Conditions
We first analyzed the temporal expression of the different per and tim splice isoforms at 3 different temperatures: 10 °C, 18 °C, and 23 °C in laboratory LD12:12 cycles. For every time point considered, we measured the amount of perspliced and perunspliced and that of timspliced and timunspliced, and we analyzed the proportion of the 2 isoforms compared with the total amount of mRNA for each gene.
The profiles of total mRNA for both genes were in agreement with previous findings (Majercak et al., 1999; Boothroyd et al., 2007). Total mRNA of per and tim shows a circadian oscillation (per: F7,48 = 4.54, p < 0.001; tim: F7,48 = 9.29, p = 3,23E–07), while a time × temperature interaction was significant only for per (F14,48 = 2.92, p = 0.002; Fig. 1A). At ZT12, tim transcript levels decrease linearly with decreasing temperature (F1,70 = 17.96, p < 0.001, R2 = 0.20; Fig. 1B, 1D, lower panel) while per seems to be expressed at lower levels at 18 °C compared with 23 °C and 10 °C, revealing a quadratic trend in its expression (Fig. 1B, 1D, upper panel; F2,69 = 39.82, p = 3.171E–12, R2 = 0.52).
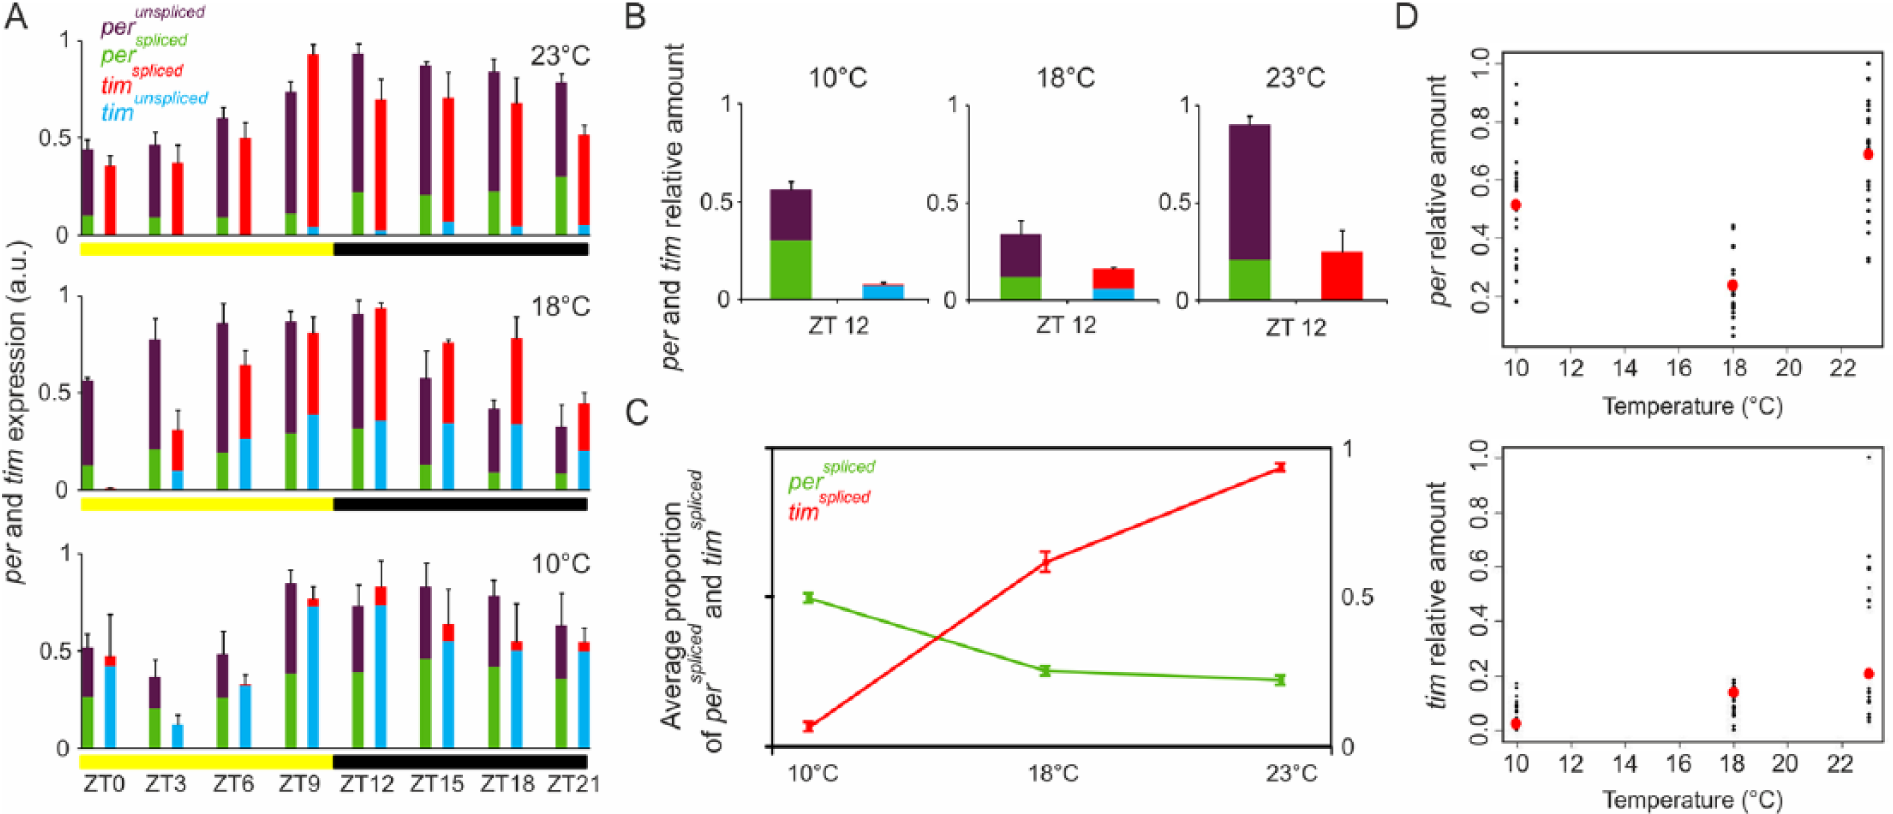
per and tim mRNA profiles under laboratory conditions. WT-ALA flies were reared in 12:12 LD at 23 °C, 18 °C, or 10 °C and collected at 3-h intervals over a complete LD cycle. Clock gene expression was estimated by semiquantitative polymerase chain reaction on total RNA heads extracts, and relative abundance of transcripts was defined as a ratio with cbp20. per and tim mRNA amounts are reported as mean ± SEM of 4 technical replicates deriving from 3 biological replicates. Different isoforms are reported in different colors: perunspliced = violet, perspliced = green, timspliced = red, and timunspliced =blue. (A) per and tim oscillation profiles at the different temperatures. The proportion of each isoform is reported in each bar. (B) Average per and tim relative mRNA total amount at 3 different temperatures at the ZT12. (C) Average proportion of perspliced (green) and timspliced (red) in relation to temperature. (D) Scatterplot of per (upper panel) and tim (lower panel) relative amounts in relation to temperature. Measured values are in black, whereas in red are reported values estimated by the quadratic (per) or linear (tim) regression.
We then analyzed the relative levels of splicing variants perspliced/perunspliced and timspliced/timunspliced and noted that the proportion of the 2 isoforms for the same gene differed considerably during the circadian cycle in a temperature-dependent manner: in particular, we observed that perspliced and timspliced isoforms increase and decrease, respectively, with the decreasing temperature (Fig. 1C; perspliced F1,70 = 142.4, p < 0.001, R2 = 0.67; timspliced F1,69 = 726.1, p < 0.001, R2 = 0.91).
per and tim Expression in Natural Conditions
Clock gene expression and locomotor activity rhythms were recorded in the wild during the different seasons. Table 1 provides the environmental records throughout these experiments and supplies information on nautical and civil twilights and the photoperiod measured between civil twilights (see the Materials and Methods section).
Major environmental information.
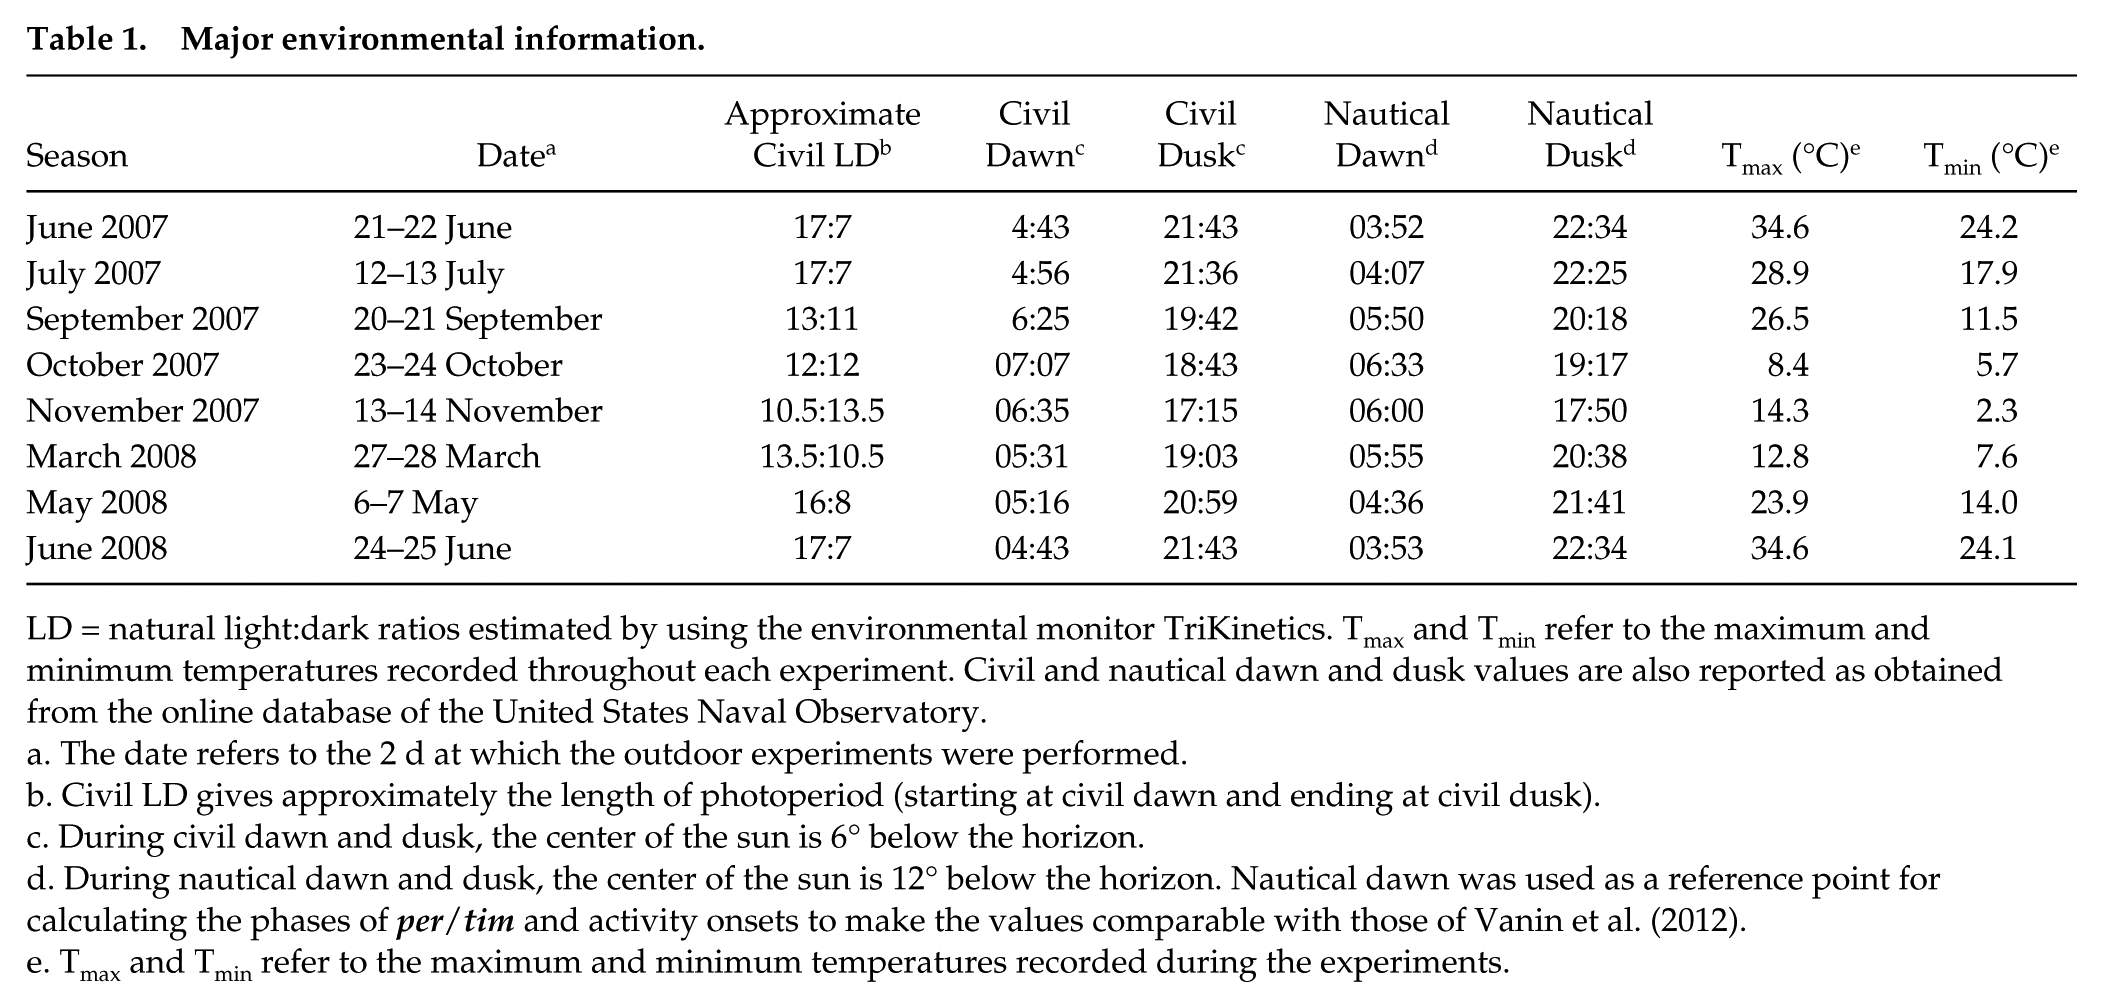
LD = natural light:dark ratios estimated by using the environmental monitor TriKinetics. Tmax and Tmin refer to the maximum and minimum temperatures recorded throughout each experiment. Civil and nautical dawn and dusk values are also reported as obtained from the online database of the United States Naval Observatory.
The date refers to the 2 d at which the outdoor experiments were performed.
Civil LD gives approximately the length of photoperiod (starting at civil dawn and ending at civil dusk).
During civil dawn and dusk, the center of the sun is 6° below the horizon.
During nautical dawn and dusk, the center of the sun is 12° below the horizon. Nautical dawn was used as a reference point for calculating the phases of per/tim and activity onsets to make the values comparable with those of Vanin et al. (2012).
Tmax and Tmin refer to the maximum and minimum temperatures recorded during the experiments.
Total mRNA cycling of per and tim was dramatically influenced by the environmental conditions (Fig. 2) and was very different compared with that observed in standard laboratory conditions (LD 12:12) described above. per cycling was significant only in June 2007, as evidenced by a significant ANOVA Time effect (F7,17 = 2.70, p < 0.05) and July 2007 (F7,16 = 36.35, p = 1,16E–08; Fig. 2A, B). In the other months/seasons, we noticed that the per maxima always fell between 2000 and 0300 (except for March 2008), so it may be that per cycling is present but more erratic. In contrast, tim levels oscillated in June 2007 (F7,16 = 7.29, p < 0.001), July 2007 (F7,16 = 26.4, p = 1.17E–07), September 2007 (F7,16 = 3.50, p < 0.05), October 2007 (F7,16 = 6.08, p < 0.005; Fig. 2A–D), and May 2008 (F7,16 = 4.21, p < 0.01; Fig. 2G). per and tim reached their maximum levels simultaneously in June 2007, October 2007, March 2008, and June 2008 (Fig. 2A, D, F, and H, respectively); a significant phase difference between the 2 oscillations was observed only in July 2007 (F7,32 = 7.94, p = 1.41E–05; Fig. 2B).
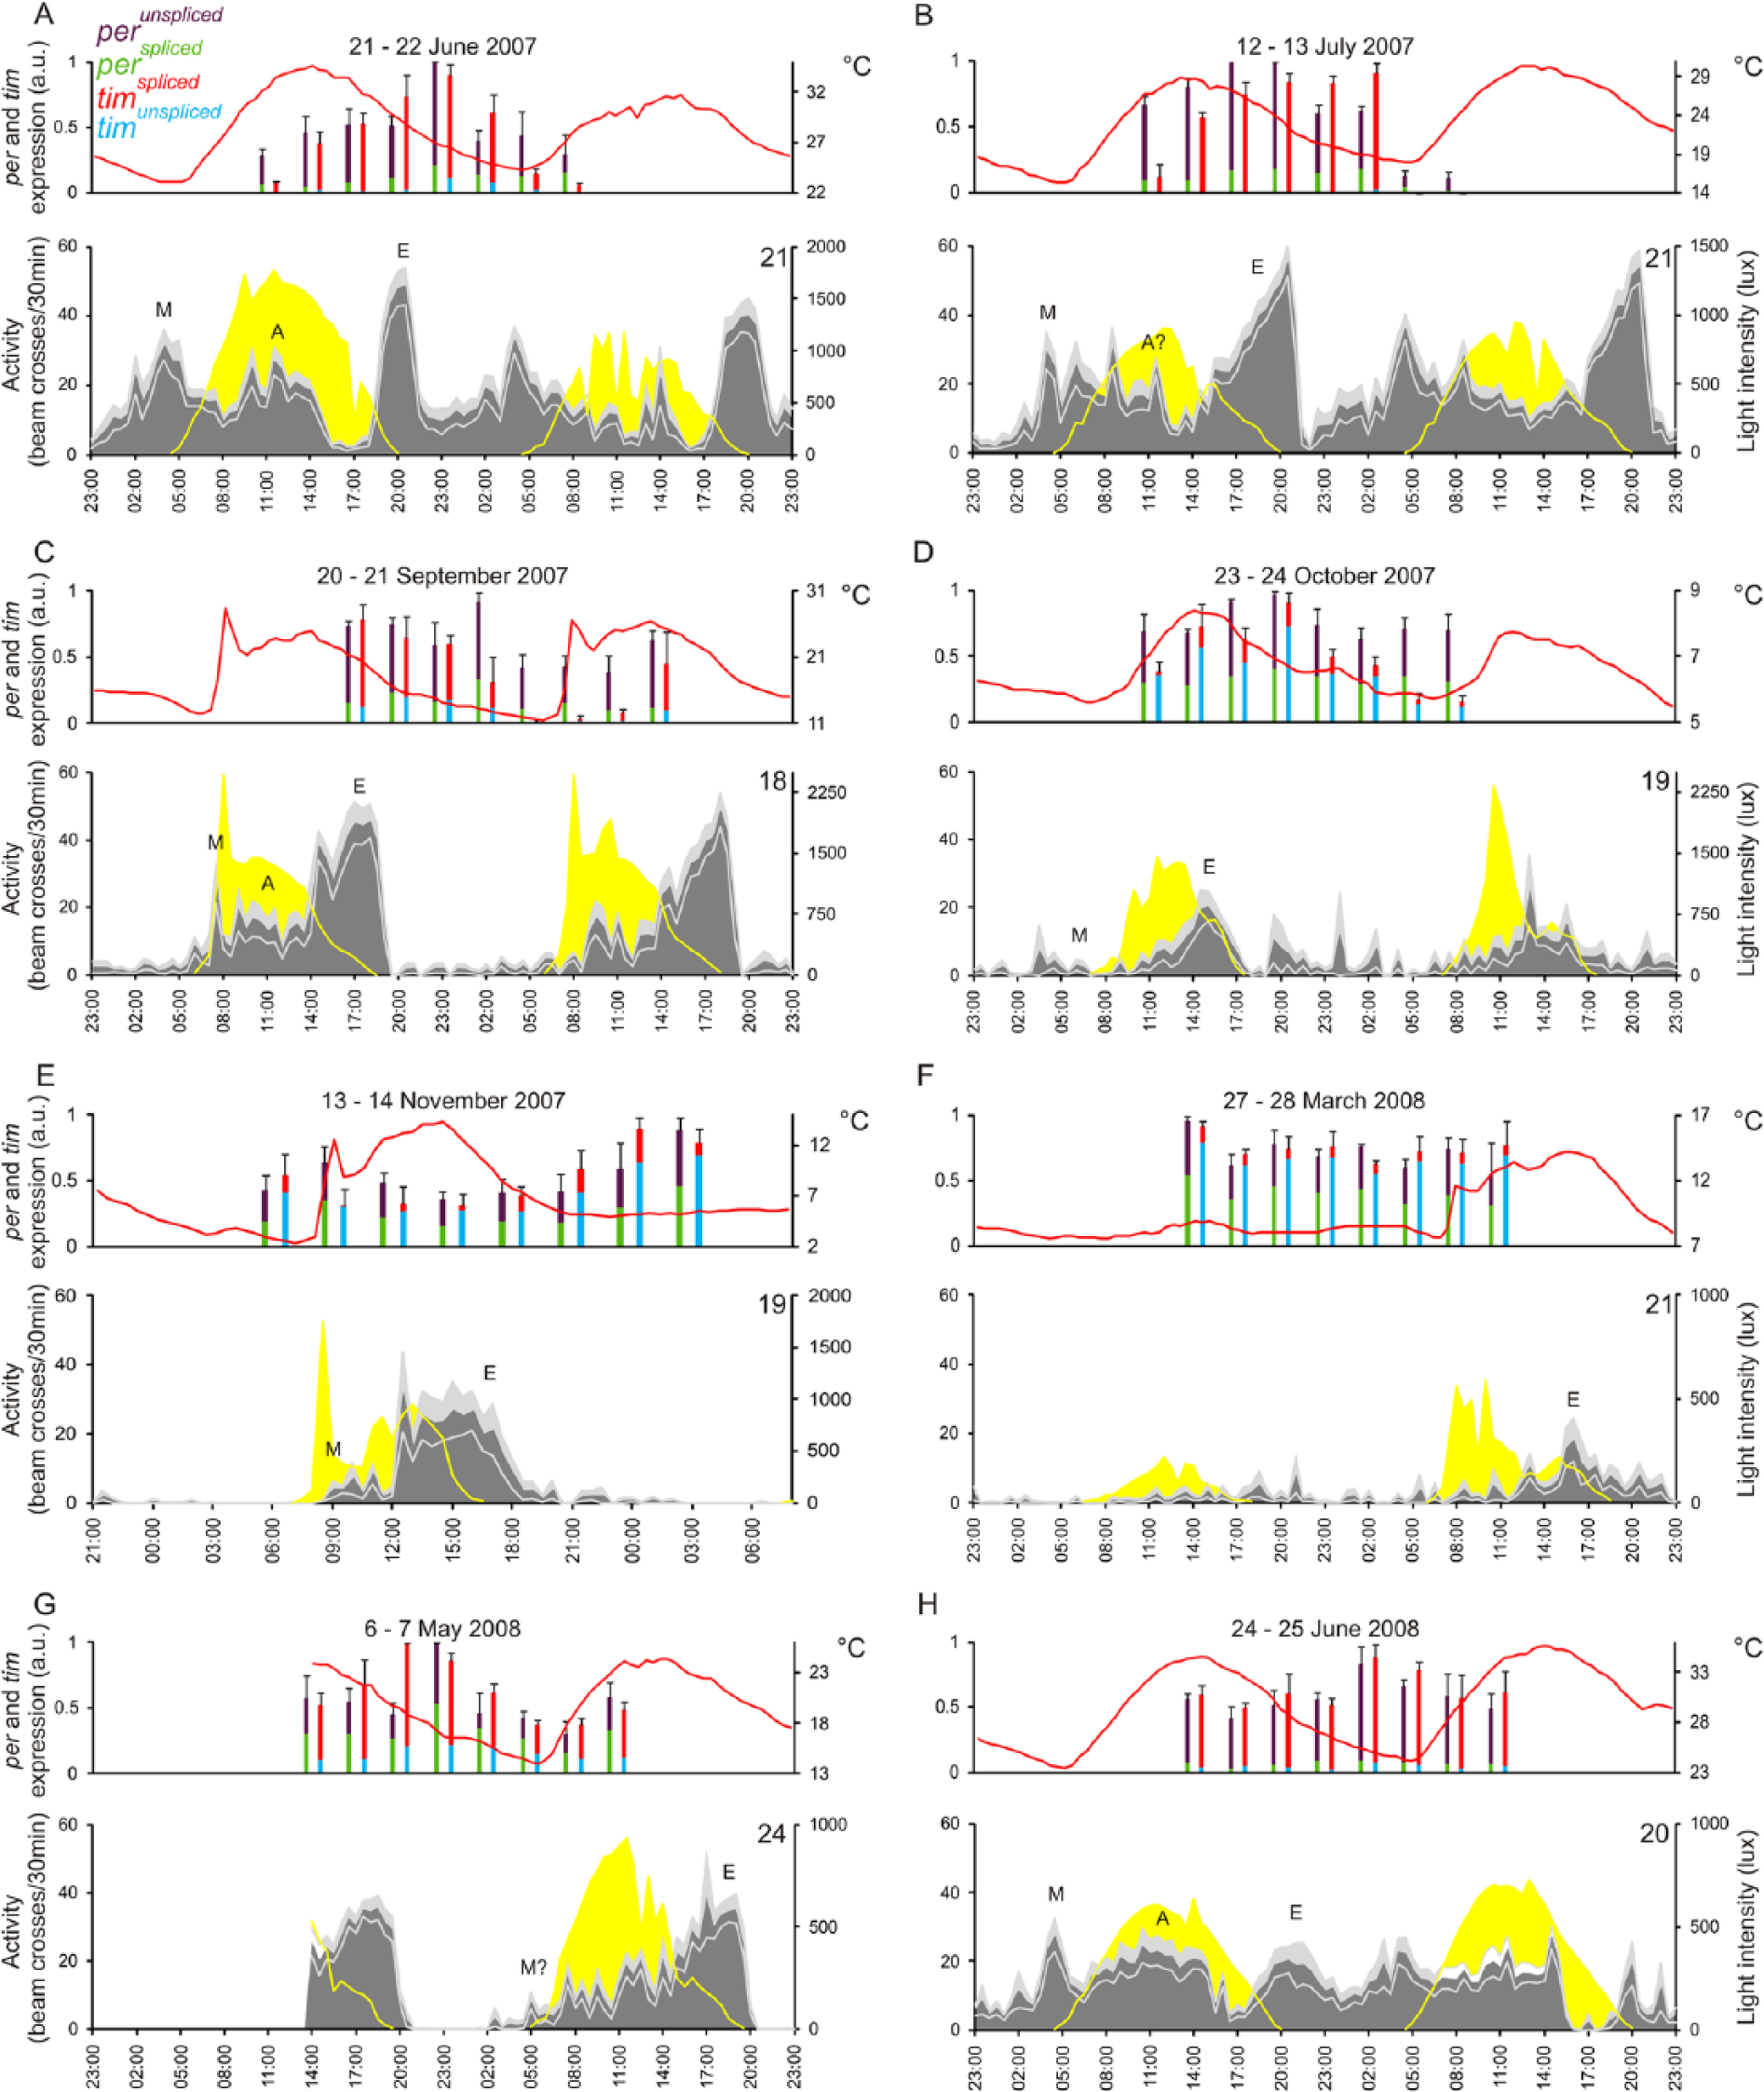
per and tim mRNA oscillations and locomotor activity profiles under natural conditions. Experiments were performed during 2 consecutive days in June, July, September, October, and November 2007 and March, May, and June 2008, and dates are reported on the top. Clock gene expression was estimated as in Figure 1. Temperature profiles are reported as a red line; light intensity measured by the environmental monitors is shown in yellow in the activity diagrams. Average locomotor activity profiles concomitantly recorded are also reported as gray areas (±SEM in light gray). The number of flies monitored is reported on each activity profile. Different isoforms are reported in different colors: perunspliced = violet, perspliced = green, timspliced = red, and timunspliced =blue. Morning (M), evening (E), and afternoon (A) peaks are indicated.
We monitored the locomotor activity (depicted in gray in Fig. 2) of the flies under the same environmental conditions adopted for the molecular experiments and determined the onsets of morning (M) and evening (E) activity for each individual fly (shown as averages in Fig. 2 and Fig. 3A). We observed a strong seasonal influence on the onsets of M and E activity (also observed by Vanin et al., 2012). In fact, M onset was earlier in summer (Fig. 2A, B, and H and Fig. 3A) and later in spring and autumn (Fig. 2F–G and C–E, respectively, and Fig. 3A), whereas E onset was later in summer (Fig. 2A, B, and H and Fig. 3A) compared with spring (Fig. 2F–G and Fig. 3A) and even later compared with autumn (Fig. 2C–E and Fig. 3A). The prominent A (afternoon) component first described by Vanin et al. (2012) was confirmed and observed most clearly in the warmer months of June, July, and September (Fig. 2A, B, C, and H).
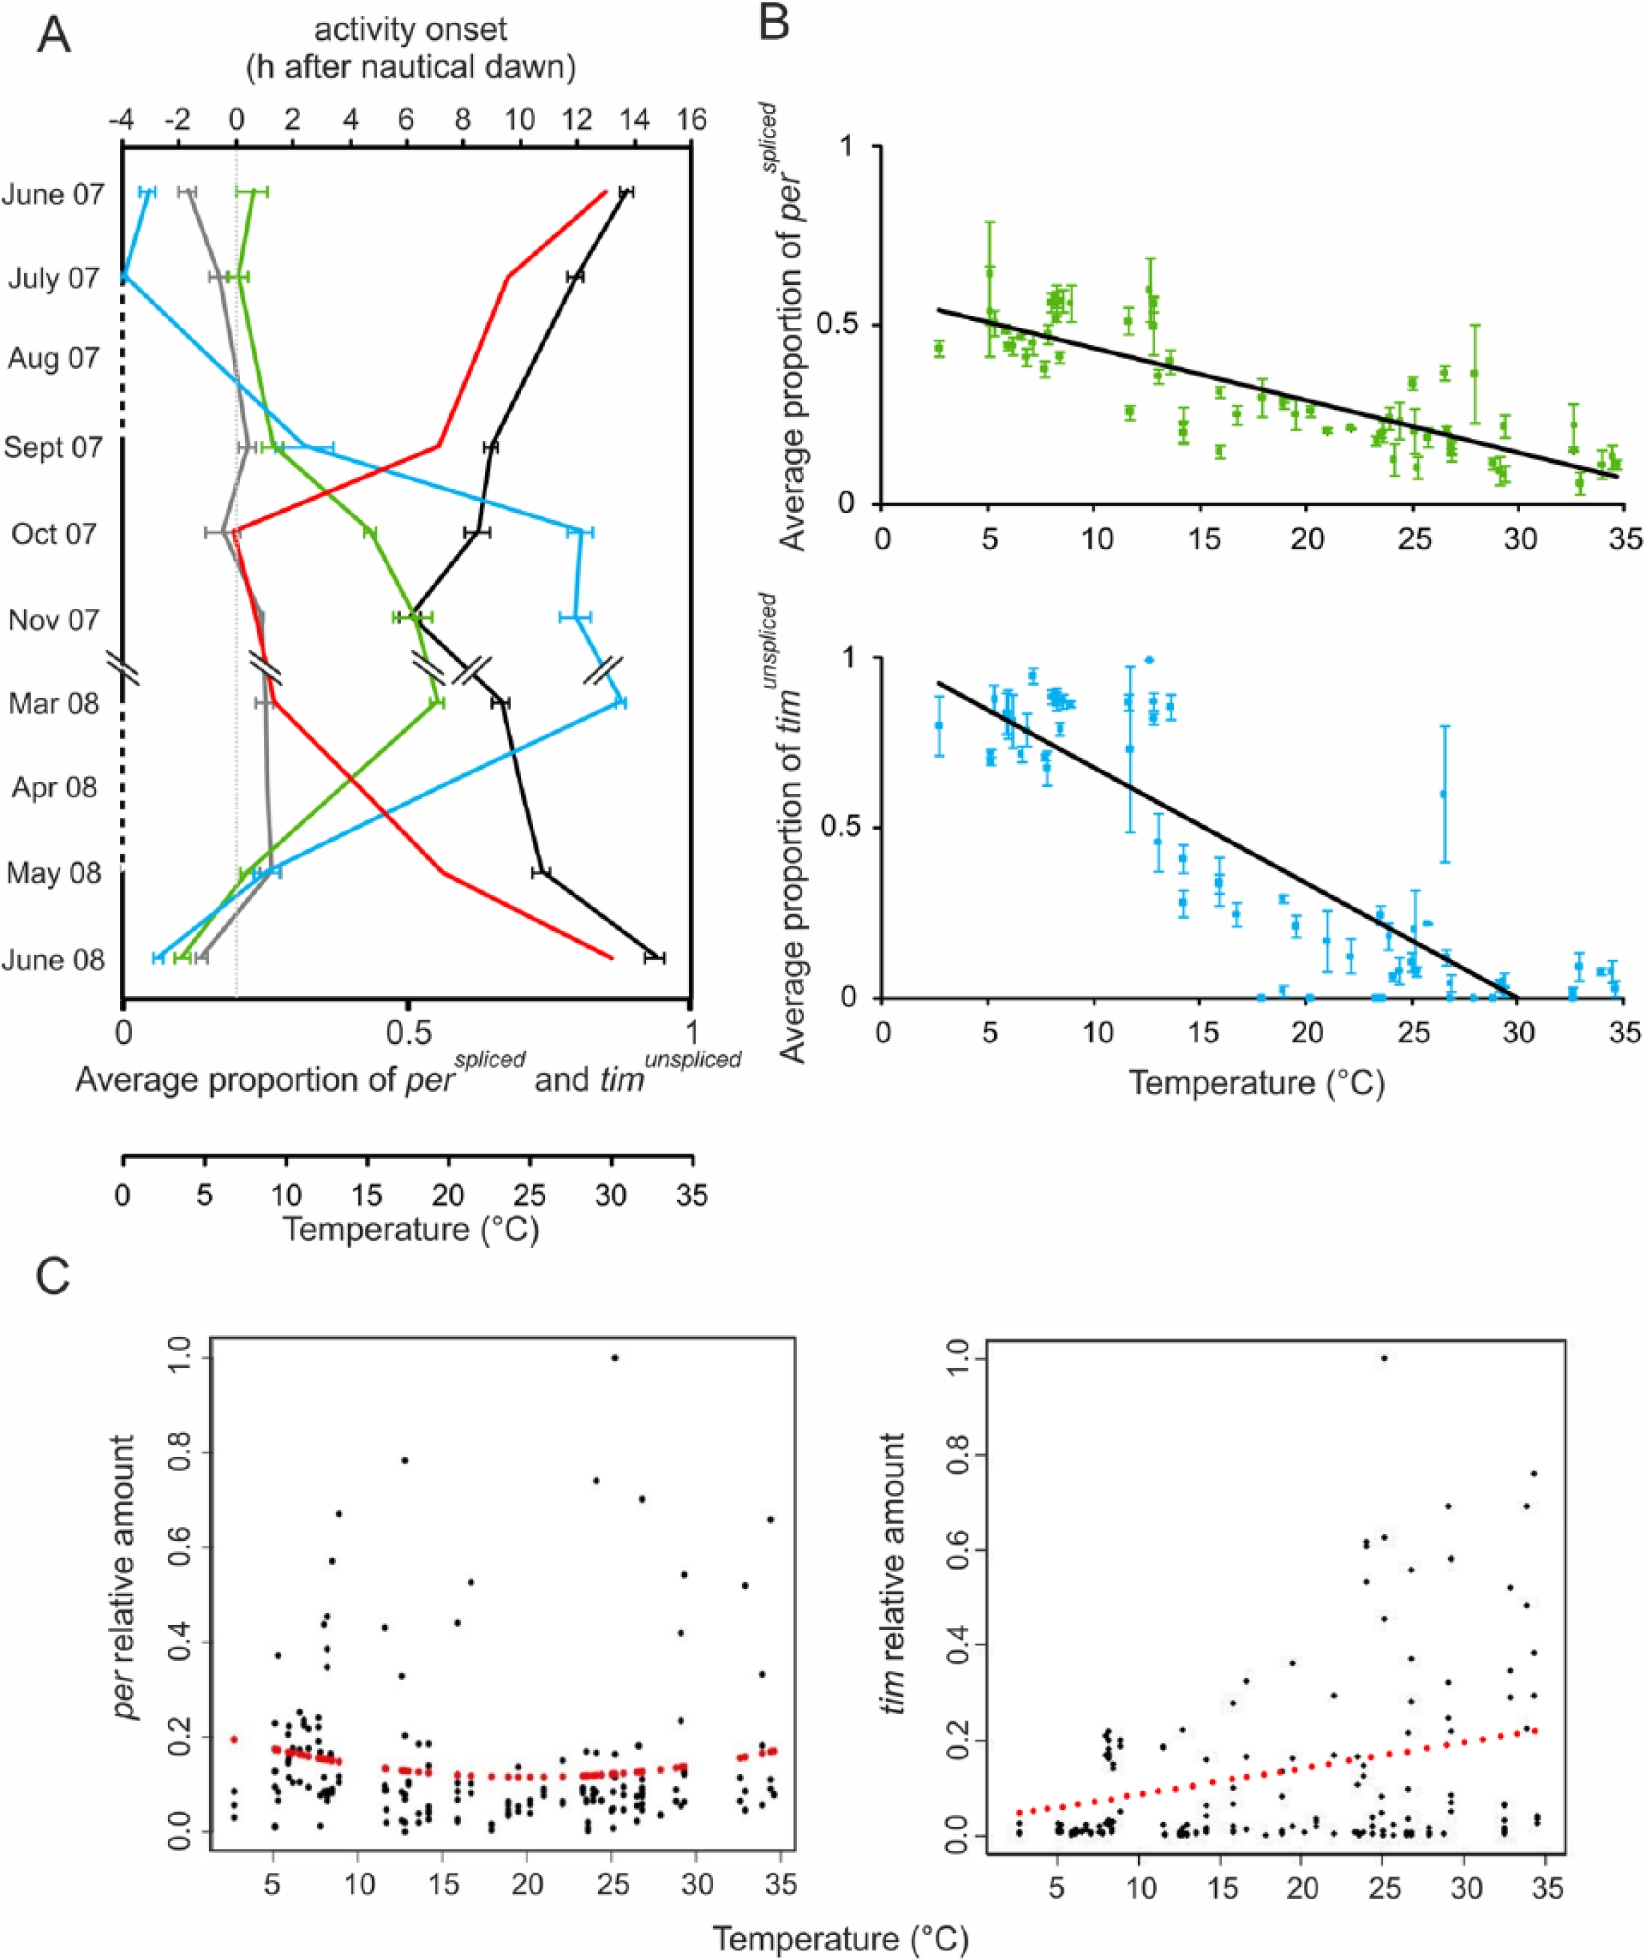
per and tim splicing features. (A) Average amount of perspliced (green) and timunspliced (blue), phase activity onset of morning (gray) and evening (black) activity bouts in different seasons referenced to nautical dawn (0) and temperature (red). (B) Average proportion of perspliced (green) and timunspliced (blue) in relation to temperature in natural conditions. (C) Scatterplot of per (spliced + unspliced, right panel) and tim (spliced + unspliced, left panel) relative amounts in relation to temperature. Measured values are in black, whereas in red are reported values estimated by the quadratic (per; F2,189 = 1.63, p = 0.19, R2 = 0.01) or linear (tim; F1,190 = 28.01, p < 0.001, R2 = 0.12) regression.
Total per and tim mRNA amounts were also influenced by seasonal or even daily changes of temperature and day length in the wild (Fig. 2 and Fig. 3C). Total tim transcription decreases with lower temperature, whereas per, while not showing a significant quadratic trend, nevertheless does show some similarities in thermal profile with our laboratory results (Fig. 3C; tim F1,190 = 28.01, p < 0.001, R2 = 0.12; per F2,189 = 1.63, p = 0.19, R2 = 0.01). However, we observe a clear influence of environmental parameters when we analyze the relative proportion of the 2 alternative transcripts for each gene. Cycling of perspliced, perunspliced, timspliced, and timunspliced isoforms differed considerably among the seasons. Moreover, levels of perspliced and timunspliced mRNAs increase with the decreasing temperature (Fig. 3B; perspliced F1,189 = 259.7, p < 0.0001, R2 = 0.58; timunspliced F1,190 = 467.9, p < 0.0001, R2 = 0.71).
Across the seasons, we also detected a correlation between the levels of perspliced and timunspliced and E onset (Fig. 3A; r = −0.65 p = 0.08, and r = −0.71, p = 0.047, respectively; N = 8 in both cases), in accordance with what has already been described in laboratory conditions by Majercak et al. (1999, 2004), although in our experiments, in nature is significant only for timunspliced.
Molecular Features of TIMUNSPLICED
To investigate a possible role for tim alternative splicing, we studied the TIMUNSPLICED isoform in terms of affinity for the clock proteins CRYPTOCHROME and PERIOD in the yeast 2-hybrid assay (Golemis and Brent, 1997). Two major alleles of tim, ls-tim and s-tim, that use 2 alternative translational starts to generate long (L-TIM1421) and short (S-TIM1398) or only short (S-TIM) isoforms, respectively, have already been characterized (Rosato et al., 1997; Sandrelli et al., 2007). Yeast 2-hybrid experiments in which the 2 isoforms were tested revealed a stronger affinity of CRY for S-TIM compared with that for L-TIM (Sandrelli et al., 2007). Therefore, in the yeast assays, CRY directly fused to LexA (bait) was challenged with the 4 possible TIM constructs (all the combinations between N-terminus and C-terminus, namely, L-TIMUNSPLICED, L-TIMSPLICED, S-TIMUNSPLICED, S-TIMSPLICED) as preys. While all the TIM constructs were expressed at comparable levels in yeast (Suppl. Fig. S1), very high levels of interaction were observed between CRY and the “UNSPLICED” variants of TIM (L-TIMUNSPLICED and S-TIMUNSPLICED; F3,24 = 935.18, 5.56E–25) in the presence of light. The interaction also occurred in the dark, although with lower affinity (Fig. 4A). In particular, we observed a strikingly enhanced interaction (10-fold) between CRY and S-TIMUNSPLICED, compared with L-TIMUNSPLICED (least significant difference post hoc analysis, p < 1E–24). The “SPLICED” isoforms showed a lower light-dependent interaction with CRY, albeit stronger for S-TIMSPLICED than L-TIMSPLICED (F1,12 = 73.61, p = 1.8E–06), as previously observed (Sandrelli et al., 2007). We also examined the interaction between the TIM isoforms and a large fragment of PER (C2_residues 233-685) that is stable in yeast (Rosato et al., 2001): a strong affinity was observed between C2 and S-TIM, especially in the dark (F7,48 = 46.03, p = 3.6E–19), while no significant differences were observed between the SPLICED and the UNSPLICED variants (Fig. 4B). Taken together, these results indicate that the “UNSPLICED” variants of TIM have a stronger affinity only for CRY but not for PER.
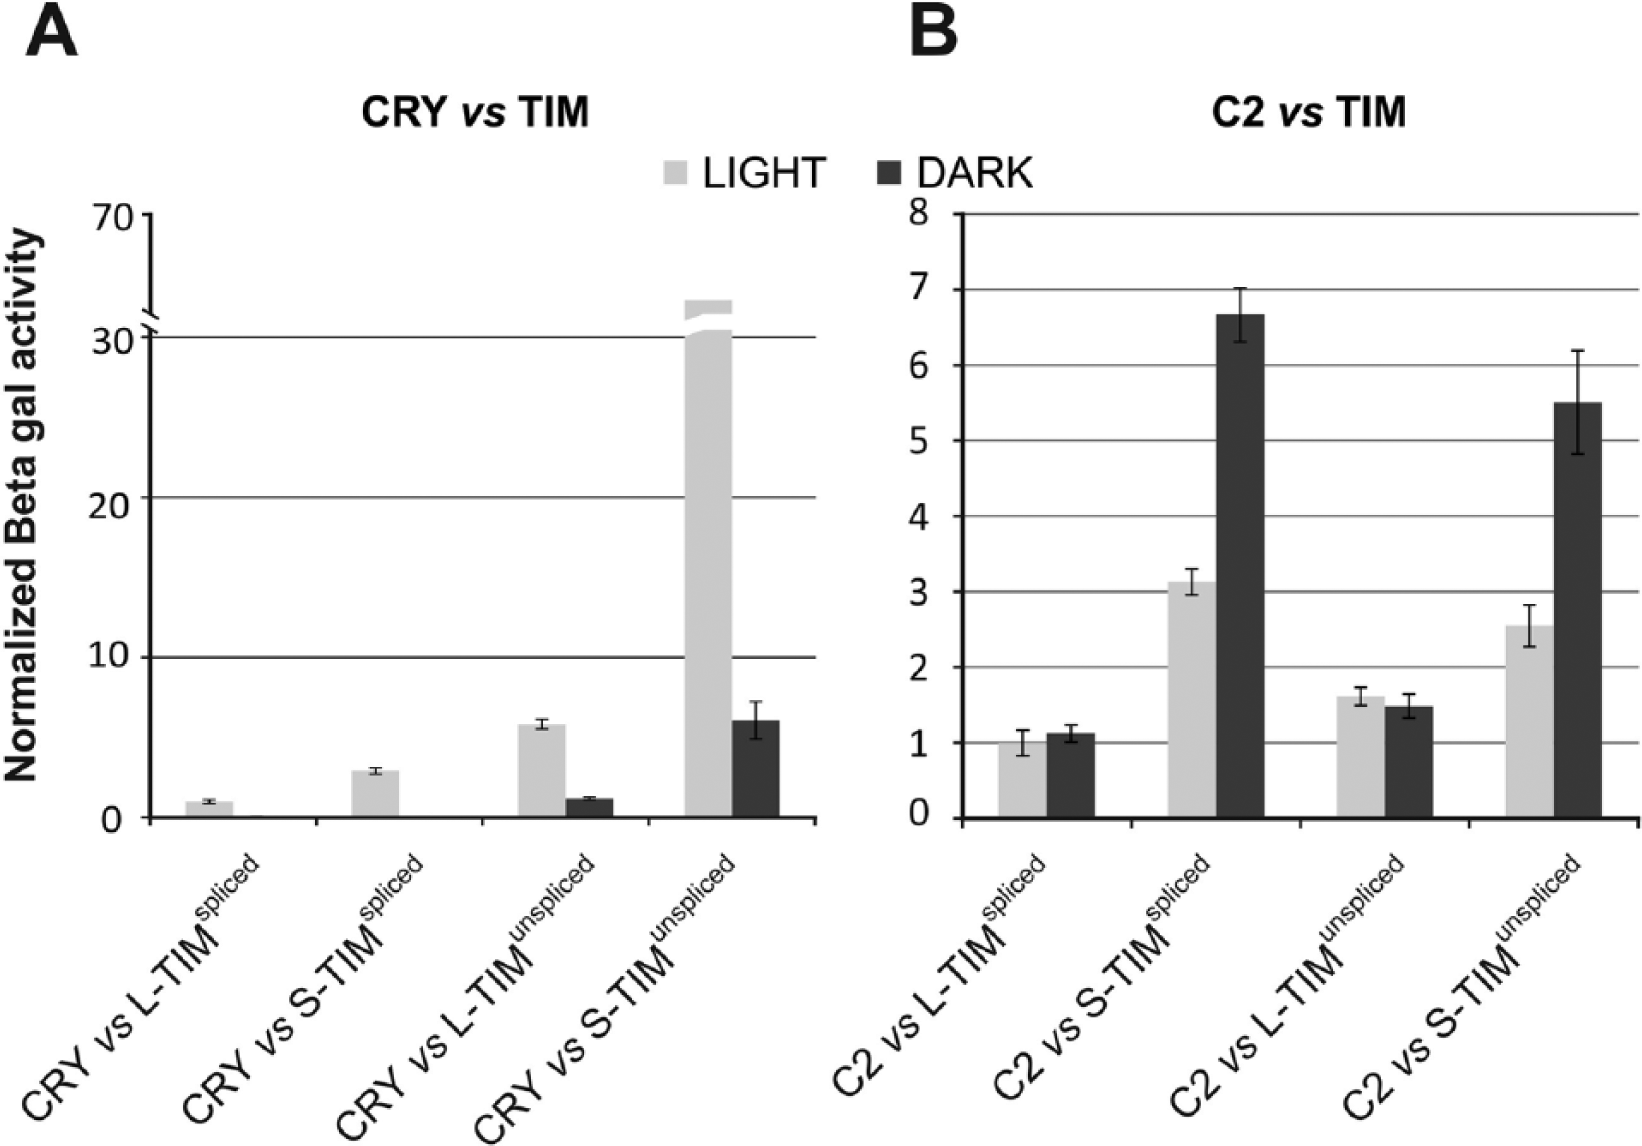
Molecular features of TIMUNSPLICED. TIM interactions with CRY (A) and PER (B) in the yeast 2-hybrid system. β-galactosidase activity (Miller units) is reported for each fusion. Mean ± SEM of at least 7 independent clones for each fusion, analyzed in triplicates, is shown. (A) In light, the “UNSPLICED” variants of TIM (L-TIMunspliced and S-TIMunspliced) show high levels of interaction with CRY (F3,24 = 935.18, p < 0.001). (B) S-TIM strongly interacts with C2, especially in the dark (F7,48 = 46.03, p < 0.001), while no differences were observed between the SPLICED and the UNSPLICED variants.
Discussion
We have observed some dramatic and unexpected differences in the molecular cycling of per and tim mRNAs under laboratory and natural conditions, which complement the natural behavioral observations initially made by Vanin et al. (2012). In the laboratory, per and tim mRNA oscillations were in agreement with previous results (Majercak et al., 1999; Boothroyd et al., 2007) for all 3 temperatures considered in these experiments. We detected a quadratic trend of expression for per mRNA, with lower levels at 18 °C compared with 23 °C and 10 °C. This finding is consistent with the enhanced PER expression in clock neurons observed in some natural populations of Drosophila melanogaster exposed to low-temperature stress (Maguire et al., 2014). One idea that may explain this result is that under stressful colder conditions, the requirement for robust circadian rhythmicity becomes greater and hence higher levels of expression for the primary negative regulator (Rothenfluh et al., 2000; Maguire et al., 2014). The relative amount of tim at higher temperature was quite variable under natural and laboratory conditions (Figs. 2D, 3C), possibly reflecting the heterogeneity of the genetic background. However, Majercak et al. (1999) also reported higher relative levels of tim at higher temperatures, so the underlying positive relationship between temperature and tim levels is consistent between studies. However, it was interesting that Majerack et al. (1999) observed higher relative levels of per at 18 °C than at 25 °C, although we found the opposite. Nevertheless, we obtained the same negative relationship with temperature as these authors when we compared our results between 10 °C and 18 °C, in that the colder temperature gave higher relative per levels. Perhaps the different thermal selective regimes imposed on an inbred strain that has been maintained for decades in the laboratory compared with a recent wild isolate may be relevant here?
In nature, per mRNA shows the strongest evidence for cycling only in June 2007 and July 2007, whereas tim oscillations are robustly maintained over most of the year, but lost in November 2007 and March 2008, the 2 months sharing the same short photoperiod and cold temperatures. We noted that both per and tim cycled in June 2007 but not in June 2008, despite photoperiod and temperature being almost the same in both cases. The major difference between these 2 months was the light intensity, which was much lower in 2008 (June 2007: max 1800 lux; June 2008: max 730 lux) and may have been responsible for the different cycling mRNA dynamics and perhaps even for the locomotor E peak amplitude, which was much more pronounced in 2007 (Fig. 2).
As reported above, per and tim reached their maxima simultaneously in June 2007, October 2007, March 2008, and June 2008, while a significant phase difference between the 2 oscillations was observed only in the hottest month of July 2007. This is in contrast to the observed phase-decoupling of the corresponding proteins in clock neurons, with PER cycling lagging TIM that was observed for most of the year (Menegazzi et al., 2013). As the mRNA is extracted from the whole head, while Immuno Cito Chemical (ICC) analysis of the corresponding proteins reflects the temporal dynamics of the clock neurons, it may be that substantial temporal differences exist in mRNA dynamics between the brain and the eyes or that posttranscriptional controls differ between these tissues (Cheng and Hardin, 1998). Alternatively, it may be that the PER and TIM proteins are simply more stable with respect to environmental fluctuations than their corresponding mRNAs.
Both in laboratory and natural conditions, we observed a relationship between temperature and perspliced and timunspliced. Edery and colleagues (Majercak et al., 1999, 2004) have shown that temperature plays a prominent role in differential per splicing, which leads to an earlier accumulation of per transcript and protein at colder temperatures, with a concomitant advance in the E component of activity. In natural conditions, we confirmed the relationship between accumulation of perspliced variant, low temperature, and E onset, in accordance to what has been described in laboratory conditions. However, as described by Vanin et al. (2012), between May and September there was barely any change in the position of the E component, and any changes that did occur did not correlate with temperature nor with photoperiod, although temperature variation was quite substantial. For example, Tmax in the considered period ranged between 8.4 °C and 26.5 °C (Fig. 3A; Table 1).
It was noted in Menegazzi et al. (2013) that under winter conditions, PER and TIM were not detectable in the clock neurons, and the flies hardly moved, probably reflecting their state of diapause, which is induced by colder temperatures and shorter photoperiods (Tauber et al., 2007). Despite this observation, when we analyzed whole heads, we still detected low levels of expression of both per and tim mRNAs in winter, although this may predominantly reflect eye expression rather than that of clock neurons. Although natural variants of TIM are known to significantly modulate the expression of diapause in ovarian arrest (Tauber et al., 2007; Sandrelli et al., 2007), the molecular bases of the photoperiodic and thermal stimuli that generate this phenotype are not well understood (Schiesari et al., 2011). However, as timunspliced expression increases with lower temperature, it implies that the corresponding TIM protein might play a role in clock function during the cold season.
To investigate possible phenotypic implications for the tim splice variants, we characterized the interaction properties of the different TIM isoforms in yeast with the known circadian partners PER and CRY. While the binding with PER was not influenced by the splice-mediated variation at the TIM C-terminus, we observed an exceptionally high affinity of TIMunspliced for dCRY, particularly when in association with the natural SHORT N-terminal TIM variant, s-TIM. The short TIM variant represents the ancestral allele, which is found in northern Europe (Tauber et al., 2007). The long allele (which generates both long and short TIM isoforms and is termed ls-tim) probably arose in southern Europe and appears to be spreading by natural selection (Tauber et al., 2007). Flies carrying ls-tim are less sensitive than s-tim to long photoperiods in terms of their diapause response, so they enter diapause under colder conditions even when exposed to longer summer photoperiods (Tauber et al., 2007). Under the extreme seasonal environments of Europe, this may be adaptive, as might be the reduced circadian light sensitivity of ls-tim (Peschel et al., 2006; Sandrelli et al., 2007), which means the circadian clock is more resistant to arrhythmicity during the very long summer photoperiods of Europe, particularly northern Europe (Pittendrigh et al., 1991; Sandrelli et al., 2007) Thus, ls-tim may be spreading northward from its place of origin, most likely southeastern Italy (Tauber et al., 2007). The exceptionally strong interaction of s-TIMunspliced with CRY would suggest that the light response may be stronger for s-tim flies under colder conditions (see also Sandrelli et al., 2007). It therefore follows that this strong light response of s-tim flies provides yet another reason why the fitness of s-tim in a seasonal environment such as Europe may be compromised compared with ls-tim.
In conclusion, our results reveal that per mRNA cycling from fly heads is not generally observed throughout the year under natural conditions, whereas tim RNA cycling is far more robust. When both transcripts do cycle, their phases are similar except for the very hottest summer months, which suggests that the 2 genes are regulated differently at this time. The splicing of both transcripts is intriguing, in that the correlation of the per splice isoforms with the siesta, and the associated movement of the evening component to later in the day under hot conditions (Majercak et al., 1999, 2004; Collins et al., 2004) occurs only at the upper range of natural temperature cycles, suggesting that the splicing is an adaptation to heat, rather than an adaptation to cold. A dramatic molecular phenotype has also been uncovered in the tim thermal splicing yeast 2-hybrid assay in which the product of the ancestral s-timunspliced variant binds very strongly to CRY. We presume that this may have some functional implications that are relevant to circadian photoreception and perhaps to seasonal responses such as diapause. Future studies will focus on the phenotypic implications of tim splicing under different seasonal environments.
Footnotes
Acknowledgements
We thank Chiara Romualdi, Alessandro Rossi, and Matteo Simonetti (University of Padova) for their help with statistical analysis (C.R.), cloning (A.R.), and graphical support (M.S.). This work was funded by grants from the European Community (6th Framework Project EUCLOCK n° 018741 to R.C. and C.P.K.); Fondazione Cariparo (Progetti di Eccellenza 2011–2012 to R.C.); University of Padova (grant CPDA099390/09 to G.M); Consiglio Nazionale delle Ricerche e Ministero dell’Istruzione, Università e Ricerca (EPIGEN–Progetto Bandiera Epigenomica to R.C.); INsecTIME Marie Curie Initial Training Network (grant PITN-GA-2012-316790 to R.C. and C.P.K.). E.W.G. was funded under a BBSRC grant to C.P.K. R.C. and C.P.K. would like to dedicate this paper to the memory of our friend of 25 years, Lino Saez, who sadly died on October 24th 2014 after a long illness. Lino helped us with the work reported in this paper and his critical thinking, generosity, Latin charm, and good humour will long be remembered.
Notes
References
Supplementary Material
Please find the following supplemental material available below.
For Open Access articles published under a Creative Commons License, all supplemental material carries the same license as the article it is associated with.
For non-Open Access articles published, all supplemental material carries a non-exclusive license, and permission requests for re-use of supplemental material or any part of supplemental material shall be sent directly to the copyright owner as specified in the copyright notice associated with the article.