
Abstract
The circadian clock modulates the adaptive daily patterns of physiology and behavior and adjusts these rhythms to seasonal changes. Recent studies of seasonal locomotor activity patterns of wild-type and clock mutant fruit flies in quasi-natural conditions have revealed that these behavioral patterns differ considerably from those observed under standard laboratory conditions. To unravel the molecular features accompanying seasonal adaptation of the clock, we investigated Drosophila’s neuronal expression of the canonical clock proteins PERIOD (PER) and TIMELESS (TIM) in nature. We find that the profile of PER dramatically changes in different seasons, whereas that of TIM remains more constant. Unexpectedly, we find that PER and TIM oscillations are decoupled in summer conditions. Moreover, irrespective of season, PER and TIM always peak earlier in the dorsal neurons than in the lateral neurons, suggesting a more rapid molecular oscillation in these cells. We successfully reproduced most of our results under simulated natural conditions in the laboratory and show that although photoperiod is the most important zeitgeber for the molecular clock, the flies’ activity pattern is more strongly affected by temperature. Our results are among the first to systematically compare laboratory and natural studies of Drosophila rhythms.
Most studies in circadian biology necessarily use simplified laboratory conditions such as rectangular light-dark cycles and constant temperatures, yet the natural environment is highly dynamic, with major parameters such as light intensity and temperature varying continuously during the day and the seasons (Vanin et al., 2012). In Drosophila clock research, many spectacular advances have been generated in standard laboratory conditions in terms of understanding the underlying molecular features of circadian behavior (reviewed in Allada and Chung, 2010; Hardin, 2011). Recently, a study of circadian behavioral and some molecular components of the fruit fly clock under quasi-natural conditions revealed that wild-type flies and some canonical clock mutants behaved quite differently from what was expected from laboratory studies (Vanin et al., 2012). However, a comprehensive analysis of PERIOD (PER) and TIMELESS (TIM) proteins under seasonal conditions in the relevant clock cells was not performed.
Under laboratory LD regimes, TIM begins to accumulate in the cytoplasm of the clock neurons at the beginning of the dark phase, moves into the nucleus toward the middle of darkness, reaches its peak levels at the end of the dark phase and disappears quickly after lights-on. PER has been reported to enter the nucleus earlier than TIM and disappear a few hours after TIM. Despite the advance in PER nuclear accumulation and its delay in degradation, PER and TIM reach their peak levels more or less simultaneously toward the end of the dark phase (Hunter-Ensor et al., 1996; Lee et al., 1996; Marrus et al., 1996; Myers et al., 1996; Zeng et al., 1996; Shafer et al., 2002, 2004; Bachleitner et al., 2007; Yoshii et al., 2009; Peschel et al., 2009). We have therefore attempted to place these laboratory results in a natural ecological context by examining PER and TIM dynamics for all 4 seasons to complement the largely behavioral and genetic results of Vanin et al. (2012). We report some surprising features of the seasonal patterns of PER and TIM expression that illuminate our understanding of the effects of natural photoperiod and temperature cycles, and we managed to partially simulate these patterns in the laboratory.
Materials and Methods
Flies
The WT-ALA (Wild Type Alto Adige) strain we used was established from several natural isolates collected as isofemale lines from northern Italy (Val Venosta–Alto Adige, 46° 30′ N) in 2004 (Vanin et al., 2012). To maintain levels of initial natural genetic variability in the WT-ALA strain, individuals coming from the original isofemale lines (maintained in the laboratory as independent cultures) were routinely added to the strain in use. Flies were normally kept in incubators with alternative cycles of 12 h of light and 12 h of dark (LD 12:12), at 23 °C in Padova and 25 °C in Würzburg, in vials containing standard cornmeal/agar medium.
Entrainment and Locomotor Activity
The natural field station was located in a suburban garden in Villorba, Treviso (Italy; 45° 41′28″ N, 12° 15′11″ E), 22 m above sea level well away from street lighting and roads. Environmental monitors (DEnM, TriKinetics Inc, Waltham, MA) were used to record temperature (°C) and light intensity (lux) during all the experiments performed in the wild (Vanin et al., 2012). Times of civil and nautical twilights were obtained from the United States Naval Observatory (USNO) (http://aa.usno.navy.mil/faq/docs/RST_defs.php). The approximate natural photoperiod length was calculated using civil twilight (sun 6° below the horizon) as reference for the beginning and end of the day, respectively (Table 1). Nautical dawn (sun 12° below the horizon) was used as reference point for determining the phases of PER/TIM maxima and the phases of locomotor activity bouts to be consistent with Vanin et al. (2012).
Major environmental information obtained from the online database of the United States Naval Observatory (2011).
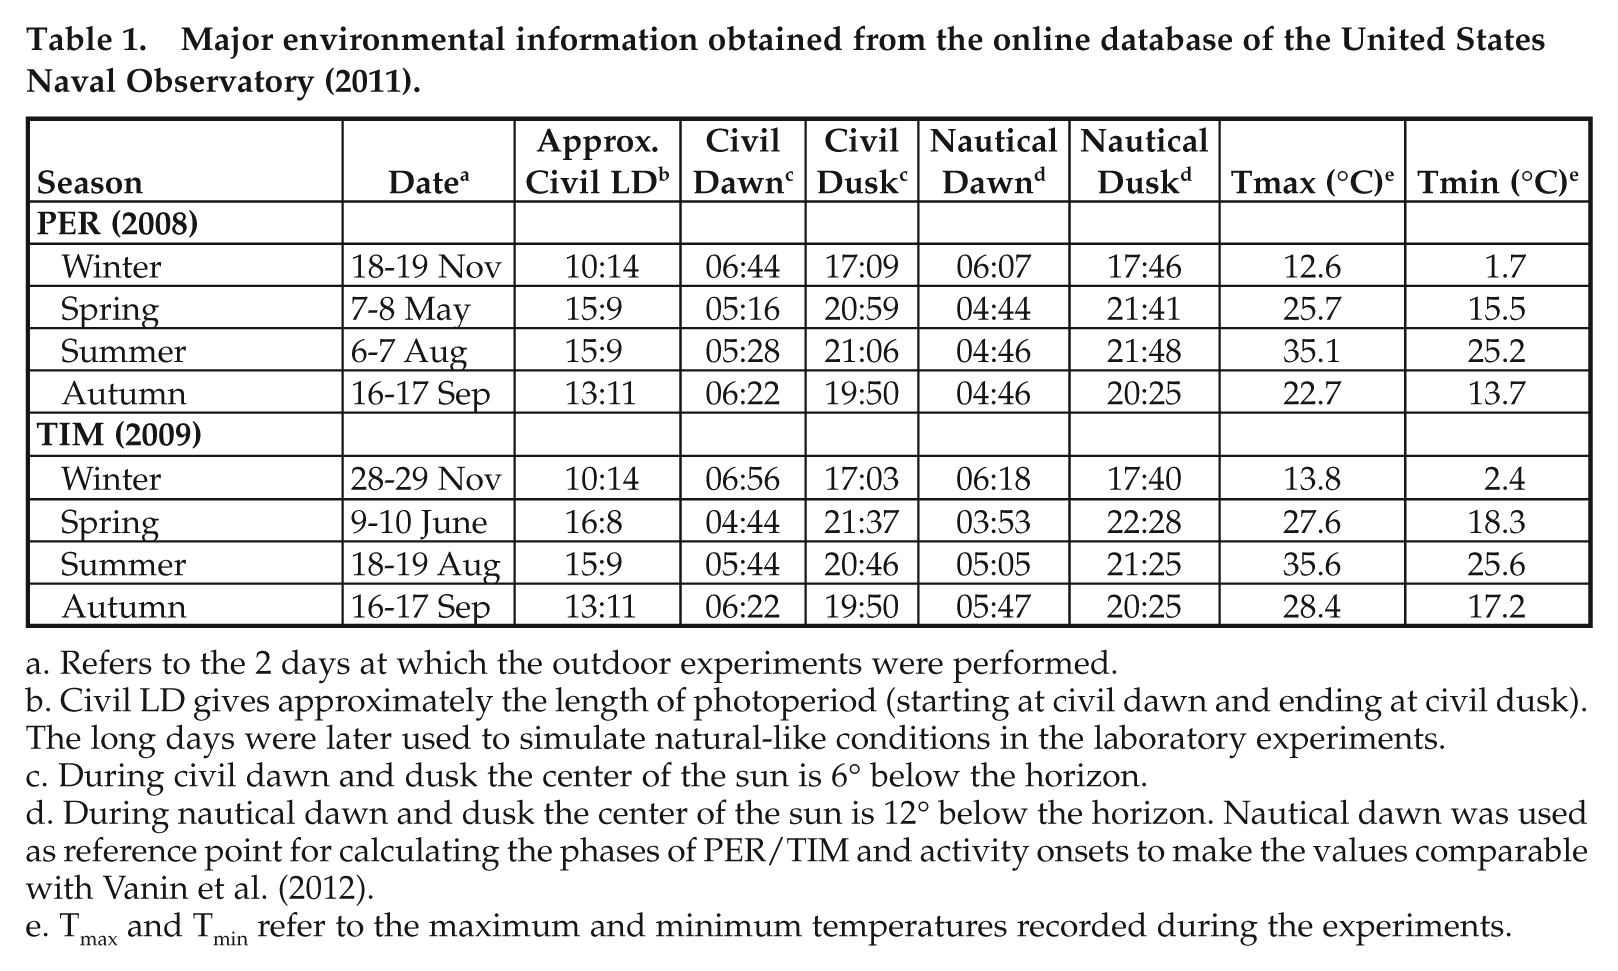
Refers to the 2 days at which the outdoor experiments were performed.
Civil LD gives approximately the length of photoperiod (starting at civil dawn and ending at civil dusk). The long days were later used to simulate natural-like conditions in the laboratory experiments.
During civil dawn and dusk the center of the sun is 6° below the horizon.
During nautical dawn and dusk the center of the sun is 12° below the horizon. Nautical dawn was used as reference point for calculating the phases of PER/TIM and activity onsets to make the values comparable with Vanin et al. (2012).
Tmax and Tmin refer to the maximum and minimum temperatures recorded during the experiments.
Locomotor activity was quantified by using TriKinetics activity monitors as in Vanin et al. (2012). Monitors were shielded from direct sunlight and from rain. The onsets of morning and evening components (M and E, respectively) were determined for each individual fly as described in Vanin et al. (2012) and Menegazzi et al. (2012). Activity onset was set if continuous movement with a steady increase of activity (and no more than ½-h time bin without any or lower activity than the previous bin) led to a peak.
For the laboratory entrainment, vials containing flies were housed in light boxes equipped with white LEDs (Luminotronix LED-Technik, GmbH, Jungingen, Germany) programmed to change light intensity according to the experimental light regime (Rieger et al., 2007). The light boxes were placed into an incubator (I-36NL, Percival Scientific Inc., Perry, IA) in order to control temperature conditions. Flies were entrained under long photoperiods (16 h of light, mimicking natural spring-summer conditions) with simulation of dawn and dusk (irradiance was increased/decreased in 1-min steps during 1.5 h, as described in detail in Rieger et al., 2007, 2012), either at constant temperature (20 or 30°C) or temperature cycles (15-25 °C and 25-35 °C), with minimum temperature at ZT0 and maximum temperature at ZT11 (Yoshii et al., 2009). Temperature cycles were defined by linearly increasing/decreasing temperature in 1-min steps from the lowest to the highest temperature and vice versa. Light was provided by white LEDs (Luminotronix LED Technik, GmbH, Jungingen, Germany) and adjusted to reach 100 lux (~19 µW/cm2) at maximum intensity.
Immunocytochemistry
For the immunocytochemistry experiments, flies were entrained either under natural conditions or in the laboratory. In both cases, flies were kept in glass vials containing 20 individuals each that experienced 3 complete days of entrainment before brain sampling. For the natural experiments, vials were placed exactly where the monitors for locomotor activity recording were also located. Flies were sampled at least every 3 h under natural conditions. Additional time points were added if necessary. Under laboratory conditions, flies were sampled every 2 h. At least 10 flies were collected and dissected per each time point. Sampled flies were fixed in 4% paraformaldehyde (PFA) by incubating for approximately 2.5 h on a rotating wheel. They were then washed 3 times for 15 min each in PBS and then dissected in PBS. Afterward, brains were then treated as described in Vanin et al. (2012) and Yoshii et al. (2009) for natural or laboratory experiments, respectively. The primary antibodies used were mouse anti-PDF (Developmental Studies Hybridoma Bank), rabbit anti-PER (provided by Ralf Stanewsky, Stanewsky et al., 1997) and rat anti-TIM (provided by Francois Rouyer, Grima et al., 2002). Alexa Fluor 488 goat anti-mouse, Alexa Fluor 568 goat anti-mouse, Alexa Fluor 35 goat anti-mouse, Alexa Fluor 568 goat anti-rat, and Alexa Fluor 488 goat anti-rabbit (Invitrogen) were used as secondary antibodies.
Microscopy and Data Analysis
Fluorescence signals on whole-mount brains were visualized with either a semiconfocal microscope (natural conditions; Nikon Eclipse 80i equipped with a QiCAM fast camera using Image ProPlus software) or a confocal microscope (laboratory conditions; Leica DM5500 Q running Leica LAS AF software). Individual images were taken of planes at different depths in order to create a Z-series for each brain. Staining intensity was quantified using ImageJ 1.43 (http://rsbweb.nih.gov/ij/). A specific method was chosen according to the aim of the quantification and the microscope used:
(S – B). S = Staining intensity of a single cell. B = Staining intensity of the area adjacent to the cell. This formula was used to quantify the signal (nucleus + cytoplasm) of all images acquired from natural condition experiments. Values obtained were then normalized using the highest value as 100%.
(Sn – B). Sn = Staining intensity of a 9-pixel area in the middle of the neuron where the nucleus was located. This formula was used to quantify the nuclear staining under natural condition experiments carried out in summer and autumn as well as for all laboratory experiments.
Statistical Analysis
All data were analyzed and plotted using Microsoft Excel 2007, whereas the statistical analyses were performed using Statistica 8 (StatSoft). Staining intensities were tested for determining the influence of neuron/time/condition with ANOVA.
Results
Seasonal Changes in PER and TIM Oscillations
Table 1 shows the environmental parameters recorded throughout the experiments by means of the TriKinetics environmental monitor, which registers light sensitivity only at 1 lux and above. In addition to the natural LD intervals and temperatures measured, Table 1 also reports information on civil and nautical twilights. In May/June, photoperiod was long (civil light-dark, LD ~16:8) and daily temperatures were mild (Tmax ~25 °C, Tmin ~15 °C). In August, photoperiod was still long (civil LD, ~15:9), but temperatures were 10 °C higher than in May/June (Tmax ~35 °C, Tmin ~25 °C). In September, photoperiods were close to equinox (civil LD ~13:11) and temperatures were similar to those in May/June. During November photoperiod was short (LD ~11:13) with temperature rarely above 10 °C during the day and always well below 10 °C during the night.
Clock protein cycling (measured as nuclear plus cytoplasmic staining) and locomotor activity rhythms differed dramatically among the seasons as well as compared with the results from standard laboratory conditions (LD 12:12) described in countless studies (Fig. 1). In November, we could detect neither PER nor TIM in the clock neurons, and the flies were almost completely inactive (data not shown). In September, the pattern of clock protein cycling somewhat resembled that reported for 12:12 LD cycles in the laboratory, but we did not see PER accumulation in the nucleus earlier than TIM (see Fig. 2). Furthermore, we found phase differences among the lateral neurons (LNs), dorsal neurons (DNs), and lateral posterior neurons (LPNs). TIM peaked significantly earlier in the LPNs, and particularly in the DNs, than in the LNs, and this phase advance was evident also in May/June but not in August (Fig. 1F, DNs plus LPNs versus LNs, Fig. 1, D and E, May/June: F6,271 = 4.09, p = 0.0006; August: not significant F6,276 = 0.93, p = 0.46; September: F6,323 = 13.00, p < 10−3) and remained significant when the data were pooled across all 3 seasons (Fig. 3). The same applied to PER (Fig. 1, A-C, Fig. 3) (May/June: F4,249 = 2.59, p = 0.037; August: F5,239 = 4.12, p = 0.001; September: F5,137 = 10.13, p < 10−3), with these phase advances in the dorsal group possibly reflecting an underlying short period oscillation in these neurons (Vanin et al., 2012). PER staining was not visible within the LPNs, except for one time point in August (i.e., midday). In addition to the advanced phase of the DNs and LPNs that was present under all seasons, the peak phases of PER in May/June and August differed considerably from those in September for most neurons, whereas the phasing of TIM stayed relatively constant with the TIM peak always lying close to nautical dawn (Fig. 1, D-F). PER cycling was strongly delayed in May/June and August with respect to dawn (Fig. 4, A-C), and as a consequence TIM and PER seemed not to reach their peak levels simultaneously. To compare better the phases of PER and TIM under the 3 seasons, we averaged the peak times for all neurons (in hours after nautical twilight) and plotted them for May/June, August, and September (Fig. 4A). This shows that the phasing of PER, later in May/June and August compared with September, strongly depended on the season, whereas that of TIM, although significant, was less dramatically seasonally modulated (Fig. 4A; PER: F2,638 = 108.67, p < 10−3; TIM: F2,810 = 13.20, p < 10−3).
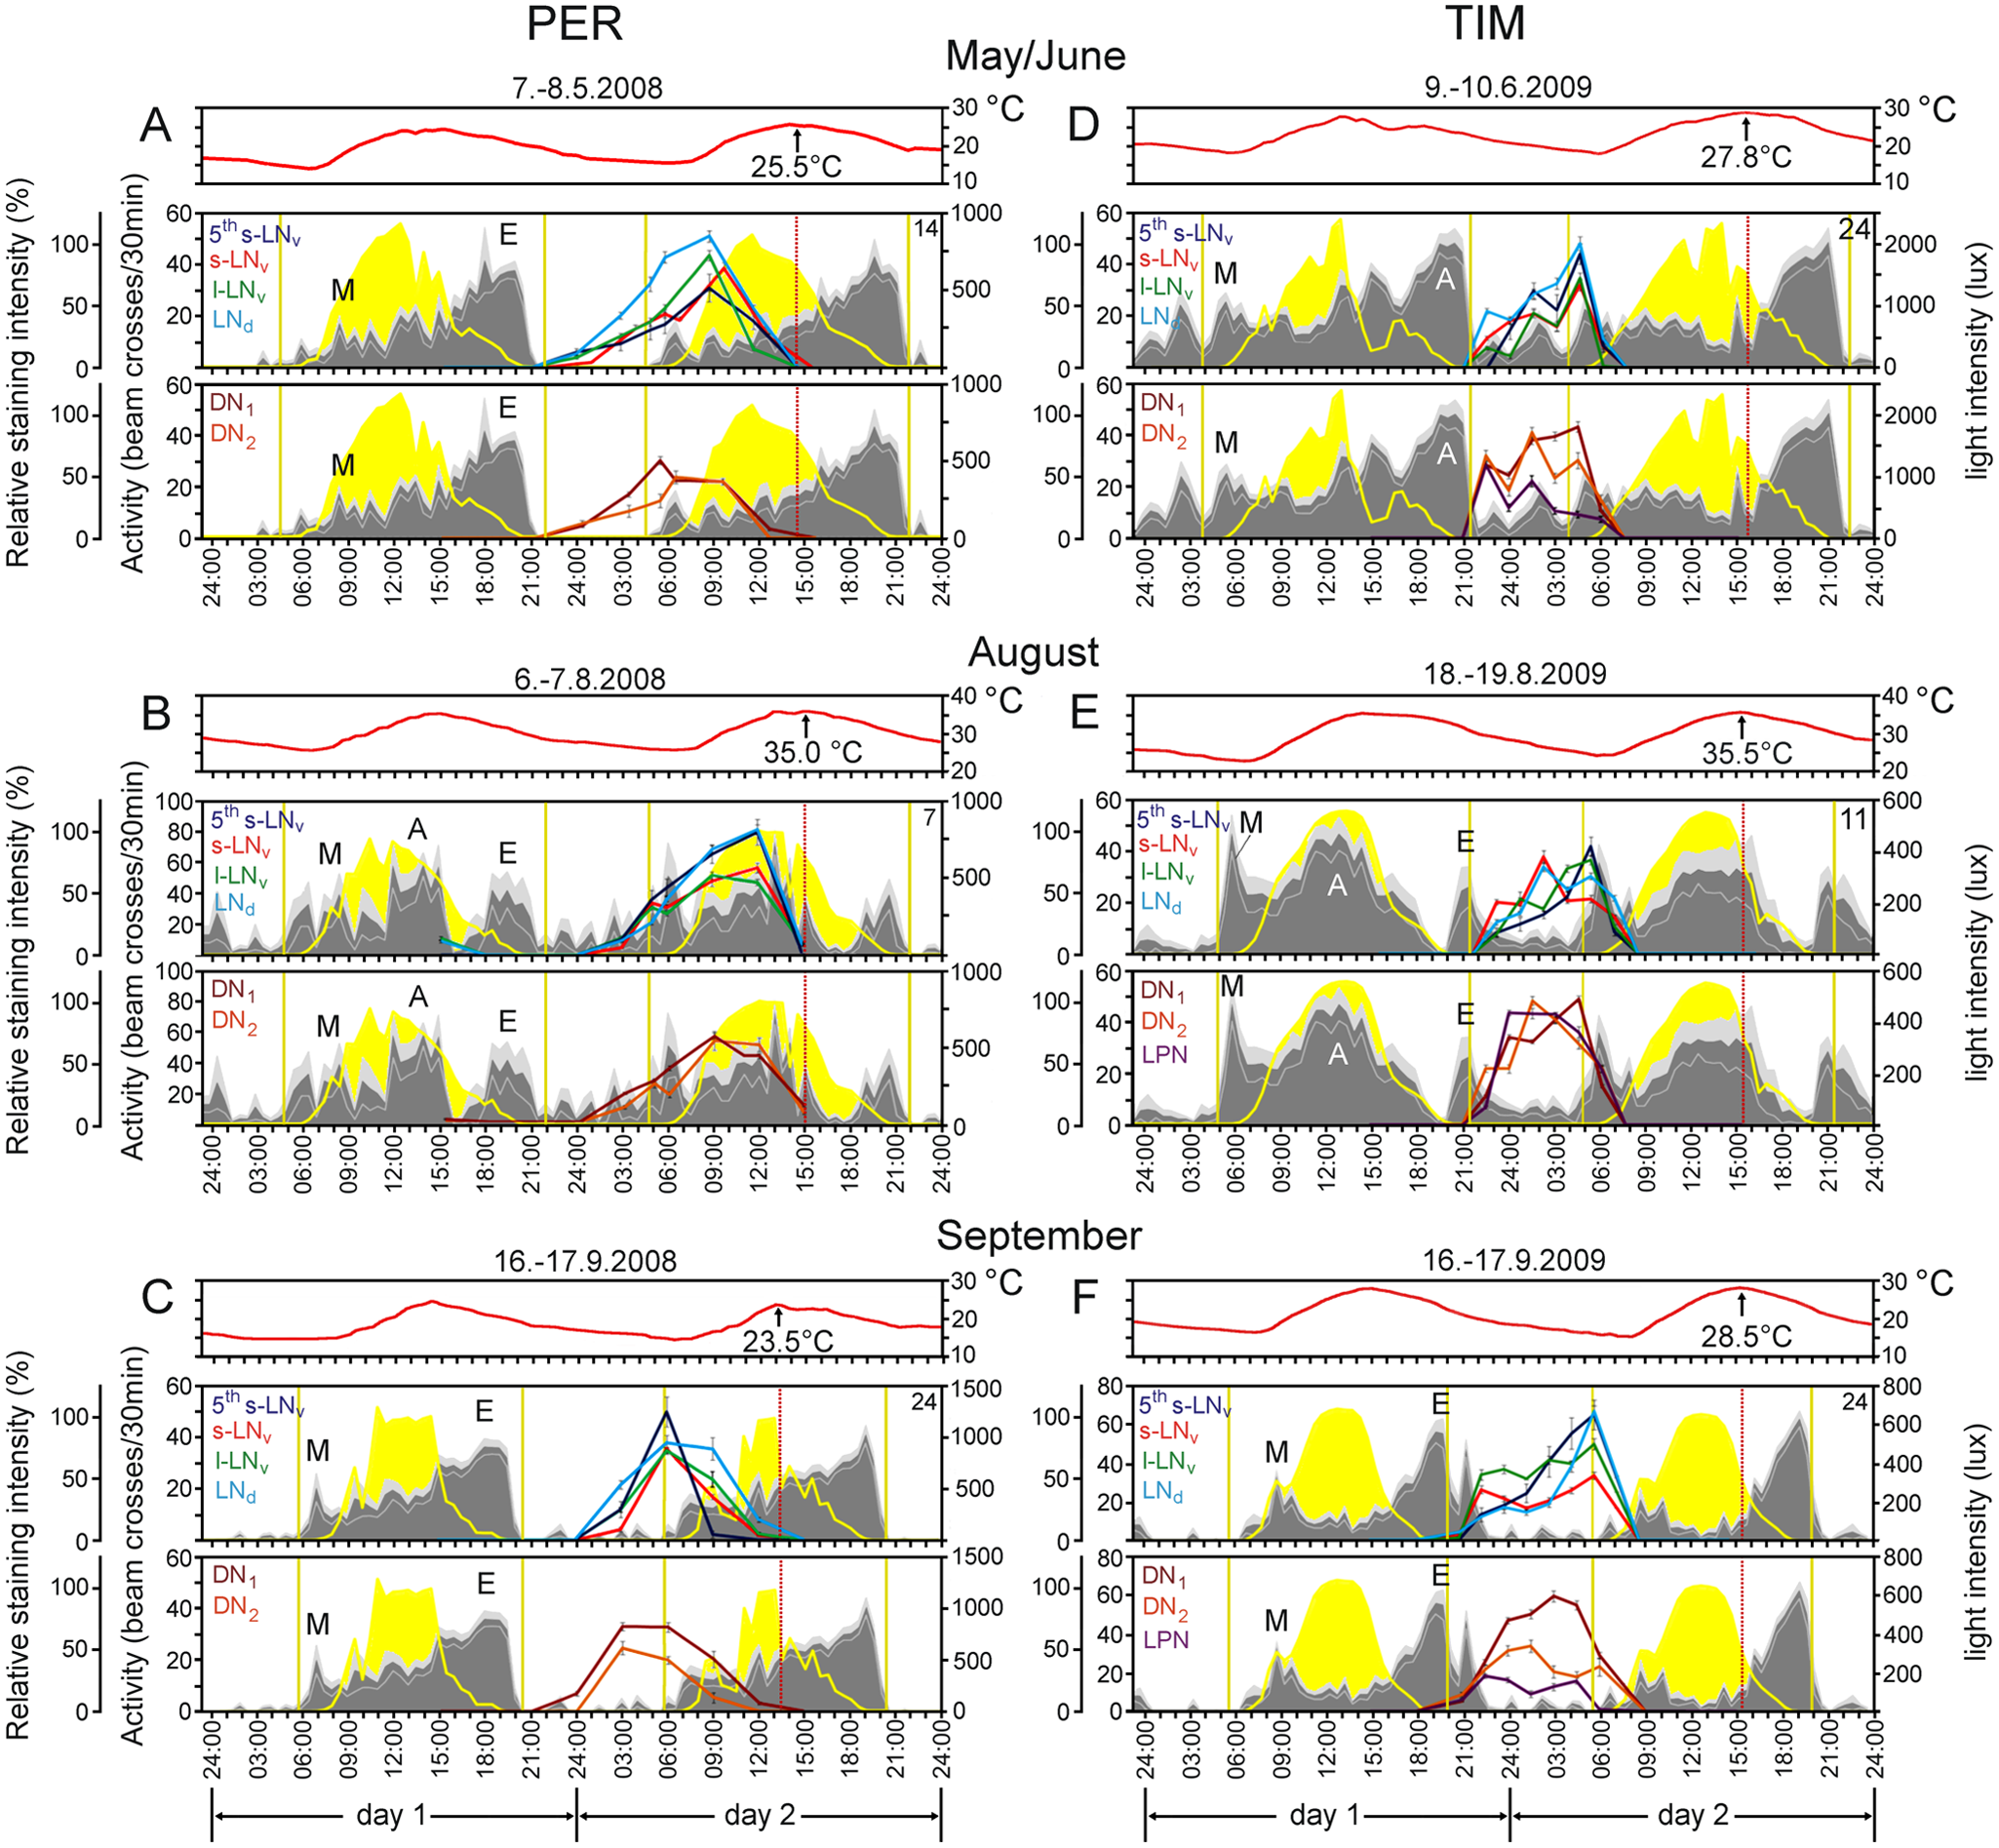
PER and TIM oscillations and locomotor activity profiles monitored during 2 consecutive days under outdoor conditions in spring, summer, and autumn. Clock protein expression was estimated as total staining (nucleus plus cytoplasm) in the canonical clock neurons and depicted as colored curves in between Day 1 and Day 2. For reasons of clarity, clock protein cycling is shown for the lateral neurons (5th s-LNv, s-LNv, l-LNv, LNd) and the dorsal and lateral posterior neurons (DN1, DN2, LPN) in separate diagrams. PER expression (A-C) was monitored in 2008 and TIM (D-F) in 2009. Activity is shown as gray area (±SEM in light gray). The number of recorded flies is indicated in the top right corner of each diagram. Note that the activity consists of 3 activity bouts in August (M = morning, A = afternoon, E = evening component). During spring and autumn, only M and E components are visible. Temperature is represented as red curve on top of the diagrams, whereby the temperature maximum is given as number and indicated by a red dotted line on the second day in each diagram, respectively. Light intensity measured by the environmental monitors is shown in yellow. The environmental monitors can detect light intensities higher than ~1 lux, and this coincides more or less with the times of civil dawn and dusk used for calculation of (civil) day length. In addition, the vertical yellow lines indicate nautical dawn and dusk that were chosen as reference points for the calculation of PER/TIM protein and activity phases as in Vanin et al. (2012) (see Figs. 2 and 3). In May/June civil day length was ~15-16 h, in August it was ~9 h, and in September it was ~13 h (see Table 1). All PER and TIM fluctuations are statistically significant (ANOVA, p < 0.05).
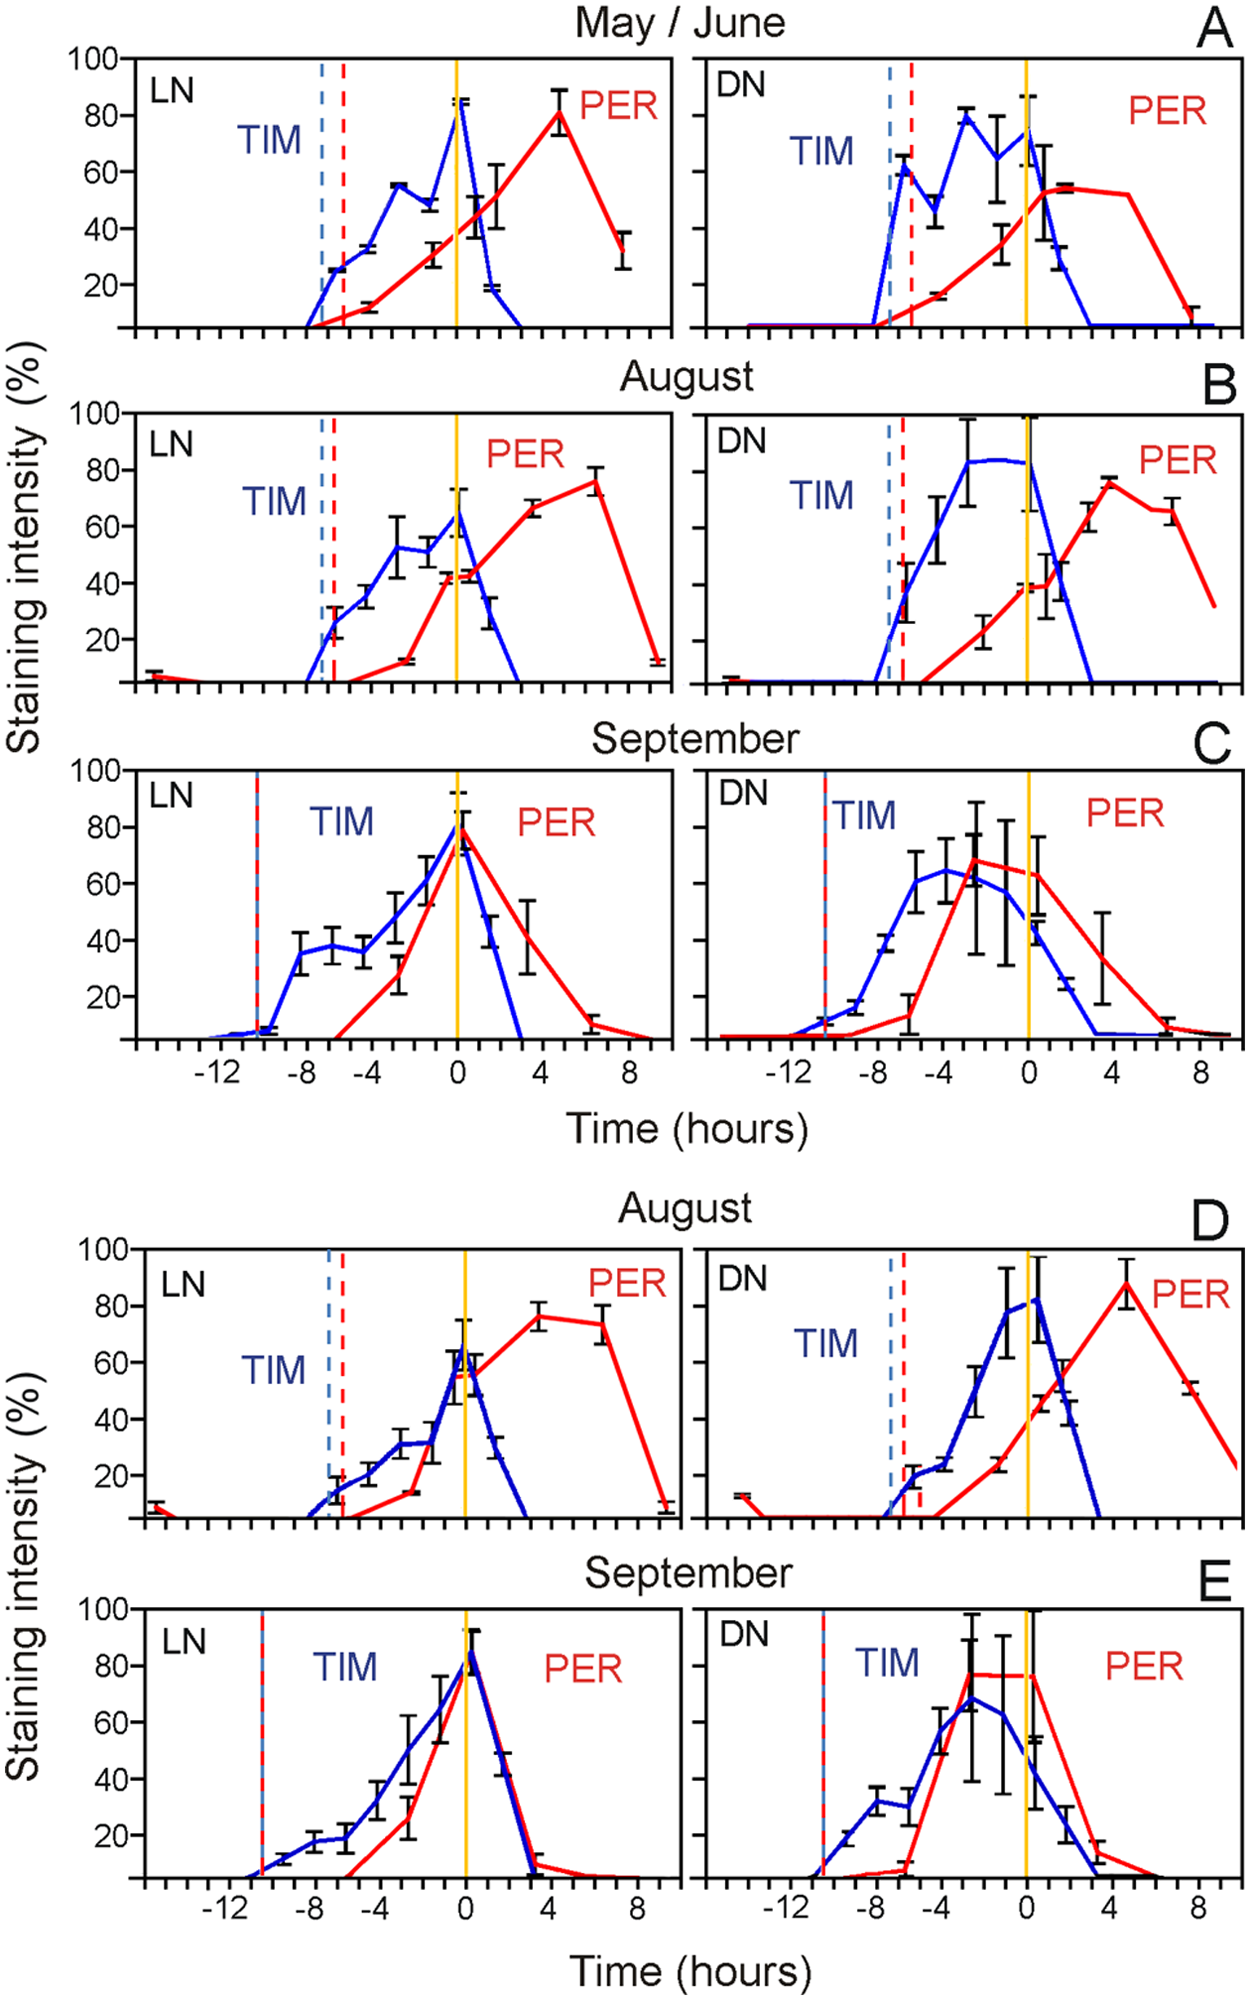
Total and nuclear staining in LNs (s-LNv, 5th s-LNv, l-LNv, and LNd) and DNs (DN1 and DN2). (A-C) PER and TIM total (nuclear plus cytoplasmic) staining in LN and DN clock neurons under different natural seasonal conditions. (D, E) Nuclear staining profiles in LN and DN clock neurons in August and September. Vertical dotted lines refer to nautical dusk (red: PER experiments; blue: TIM experiments), respectively. The yellow vertical line refers to nautical dawn (0). X-axis represents the time (hours) before (negative values) and after (positive values) nautical dawn.
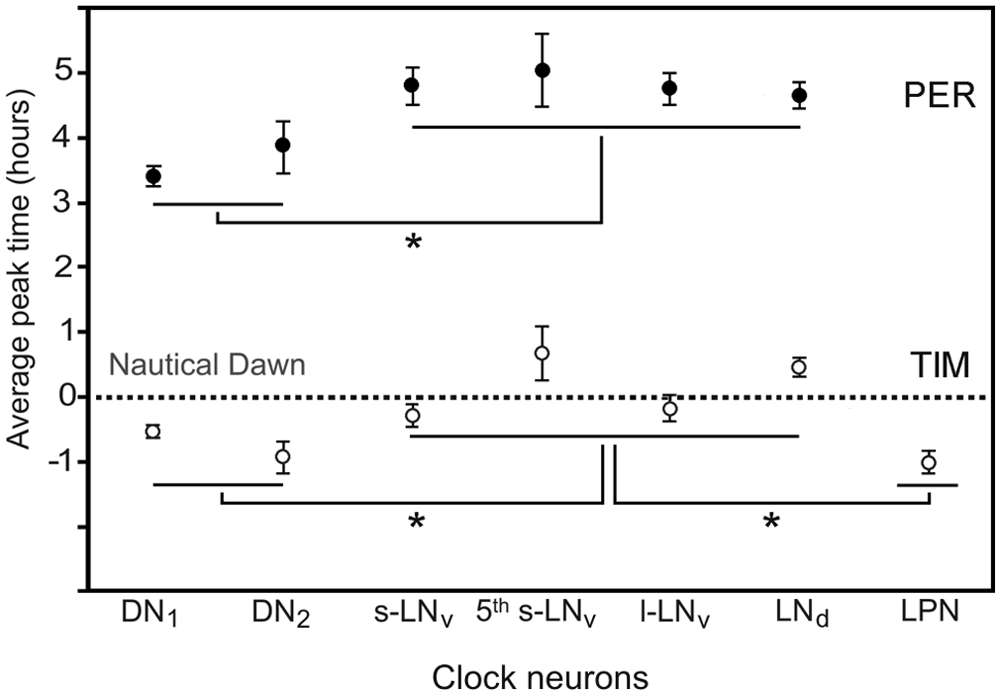
Averaged peak time of PER and TIM (±SEM) in the different clock neurons pooled across seasons. The y-axis represents the time at which the mean peak antigenicity was recorded with reference to the nautical dawn (0). ANOVA showed that PER and TIM peak time depended on the group of clock neurons (PER: F5,638 = 8.63, p < 10−3; TIM: F6,890 = 7.41, p < 10−3), and post hoc analysis revealed that the dorsal neurons (DN1 and DN2) and for TIM also the lateral posterior neurons (LPN) peaked significantly earlier than the lateral neurons (s-LNv, 5th s-LNv, l-LNv) (asterisks).
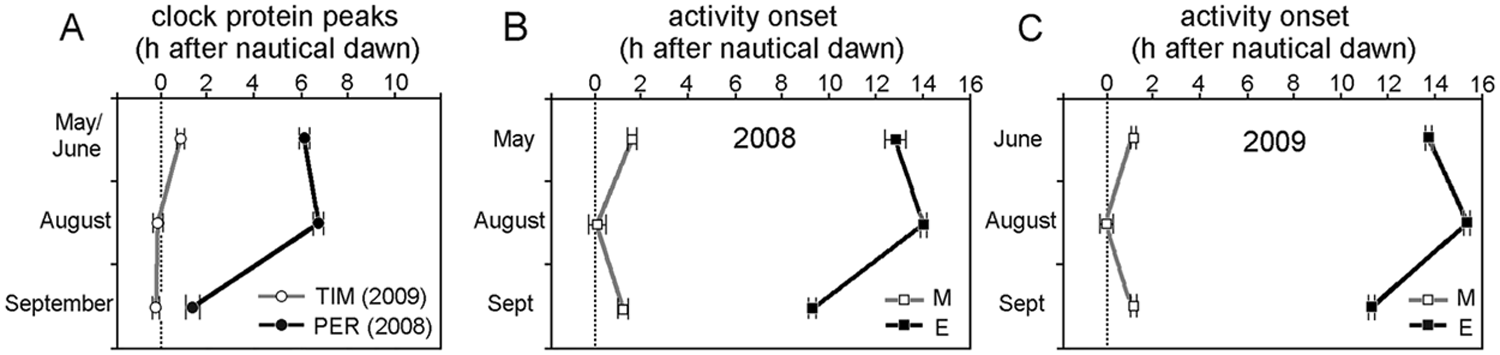
Peak phases of PER and TIM (A) and phases activity onset of M and E activity bouts (B, C) in different seasons referred to nautical dawn (0). TIM peak phases should only be compared with the phases of M and E onset in 2009 (C), whereas those of PER should to be compared with M and E onset in 2008 (B). The timing of E onset roughly parallels the timing of the PER peak.
The average activity patterns of the flies monitored for 2 days in parallel to the staining are depicted in gray in Figure 1, A-F. Under all 3 seasons flies showed morning (M) and evening (E) activity bouts. The prominent A (afternoon) component first described by Vanin et al. (2012) was observed most clearly in August only. As discussed by Vanin et al. (2012) and Menegazzi et al. (2012), it might be a clock-modulated escape response provoked by high temperatures during midday.
For M and E activity we determined the onsets for each individual fly and show the averages in Figure 4, B and C. M and E activity onsets both depended strongly on the season (M: F2,43 = 6.66, p = 0.003; E: F2,43 = 72.98, p < 10−3). M onset was earlier in August and later in May/June and September, whereas E onset was later in August and earlier in May/June and even earlier in September. Thus, timing of E onset was similarly affected by the season as the PER peak (compare Fig. 4A with Fig. 4B). The PER peak seems more dependent on photoperiod than on temperature: September and May 2008 differed mainly in photoperiod, and the PER peak occurred 4.5 h earlier in September than in May (relating to nautical dawn); in contrast, May and August 2008 differed by almost 10 °C in temperature but only by 1 h in photoperiod, and the PER peak occurred 1 h earlier in May than in August. E activity onset was also strongly dependent on photoperiod, but temperature seemed to play an additional important role. In 2009, which was warmer than 2008, the E onset occurred always later than in 2008 (Fig. 4, B and C). This was even true in summer 2009, when day length was 0.7 h shorter than in summer 2008 (Table 1; compare Fig. 4C with Fig. 4B). Thus, temperature might be more important for the timing of E activity than is photoperiod. From our outdoor data, we cannot judge whether the higher temperatures in 2009 affected the PER peak similarly as the E peak, because we determined PER only in 2008. However, our laboratory experiments suggest that this is not the case (see below).
To more directly compare the timing of PER and TIM, we plotted both oscillations in one graph per season (separately for the LNs and the DNs) (Fig. 2). We are aware that this is not absolutely comparable, since PER and TIM oscillations are derived from 2 different years, but the obvious phase lag between PER and TIM occurring under summer conditions is too large to be explained by minor environmental changes between years (Fig. 1, B and E; Fig. 4A). In May/June, PER lagged TIM for ~5 h (Fig. 2A) and in August for ~8 h (Fig. 2B) in the LNs and somewhat less in the DNs. PER’s decoupling from TIM appeared to be provoked by the long photoperiod and amplified by higher temperatures because the conditions in May/June, when PER lagged TIM by ~5 h, differed from those in September (when both were almost in phase) predominantly in photoperiod. May/June and August differed in temperature but not in photoperiod, and this led to a further phase lag of ~3 h. Similar results were observed for the nuclear fractions of PER and TIM (Fig. 2, D and E, DNs plus LPNs vs LNs, PER: F1,367 = 233.21, p < 10−3; TIM: F1,746 = 0.13, p = 0.72, see Suppl. Figs. S1 and S2 for a detailed description of nuclear staining in the different neuronal groups), suggesting that PER can enter the nucleus after TIM has disappeared.
Laboratory Simulations of Nature
To clarify to what extent long photoperiods and high temperatures contribute to the asynchrony between TIM and PER in spring and summer, we monitored clock protein oscillations in the DNs, LPNs, and LNs and rhythmic activity patterns in the laboratory under LD16:8 with simulated twilight at low (20 °C) and high (30 °C) constant temperatures as well as under temperature cycles (Fig. 5). In all laboratory experiments we immunostained for PER and TIM simultaneously and we quantified only nuclear staining, because this is the only way to reveal whether PER levels in the nucleus are still increasing after TIM has disappeared, as suggested under outdoor summer conditions. For clarity and because phase differences among the different LN (and DN/LPN) groups were small, we show only average curves, in which all LNs and all DNs (plus LPNs) are pooled, respectively. (See Suppl. Figs. S3 and S4 for a detailed description of nuclear staining for each group of neurons.)
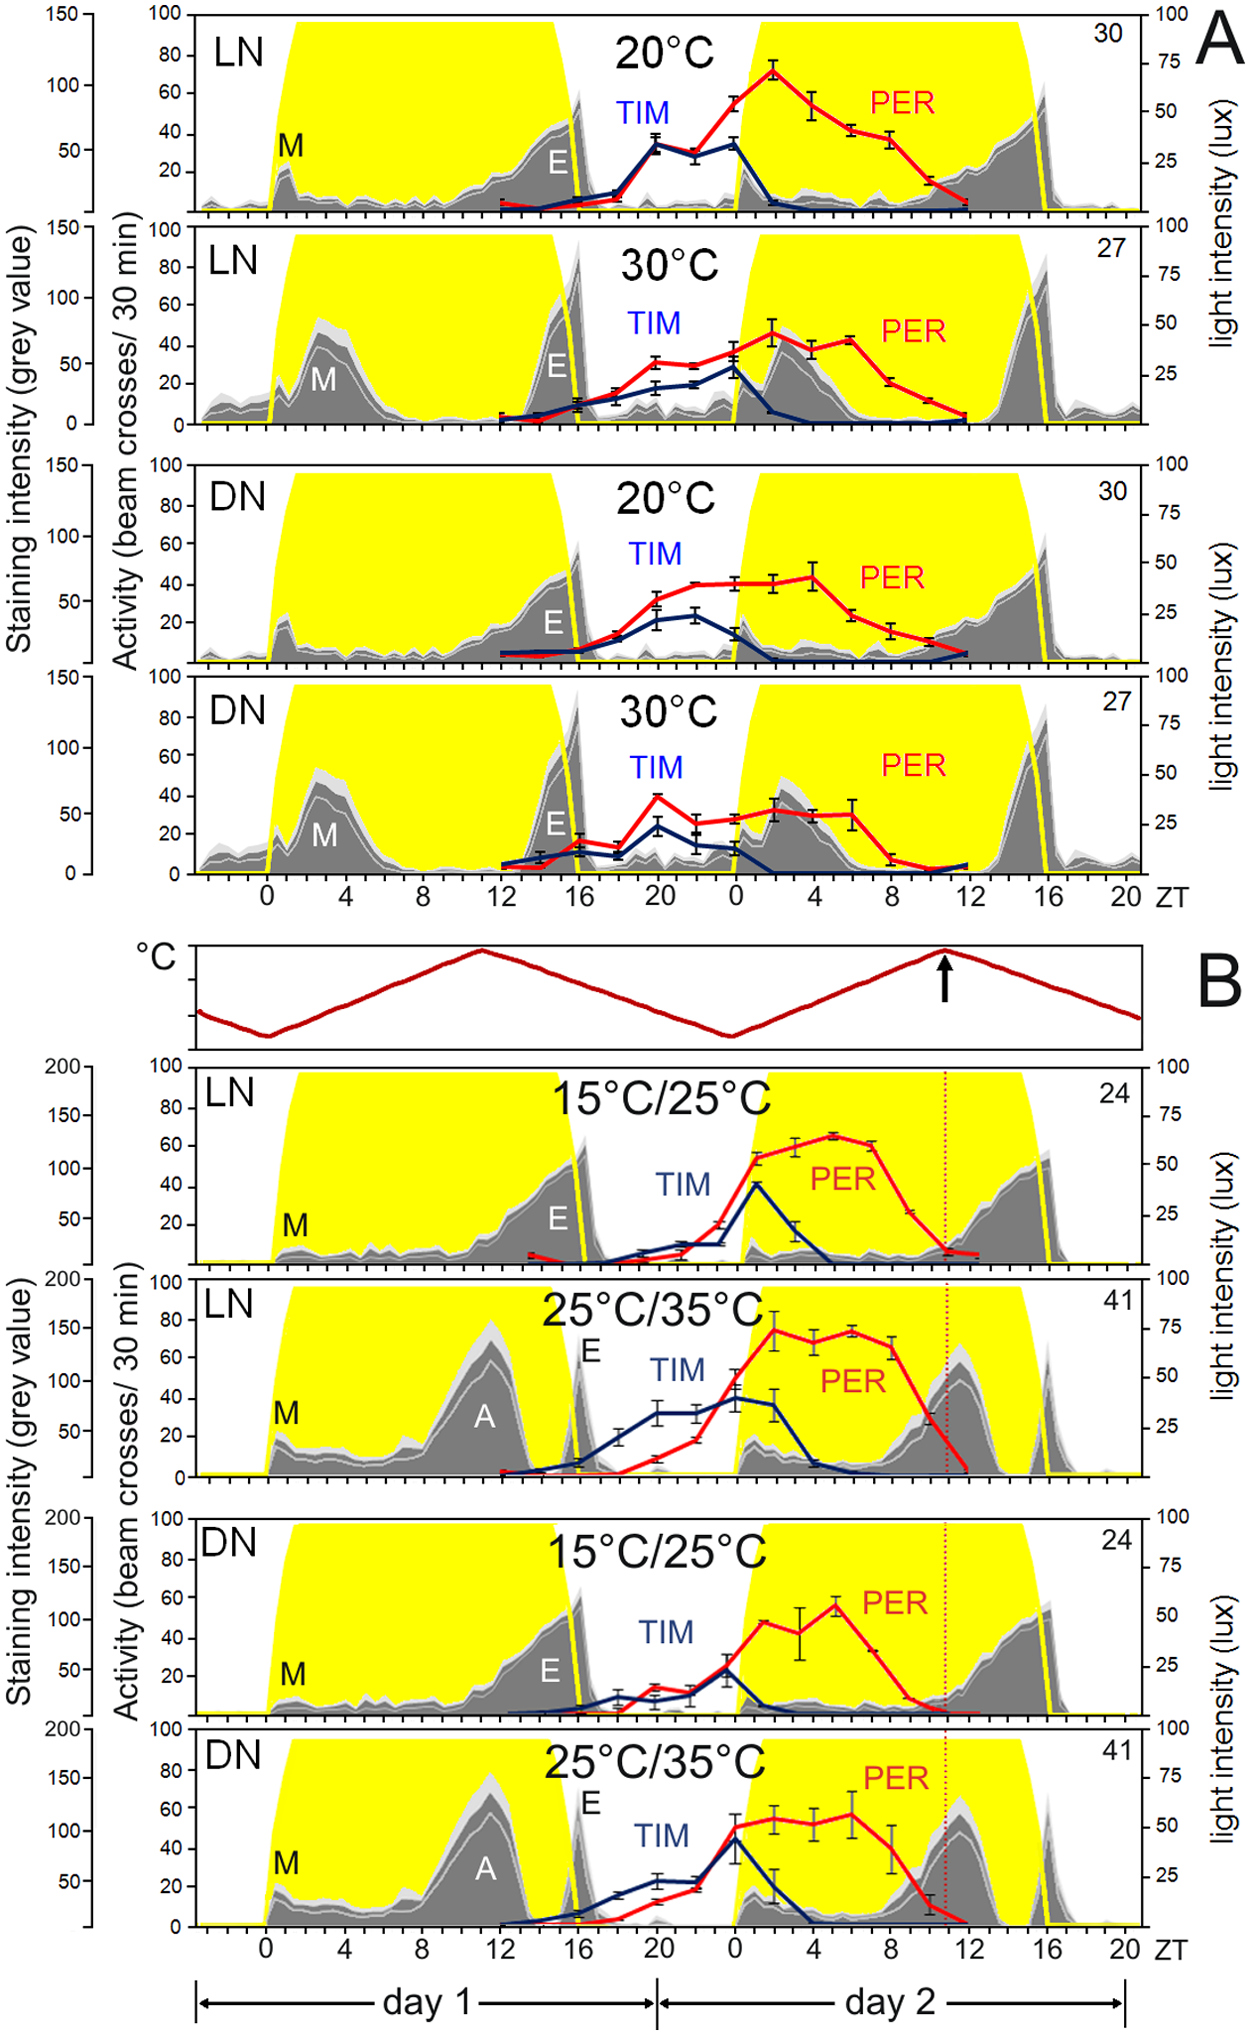
PER/TIM expression and activity profiles in laboratory simulations of natural conditions. PER (red) and TIM (blue) oscillation profiles within the dorsal and lateral neurons of brains dissected from flies entrained under laboratory simulated long photoperiod (LD 16:8 with simulated twilight) under (A) constant temperature regimes (20 and 30 °C) or (B) thermocycles (15 °C/25 °C or 25 °C/35 °C; Tmin = 15 °C at ZT0, Tmax = 25 °C at ZT11 and Tmin = 25 °C at ZT0, Tmax = 35 °C at ZT11). Vertical red dotted lines in B indicate the time when temperature is at its maximum. Staining intensity is given in gray values (min = 0, max = 255). Fluctuations are all statistically significant (ANOVA, p < 0.05).
Under long photoperiods with constant temperature, we found that TIM and PER became similarly out of phase with each other as in the wild (Fig. 5A, 20 °C: F1,1621 = 180.58, p < 10−3; 30 °C: F1,1661 = 386.10, p < 10−3). Nevertheless, in contrast to nature, the rates (and timing) of TIM and PER increases were similar and both peaks were considerably broader under laboratory conditions. In addition, the phase advance of the DNs compared with that of the LNs was not reproduced although higher levels are reached earlier in DNs and LPNs compared with LNs (Suppl. Fig. S3, PER 20 °C: F5,1045 = 7.84; TIM 20 °C: F5,576 = 7.16; PER 30 °C: F6,1008 = 14.89, p = 0.000; TIM: 30 °C: F6,653 = 8.37, all p < 10−3). Moreover, TIM and, in particular, PER expression is lower at higher temperatures (Fig. 5A), and this difference is due to a reduction of PER and TIM levels in specific clock neurons (in particular the LNd and DN1) (Suppl. Fig. S3S; PER s-LNv: F1,2078 = 2.32, p = 0.13; PER 5th s-LNv: F1,498 = 8.97, p = 0.003; PER l-LNv: F1,2278 = 2.88, p = 0.90; PER LNd: F1,3118 = 44.75, p < 10−3; PER DN1: F1,7798 = 15.90, p < 10−3; PER DN2: F1,1038 = 6.97, p = 0.008; TIM s-LNv: F1,2158 = 1.01, p = 0.30; TIM 5th s-LNv: F1,358 = 3.11, p = 0.08; TIM l-LNv: F1,1438 = 0.36, p = 0.55; TIM LNd: F1,2159 = 22.65, p < 10−3; TIM DN1: F1,5398 = 13.15, p < 10−3; TIM DN2: F1,718 = 0.76, p = 0.38).
To mimic more closely the natural situation, we measured PER/TIM rhythms also under 15 °C/25 °C and 25 °C/35 °C sawtooth temperature cycles. We found that the PER peak was indeed narrower under both temperature cycles than it was under constant temperature (Fig. 2B). (See Suppl. Fig. S4 for a detailed description of nuclear staining for each group of neurons.) Furthermore, TIM started to increase earlier than PER under the warmer temperature cycle as it did in the natural summer (Fig. 5B: F1,1.437 = 366.12, p < 10−3), and we observed a small but significant phase advance in the DNs in comparison to the LNs (PER: F5,1487 = 16.09, p < 10−3; TIM: F5,1979 = 11.93, p < 10−3). Nevertheless, the most compelling differences between constant and cycling temperatures were that (1) PER and TIM peaks were delayed under temperature cycles as compared to constant temperature and (2) PER and especially TIM levels increased at higher temperatures under temperature cycles (F1,11388 = 267.08, p < 10−3) whereas both decreased with increasing temperature under constant temperature regimes.
Although nuclear PER and TIM became clearly out of phase under all tested laboratory conditions, PER did not significantly increase after TIM has disappeared, in any of the cases. Thus, there seems no need for a PER nuclear transport mechanism that is independent of TIM.
Discussion
Despite some attempts at mimicking the natural environment in the laboratory during the past years, almost nothing is known about the functioning of the Drosophila master clock under real, natural conditions. In this study, which complements the natural behavioral observations made by Vanin et al. (2012), we aim to reveal PER and TIM molecular cycling within the clock neurons of flies entrained in a natural setting outside. Moreover, we attempt to reproduce the natural findings in the laboratory in order to identify the environmental cues that are responsible for driving different aspects of clock proteins accumulation in nature.
Although PER and TIM oscillation profiles of the outdoor experiments stem from 2 different years (2008 and 2009, respectively), we believe that the 2 data sets can still be compared. In fact, albeit not characterized exactly by the same environmental conditions, the experiments in 2009 were performed under conditions very similar to those done in 2008. In addition, the most relevant results can be reproduced in the laboratory, where we are able to immunostain for PER and TIM simultaneously. We find that some particular aspects of PER and TIM oscillation profiles, such as their reciprocal phase, are strongly affected by the external environment.
Only in September when the photoperiod is close to LD12:12 we do obtain a phase locking of PER and TIM cycles, as described numerous times in laboratory studies. In May/June and especially August, a large phase difference is observed between the 2 protein cycles that appears to be predominantly stimulated by the long photoperiods. Original reports of PER and TIM nuclear translocation suggested that they were also synchronous as expected from 2 molecules that can dimerize (Vosshall et al., 1994; Saez and Young, 1996), but more recent work has suggested that nuclear entry of PER and TIM has more complex regulation (Shafer et al., 2002; Chang and Reppert, 2003; Nawathean and Rosbash, 2004; Shafer et al., 2004; Cyran et al., 2005; Meyer et al., 2006; Landskron et. al, 2009; Hara et al., 2011). Shafer et al. (2002) and Meyer et al. (2006) showed that PER can phase lead TIM in nuclear translocation. In the present study we do not find such a phase lead of PER, neither under natural nor under simulated natural conditions in the laboratory. PER seems rather to phase lag TIM (see also below). A putative reason for this discrepancy might lie in the natural-like conditions we used (simulated twilight instead of rectangular LD cycles and temperature cycles instead of constant temperature as compared with Shafer et al., 2002). Simulated twilight seems to act as stronger zeitgeber for fruit flies than the classical lights-on and lights-off: It not only sharpens M and E activity peaks but also facilitates re-entrainment; and especially in combination with temperature cycles it leads to sharper and higher TIM peaks (Rieger et al., 2007, 2012; Yoshii et al., 2009). Certainly our results show that as TIM levels decrease in the nucleus, PER levels are still rising, particularly in August. Under long photoperiods (May/June and August), it was also noticeable that PER levels rose at about the same time, even though there was a 10 °C difference between the 2 seasons. Edery and colleagues (Majercak et al., 1999, 2004) have shown thattemperature plays a prominent role in modulating the splicing of the period 3′-terminal intron (dmpi8).
The proportion of dmpi8 spliced per mRNA increases at lower temperatures. This leads to an earlier accumulation of total per transcript and PER protein and to an advance in the evening locomotor activity onset (E) (Majercak et al., 1999). dmpi8 has no coding sequence implications and may facilitate 3′-end formation (Majercak et al., 1999). Moreover, it has been reported that photoperiod also modulates splicing levels, with long summer-like days inhibiting the process (Collins et al., 2004; Majercak et al., 2004). These findings suggest that the thermo- and photoperiod-sensitive dmpi8 splicing could be part of a molecular mechanism underlying adaptation to seasonality in Drosophila melanogaster per splicing levels are linear over a natural temperature range (Vanin et al., 2012) so we would expect, and indeed observe, a corresponding advance in the peak of PER as temperature is reduced from summer to spring, and a concomitant advance in the E locomotor component. In autumn, at similar temperatures to spring, we see an even more dramatic PER advance accompanied by a corresponding advance in E onset, revealing an important contribution of shortening photoperiods to PER phasing and timing of E activity. Our findings are in agreement with previous results indicating that shortening the photoperiod enhances per splicing, which in turn promotes the advance of PER accumulation (Majercak et al., 2004; Collins et al., 2004). Thus, photoperiod may be an important factor that determines TIM and PER synchronization. We used laboratory simulations of spring/summer conditions to better dissect the influence of long photoperiods and different temperature ranges on synchronizing PER and TIM oscillation in the clock neurons. We managed to reproduce in the laboratory the main natural findings: The phase shift between PER and TIM nuclear persistence is present under all temperature conditions, indicating that day length is the most important cue to set the phase of clock protein oscillations.
A similar observation, nuclear PER persisting after TIM has been degraded, was made previously for a subgroup of clock of neurons (s- and l-LNv) under long photoperiods and constant temperatures in the laboratory (Shafer et al., 2004). Shafer and co-workers found that at lights-on, after only 8 h of darkness, TIM nuclear levels rapidly decrease whereas PER nuclear levels continue to increase to reach the maximum 2 h after lights-on and stay high for about 6 more h. Interestingly, although PER nuclear persistence appears to adjust to the long day, TIM seems unable to do so. We found the same under outdoor conditions: The timing of TIM was barely influenced by the season and this was true for all clock neurons, not only for the LNvs. Under natural conditions, not only does nuclear PER persist longer than nuclear TIM, but nuclear PER levels seem also to rise later than do TIM levels (Fig. 2), and in contrast to nuclear persistence this was rather independent of the season. We could simulate this phase-lag in PER nuclear accumulation in the laboratory, but only when twilight-simulations were combined with temperature cycles (Fig. 5B), suggesting that temperature cycles delay PER nuclear entry.
The phase advance of the DNs (plus LPNs) compared with the LNs observed in nature was only present in the laboratory when temperature cycles were simulated, suggesting that the latter provoke the phase difference between the 2 groups of neurons. This phase advance may be due to faster cycling of the DNs, as has been suggested by Vanin et al. (2012), and a similar phase lead was previously revealed for TIM in the DN2 in the laboratory under simulated sawtooth temperature cycles (Yoshii et al., 2009).
The behavioral results presented here, although representing a snapshot of Vanin et al.’s extensive study, reveal large seasonal differences in behavior, such as an M peak that becomes more prominent in summer and an E peak that appears more pronounced in spring and autumn. This seasonal redistribution of locomotor activity to different parts of the day might reflect a reorganization of the roles of the M and E oscillators. Another surprising feature of these results is that the temperature level (20 °C or 30 °C) has almost no influence on the timing of PER/TIM cycling, in spite of its important influence on protein levels (Sidote et al., 1998; Yoshii et al., 2007). This finding suggests that the molecular clock is rather insensitive to constant temperatures within this range, possibly reflecting the clock’s cardinal property of temperature compensation. Nevertheless, temperature affects the rate of TIM accumulation. At constant 30 °C, TIM accumulates more slowly and to lower levels than at constant 20 °C, and this also seems to result in lower PER levels. Interestingly, under temperature cycles, higher temperatures appear to have the opposite effect: The higher the temperature (25-35 °C T cycles compared with 15-25 °C), the higher the protein levels. This indicates that temperature compensation and temperature entrainment work via different mechanisms. Reduced PER/TIM levels are known to correlate with period lengthening under constant conditions (Smith and Konopka, 1982; Matsumoto et al., 1999), and this may compensate the temperature-provoked acceleration of the PER/TIM cycle (in addition to a different per-splicing). As a consequence, under LD conditions, the timing of PER/TIM cycling should not be altered by different constant temperatures, exactly as we observe here (Fig. 5A). This is very different under temperature cycles (Fig. 5B). Here, the high average temperature is accompanied by a delay in the decrease of PER/TIM, a prominent A peak, and a tiny and delayed E peak. All this might be regarded as an adaptation to avoid the deleterious high midday/afternoon temperatures: The A peak may help the flies to escape from the heat (if not imprisoned in the glass tubes), and the late E peak enables activity at tolerable temperatures.
Unfortunately, we cannot speculate about changes in protein amount among different natural conditions. Nevertheless, when we looked at brains of flies entrained under very cold temperatures outside (temperature maximum ~12 °C, November 2008 and 2009), we could not find any PER or TIM staining, meaning that even outside, the temperature is affecting the level of protein expression: Probably, at cold temperatures, both TIM and PER amounts were too low to be detected. Worth noticing is that under these cold day cycles the flies barely moved, most likely reflecting their state of diapause that is induced by colder temperatures and shorter photoperiods (Tauber et al., 2007). The photoperiodic and thermal stimuli that generate diapause are not well understood (Schiesari et al., 2011), although natural variants of TIM play a significant role (Tauber et al., 2007; Sandrelli et al., 2007). Internal coincidence models of diapause have been proposed that rely on the changing phases and levels of unspecified molecules in different photoperiods. We note that under short, diapausing photoperiods in the autumn, the phases of PER and TIM are quite similar in the clock neurons, whereas they are decoupled in summer. Their relative phases in the different seasons could conceivably provide an internal coincidence detector by which to engage the diapause seasonal program at colder temperatures (Tauber and Kyriacou 2001; Saunders and Bertossa, 2011).
Footnotes
Acknowledgements
This work was funded by grants from the European Community (the 6th Framework Project EUCLOCK no. 018741 to R.C., C.H.F., and C.P.K. R.C. also thanks the Italian Space Agency (DCMC grant) and the Ministero dell’Università e della Ricerca (MIUR).
Conflict of Interest Statement
The author(s) declared no potential conflicts of interest with respect to the research, authorship, and/or publication of this article.
Notes
References
Supplementary Material
Please find the following supplemental material available below.
For Open Access articles published under a Creative Commons License, all supplemental material carries the same license as the article it is associated with.
For non-Open Access articles published, all supplemental material carries a non-exclusive license, and permission requests for re-use of supplemental material or any part of supplemental material shall be sent directly to the copyright owner as specified in the copyright notice associated with the article.