
Abstract
Stability of sleep and circadian rhythms are important for healthy learning and memory. While experimental manipulations of lifestyle and learning outcomes present major obstacles, the ongoing increase in data sources allows retrospective data mining of people’s sleep timing variation. Here I use digital sleep-log data generated by 1109 students in a biology lab course at the University of Washington to test the hypothesis that higher variance in time asleep and later sleep-onset times negatively correlate with class performance, used here as a real-world proxy for learning and memory. I find that sleep duration variance and mean sleep-onset times both significantly correlate with class performance. These correlations are powerful on weeknights but undetectable on Friday and Saturday nights (“free nights”). These correlations also show sex differences, with women showing stronger (both larger and more powerful) negative correlations than men. Finally, although these data come with no demographic information beyond sex, the constructed demographic groups of “larks” and “owls” within the sexes reveal a significant decrease in performance of owls relative to larks in male students, whereas the correlation of performance with sleep-onset time for all male students was only a near-significant trend. This provides a proof of concept that deeper demographic mining of digital logs in the future may identify subgroups for which certain sleep phenotypes have greater predictive value for performance outcomes. The data analyzed are consistent with known patterns, including sleep-timing delays from weeknights to free nights and sleep-timing delays in men relative to women. These findings support the hypothesis that modern schedule impositions on sleep and circadian timing have consequences for real-world learning and memory. This study also highlights the low-cost, large-scale benefits of personal, daily, digital records as an augmentation of sleep and circadian studies.
Learning is impaired by loss of stable circadian rhythms (Smarr et al., 2014) and by sleep disturbances (Arzi et al., 2012; Diekelmann et al., 2012; Gujar et al., 2010; Lim et al., 2007; Potkin and Bunney, 2012; Ratcliff and Van Dongen, 2009; Van Dongen et al., 2012; Watts et al., 2012). Learning is also modulated by the time of day relative to sleep-onset time, although the precise phase of learning optimization differs by sex and the specific type of learning (Kuriyama et al., 2011; Kvint et al., 2011; Watts et al., 2012). This time of day effect appears to be guided by an organism’s internal daily timing system, its circadian rhythms, which in humans are consistent within individuals, shaped by networks of “clock genes” that predispose individuals to consistently sleep earlier or later in the day (a person’s “chronotype”) (Duffy et al., 1999; Duffy et al., 2001; Juda et al., 2013; Nováková et al., 2013; Pagani et al., 2010). However, a person’s daily timing is also influenced by imposed social restrictions or expectations, and these may interfere with optimal circadian stability and sleep hygiene for some chronotypes more than others, thereby negatively affecting learning and memory in those chronotyped individuals.
For students in modern Western society, social impositions on sleep timing come in two major forms: schedule instability caused by different day-to-day expectations (e.g., irregular class or work schedules) and the weekday imposition that most individuals rise early on at least some days (i.e., school or work starts early in the day but ends many hours before sleep-onset). Given that circadian insult and sleep disruption both impair learning, I hypothesize that those individuals showing the greatest day-to-day variance in sleep time (duration of) and later sleep times (an indication that a person may be a late chronotype) should be most negatively affected by Western social scheduling expectations. If this is the case, then daily sleep-timing information may have predictive value for students at risk of disrupted learning ability from sleep and circadian instability and/or misalignment. The University of Washington ran a sleep-logging lab in an introductory physiology course for a full year from spring quarter 2012 through winter quarter 2013. To test the above hypotheses, this already extant data set was mined for correlations sleep-timing to class performance in the physiology course in which the lab was run.
Methods
Data Collection
Under the UC Berkeley institutional review board protocol 2013-02-4982, data were gathered in the form of already extant log entries generated by a class exercise and de-identified prior to analysis. Student sex was based on official university registration material.
Sleep logs were gathered from students logging into a website daily for 22 consecutive days per academic quarter, encompassing 3 full weeks plus one extra Friday (Friday through 3 Fridays hence). The website was generated and maintained at the Department of Biology at the University of Washington. Students were presented with pull-down menus of 15-min increments in clock-time and asked to respond to 2 questions:
What time, to the nearest quarter-hour, did you FALL ASLEEP last night (note: this may differ from when you went to bed)?
What time, to the nearest quarter-hour, did you WAKE UP this morning (do not include short bouts of wake—only the time you finally awoke) (note: this may differ from when you got out of bed)?
Each daily log could only be completed until midnight on the day for which wake was logged, with missed entries left blank. Data were collected as part of a class exercise for 3 weeks per academic quarter from spring 2012 through winter 2013. Nights recorded were automatically separated into “weeknights” (Sunday-Thursday) or “free nights” (Friday-Saturday) as part of the lab class exercise. In total, 1109 students’ records were gathered across the 4 academic quarters analyzed.
De-identification and Data Filtering
Upon obtaining these data, student IDs were replaced with randomly generated 4-digit pins; all record information was deleted except for the pin number, sex, final class grade, and sleep-log entries. These were filtered to remove entries that reported wake-onset after 1500 h or sleep-onset before 1200 h preceding the night logged (e.g., 0200 h 7/26/12 sleep-onset was acceptable for the night of 7/25/12 but not for the night of 7/26/12) and to remove any incomplete entries. This removed 6% of the nightly log entries. Only individuals with at least 3 weeknight logs and 3 free-night logs following filtering were included in the analysis. This left 507 female and 350 male records for analysis, each with 3 to 15 weeknight records and 3 to 7 free-night records. These data were used to create individual student mean sleep-onset, mean wake-onset, mean duration, and standard error of the mean (SEM) for these variables on both weeknights and free nights. Distributions of student performance (individuals’ grades from the class and quarter in which each individual generated his or her sleep logs) were roughly normal but with a slight skew to the right, indicating higher performance. Because grades may vary by sex and by quarter, all grades are normalized for sex and quarter by setting the range of performance for each sex per quarter from 0 to 1 (e.g., male student spring grades go from 0-1, female student spring grades go from 0-1, etc.) to eliminate effects of sex and quarter on performance (e.g., effects of each quarter being a different teacher and slightly different class material).
Statistics
Data collation was performed with Microsoft Excel 2013. Many variable distributions were not normal according to Kolmogorov-Smirnov tests, and so Wilcoxon rank sum tests were used in place of t tests to compare distributions. Kolmogorov-Smirnov tests for normality were run in MATLAB 2013 using the kstest function. Wilcoxon rank sum tests were run in MATLAB 2013 using the ranksum function, and correlations were run in MATLAB 2013 using the corrcoef function. Multiple regression analysis was performed in MATLAB 2014 using the fitlm function on data transformed from raw values into variable-specific z values. The p values for Wilcoxon rank sum tests and correlations were only considered significant if <0.05 after Bonferroni correction but are reported as the raw p values. Plots were made in MATLAB or Microsoft Excel and formatted using Adobe Photoshop. A table of descriptive statistics for all variables with correlations to class performance is provided as Supplemental Table S1 for those interested.
Results
Predictive Variables for Class Performance
Higher sleep-duration SEM on weeknights negatively correlates with class performance (r = −0.21, p = 2 × 10⁻¹⁰). Splitting the analysis pool by sex reveals that both women and men show this negative correlation, but the relationship is stronger in women (r = −0.24, p = 6.6 × 10⁻⁸; Fig. 1A) than in men (r = −0.19, p = 0.0004; Fig. 1B). Mean sleep duration on weeknights or free nights does not correlate with class performance for women or men (weeknights: r = 0.08, p = 0.12 for men and r = 0.1, p = 0.03 for women; free nights: r = 0.14, p = 0.01 for men and r = 0.07, p = 0.12 for women).
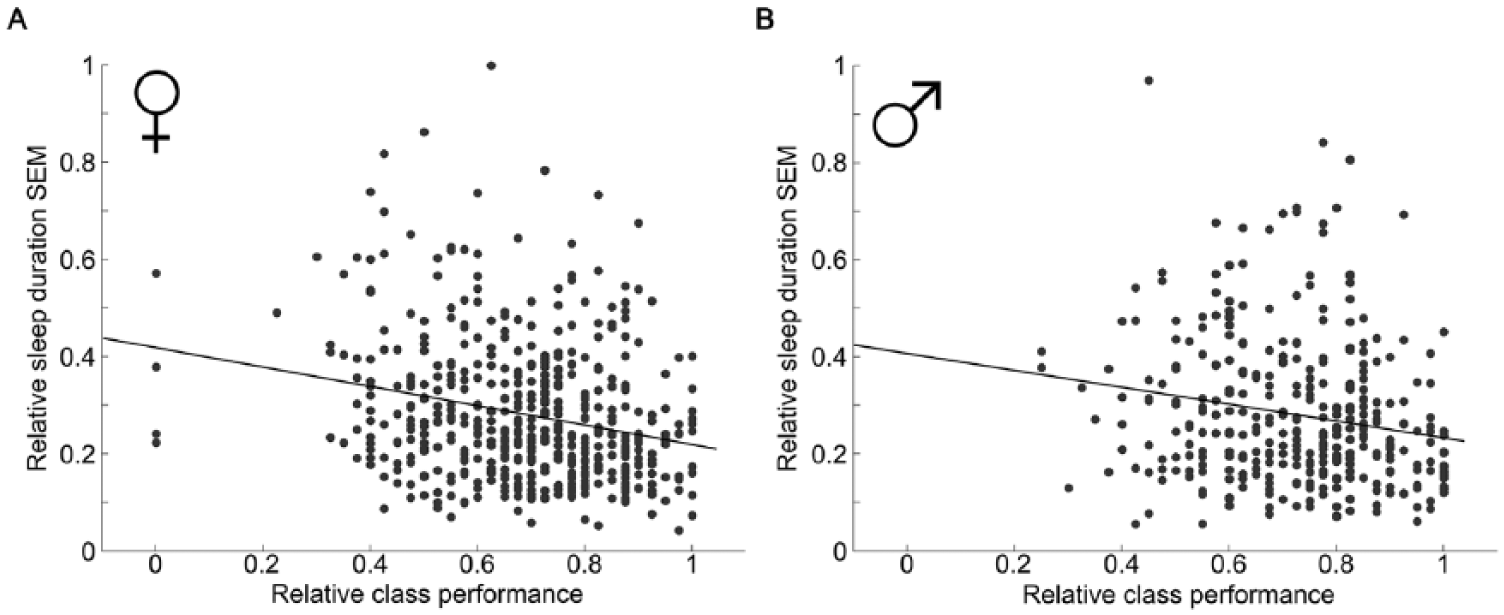
Duration standard error of the mean (SEM) correlates with class performance for both sexes. Weeknight sleep-duration SEM for each female student (A) and male student (B) plotted against relative class performance. Linear regression finds a significant correlation for women (A, r = −0.24, p = 6.6x10⁻⁸) and men (B, r = −0.19, p = 0.0004).
Later mean sleep-onset time on weeknights also negatively correlates with class performance (r = −0.13, p = 8 × 10⁻⁵), whereas wake-onset on weeknights does not (r = −0.07, p = 0.04). Neither mean sleep-onset nor mean wake-onset on free nights correlates as well with class performance (r = −0.10, p = 0.003 and r = −0.03, p = 0.44, respectively). The correlation of class performance with mean weeknight sleep-onset is higher for women than for men (r = −0.16, p = 0.0003, Fig. 2A for women; r = −0.13, p = 0.02 [nonsignificant], Fig. 2B for men).
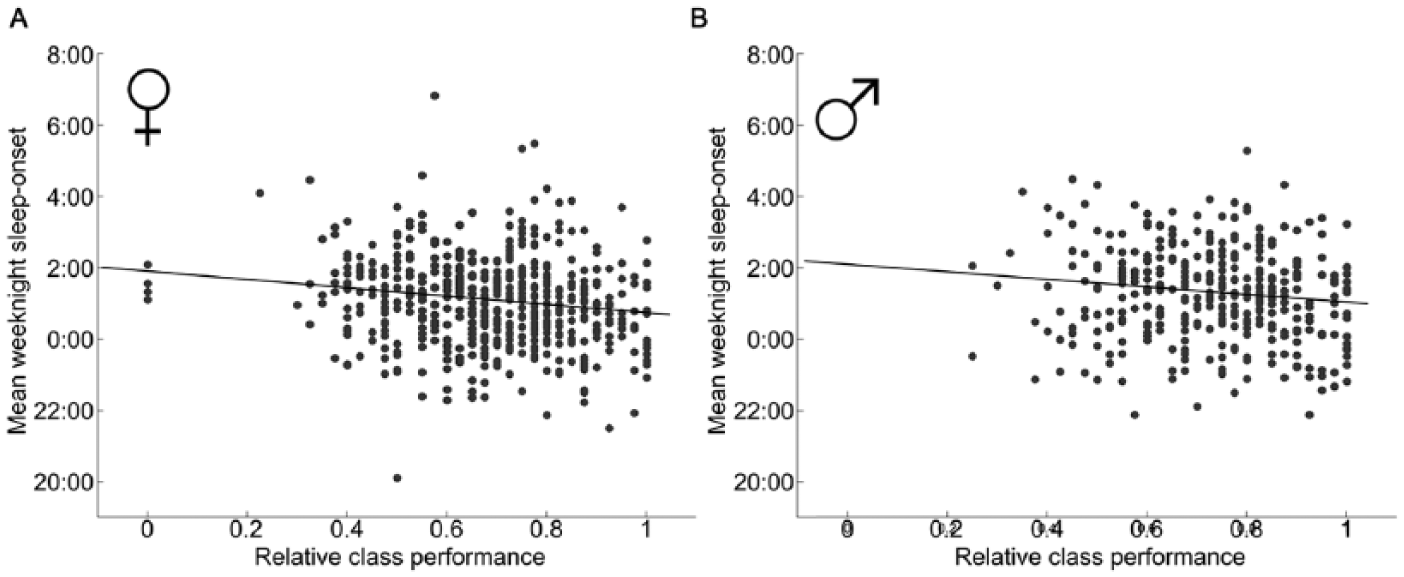
Sleep-onset correlates with class performance for women. Mean weeknight sleep-onset time for each female student (A) and male student (B) plotted against relative class performance. Linear regression finds a significant correlation for women (A, r = −0.16, p = 0.0003) but not for men (B, r = −0.13, p = 0.02 [nonsignificant after multiple comparison corrections]).
Because weeknight sleep-onset and sleep-duration SEM both correlate with class performance, the effect of one may be subsumed by the effect of the other, and sex may influence the extent to which that is so. Mean weeknight sleep-onset and mean weeknight sleep-duration SEM are significantly correlated (r = 0.315, p = 3.6 × 10⁻²¹), and multiple regression analysis of class performance by both with sex reveals that the latter has roughly twice the predictive power of the former (standard coefficient = −0.19, p = 1 × 10⁻⁷; standard coefficient = −0.09, p = 0.035, respectively, while for the categorical variable sex, with women = 1, men = 0, the standard coefficient = −0.24, p = 0.0003). Broken into sex-specific multiple regressions for weeknight sleep-duration SEM and weeknight sleep-onset, women have standard coefficients of −0.21 (p = 6.6 × 10⁻⁶) and −0.10 (p = 0.03), respectively. Men have standard coefficients of −0.16 (p = 0.004) and −0.07 (p = 0.18 [not significant, consistent with the single-variable regression]), respectively.
The preceding correlations were generated by regression across the entire population. Improved diagnostics might be uncovered by clustering specific subsets of students into phenotypes. Lacking other demographic information by which to sort students, I used the categories of “lark” and “owl” to test this hypothesis. Owls and larks were defined arbitrarily as individuals with a mean weeknight sleep-onset 1 standard deviation later or earlier, respectively, than the population mean (women and men being treated as 2 populations). Consistent with the hypothesis that phenotypic clustering could yield increased predictive power, a significant difference in median class performance exists between male owls and larks, whereas for population-wide regressions, males did not show a significant correlation of performance with sleep-onset time. For females, this difference is a trend. Male owls have a mean 7.1% worse class performance than male larks (median, 5% worse), and female owls average 6.3% worse class performance than female larks (median, 2.5% worse) (p = 0.0125 for males, Fig. 3A, and p = 0.057 for females, Fig. 3B; Wilcoxon rank sum test, males significant after Bonferroni-corrected for the multiple comparisons).
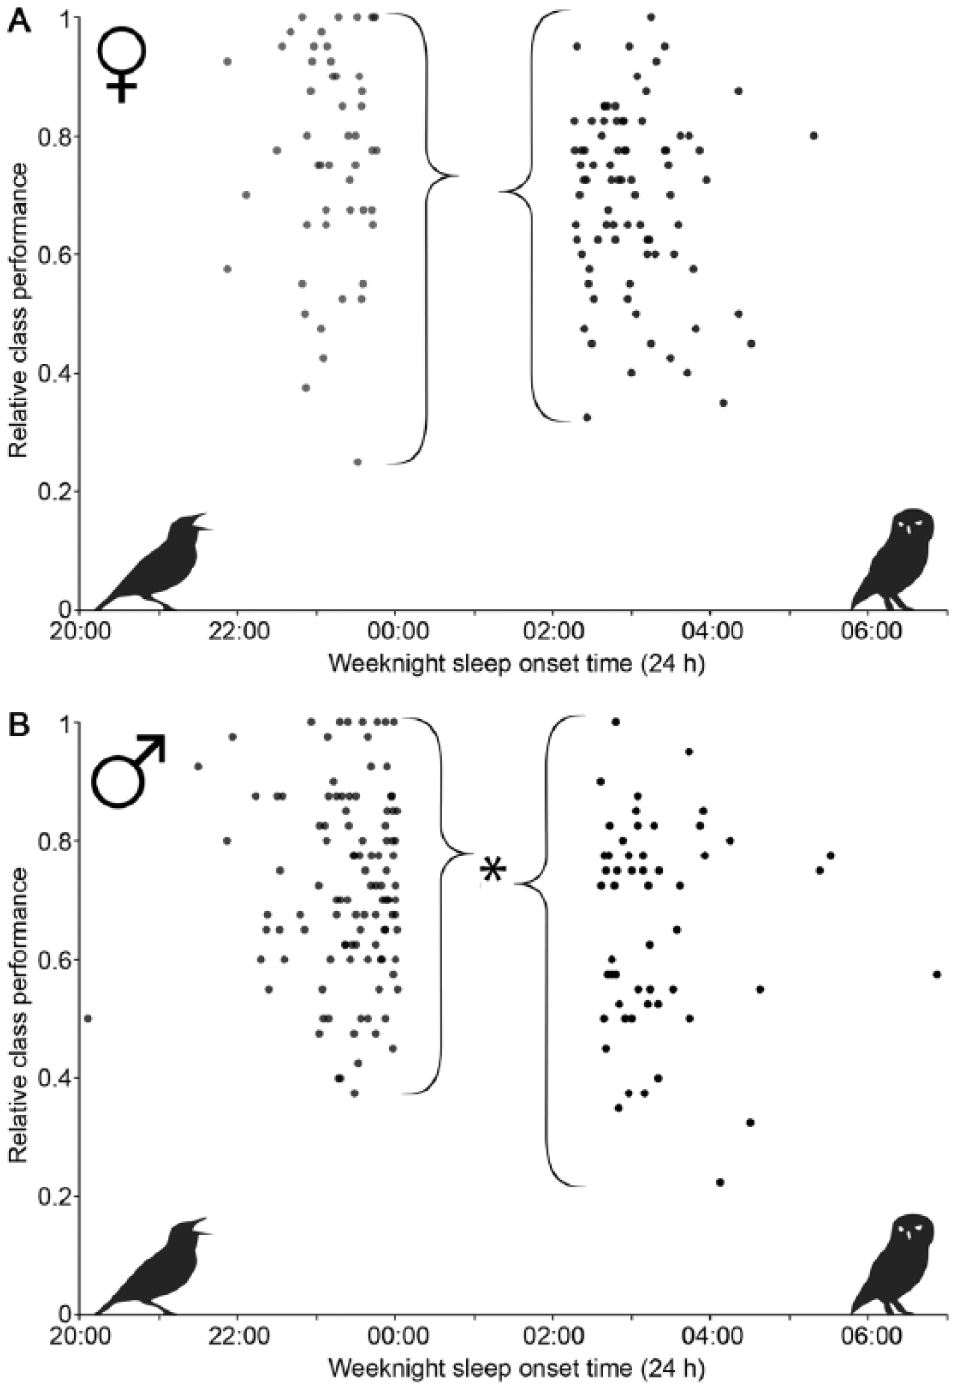
Comparison of phenotypic subgroups “lark” and “owl” with class performance. Comparison of larks and owls (defined within each sex as students whose mean weeknight sleep-onset is 1 standard deviation earlier or later than the group mean, respectively) finds a trend of increase in class performance for larks over owls in women (A, p = 0.057) and a significant effect in men (B, p = 0.0125). As a visual cue to the lark vs. owl comparison, a lark siluet is in the lower left on the side of those individuals fitting the definition of lark, and an owl in the lower right on the side of those fitting the definition of owl. Brackets point to the median of each population.
The data here come from self-reporting, which yields less precise sleep timing than more invasive sleep-tracking methods. Nevertheless, these data were judged to reflect reality because they recapitulate known sleep patterns of weekend shift and of sex difference in sleep timing. Students may shift their daily sleep rhythms on weekends to enable more peer interactions or to eliminate sleep debt accumulated during the week. Consistent with these expectations, students delayed sleep-onset on free nights by 28 min on average and delayed wake-onset by 88 min on average. Student sleep times also show an expected sex difference in mean sleep-onset, with men on average going to sleep 15 min later and waking up 20 min later than their female counterparts (2-sided Wilcoxon rank sum test, p = 0.002 and 8.1 × 10⁻⁵, respectively). This sex difference in sleep timing is consistent with effects of sex hormones and chromosomes on sleep parameters (Colvin et al., 1969; Ehlen et al., 2013; Paul et al., 2009; Paul et al., 2008) as well as the human subject literature (Randler, 2007; Van Reen et al., 2013). Such consistency with expected results from the literature further validates the present approach.
Discussion
The analyses here support the hypothesis that social impositions on sleep timing and daily stability affect learning in individuals whose sleep patterns are in conflict with these impositions. Specifically, a lack of daily stability in sleep duration is correlated with lowered academic performance in men and women. For women, having later sleep-timing is also correlated with lessened academic performance, whereas for men, this effect appears to be attenuated, significantly affecting only extreme late types (“owls”). The analyses presented here cannot get at causality, but given the clear importance of both sleep and circadian stability in learning and memory, the correlations are not surprising and would be worth investigation through real-world experiments. For example, delaying school start times positively affects sleep duration and quality and increases self-reported performance (Owens et al., 2010), but detailed analysis of performance and effects of sex have not been reported and would be worth exploring.
The importance of regulated sleep and circadian rhythms (duration, quality, phase-stability, etc.) in the ability to learn and form memories has long been appreciated, with many theories proposed to explain the connection (e.g., Frank, 2013; Genzel et al., 2013; Gibson et al., 2010; Kvint et al., 2011; Lee et al., 2009; Pereyra et al., 1996; Rupp et al., 2010; Tononi and Cirelli, 2012; Wright et al., 2006). The current study offers unique contributions in several ways. It is the first study to include such a large sample size and to do so with data from real life over several weeks continuously. This ensures samples both within and across subjects, so that individual variance, and not just means, can be assessed to detect patterns not otherwise visible. The value of this is reflected in the finding that intraindividual variance of sleep duration is the strongest correlate of class performance found here, whereas mean duration alone had no predictive power (perhaps because of the tight clustering of average sleep durations or the lack of a large group of students with very short average durations). Previous observations that sleep duration did not correlate with class performance caused concern about the efficacy of investigations into the relationship of sleep and learning (Eliasson et al., 2002; Genzel et al., 2013). The findings here suggest that the connection does exist and that collection of larger data sets will help identify more subtle patterns. The large sample size also allows dissection of subgroups—men and women, larks and owls—for more fine-grained analysis. Finally, this study highlights the advantages of web- and smartphone-based logs to generate running sleep-log databases for the generation of large-scale data sets at low cost and with low subject and investigator burden. Such data sets could be used to augment more invasive human sleep and circadian studies. Generation of such data is likely to become less expensive, easier, and more integrated in public use with time as the wearable device market, the Quantified Self movement, and so on (Bowden, 2012; Fortino et al., 2014; Teller, 2006) grow.
The present study suffers from a dependence on self-reported data (already discussed) and from a lack of variable richness. Sex is the only given independent demographic variable available for decomposition of the data into clusters. An illustration of the importance of analyzing phenotype clusters is shown in the significant difference in performance found in a population of 116 male larks and owls, despite a failure to detect this difference in the regression of class performance versus weeknight sleep-onset of all 350 males. As personal data become more common and more variable-rich, they will enable greater phenotypic dissection through clustered variables (e.g., also clustered against age, family education, genetic profiles, etc.). Although sex is certainly not the only demographic variable of diagnostic value, it provides evidence for the potential usefulness of personalized user profiles for developing both academic understanding of the role of sleep and circadian rhythms in real-world populations, as well as for the discovery of patterns useful in guiding personal choice and policy to optimize education outcomes in the future.
Footnotes
Acknowledgements
The author thanks Dave Hurley and Chessa Goss for orchestrating the lab at the UW and Drs. Lance Kriegsfeld, Irving Zucker, Horacio de la Iglesia, Brian Prendergast, Michael Schwartz, and Larry Smarr for their thoughtful comments on this manuscript.
Data Accessibility
Notes
References
Supplementary Material
Please find the following supplemental material available below.
For Open Access articles published under a Creative Commons License, all supplemental material carries the same license as the article it is associated with.
For non-Open Access articles published, all supplemental material carries a non-exclusive license, and permission requests for re-use of supplemental material or any part of supplemental material shall be sent directly to the copyright owner as specified in the copyright notice associated with the article.