
Abstract
Mathematical models have a long and influential history in the study of human circadian rhythms. Accurate predictive models for the human circadian light response have been used to study the impact of a host of light exposures on the circadian system. However, generally, these models do not account for the physiological basis of these rhythms. We illustrate a new paradigm for deriving models of the human circadian light response. Beginning from a high-dimensional model of the circadian neural network, we systematically derive low-dimensional models using an approach motivated by experimental measurements of circadian neurons. This systematic reduction allows for the variables and parameters of the derived model to be interpreted in a physiological context. We fit and validate the resulting models to a library of experimental measurements. Finally, we compare model predictions for experimental measurements of light levels and discuss the differences between our model’s predictions and previous models. Our modeling paradigm allows for the integration of experimental measurements across the single-cell, tissue, and behavioral scales, thereby enabling the development of accurate low-dimensional models for human circadian rhythms.
Introduction
Disrupted circadian rhythms have been implicated in a vast array of both mental and physical health maladies including cancer, diabetes, addiction, depression, and sleep disorders (Abarca et al., 2002; Haus and Smolensky, 2006; Gale et al., 2011; Lewy et al., 2006). Moreover, the efficacy of health treatments has been found to vary in a circadian manner, meaning that knowledge of a patient’s circadian phase could allow for more effective treatments with reduced side effects (Lévi, 2006; Hrushesky, 1985). Therefore, it is a matter of vital importance to understand and predict human circadian rhythms.
The maintenance of healthy circadian rhythms requires them to be synchronized to environmental cycles by outside forces known as zeitgebers. In mammals, the most powerful zeitgeber is the daily light cycle (Pittendrigh and Daan, 1976). Daily light cycles are sensed in the retina and passed directly along the retino-hypothalmic tract to the master circadian clock (Meijer and Schwartz, 2003). The mammalian master circadian clock has been localized to the suprachiasmatic nucleus (SCN), a cluster of 20,000 neurons in the hypothalamus (Moore and Eichler, 1972; Stephan and Zucker, 1972). Each of these thousands of clock neurons in the SCN contains an intricate genetic feedback loop, which cycles with a period close to 24 h (Liu et al., 1997). The emergent rhythm produced collectively by these clock neurons drives peripheral circadian cycles found throughout the body (Dibner et al., 2010).
The study of human circadian rhythms has been approached using 3 principal paradigms. First, through the use of model organisms, which allow for invasive examinations of the master clock, coupling agents, and molecular details of the clock. Second, through careful laboratory-based human studies, which track circadian dynamics through the use of one of several reliable markers for the human circadian rhythm. Finally, recent technological advances have allowed for the collection of large data sets of self-reported survey data from individuals outside the laboratory setting (Walch et al., 2016; Roenneberg et al., 2007; Wirz-Justice et al., 2003). Under this paradigm, sleep-wake cycles (or other correlates of the circadian phase) have been used as a proxy measure of circadian phases.
Studies in model organisms have revealed the details of the genetic feedback loop present in each clock neuron as well as the coupling forces between the neurons that help shape the circadian waveform produced by the SCN. The circadian waveform is known to vary under a variety of conditions, including age, seasonal day length, and light history of the animal (Evans and Gorman, 2016). Laboratory studies of human circadian rhythms have produced an increased understanding of how light input is integrated into the master circadian clock as well as careful measurements of key parameters, such as the human circadian period (Czeisler et al., 1999; St Hilaire et al., 2012; Khalsa et al., 2003). Large data sets of self-reported circadian data have been used to study the variation in circadian dynamics across the human population (Walch et al., 2016; Roenneberg et al., 2007; Wirz-Justice et al., 2003). In particular, these studies have begun to uncover the prevalence of different sleep timing phenotypes or chronotypes in the human population.
From a mathematical modeling perspective, the increased knowledge of the details of circadian timekeeping has led to a divergence in the field. Detailed high-dimensional models have been created to explain and predict the molecular data sets generated through study of model organisms (DeWoskin et al., 2015; Kim and Forger, 2012). In contrast, models of human circadian data have remained phenomenological and low dimensional to avoid overfitting the available data and to reduce the computational burden of simulations. However, these 2 modeling approaches have not been integrated to allow for the exchange of knowledge between the molecular and human paradigms. To incorporate molecular data, models of human circadian dynamics need to be derived systematically from more detailed high-dimensional models of the master circadian clock.
A mathematical technique capable of supporting such a derivation was introduced by Edward Ott and Thomas Antonsen in 2008 (Ott and Antonsen, 2008). Their technique can be used to reduce a large system of heterogeneous coupled phase oscillators to a low-dimensional macroscopic model. Recently, this technique was applied to the study of circadian rhythms directly for the first time (Lu et al., 2016). However, recent evidence has shown that the accuracy of the Ott-Antonsen approach can be improved upon when describing mammalian circadian rhythms (Hannay et al., 2018). In that work, we introduced a new ansatz, the
In this work, we demonstrate the use of the
Materials and Methods
Previous Models
The most prolific models of human circadian dynamics are based on the van der Pol (VDP) limit cycle oscillator model (Kronauer et al., 1982; Wever, 1972; Forger et al., 1999). The VDP oscillator provides a low-dimensional and well-understood basis to model the overt circadian rhythms as measured by markers such as core body temperature and melatonin levels. As our knowledge of the light response of the human circadian rhythm has grown, a series of modifications have been introduced to the original models (Jewett and Kronauer, 1998; Kronauer et al., 1999; Forger et al., 1999). These progressive modifications have allowed the VDP models to continue to make accurate quantitative and qualitative predictions of the light response of the human circadian rhythm.
For our purposes, we chose to study the simplest VDP model currently used in predicting human circadian rhythms (Forger et al., 1999),

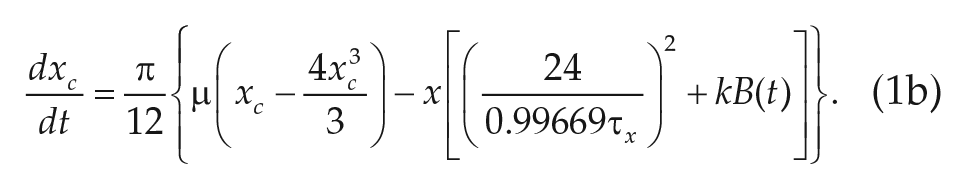
The parameters


We note that Eq. 2d, called the sensitivity modulation, assumes the amplitude of the transformed light input
Despite the tremendous success of the VDP formalism in modeling human circadian rhythms, the lingering phenomenological basis can limit the model’s utility. The variables (
In addition, large data sets have begun to shed more light on the diversity of chronotypes present in the human population (Walch et al., 2016; Roenneberg et al., 2007; Wirz-Justice et al., 2003). In understanding human chronotypes, the phenomenological basis for the VDP model could cripple the ability of researchers to incorporate differences between an individual’s circadian rhythms beyond variations in the intrinsic circadian period (Phillips et al., 2010). Variations in the circadian period can only partially explain the variation observed in human chronotypes (Duffy et al., 2001; Duffy and Czeisler, 2002). In applications, the diagnosis and treatment of circadian disorders will likely require additional knowledge beyond variations in the intrinsic circadian period (Duffy and Czeisler, 2002).
Computing
Model simulations were run using a custom C++ library, employing a variable step-size fourth-order Runge-Kutta explicit solver for the ordinary differential equation integration. Light schedules for the fitting and validation were reproduced in silico from the various experimental protocols (Khalsa et al., 2003; St Hilaire et al., 2012; Czeisler et al., 1989; Zeitzer et al., 2000). Data points for each experiment were digitized from the literature. The model was entrained to a regular light schedule for 50 days prior to initialization of the experimental protocols. To mimic the experimental circadian phase determination, the core body temperature crossing times (defined to be
To quantify the model’s adherence to the fitting data sets, we defined a least-squares cost function:

where the sum over k enumerates the 4 experimental protocols used in the fitting, and the sum over j defines a mesh of phases/intensities for the experimental stimulus. The
Optimal parameters were estimated using a genetic algorithm for global optimization of the least squares cost function using a population size of 1000 and running for 200 generations. The optimal parameter sets were then selected from the final population produced by the genetic algorithm. To speed the parameter evaluations, the cost function evaluations for the genetic algorithm were conducted in parallel, resulting in a significant increase in the speed.
Finally, we implemented a Markov Chain Monte Carlo (MCMC) algorithm to explore the cost basin around our optimal parameter sets. The MCMC algorithm allows for the estimation of the posterior distribution
Results
Derivation of a Macroscopic Model
Overcoming the limitations of the VDP modeling formalism will require moving beyond a phenomenological paradigm. In this spirit, we begin with a high-dimensional model that describes the phase (
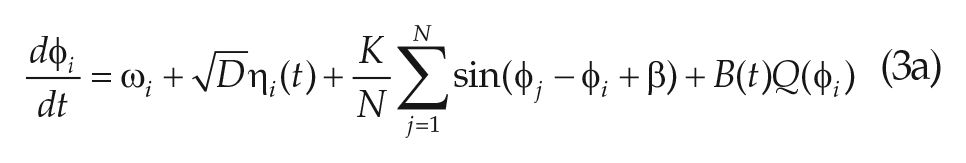

where
where


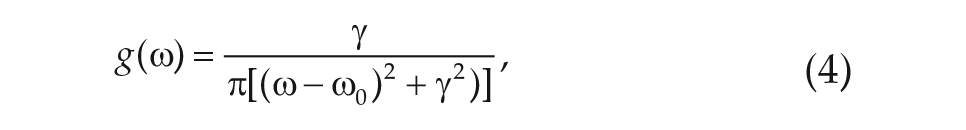
We note that the microscopic model specified in (Eq. 3.1) incorporates both cellular heterogeneity in period (frequency;
While the phase model coarse-grains over the biochemical details of each clock neuron, the large number of neurons in the SCN means it is still a very high-dimensional [

describe the oscillator distribution on a collective scale. The first Daido order parameter
We may transform the microscopic model (Eq. 3) into a system of coupled equations for the Daido order parameters (Hannay et al., 2018; Ott and Antonsen, 2008),
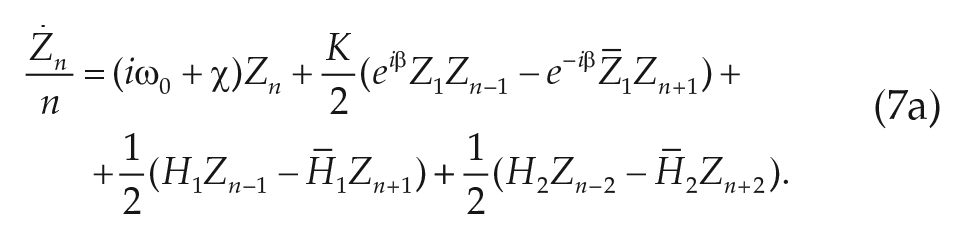


where barred quantities indicate the complex conjugate. This system goes on indefinitely (n = 1,2,. . .); thus, we have replaced our high-dimensional microscopic model (Eq. 3) with an infinite dimensional system. However, in examining dynamic measurements of the phase distribution of circadian clock neurons, we have recently reported the emergence of a low-dimensional relation between the Daido order parameters (Hannay et al., 2018). We found that for systems in which most of the oscillators are synchronized, all higher-order Daido order parameters are slaved to the first one
Applying this moment closure and separating the real and imaginary parts for
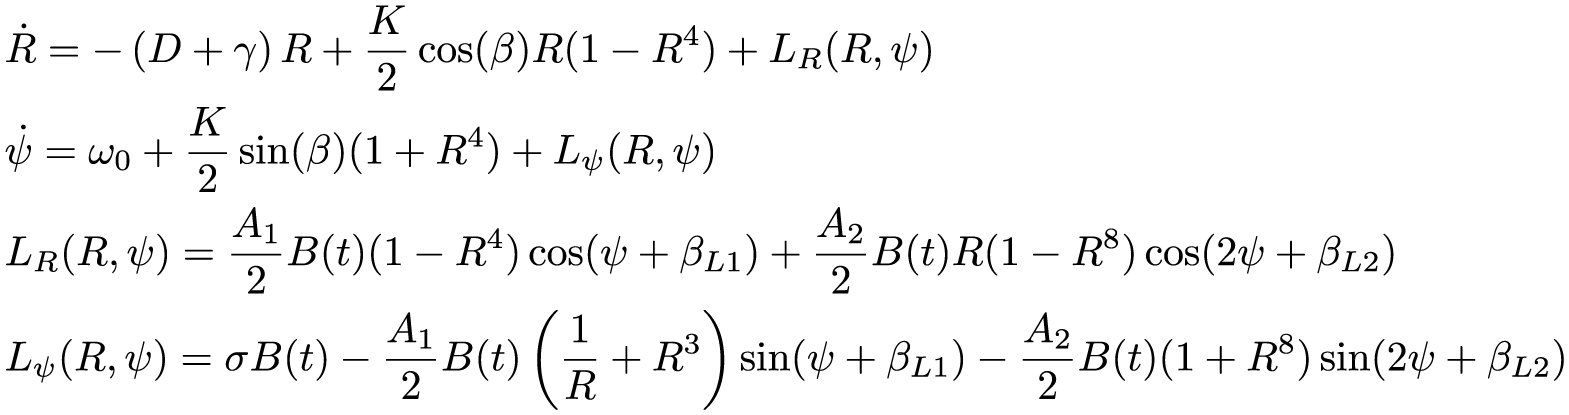
The single-population model for the human circadian clock. Note that we have dropped the subscripts on the Kuramoto terms
Two-Population Model
Another advantage of our modeling approach is that alterations in the microscopic model may be easily incorporated and a new macroscopic model derived. To illustrate this process, we note that physiological investigations of the mammalian SCN have revealed that it may be functionally clustered into 2 principal regions: the ventral (core) and the dorsal (shell) clusters (Foley et al., 2011). Especially pertinent to the study of light on the mammalian circadian clock is the discovery that light information channeled to the SCN from the eyes along the retino-hypothalamic tract projects mainly onto the ventral cluster of oscillators (Meijer and Schwartz, 2003).
Within our formalism, we may easily generalize the derivation used for a single-population model of the SCN to include the division of neurons into the ventral and dorsal clusters. The addition of the dorsal population of oscillators yields a 5-dimensional macroscopic model for the circadian clock, which describes the collective amplitude of the ventral and dorsal populations
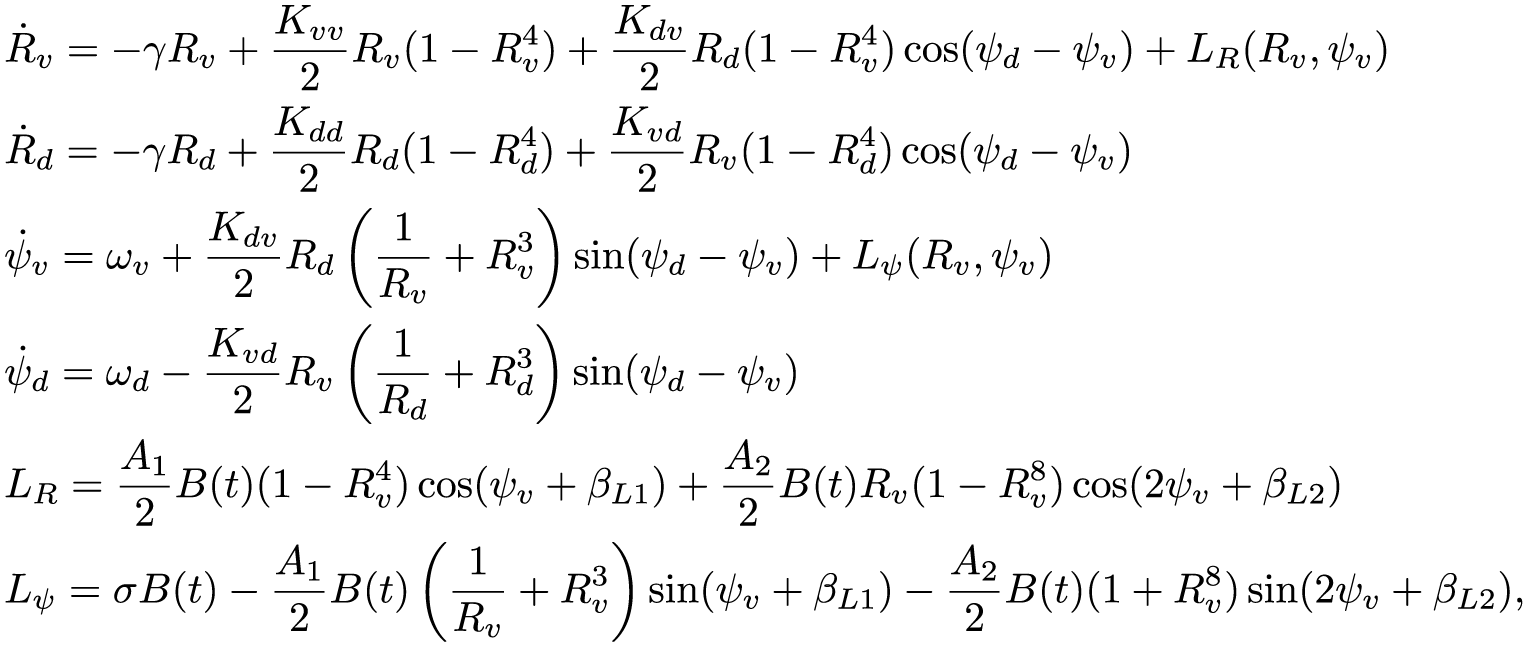
The 2-population model for human circadian rhythms including a ventral and dorsal population of oscillators. Light input is assumed to be presented to only the ventral population. Coupling terms within and between the regions are given in the format
A distinct advantage of the 2-population model is that it allows for finer adjustments of the coupling forces within the SCN. Thus, the coupling strengths may be adjusted to allow for variations in the circadian waveform found under various experimental conditions (seasonal light changes, aging, light history; VanderLeest et al., 2009; Myung et al., 2012, 2015; Evans et al., 2013; Buijink et al., 2016). For example, studies in rodents have found that in longer day lengths, the ventral and dorsal populations tend to separate in phase (Myung et al., 2015). Within the 2-population model, this may be included by allowing the interregion coupling strengths
Parameter Fitting
To build a predictive model of human circadian rhythms, we fit our model to available data on the human circadian light response. We make use of 3 experimental measurements of the human phase-response curve to light to calibrate our model (Khalsa et al., 2003; St Hilaire et al., 2012; Czeisler et al., 1989). These 3 phase-response curve studies use a similar protocol for the assessment of circadian phase shifts while varying the light stimulus applied considerably. St Hilaire et al. (2012) used a single bright-white light stimulus of 1 h in length, while Khalsa et al. (2003) employed a 6.7-h bright-light pulse. Finally, Czeisler et al. (1989) used a 3-pulse stimulus delivered over a period of 72 h. The single light pulse curves show weak or type 1 phase resetting, meaning the phase-response curve is continuous and the phase transition curve (initial phase plotted against final phase) shows an average slope of 1 (Winfree, 2001). Conversely, the 3-pulse phase-response curve shows type 0 resetting, where the phase transition curve has an average slope of zero (Czeisler et al., 1989; Winfree, 2001). Type 0 resetting is associated with the stimulus driving the system to a phase singularity and produces large phase shifts in the circadian phase (Winfree, 2001).
In addition to the phase-resetting data sets, we also make use of experimental measurements of the human light intensity dose-response curve (Zeitzer et al., 2000). These results study the effects of the differing light intensities on the magnitude of phase delays induced by a light stimulus applied during the early subjective night. The intensity response curve was found to be nonlinear and sigmoidal, with the inflection point near the light intensities typical of indoor lighting (Zeitzer et al., 2000).
To compare our models with experimental data, we define the collective phase
A comparison between the VDP model (Forger et al., 1999) and our models shows each of them are capable of describing the phase-response curve data well (Figs. 3 and 4). However, the alteration of the light processing we introduce allows for an improved fit to the light intensity dose-response curve in our models (Figs. 3d and 4d). In addition, we note that to achieve fits to the data for the VDP model, the authors introduced an ad hoc sensitivity modulation function (Eq. 2d), which requires the assumption of a significant variation in the light processing as a function of the circadian phase (Forger et al., 1999). In fitting our models, we find this sensitivity function is not required to describe the phase-shifting data.
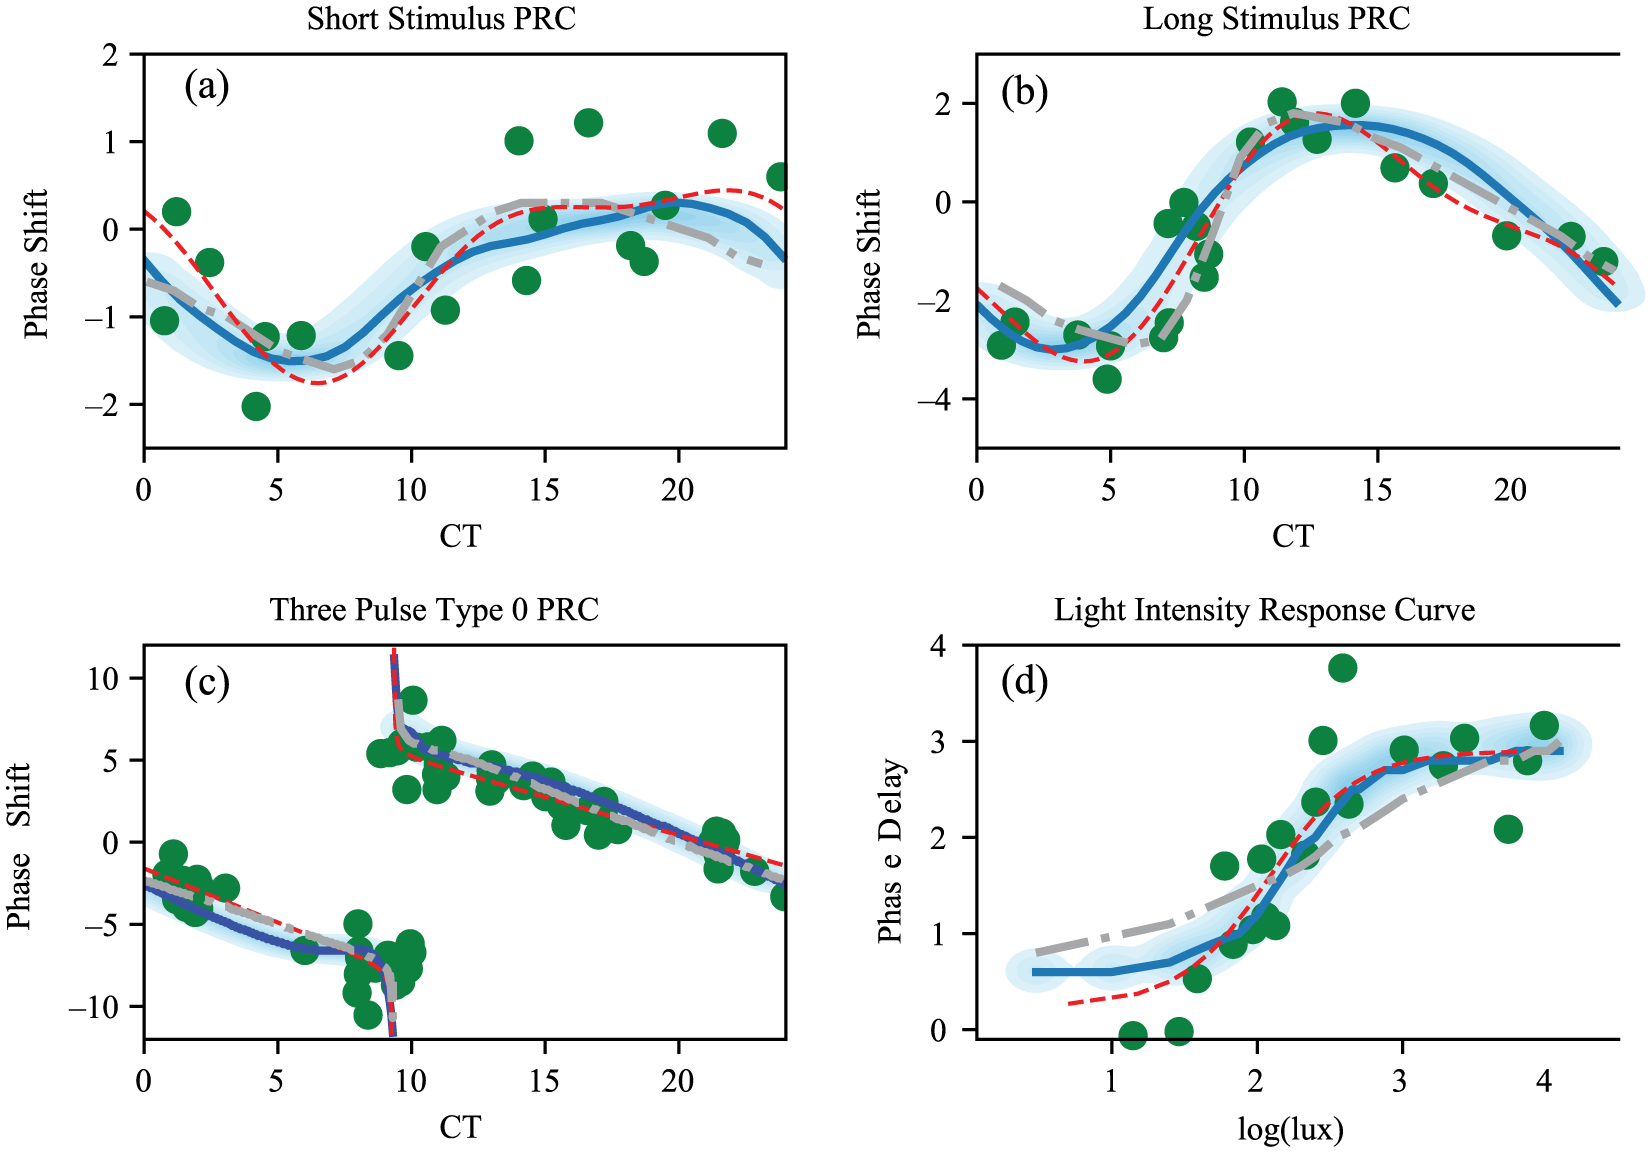
(a-c) Single-population model fit to 3 experimental measurements of the human phase-response curve to light and (d) to the light intensity dose-response curve. Thick curves show the results for the optimal parameter set, and the shading shows the density across the Markov Chain Monte Carlo parameter ensemble. Large dots show experimental data points (Khalsa et al., 2003; St Hilaire et al., 2012; Czeisler et al., 1989; Zeitzer et al., 2000). Dashed and dotted thick lines show results using the van der Pol model (Forger et al., 1999) for parameter values as given in Serkh and Forger (2014). The thin dashed curves show the interpolated function used in the fitting.
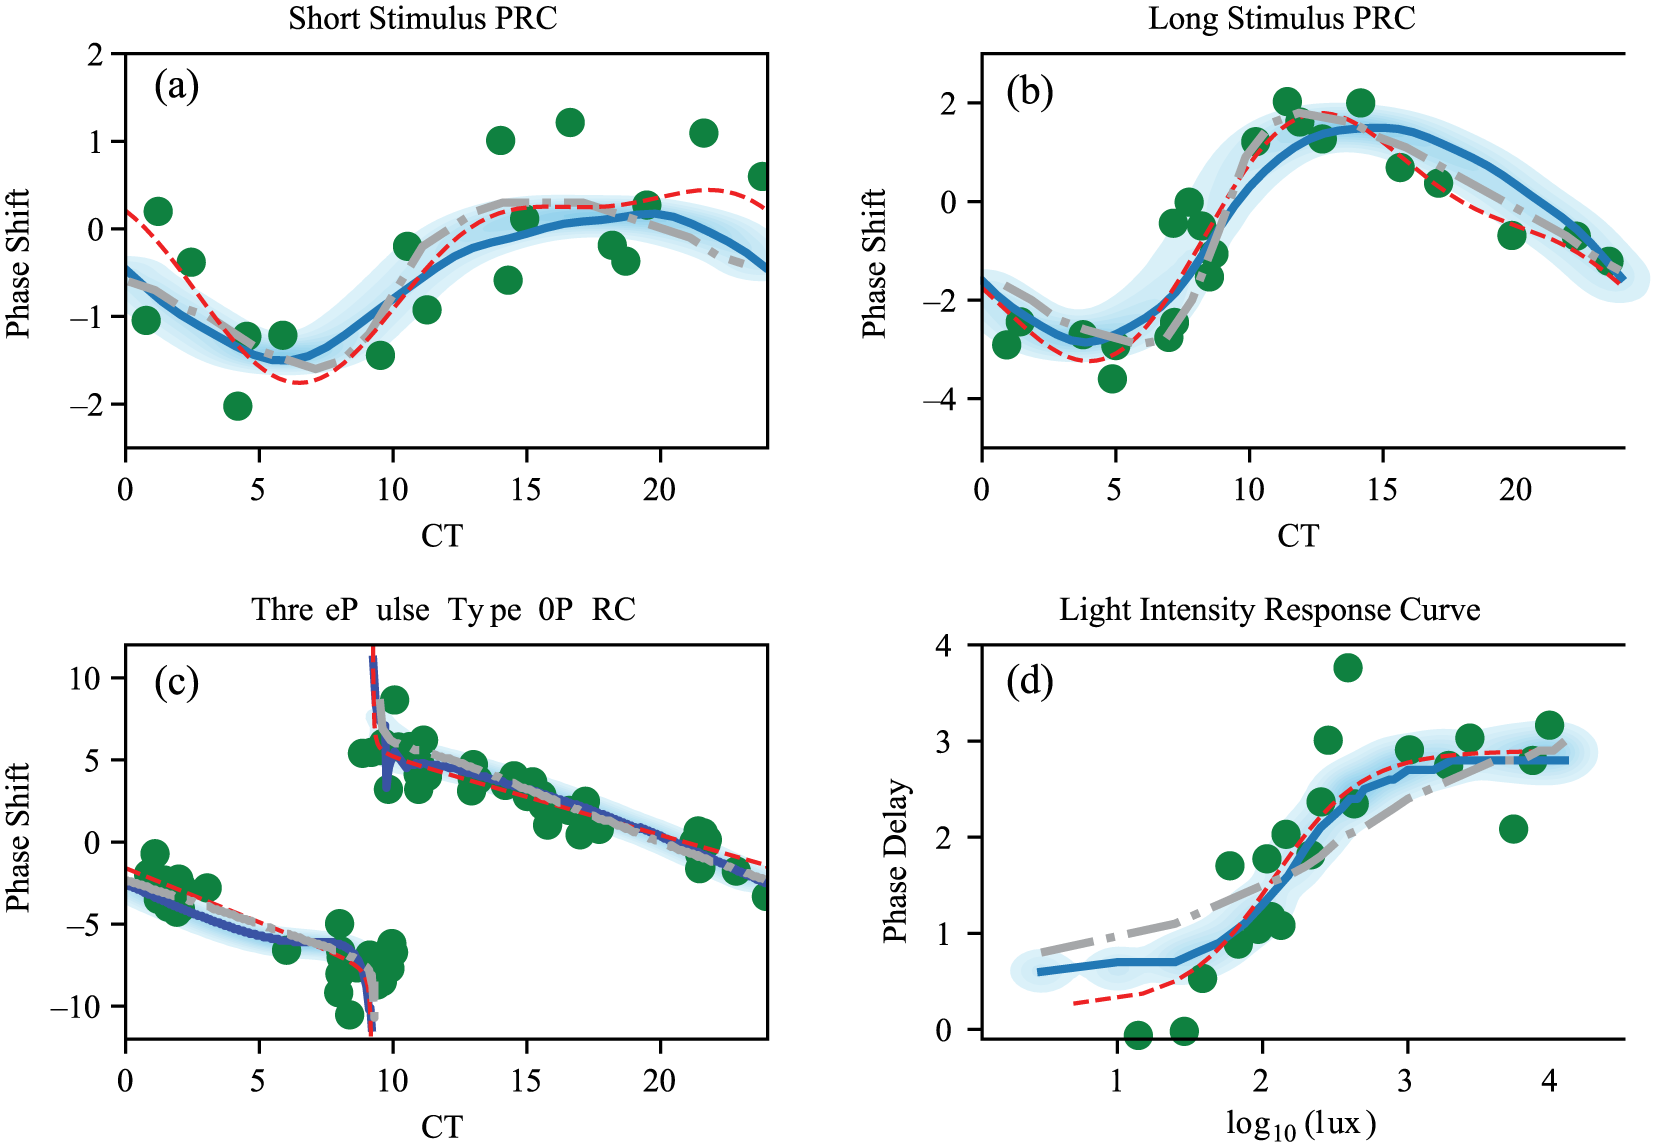
(a-c) Two-population model fit to 3 experimental measurements of the human phase-response curve to light and (d) to the light intensity dose-response curve. Thick curves show the results for the optimal parameter set, and the shading shows the density across the Markov Chain Monte Carlo parameter ensemble. Large dots show experimental data points (Khalsa et al., 2003; St Hilaire et al., 2012; Czeisler et al., 1989; Zeitzer et al., 2000). Dashed and dotted thick lines show results using the van der Pol model (Forger et al., 1999) for parameter values as given in Serkh and Forger (2014). The thin dashed curves show the interpolated function used in the fitting.
Model Validation
To validate our parameter fits, we used the obtained parameter sets to simulate model responses to 3 additional experimental protocols. The first 2 of these data sets consider phase resetting in subjects exposed to intermittent light exposures in the phase delay (Gronfier et al., 2004) and phase advance regions (Rimmer et al., 2000) of the phase response. In the Rimmer et al. (2000) experiments, subjects were exposed to intermittent bright light exposures of 5.3- and 46-min lengths, alternating with episodes of darkness over a total of 5 h. The phase-shifting efficacy of these intermittent exposures was compared with a baseline constant bright-light exposure of 5 h. These intermittent light exposures were found to produce nearly the same magnitude of phase advances as the full light exposure, with the 90-min intermittent light schedule yielding approximately 90% of the baseline phase shift and the 25-min schedule producing 70% of the value of the baseline phase shift measured in terms of the median phase shifts of each group. For this validation data set, we find the 2-population model outperforms both the single population and the VDP model (Fig. 5a), although each of the models has the property that intermittent light exposures retain a large percentage of the phase-shifting capacity of the baseline constant light exposures.
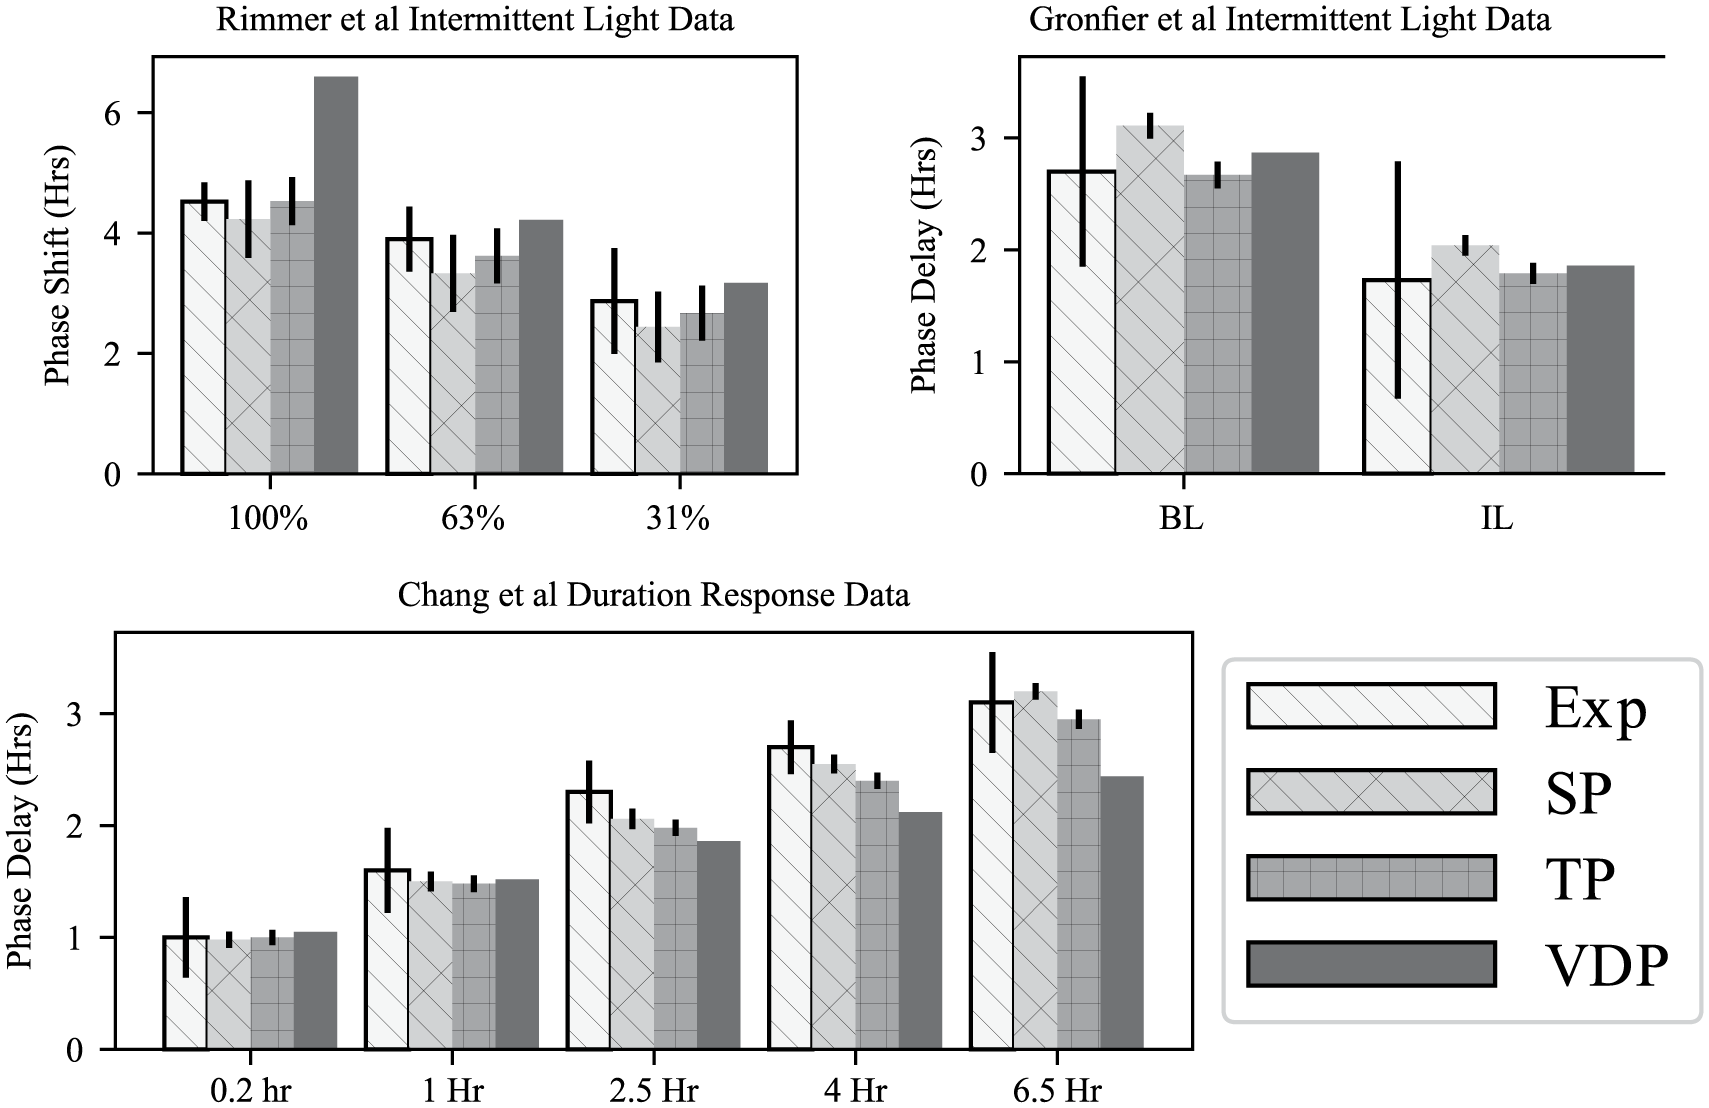
Comparison of model results for the 3 validation data sets (Gronfier et al., 2004; Chang et al., 2012; Rimmer et al., 2000), (Exp) using the single-population model (SP), 2-population model (TP), and the van der Pol model (VDP). Error bars for the single- and 2-population models are taken from the probability density estimated by the Markov Chain Monte Carlo parameter ensemble.
The second validation data set measured the effects of intermittent light exposures in the phase delay region of the phase response (Gronfier et al., 2004). Subjects were exposed to a intermittent light schedule consisting of six 15-min bright-light pulses separated by 60 min in very dim light. The phase-delaying effects of this intermittent light schedule were compared against a baseline light exposure of 6.5 h of constant bright light. For this data set, we find that each of the models captures the experimental data closely (Fig. 5b).
The third validation data set we considered is a duration-response curve, measuring the phase delays induced by bright-light exposures of different lengths (0.2, 1.0, 2.5, and 4.0 h; Chang et al., 2012). Similar to the intermittent light experiments, we find each model reproduces the qualitative results. Both the single- and two-population models were found to reproduce the mean phase shifts accurately (Fig. 5). While the VDP model matches the experimental results for shorter light pulses, its accuracy degrades for the longer light pulses, although we note that other VDP model variants have been found to match the duration-response curve more closely (Klerman and Hilaire, 2007; Fig. 5d).
Differences in Model Predictions
A major difference between the VDP model and the models we propose here lies in the assumed sensitivity modulation function (Eq. 2d) of the VDP based models. The sensitivity modulation function introduces a strong circadian phase dependence into the amplitude of the processed light input
We find that the amplitude recovery rates of the models differ significantly in the absence of time cues. In both the single- and 2-population models, circadian amplitude recovery from small amplitudes takes significantly longer than is predicted by the VDP model (Fig. 6a). However, when the light entrainment cues are provided, the amplitude recovery rate speeds up considerably, such that it is comparable with the rate predicted by the VDP model (Fig. 6b). This slower amplitude recovery has been observed in laboratory treatments when participants are exposed to circadian amplitude suppressing bright-light pulses (Jewett et al., 1991, 1994). The one participant who was kept in darkness following an amplitude suppression showed little evidence of amplitude recovery after 4 circadian cycles (Jewett et al., 1994). However, in participants who received an additional light pulse following amplitude suppression, the circadian amplitude was observed to recover to typical levels within 3 circadian cycles (Jewett et al., 1994). This overestimate of the amplitude recovery rate from small amplitudes by the VDP model has been noted previously in the literature (Indic et al., 2005). However, attempts to remedy this deficiency for VDP-based models introduced higher-order terms into the dynamics of the amplitude recovery (Indic et al., 2005). By comparison, our models do not require higher-order terms in the amplitude recovery function but rather make the hypothesis of weaker coupling forces in the SCN. For small-amplitude reductions, both the VDP model and our models predict the amplitude recovery will occur quickly, in accordance with experimental results (Jewett et al., 1994).
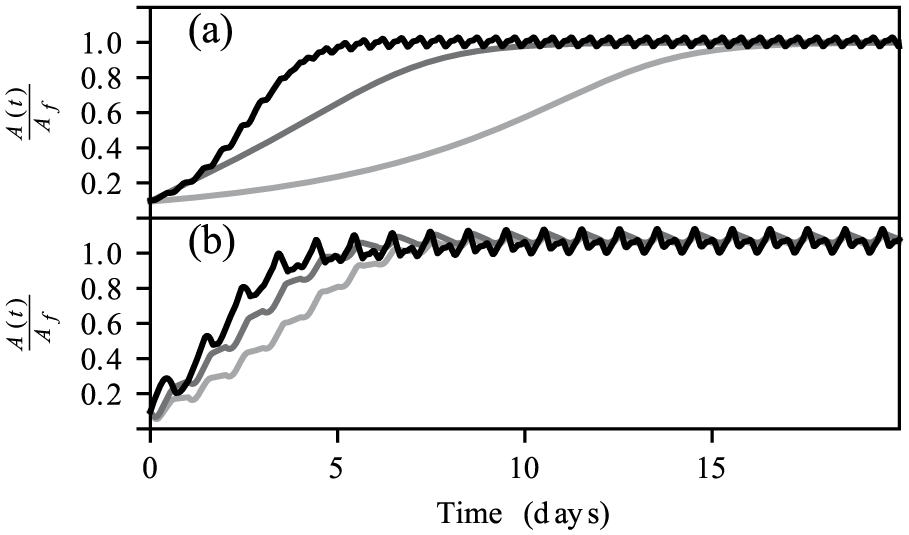
Amplitude recovery from small initial amplitudes in the models. (a) recovery of amplitude for the van der Pol (black), single-population (light gray), and 2-population (dark gray) models in darkness. (b) amplitude recovery when subjected to a regular 16:8 ld light schedule of 100-lux light following the amplitude reduction.
The difference in the amplitude stiffness also manifests itself in the entrainment of the models to regular light schedules. To study the entrainment of the models, we compute the days required to entrain to shifted light schedules in each of the models. To assess entrainment times, we compute the number of days required to entrain to within 0.1 radians or ≈22 min of the final stable entrainment angle beginning from a fine mesh of amplitude states and initial phases. The single- and 2-population models make similar predictions for the number of days required to entrain to the shifted schedules; however, the VDP model predicts significantly longer entrainment times for larger phase shifts (Fig. 7). Observing the entrainment dynamics via stroboscopic plots, we see our models entrain more quickly because of increased circadian amplitude suppression in response to large shifts in the light schedule (Fig. 7). Finally, we note that similar to the VDP model, our models demonstrate an asymmetry between the entrainment times for east and west shifts in the light schedule. Of note, we find this asymmetry in our models for experimentally measured values of the circadian clock period of ≈24.2 h (Czeisler et al., 1999; Carskadon et al., 1999). This contrasts with the mechanism suggested by a recent macroscopic model, using the Ott-Antonsen ansatz, which requires an assumption that the human circadian period exceed 24.5 h (Lu et al., 2016).
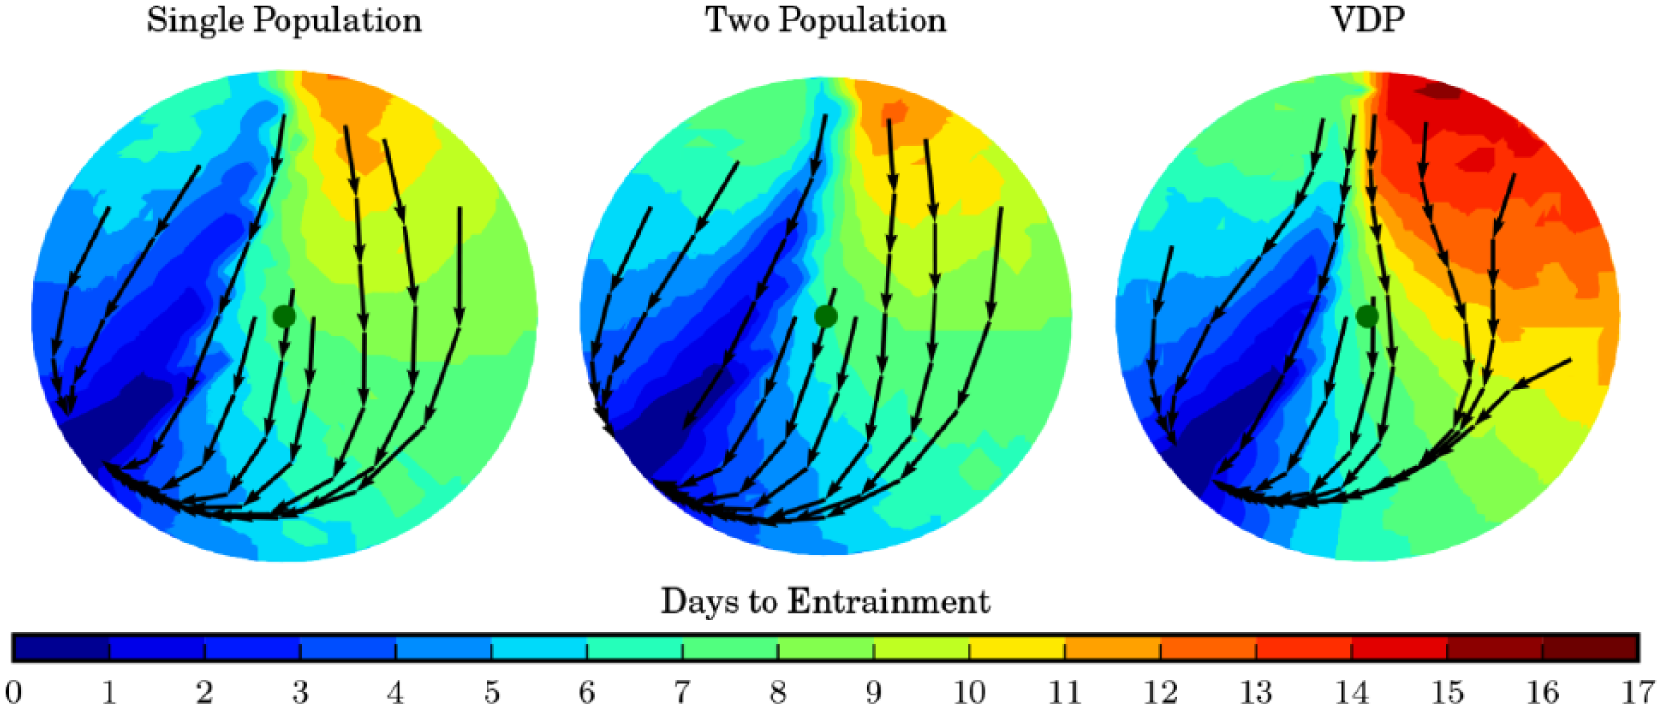
Entrainment times to sudden time zone shifts in the single-population, 2-population, and van der Pol (VDP) models. Colors indicate the days required to entrain to a regular light schedule starting from the amplitude and phase indicated in the circular plot. The amplitudes are normalized between the models to allow comparison, and the orientation of the VDP model plot is reversed for the same reason. Arrows show stroboscopic snapshots of the phase and amplitude at 24-h intervals during the entrainment process.
The differences between the model’s predictions for entrainment time following a sudden shift in the light schedule should alter model predictions of light therapy prescriptions used in the treatment of circadian maladies (Serkh and Forger, 2014). In particular, the increased amplitude malleability of our models will likely have important effects on predictions of optimal light schedules for reentrainment, which typically seek to push the system toward the phase singularity to allow for a faster entrainment (Serkh and Forger, 2014).
Model Comparison in the Wild
To further examine the differences between our models and the VDP-based models, we simulated the 3 models for the Hispanic Community Health Survey data set from the National Sleep Research Resource (Patel et al., 2015; Redline et al., 2014; Zhang et al., 2018; Dean et al., 2016). The Sueño sleep ancillary study contains the daily light exposure schedules measured by a wrist-worn device (Actiwatch Spectrum) for more than 2000 participants for a period of 7 days. We used these measured light schedules as inputs [
Most of the light schedules also showed similar predictions between the VDP model and our models. However, we identified 516 of the 1704 light exposures (30.28%) in which the single-population and VDP model predicted that DLMO times differed by more than 1 h (Fig. 8a). We note that the large majority of these discrepancies between the models show the VDP model predicting a later average DLMO time than our models. To examine the causes for these discrepancies, we compared the average daily light exposure schedules between these groups (Fig. 8b). For the discrepancies between the models, we find that the light schedules show overall weaker light intensities. In particular, we note weaker light intensities during the evening hours, when light is expected to phase delay the circadian clock (Fig. 8b).
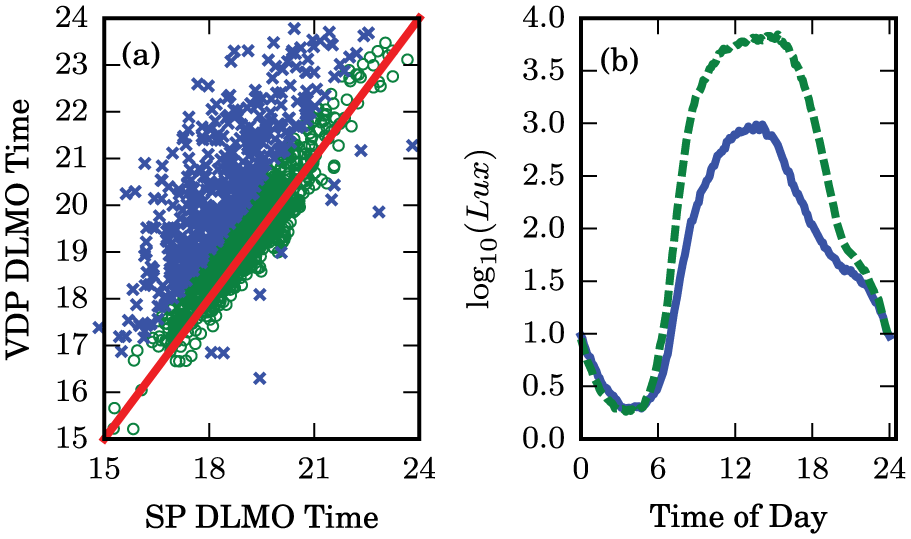
Differences in model predictions for experimental light exposure schedules. (a) Average predicted dim-light melatonin onset times for the single-population model plotted against the van der Pol model. The schedules in which the models agree are shown as open circles, and the schedules where the model predictions differ substantially are shown as crosses. Equal predictions are shown as a diagonal solid line. (b) Average light exposure in log10(lux) for the schedules in which the models agree (dashed) and the schedules in which the model predictions differ substantially (solid).
Our models implement a sharper light intensity dosage-response curve than the VDP model (Fig. 3d and Fig. 4d) in accordance with experimental data (Zeitzer et al., 2000). This leads to a prediction of smaller phase delays caused by light exposures of less than ≈100 lux in intensity. We confirmed this by entraining the 3 models to the averaged light schedule for the discrepancies. We found that the VDP model predicts a later DLMO time by (1.21, 1.10) hours for the single- and 2-population models, respectively.
Discussion
The
Since our models are derived from high-dimensional phase models describing the phase of each circadian neuron in the SCN, the variables and parameters have inherent physiological interpretations that can be traced back to a high-dimensional single-cell model. This allows for easier incorporation of new experimental results and greater falsifiability than can be achieved with phenomenological models currently in use (Forger et al., 1999). Moreover, as our knowledge of population variability increases, the physiological interpretations of parameters in our models could allow for personalized models to be constructed based on the specific properties of each individual’s circadian dynamics.
To provide predictive models, we fit our macroscopic models to measurements of the human circadian light response. The parameter fits were validated against 3 additional data sets to evaluate the accuracy of the model predictions. Moreover, we highlight some key differences between our model predictions and a previous phenomenological model based on the VDP oscillator. In particular, we find that the elimination of the sensitivity modulation function used in the VDP model alters the model predictions on the amplitude recovery dynamics. Our models predict a slower amplitude recovery at smaller amplitudes in the absence of time cues, with a much faster recovery of amplitude predicted when rhythmic light input is provided. This is consistent with available experimental data on circadian amplitude recovery (Jewett et al., 1991, 1994). In addition, we find that our models show large differences from the VDP model in predictions of entrainment times. Weaker coupling in our models led to predictions of shorter entrainment times to large shifts in the light schedule than predicted by the VDP model. This difference in predictions could critically change predictions of optimal light-based chronotherapies for circadian misalignment (Serkh and Forger, 2014).
The final comparison we make is to simulate the 3 models using light exposure estimates recorded by wearable devices (Patel et al., 2015; Redline et al., 2014; Zhang et al., 2018; Dean et al., 2016). We find little differences in the predictions between the 2-population and single-population models for these light schedules. However, we find that the predictions between our models and the VDP model differ by more than 1 h for approximately 30% of these schedules. Examination of the light schedules that give rise to these discrepancies revealed that lower light intensities in the evening hours can account for the divergence observed in the model predictions.
For predictions of reentrainment times and of the response to real-world light schedules, we have not determined which models are more accurate. Additional data will need to be collected to resolve this. However, these results illustrate the important point that the current phase-response data used to fit model parameters are not sufficient to constrain these fundamental applications of human circadian models.
Interestingly, we found that fitting the 2-population model to type 0 resetting data necessitated the assumption that the temperature rhythm is primarily driven by the ventral SCN. This opposes the previous experimental results in rats based on a forced desynchrony protocol (Lee et al., 2009). The reasons for this discrepancy will be the subject of future work.
The VDP-based modeling paradigm has undoubtedly served the circadian community well over the past 50 years (Kronauer et al., 1982; Wever, 1972; Forger et al., 1999). However, the phenomenological basis for these models excludes the current understanding of SCN physiology. We have presented a modeling paradigm that allows movement from the single-cell circadian network scale to the behavioral scale in a systematic manner. This results in low-dimensional models of similar dynamical complexity as the VDP-based models. Moreover, our systematic derivation endows the variables and parameters with physiological interpretations and enables experimental data to be included at multiple scales. The models we derive and fit in this work will need to be revised and improved as we learn additional physiological details of the circadian clock. As we demonstrate with the derivation and analysis of the 2-population model, these physiological details may be included in the microscopic model and then pushed through the reduction to obtain a new macroscopic model. Future studies may include, for example, additional details on the coupling network and mechanisms between circadian clocks in the SCN. Moreover, of particular importance in future work will be the integration of mathematical models with large data sets collected by wearable devices to study chronotype variation in the human population. In this application, a simple model with physiological parameters will be crucial to tying chronotype variations to their physiological and genetic origins.
Supplemental Material
supp_materials_hannay_submission – Supplemental material for Macroscopic Models for Human Circadian Rhythms
Supplemental material, supp_materials_hannay_submission for Macroscopic Models for Human Circadian Rhythms by Kevin M. Hannay, Victoria Booth and Daniel B. Forger in Journal of Biological Rhythms
Footnotes
Acknowledgements
We thank O. Walch for useful discussions related to this work. This work was partially supported by NSF DMS-1412119 and DMS-1853506 (K.M.H. and V.B.), Human Frontiers of Science Program grant RPG 24/2012 (K.H. and D.B.F.), and NSF DMS-1714094 (D.B.F.)
Conflict of Interest Statement
The authors have no potential conflicts of interest with respect to the research, authorship, and/or publication of this article.