
Abstract
Pigment-dispersing factor (PDF) is the most important coupling factor of the circadian system in insects, comparable to its functional ortholog vasoactive intestinal polypeptide of the mammalian circadian clock. In Drosophila melanogaster, PDF signals via activation of adenylyl cyclases, controlling circadian locomotor activity rhythms at dusk and dawn. In addition, PDF mediates circadian rhythms of the visual system and is involved in entrainment to different photoperiods. We examined whether PDF daytime-dependently elevates cAMP levels in the Madeira cockroach Rhyparobia maderae and whether cAMP mimics PDF effects on locomotor activity rhythms. To determine time windows of PDF release, we searched for circadian rhythms in concentrations of cAMP and its functional opponent cGMP in the accessory medulla (AMe), the insect circadian pacemaker controlling locomotor activity rhythms, and in the optic lobes, as the major input and output area of the circadian clock. Enzyme-linked immunosorbent assays detected PDF-dependent increases of cAMP in optic lobes and daytime-dependent oscillations of cAMP and cGMP baseline levels in the AMe, both with maxima at dusk and dawn. Although these rhythms disappeared at the first day in constant conditions (DD1), cAMP but not cGMP oscillations returned at the second day in constant conditions (DD2). Whereas in light-dark cycles the cAMP baseline level remained constant in other optic lobe neuropils, it oscillated in phase with the AMe at DD2. To determine whether cAMP and cGMP mimic PDF-dependent control of locomotor activity rhythms, both cyclic nucleotides were injected at different times of the circadian day using running-wheel assays. Whereas cAMP injections generated delays at dusk and advances at dawn, cGMP only delayed locomotor activity at dusk. For the first time we found PDF-dependent phase advances at dawn in addition to previously described phase delays at dusk. Thus, we hypothesize that PDF release at dusk and dawn controls locomotor activity rhythms and visual system processing cAMP-dependently.
Lesion and transplantation experiments have indicated that the circadian clock, which controls locomotor activity rhythms, is located in the hypothalamic suprachiasmatic nucleus (SCN) in mammals; such experiments also located the circadian clock in insects such as the Madeira cockroach Rhyparobia (Leucophaea) maderae in the optic lobes and later, more precisely, in the accessory medulla (AMe) of the optic lobes (Nishiitsutsuji-Uwo and Pittendrigh, 1968; Moore and Eichler, 1972; Stephan and Zucker, 1972; Page, 1982; Meyer-Bernstein et al., 1999; Reischig and Stengl, 2003a). Despite apparent differences, the SCN and the cockroach AMe resemble each other in terms of their general organization into a shell and core region, in their abundance of partly colocalized neuropeptides, and in their close association with the visual system (Petri et al., 1995; Helfrich-Förster, 2004; Vosko et al., 2007; Vansteensel et al., 2008; Gillette and Abbott, 2009). In addition, the mammalian vasoactive intestinal polypeptide (VIP) and the insect pigment-dispersing factor (PDF) are functional orthologs in their role as main circadian coupling factors. Both sustain interneuronal and intraneuronal coupling that is essential for the expression of strong, synchronized circadian rhythms in intracellular clock gene expressions as well as for circadian locomotor activity rhythms (Vosko et al., 2007; Hastings et al., 2008; Sheeba, 2008; Mohawk and Takahashi, 2011; Granados-Fuentes and Herzog, 2013; Kudo et al., 2013; Helfrich-Förster, 2014). VIP and PDF both signal via G-protein-coupled receptors that activate adenylyl cyclases (ACs; Harmar, 2001; Hyun et al., 2005; Vosko et al., 2007; Duvall and Taghert, 2012; Taghert and Nitabach, 2012; Agrawal et al., 2013; Kudo et al., 2013; Vecsey et al., 2014). Thereby, neuropeptide-dependent changes in cyclic nucleotide levels feed back to the molecular circadian clockwork, possibly via cAMP- and cGMP-specific protein kinase–dependent phosphorylations of clock proteins such as PERIOD and TIMELESS or of cAMP response element-binding proteins and other nuclear targets (Golombek et al., 2004; Carlezon et al., 2005; Lim et al., 2007; Lee et al., 2010; Wong et al., 2012; Li et al., 2014; Seluzicki et al., 2014).
Using enzyme-linked immunosorbent assays (ELISAs), we searched for circadian rhythms in cAMP and cGMP levels in light-dark (LD) and constant conditions (DD). We assumed that the major neuropeptidergic coupling factor PDF is released in a light- and clock-dependent circadian fashion by circadian pacemaker neurons, thereby generating circadian rhythms in the concentration of cyclic nucleotides. First we searched for PDF-dependent cAMP increases in optic lobe neuropils of the Madeira cockroach as major output region of PDF containing pacemaker cells (Stengl and Homberg, 1994). Then, next to cAMP, changes in cGMP levels also were examined because cGMP levels increase stimulus- and calcium-dependently. Also, in the context of gain control, cGMP is a functional antagonist of cAMP in peripheral circadian clocks in insect antennae (Flecke et al., 2006; Saifullah and Page, 2009; Flecke et al., 2010; Sharma, 2010; Schendzielorz et al., 2012). Finally, in running-wheel assays it was examined whether injections of 8-br-cAMP and 8-br-cGMP mimic phase shifts of circadian locomotor activity rhythms similar to PDF injections. Our findings are consistent with the hypothesis that PDF is released at dusk and dawn by 2 circadian oscillator circuits, the evening (E) and the morning (M) oscillators, which cycle in antiphase to each other. Depending on time of day and on oscillators affected, PDF release then controls locomotor activity rhythms cAMP-dependently.
Material and Methods
Animals
Adult male cockroaches (Rhyparobia maderae) were taken from laboratory colonies. They were reared under a 12:12-h LD photoperiod with lights on from 0800 h to 2000 h at 50% relative humidity and 25 °C room temperature (RT). The animals were fed with dried dog food, apples, potatoes, salad, and water ad libitum.
Quantification of Cyclic Nucleotides
Sample collection and preparation
In experiments in which the effect of Rhyparobia PDF on cyclic nucleotide levels was investigated, cockroaches were taken out of laboratory colonies at the middle of the night in the absence of photic stimuli. They were stored temporarily together in vessels to reduce stress and allow the cockroaches to calm down. For dissecting the optic lobe neuropils, cockroaches were cold-anesthetized and decapitated, and the head capsule was opened. All preparations were performed in insect saline with the following composition: 128 mM sodium chloride (NaCl), 2.7 mM potassium chloride, 2 mM calcium chloride (CaCl2), 1.2 mM sodium bicarbonate, pH 7.25. An ultrafine scissor was used to put aside trachea and fat body to expose the optic lobes while 6 optic lobes per sample (= 3 animals) were put in iced cups filled with 900 µl of homogenization buffer (HB). HB contained 0.05% sodium cholate, 200 mM NaCl, 50 mM 3-(N-morpholino)propanesulfonic acid (MOPS), 10 mM ethylene glycol-bis(2-aminoethylether)-N,N,N′,N′-tetraacetic acid (EGTA), 2 mM magnesium chloride (MgCl2), and 1 mM DL-1,4-dithiothreitol (DTT) at pH 7.0. Samples were crushed in an ice-cooled ultrasonic bath (Transonic 310, Elma, Burladingen, Germany) for 25 min. After mixing, samples were centrifuged at 900 g for 5 min at 4 °C (Heraeus Fresco 17, Thermo Scientific, Schwerte, Germany), and 50 µl of the supernatant was transferred into 200 µl of incubation buffer (IB) at 37 °C, which contained 0.05% sodium cholate, 200 mM NaCl, 50 mM MOPS, 5 mM MgCl2, 1 mM adenosine triphosphate, 1 mM DTT, 1 mM 1,2-bis(o-aminophenoxy)ethane-N,N,N′,N′-tetraacetic acid, 275 µM calcium chloride, and 4 µM guanosine triphosphate at pH 7.0 (modified after Vogl et al., 2000). To determine Rhyparobia PDF effects on cAMP and cGMP levels, they were added to the IB at a final concentration of 1 µM. The incubation lasted 10 min and was stopped by adding 100 µl of 7% perchloric acid solution followed by mixing the contents and centrifugation at 900 g for 15 min at 4 °C. All proteins were denatured by perchloric acid. To neutralize the liquid phase, 250 µl of each incubation solution was mixed with 250 µl of 10 mM ethylenediaminetetraacetic acid and 350 µl of chloroform/trioctylamine solution (1:1) 3 times for 10 sec and then centrifuged at 500 g for 5 min at 4 °C. Supernatant was taken to quantify cAMP and cGMP concentrations using self-made immunoassay kits (see below). Because of the different weights of the tissue per sample, the cyclic nucleotide concentrations were normalized by calculating a quotient of cyclic nucleotide concentration by corresponding protein concentration.
Further experiments in which cyclic nucleotide baseline levels in the course of day were determined have been performed. Therefore, cockroaches either were also taken out at zeitgeber time (ZT) 6, 12, 18, or 24 or were isolated at the end of the night in vessels for 6, 12, 18, 24, 30, 36, 42, or 48 h under constant conditions (DD preparations with ZT 24 = circadian time [CT] 0). Dissections were performed as described above except AMe and optic lobe tissue were separated, and each sample contained either 6 optic lobes of 3 animals or 20 accessory medullae (AMae) taken from 10 animals in 900 µl of HB. Processing of the samples was performed as described above without adding Rhyparobia PDF to the IB.
Manufacturing of competitive ELISAs
Microtiter plates (Maxisorp, Nunc, Roskilde, Denmark) were coated with 100 µl of 15 µg/ml goat-anti rabbit IgG (Dianova, Hamburg, Germany) dissolved in phosphate buffer (PBS; 100 mM sodium phosphate dibasic dehydrate, 20 mM sodium phosphate monobasic monohydrate; pH 7.4) at 4 °C overnight on a shaker covered with adhesive foil. After the wells were washed 1 time with 250 µl washing buffer (WB; 0.05% Tween 20 in PBS), nonspecific binding was prevented by adding 250 µl of blocking buffer (BB; 1% bovine serum albumin, 0.05% Tween 20 in PBS) for 1 h at RT. Then, the wells were rinsed 3 times with WB. Both rabbit-anti cAMP and rabbit-anti cGMP antibodies (Genscript, Piscataway, NJ, USA) were diluted at 1:26,666 in BB. Standards of cAMP ranged from 5 pmol/50 µl to 150 fmol/50 µl and of cGMP from 250 fmol/50 µl to 8 fmol/50 µl and were dissolved in BB. cAMP and cGMP conjugated to horseradish peroxidase (Genscript) were used at a concentration of 1:6,666 in BB. Standard curve was prepared by adding 50 µl of standard, 50 µl of tracer, and 50 µl of antibody in each well. Nonspecific binding (NSB) was determined by adding 100 µl of BB and 50 µl of antibody per well and maximum binding (B0) of tracer by adding 50 µl of tracer, 50 µl of BB, and 50 µl of antibody per well. Samples were measured by adding 50 µl of sample, 50 µl of tracer, and 50 µl of antibody in duplicate. Incubation was carried out on a shaker covered with adhesive foil overnight at 4 °C. Finally, wells were washed 3 times with WB, and 25 µl of development solution 1 (100 mM citric buffer at pH 5, 0.02 Vol% hydrogen peroxide, 0.3 Vol% phosphoric acid) and 50 µl of development solution 2 (ddH2O, 0.1 Vol% phosphoric acid, 0.7 Vol% DMSO containing 420 mM 3,3′,5,5′-tetramethylbenzidine) was successively added. After 10 to 30 min incubation time at RT, the reaction was stopped by adding 50 µl of 1 M sulfuric acid. Photometric quantification was performed at 450 nm on a wellplate reader (POLARstar, BMG Labtech, Ortenberg, Germany) (Bos et al., 2006). For calculation of a standard curve and cyclic nucleotide concentrations, each value was subtracted by NSB, and logit transformation (logit [standard/B0]; y-axis) was plotted versus log concentration of standards for linearization. The coefficient for determination of the linear regression fit was never below 0.95.
Statistical analysis
First, distribution of data sets was analyzed by using the Shapiro-Wilk normality test. Because some data sets were not normally distributed, nonparametric tests were subsequently applied. Four different ZTs or CTs per day were analyzed to determine cyclic nucleotide concentrations by using the Kruskal-Wallis test followed by Dunn’s post hoc test. Cyclic nucleotide levels were presented in the text as mean values and in figures as column bars with mean ± standard error.
Behavioral Experiments
Behavioral assay
Analysis was performed in constant darkness at constant temperature (25 °C) in a running-wheel assay. Experimental animals were fed with sesame sticks and water ad libitum. The free-running period (tau = τ) before and after injection and phase shifts (delta phi = Δϕ) after injections were calculated as described in Schulze et al. (2013). Briefly, τ was determined by applying chi-square periodogram analysis using ActogramJ (Schmid et al., 2011). With a linear regression through the corresponding activity onset, defined as CT 12 and used as phase reference point, the circadian time of each animal was determined before injection. To evaluate Δϕ, τ was determined the same way after the injection, where Δϕ corresponds to the difference of linear regression before and after the experiments at the day of injection.
Injections of cyclic nucleotide analogs and Rhyparobia PDF
Under constant dim red light conditions at different CTs, the cockroaches were removed from the running wheels, anesthetized with CO2, and fixed in a metal holder. Injections (2 µl) were made into the hemolymph of the head capsule by using a repetitive pipette (HandyStep, Brand, Wertheim, Germany; Schulze et al., 2013). The phase response curves (PRCs) were prepared with 2 × 10⁻¹⁰ mol membrane permeable cyclic nucleotides (Sigma, Munich, Germany) or with 2 × 10⁻¹² mol Rhyparobia PDF (NSELINSLLGLPKVLNDAa, Hamasaka et al., 2005a) (Iris Biotech, Marktredwitz, Germany), whereas for the dose-dependency curves and calculation of the half maximal effective dose (EC50), 2 × 10⁻⁷ mol, 2 × 10⁻¹⁰ mol, 2 × 10⁻¹³ mol, and 2 × 10⁻¹⁶ mol 8-br-cAMP or 8-br-cGMP was applied. Cyclic nucleotide analogs and Rhyparobia PDF were dissolved in insect saline. Control injections contained only insect saline.
Data analysis
Phase shifts caused by cyclic nucleotide analogs, Rhyparobia PDF, and control injections were statistically evaluated in 3-h time bins at CT 1.5, 4.5, 7.5, 10.5, 13.5, 16.5, 19.5, and 22.5 using the Kruskal-Wallis test followed by Dunn’s post hoc test to examine whether there are CT-dependent effects. Moreover, injections of cyclic nucleotide analogs and Rhyparobia PDF were compared with control injections at each CT with Kruskal-Wallis followed by Dunn’s post hoc test to detect drug-dependent effects. These tests were also used for the analysis of dose-dependency. The determined phase shifts in hours circadian time (hCT) and period length in hours were presented as mean in the text and as mean ± standard error in graphs and tables. Graphic illustration was performed using OriginLab 8 (Northampton, MA, USA) and CorelDRAW Graphics Suite X5 (Ottawa, Canada).
Results
Using ELISAs, we tested whether PDF release is sufficient to affect cAMP levels. In addition, we searched for peaks of cAMP concentrations during the course of the day in the AMe and other optic neuropils as possible times of neuropeptide release. Therefore, we first examined whether PDF increases cAMP levels. Then, cyclic nucleotide levels in the AMe and other optic lobe neuropils were examined in 12:12 LD cycles and in constant conditions (DD1 = first day in constant conditions, DD2 = second day in constant conditions). Finally, using injection experiments combined with running-wheel assays, we determined whether cyclic nucleotide-dependent PRCs resemble PDF-dependent PRCs in the Madeira cockroach.
PDF Increased cAMP but Not cGMP Concentrations
Tissue samples of whole optic lobes, which were dissected in the middle of the night (ZT 18) in the absence of photic stimuli and incubated with 1 µM Rhyparobia PDF, significantly increased cAMP baseline levels (Fig. 1A; Mann-Whitney U test, p < 0.01). In contrast, Rhyparobia PDF did not affect cGMP levels (Fig. 1B).
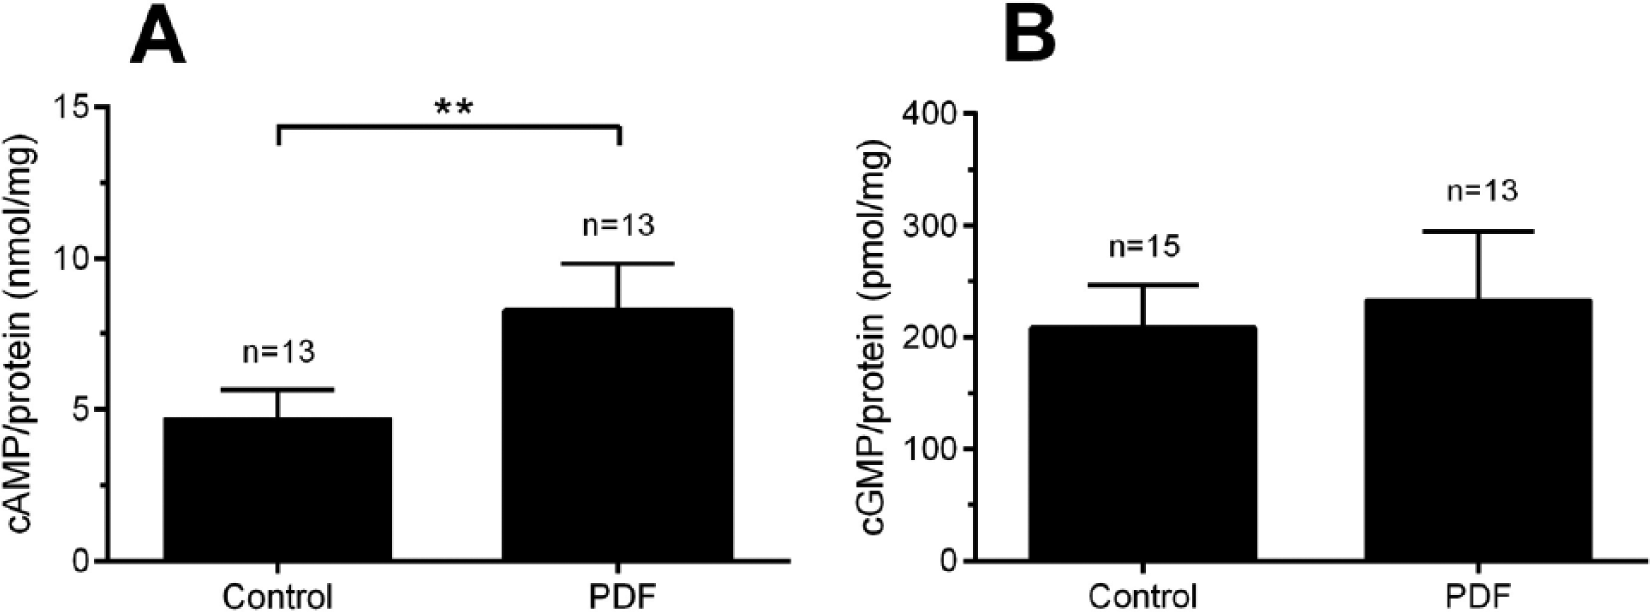
Rhyparobia PDF significantly elevated levels of cAMP (A) but not cGMP (B) in optic lobe tissue of the Madeira cockroach, as measured with ELISAs (A: Mann-Whitney U test, **p < 0.01).
Biphasic Oscillations of cAMP Concentrations in LD and DD2 in the AMe
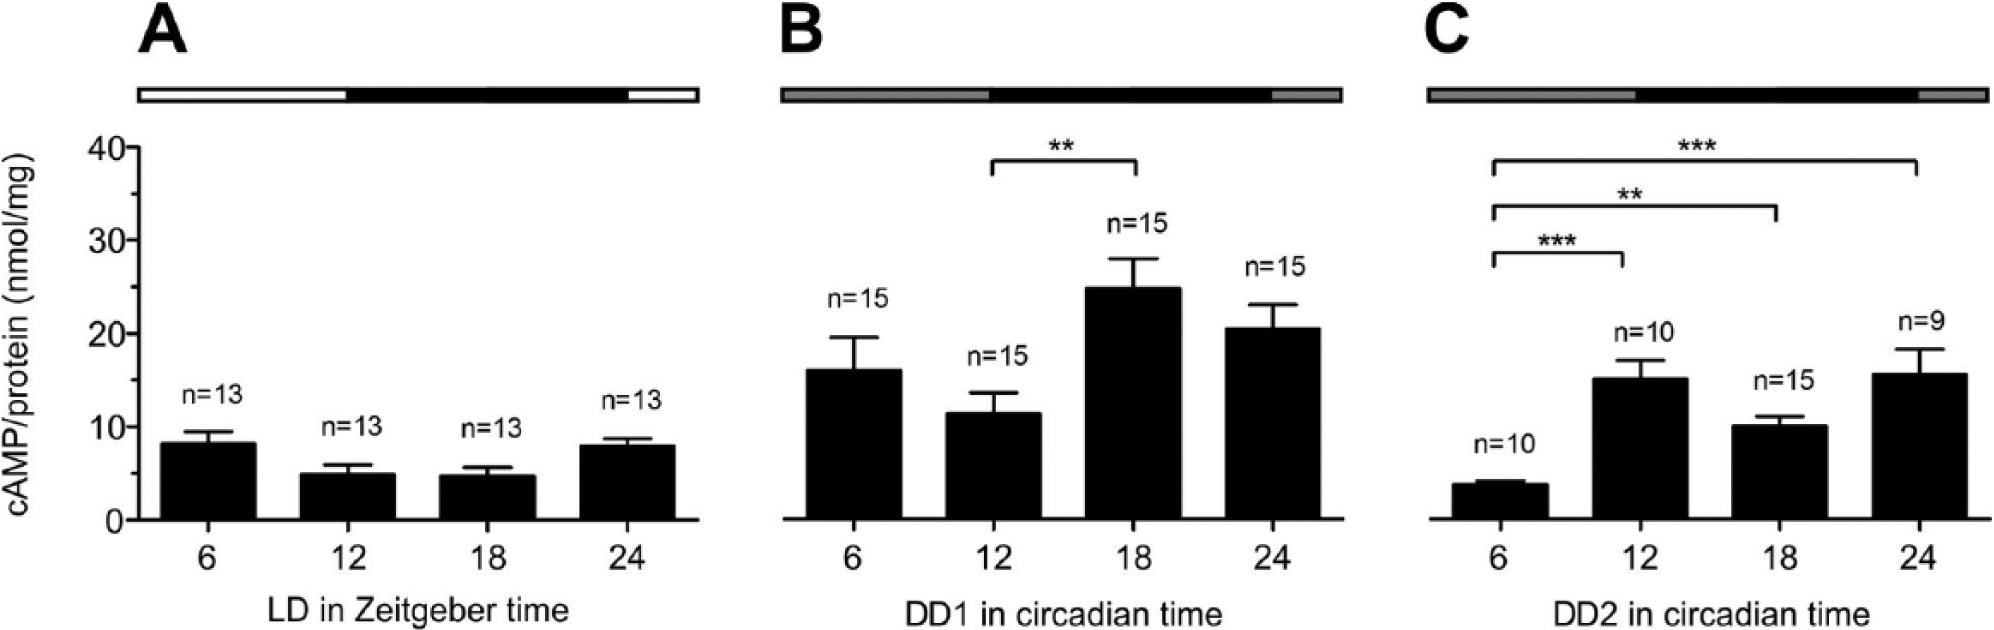
In LD in the AMe, cAMP concentrations oscillated with a minimum at ZT 18 and 2 maxima at dusk and dawn (Fig. 2A, detailed data in Suppl. Table 1). Significantly lower cAMP levels were measured at ZT 18 compared with ZT 12 and ZT 24 (Dunn’s post hoc test, p < 0.01). At DD1 (Fig. 2B, Suppl. Table 1), cAMP concentrations were elevated compared with LD, and no significant differences were observed at different CTs. However, at DD2 (Fig. 2C, Suppl. Table 1) a bimodal oscillation of cAMP became apparent with minima at CT 6 and CT 18 and maxima at CT 12 and CT 24 (Suppl. Table 1). The means of CT 6 and CT 18 significantly differed when compared with CT 12 and CT 24 (Dunn’s post hoc test, p < 0.05; Fig. 2C, Suppl. Table 1).

(A) Oscillations of cAMP levels in AMae of Madeira cockroaches kept in a 12:12 LD photoperiod peaked at dusk (ZT 12) and dawn (ZT 24). (B) While overall cAMP levels increased, the oscillation ceased on the first day in constant conditions (DD1). (C) Oscillations of cAMP levels reappeared on DD2 with the same phase as in LD (Dunn’s post hoc test, *p< 0.05, **p < 0.01). Lights-on (white bar), lights-off (black bar), in DD: subjective lights-on (gray). Incubation buffers contained 10 nM Ca2+ (n = 1:20 AMae).
Biphasic Oscillations of cAMP Concentrations Only in DD2 in Optic Lobe Neuropils
Measurements of cAMP levels in optic lobes (without AMae) under LD revealed no significant oscillation (Fig. 3A, Suppl. Table 1), but mean values at ZT 12 and ZT 18 were approximately half the values measured at ZT 6 and ZT 24. At DD1, cAMP levels strongly increased at all CTs with a significant maximum at CT 18 (Dunn’s post hoc test, p < 0.01; Suppl. Table 1). At DD2, cAMP levels oscillated (Fig. 3C) with minima at CT 6 and CT 18. At DD2, mean cAMP values at CT 6 were significantly lower compared with CT 12 and CT 18 as well as with CT 24 (Dunn’s post hoc test, p < 0.01; Suppl. Table 1).
Concentrations of cAMP remained constant in optic lobes of cockroaches kept in LD 12:12 (A); oscillated in DD1 (B) with a significant peak at CT 18 compared with CT 12; and oscillated in DD2 (C) with 2 significant peaks at CT 12 and CT 24 compared with CT 6 (Dunn’s post hoc test, *p < 0.05, **p < 0.01, ***p < 0.001). Lights-on (white bar), lights-off (black bar), in DD: subjective lights-on (gray). Incubation buffers contained 10 nM Ca2+ (n = 1:6 optic lobes without accessory medullae).
Biphasic Oscillations of cGMP Concentrations Only in LD in AMae
Under LD, concentrations of cGMP also oscillated in AMae, with a significant minimum at ZT 18 and maxima at dusk and dawn (Fig. 4A, Suppl. Table 1). Significant differences in cGMP concentrations were measured between ZT 18 and ZT 12 as well as between ZT 18 and ZT 24 (Dunn’s post hoc test, p < 0.05; Suppl. Table 1). An almost tripling of cGMP concentrations at DD1 was detected at all CTs (Fig. 4B, Suppl. Table 1). During DD2, cGMP concentrations remained constant at a lower level compared with DD1 (Fig. 4C, Suppl. Table 1).
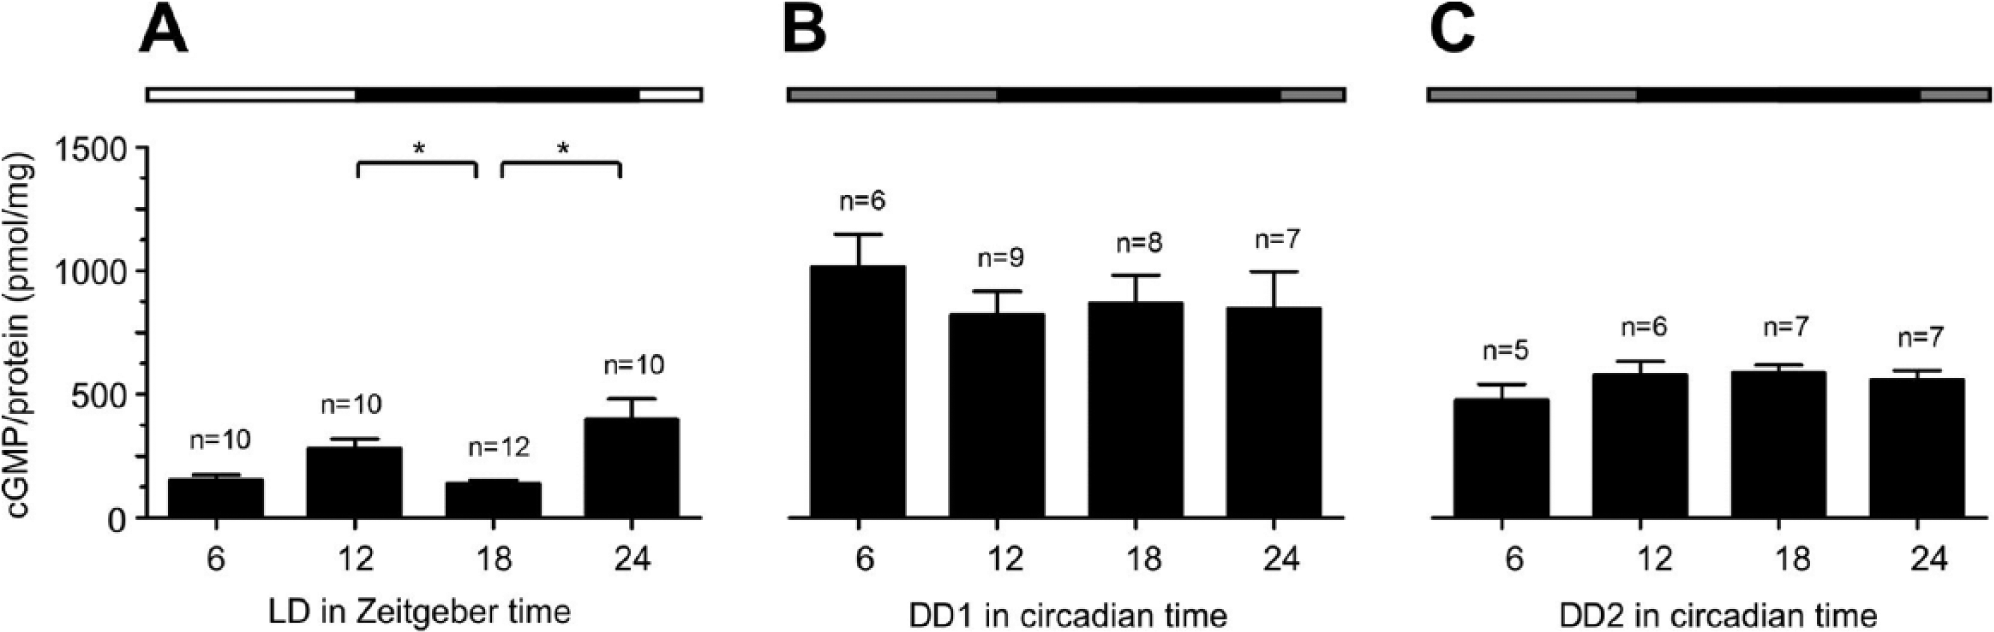
Concentrations of cGMP oscillated in accessory medullae (AMae) of cockroaches kept in LD 12:12 with maxima at dusk and dawn (A), whereas they remained constant and maximally elevated in DD1 (B) and were constant and moderately elevated in DD2 (C) compared with LD (Dunn’s post hoc test, *p < 0.05). Lights-on (white bar), lights-off (black bar), in DD: subjective lights-on (gray). Incubation buffers contained 10 nM Ca2+ (n = 1: 20 AMae).
Monophasic Oscillation of cGMP Levels in LD and DD1 in Optic Lobe Neuropils
In optic lobe neuropils (without AMae) in LD and DD1, cGMP levels oscillated with a single, significant maximum at ZT 12 (Dunn’s post hoc test, p < 0.05; Fig. 5A,B, Suppl. Table 1). The concentration of cGMP at DD2 remained constant at a lower level compared with the maximum in DD1 (Fig. 5C, Suppl. Table 1).
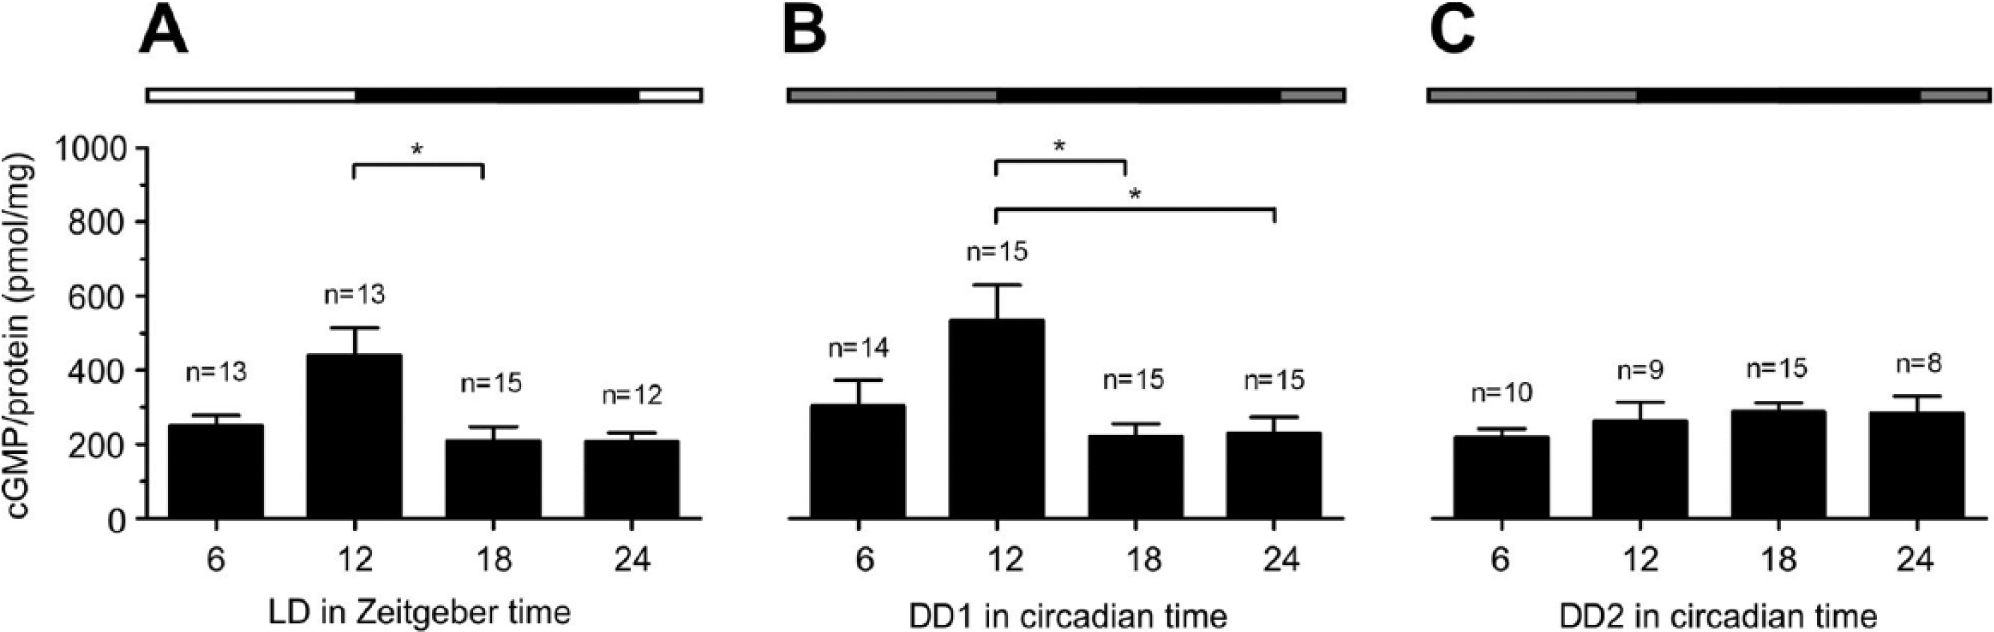
Concentrations of cGMP in optic lobes of Madeira cockroaches kept in LD 12:12 (A) oscillated with a significant peak at ZT 12 compared with ZT 18. The oscillations remained in DD1 (B) with a significant peak at CT 12 compared with CT 18 or CT 24, while they declined to a constant low level at DD2 (C) (Dunn’s post hoc test, *p < 0.05). Lights-on (white bar), lights-off (black bar), in DD: subjective lights-on (gray). Incubation buffers contained 10 nM Ca2+ (n = 1: 6 optic lobes without accessory medullae).
Cyclic Nucleotide Concentrations Usually Increased in DD1
Mean values of cAMP and cGMP concentrations of all samples tested per day were combined and statistically evaluated (Fig. 6, Suppl. Table 2). In AMae, cAMP and cGMP levels increased significantly at DD1 compared with LD (Fig. 6A,C; Dunn’s post hoc test, p < 0.001). At DD2, both cAMP and cGMP levels decreased significantly compared with DD1 (Fig. 6A,C; Dunn’s post hoc test, p < 0.05) but remained elevated compared with LD levels (Fig. 6A,C; Dunn’s post hoc test, p < 0.01). In optic lobes (without AMae), mean cAMP levels increased significantly at DD1 compared with LD (Fig. 6B; Dunn’s post hoc test, p < 0.001). DD2 values decreased significantly compared with DD1 values while remaining elevated compared with LD values (Fig. 6B; Dunn’s post hoc test, p < 0.01). The mean cGMP concentrations in optic lobes remained constant at low levels (Fig. 6D).
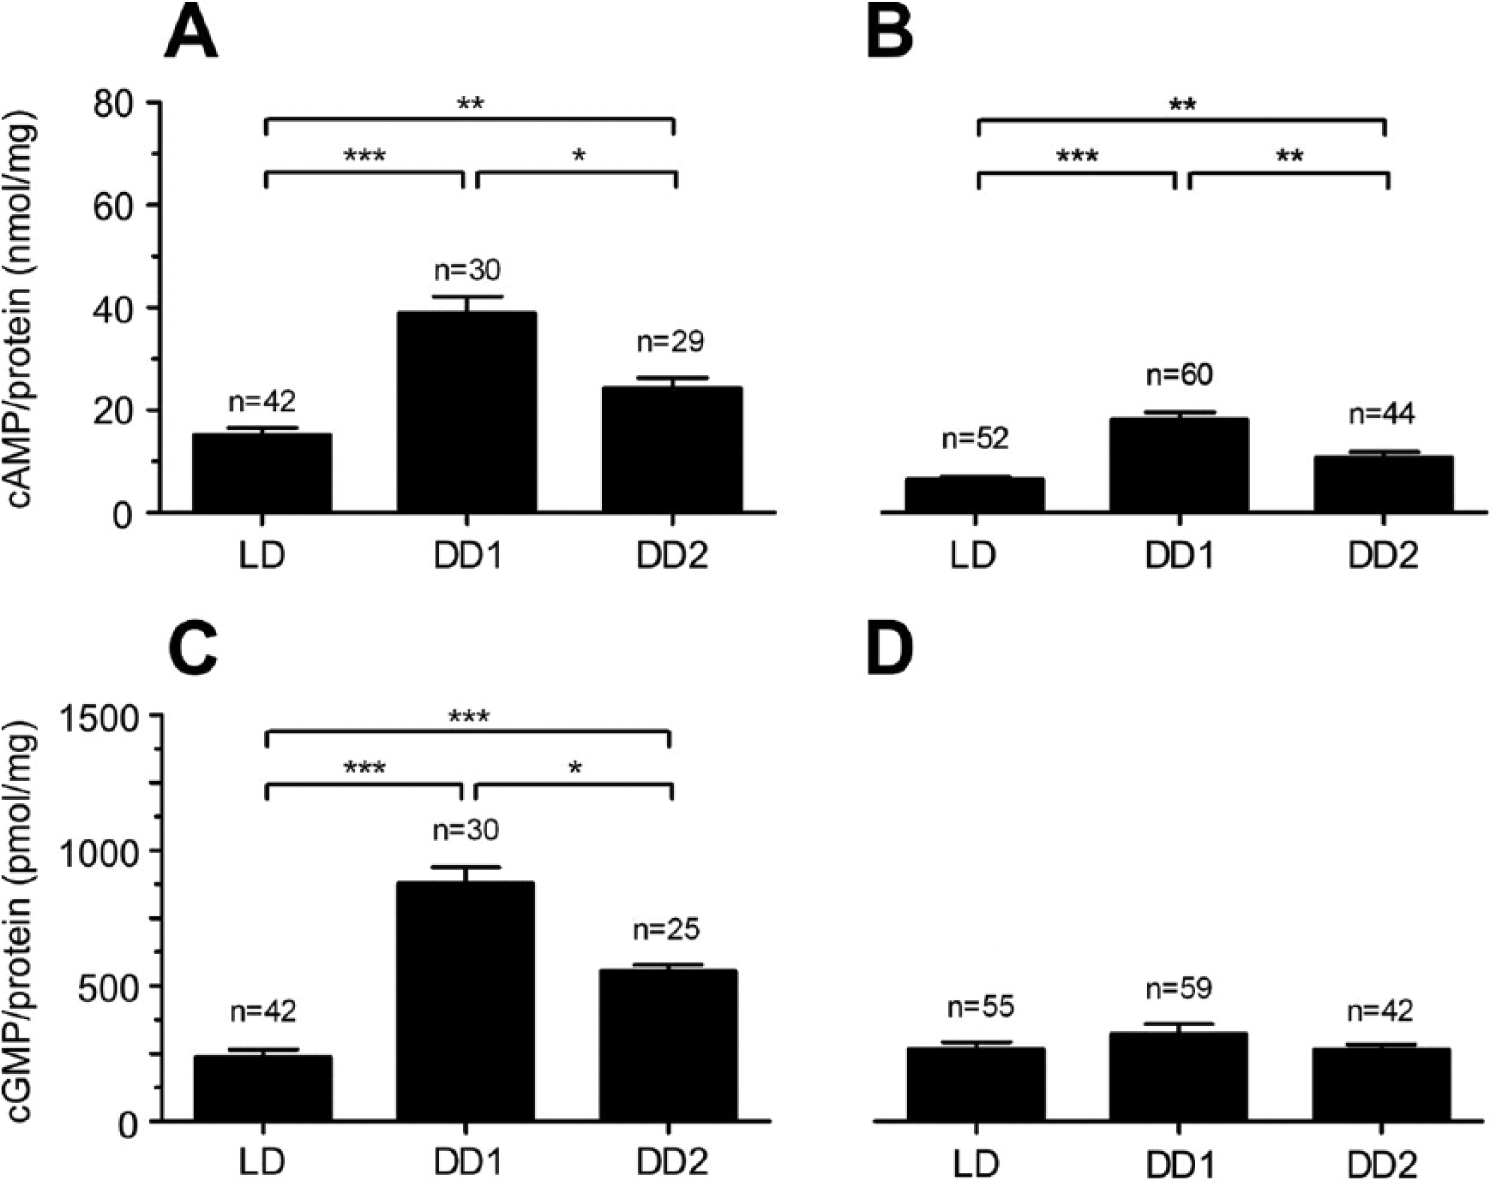
Transfer from LD 12:12 to constant conditions (DD1) increased cAMP and cGMP levels in accessory medullae (AMae; A,C), while in optic lobes (B,D) only cAMP levels increased. In contrast, in DD2 cyclic nucleotide levels declined again in AMae as well as in other optic lobe tissues (A-C) (Dunn’s post hoc test, ***p < 0.001). Data from Figures 2-5.
Injection of 8-br-cAMP Induced a Biphasic PRC with Phase Delays at the Late Subjective Day and Phase Advances at the End of the Subjective Night
Injections of 8-br-cAMP significantly phase-shifted circadian locomotor activity rhythms measured in running-wheel assays (Suppl. Table 3; Kruskal-Wallis test, p < 0.01). Between CT 7.5 (−1.52 hCT), CT 10.5 (−2.18 hCT), and CT 13.5 (−1.58 hCT) compared with CT 22.5 (2.01 hCT), significant phase shifts were obtained (Dunn’s post hoc test, p < 0.01). Moreover, CT 10.5 and 13.5 significantly differed from CT 1.5 (1.08 hCT). While maximal phase delays were induced at CT 10.5, maximal phase advances occurred at CT 22.5 after 8-br-cAMP injections (Fig. 7A). Saline-dependent phase shifts at all CTs did not differ significantly from each other (Kruskal-Wallis test, p > 0.05). Comparing 8-br-cAMP injections and saline injections revealed significant differences (Kruskal-Wallis test, p < 0.001). At CT 10.5, 8-br-cAMP induced significant phase delays and at CT 22.5 significant phase advances (Dunn’s post hoc test, p < 0.05; Fig. 7A1,A2).
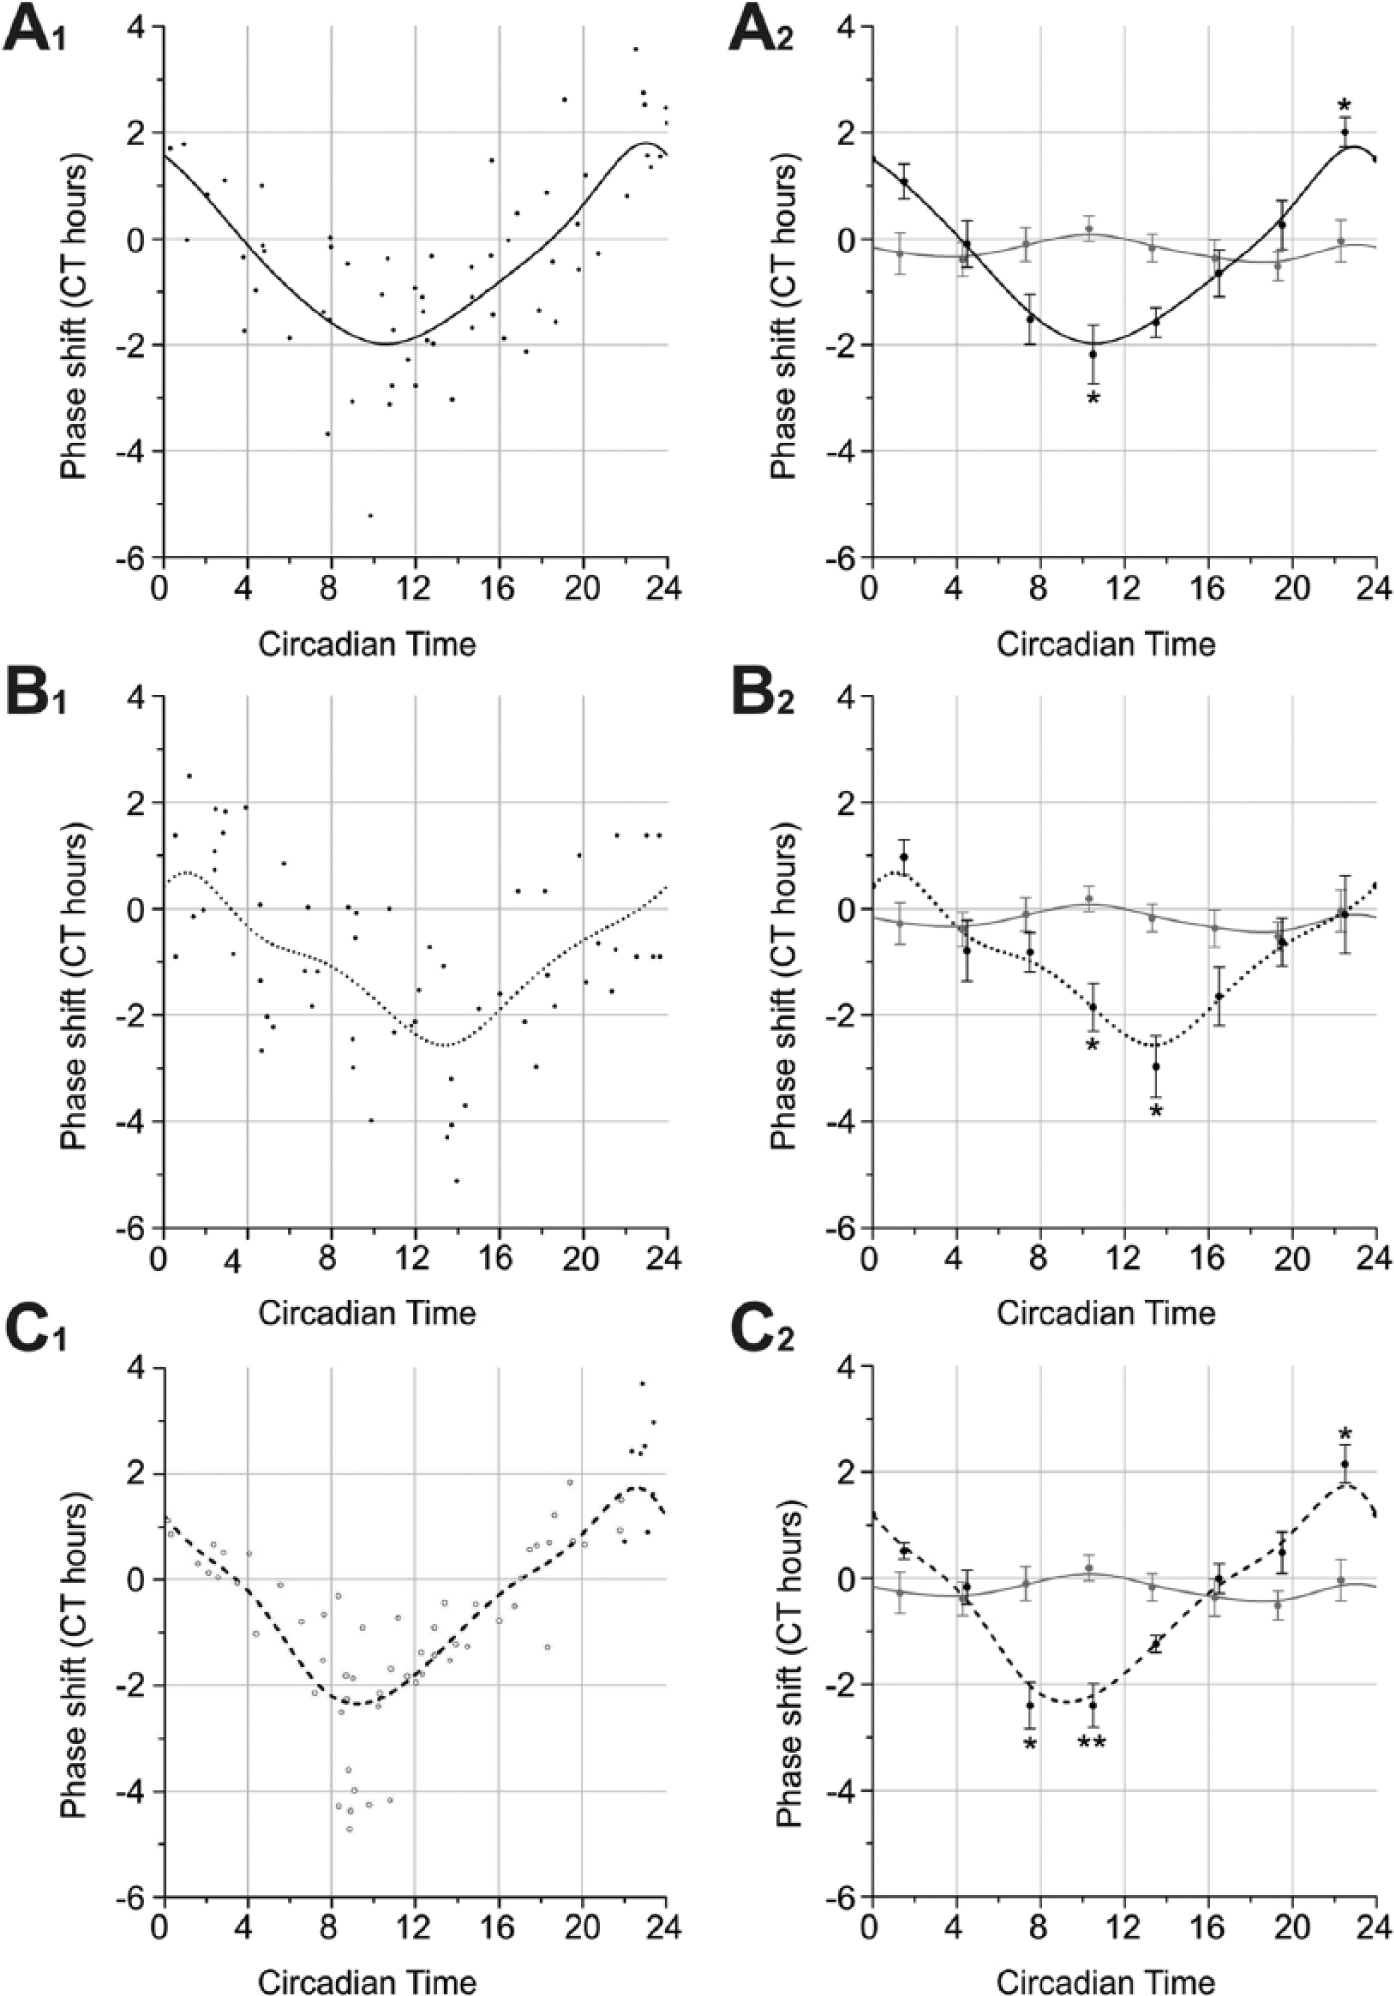
Phase response curves (PRCs) of 8-br-cAMP (black line, A1,A2), 8-br-cGMP (dotted line, B1,B2), and pigment-dispersing factor (PDF; dashed line, C1,C2) compared with insect saline injections (gray line, A2,B2,C2). Data presented as scatter plots and b-spline curves (A1,B1,C1) as well as 3-h merged bins (mean circadian hours ± SE; A2,B2,C2). 8-br-cAMP injection caused significant phase delays at CT 10.5 as well as significant phase advances at CT 22.5 compared with control injections (Dunn’s post hoc test, *p <0.05; asterisk, A2). 8-br-cGMP injection resulted in significant phase delays at CT 10.5 and CT 13.5 compared with control injections (Dunn’s post hoc test, *p < 0.05; asterisk, B2). Next to significant phase delays at the end of subjective night published in Petri and Stengl (1997) (open dots), Rhyparobia PDF induced significant phase advances at CT 22.5 (closed dots; Dunn’s post hoc test, *p < 0.05; asterisks, C2).
The 8-br-cAMP-Dependent Phase Shifts at the Late Subjective Day Were Dose-Dependent
Between CT 9 and 12, dose-dependent phase shifts were obtained with injections of 2 × 10⁻⁷ mol, 2 × 10⁻¹⁰ mol, 2 × 10⁻¹³ mol, and 2 × 10⁻¹⁶ mol 8-br-cAMP (Suppl. Table 4, Fig. 8A1). The 8-br-cAMP and saline injections differed significantly (Kruskal-Wallis test, p < 0.05). At a concentration of 2 × 10⁻¹³ mol, 8-br-cAMP phase delayed by −0.91 hCT, while injections of 2 × 10⁻¹⁶ mol 8-br-cAMP phase delayed by −0.09 hCT. Phase shifts induced by higher concentration of 8-br-cAMP such as 2 × 10⁻¹⁰ mol (−2.18 hCT) and 2 × 10⁻⁷ mol (−1.99 hCT) revealed significant differences compared with saline injections (Dunn’s post hoc test, p < 0.05, Fig. 8A1). Moreover, EC50 of 8-br-cAMP was 6.5 × 10⁻¹³ mol 8-br-cAMP (Fig. 8A2).
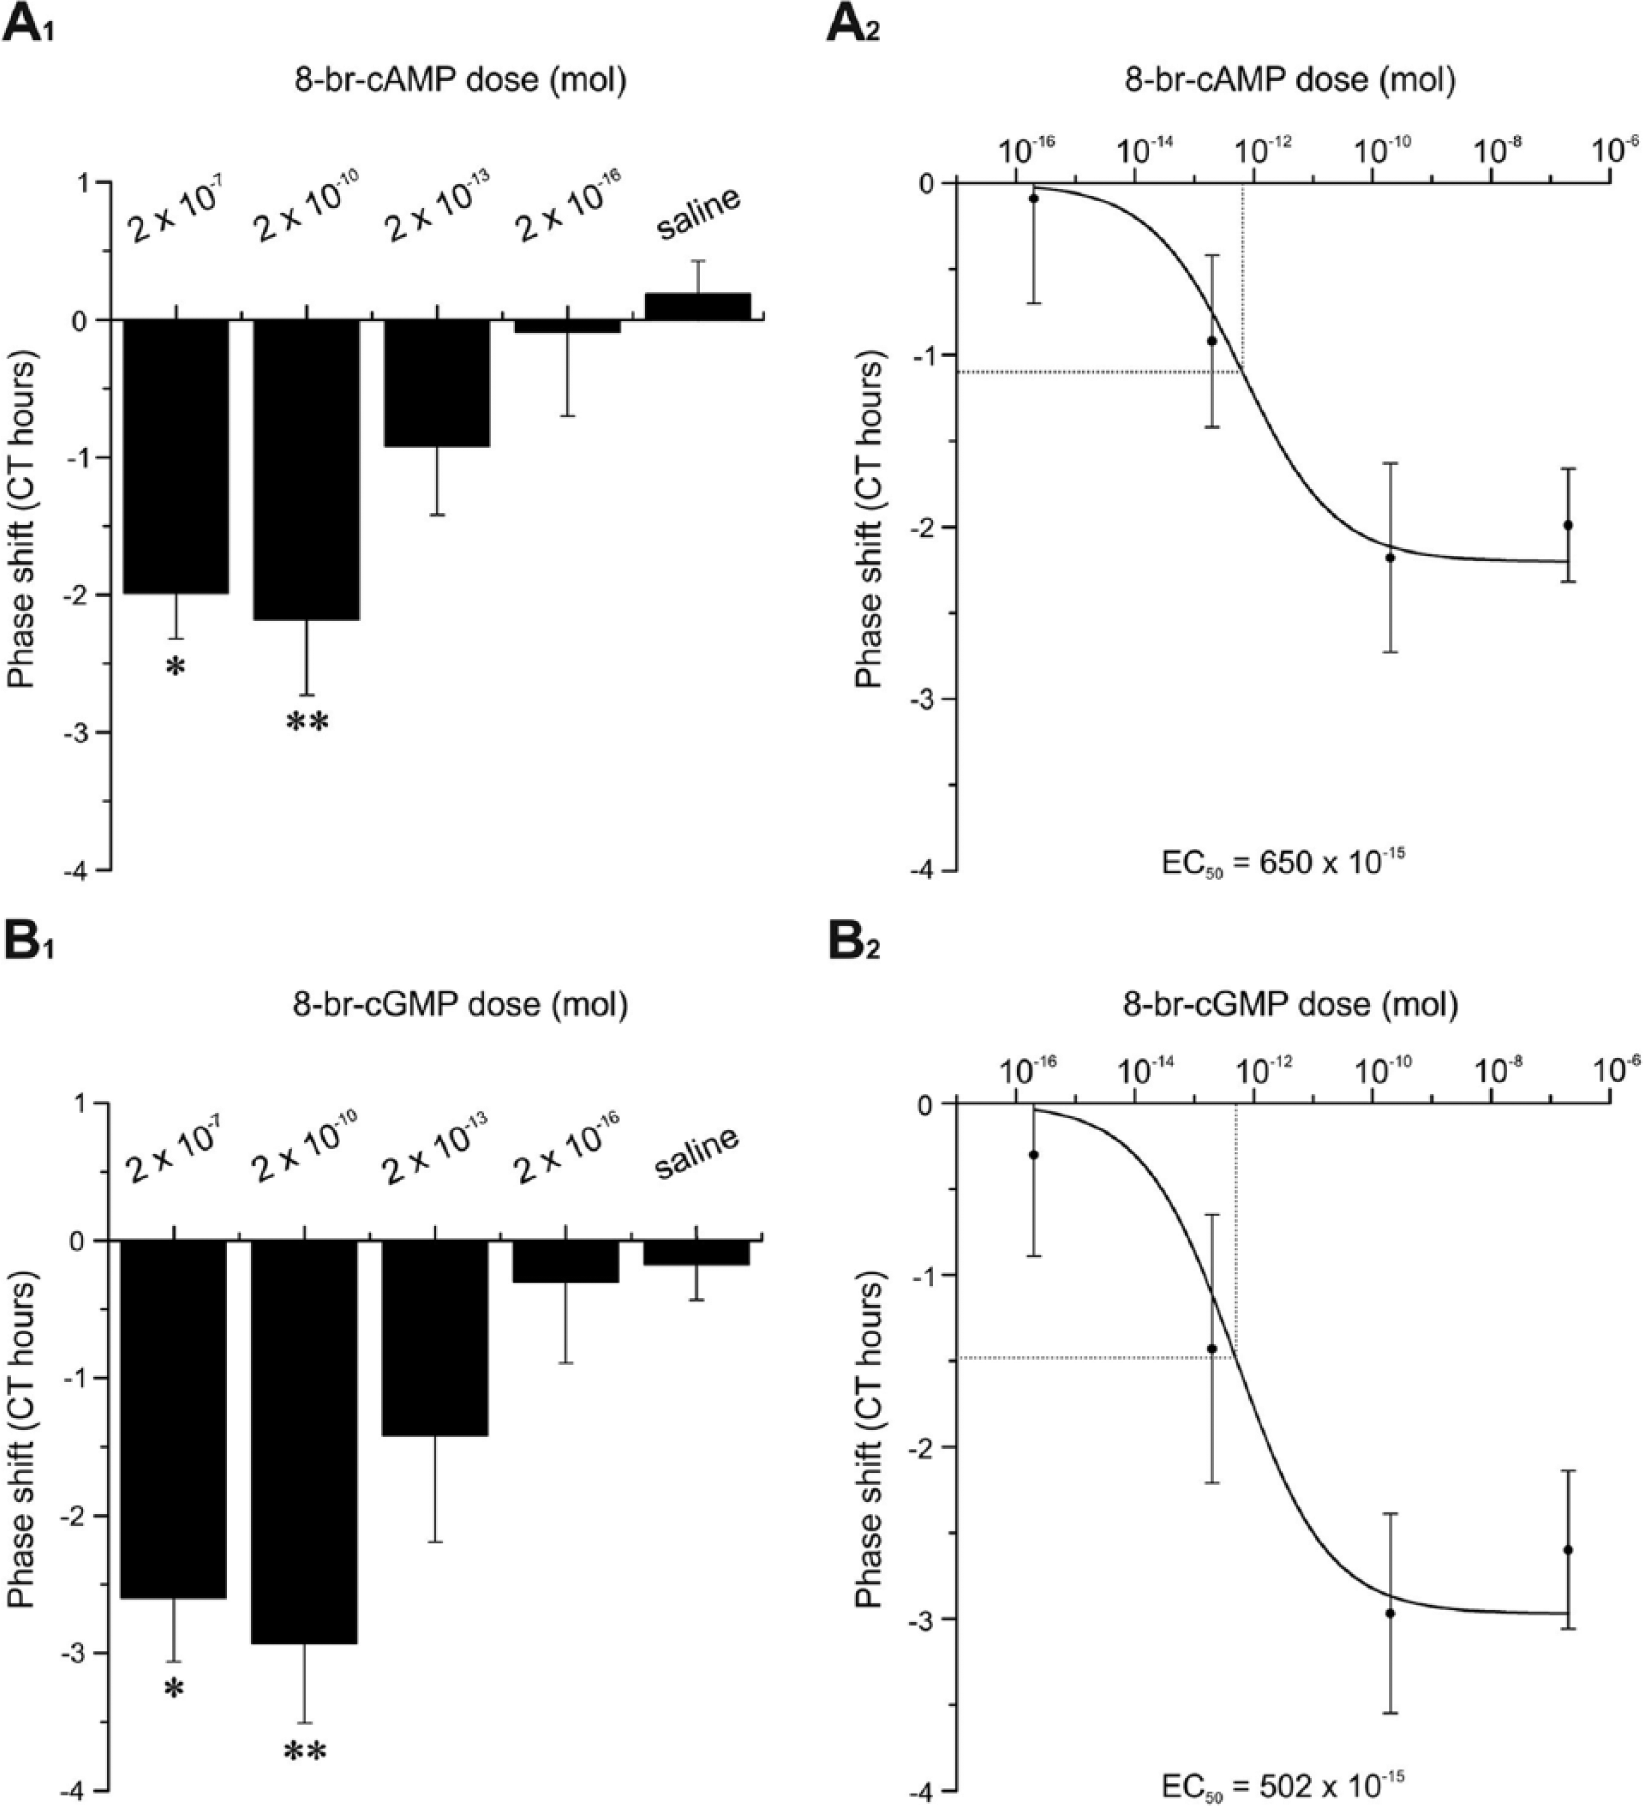
Injections of 8-br-cAMP into optic lobes of Madeira cockroaches dose-dependently phase delayed locomotor activity rhythms in running-wheel assays (A) between CT 9 and CT 12, comparable to 8-br-cGMP injections (B) between CT 12 and CT 15. Bars represent the mean phase shifts (in circadian hours ± SE). (A1) Injections of saline (n = 6), 2 × 10⁻¹⁶ mol (n = 4), 2 × 10⁻¹³ mol (n = 5), 2 × 10⁻¹⁰ mol (n = 8), and 2 × 10⁻⁷ mol 8-br-cAMP (n = 7). (B1) Injections of saline (n = 7), 2 × 10⁻¹⁶ mol (n = 3), 2 × 10⁻¹³ mol (n = 4), 2 × 10⁻¹⁰ mol (n = 8), and 2 × 10⁻⁷ mol 8-br-cGMP (n = 6). (A2, B2) Calculation of half maximal effective dose (EC50) for 8-br-cAMP (EC50 = 650 × 10−15 mol) as well as 8-br-cGMP (EC50 = 502 × 10−15 mol).
Injections of 8-br-cGMP Revealed a Monophasic All-Delay PRC with Maximum at the Late Subjective Day and Early Subjective Night
Significant differences between all CTs were observed after injections of 2 × 10⁻¹⁰ mol 8-br-cGMP (Suppl. Table 3; Kruskal-Wallis test, p < 0.01). Phase shifts between CT 1.5 (0.97 hCT) and CT 10.5 (−1.85 hCT) as well as between CT 1.5 and CT 13.5 (−2.97 hCT) were highly significantly different from each other (Dunn’s post hoc test, p < 0.01). Maximal phase delays of −2.97 hCT were induced at CT 13.5 (Fig. 7B). Highly significant differences were detected between 8-br-cGMP and saline injections (Kruskal-Wallis test, p < 0.01). At CT 10.5 and 13.5, significant phase delays were induced by 8-br-cGMP (Dunn’s post hoc test, p < 0.05; Fig. 7B2).
8-br-cGMP Injections Induced Dose-Dependent Delays at the Late Subjective Day/Early Subjective Night
Application of 8-br-cGMP at 4 different doses (2 × 10⁻⁷ mol, 2 × 10⁻¹⁰ mol, 2 × 10⁻¹³ mol, and 2 × 10⁻¹⁶ mol) produced dose-dependent phase delays between CT 12 and 15 (Suppl. Table 4; Kruskal-Wallis test, p < 0.05). With 2 × 10⁻¹³ mol 8-br-cGMP, phase delays of −1.43 hCT were obtained, while injections of 2 × 10⁻¹⁶ mol 8-br-cGMP revealed phase delays of −0.30 hCT. Highly significant differences were detected between phase shifts induced by 2 × 10⁻¹⁰ mol and 2 × 10⁻⁷ mol 8-br-cGMP and those induced by saline (Fig. 8A1; Dunn’s post hoc test, p < 0.05). The resulting EC50 of 8-br-cGMP was 5.0 × 10⁻¹³ mol (Suppl. Table 4, Fig. 8A2).
Injection of Rhyparobia PDF Induced a Biphasic PRC with Phase Delays at Dusk and Phase Advances at Dawn
Along with significant phase delays at the end of the subjective day (Petri and Stengl, 1997), now for the first time significant phase advances of up to 3.70 hCT were obtained at CT 22.5 compared with control injections (Dunn’s post hoc test, p < 0.05; Fig. 7C, Suppl. Table 3).
All Tested Substances Did Not Affect the Period Length of the Circadian Locomotor Activity
In all groups examined, no significant differences of the period of circadian locomotor activity rhythms were detected after injections of 8-br-cAMP, 8-br-cGMP, Rhyparobia PDF, and saline (Mann-Whitney U test, p > 0.05). Before 8-br-cAMP injections the average period length was 23.53 h, and after injections it was 23.54 h. An average period length of 23.50 h was determined before 8-br-cGMP injections and 23.59 h after the injections. Also, Rhyparobia PDF did not affect these parameters. The period length was 23.23 h before and 23.31 h after injection. The chi-square periodogram analysis of controls before saline injections was 23.58 h and 23.65 h after saline injections (Suppl. Table 5).
Discussion
With ELISAs it was examined whether the neuropeptide PDF, the major circadian coupling factor in the fruit fly as well as in the Madeira cockroach (Helfrich-Förster and Homberg, 1993; Stengl and Homberg, 1994; Helfrich-Förster et al., 1998), signals via cAMP elevations in the AMe, the cockroach’s circadian clock, and in the optic lobes as the clock’s prominent input and output region (Reischig and Stengl, 2003b). Rhythmic maxima in cyclic nucleotide levels were presumed to be indicative of maxima in neurotransmitter or neuropeptide release of the circadian pacemaker network.
Consistent with findings in the fruit fly (Shafer et al., 2008; Duvall and Taghert, 2012; Duvall and Taghert, 2013), application of Rhyparobia PDF increased cAMP but not cGMP levels. Similar to the mammalian circadian clock, the AMe expressed maxima in cAMP and cGMP concentrations at ZT 12 (dusk) and ZT 24 (dawn) (Prosser and Gillette, 1991), suggestive of light-dependent neuropeptide release via 2 synchronized populations of circadian pacemaker circuits, the evening (E) and morning (M) oscillators, coupled at 12-h phase difference. The rhythms were lost at DD1 apparently due to disrupted homeostasis between inputs and endogenous rhythms. Since cAMP levels significantly increased at DD1 and DD2 compared with LD in both tissues investigated, light appeared to suppress AC activity. At DD2, a bimodal oscillation in cAMP concentration with peaks at dusk and dawn returned both in the AMe and in other optic lobe neuropils, resembling the rhythm observed in the AMe in LD conditions. The presence of 2 coupled endogenous circadian oscillator networks could account for this finding. Most likely these oscillator networks are located in the AMe, the circadian pacemaker that controls circadian locomotor activity (Stengl and Homberg, 1994; Reischig and Stengl, 2003a). However, it cannot be excluded that additional oscillators located in other areas of the brain are also involved in the generation of these rhythms (Helfrich-Förster, 2009).
In LD, maxima of cGMP concentrations were found in the optic lobes at dusk apparently depending on photic stimuli. In DD1 and to a lesser extent also in DD2, cGMP levels were constant and elevated as expected for mostly inhibitory photic input into the clock (Eskin et al., 1984). In optic lobe neuropils, a cGMP peak at dusk was dampened out at DD2 indicating that it resulted from photic input and not from endogenous clocks. We hypothesize that cGMP concentration changes in the clock are mostly controlled via photic inputs delaying locomotor activity rhythms at dusk. In contrast, cAMP levels appeared to be light- and clock-controlled signals that might be mediated via light-dependent PDF release at dusk and dawn.
PDF Neurons Serve Different Functions in the Circadian Clock
In the Madeira cockroach, about 12 PDF-immunoreactive neurons are located anterior to the AMe (aPDFMes) and about 3 to 6 large cells are located more posteriorly (pPDFMes). In addition, 2 larger PDF-ir cell groups are located dorsally and ventrally to the lamina (PDFLas) in the optic lobes (Petri et al., 1995; Reischig and Stengl, 2003b). Mostly the 12 aPDFMes were intensely investigated. The largest aPDFMe appears to connect all targets of PDF cells in the brain and optic lobes via the anterior and posterior optic commissure as a possible circadian coupling pathway (Reischig et al., 2004; Wei et al., 2010; Soehler et al., 2011). Together with 3 medium-sized aPDFMe that colocalize PDF, orcokinin, and FMRFamide immunoreactivity, it directly connects both AMae with each other (Hofer and Homberg, 2006; Soehler et al., 2011). Since they are affected distinctly by short and long photoperiods, the different PDF-dependent input pathways into the clock are assumed to specifically synchronize different groups of pacemakers of the bilaterally symmetric pacemaker centers in response to light (Wei and Stengl, 2011). In addition, they are assumed to gate outputs of the clock to locomotor control centers via ensemble formation (Schneider and Stengl, 2005). Furthermore, since PDFMes and PDFLas connect the AMe with the medulla and lamina, the optic lobes appear to be both input and output regions of the circadian clock. Therefore, PDF appears to be the major coupling factor of the circadian clock in the Madeira cockroach, which is expected to be released in a circadian rhythm comparable to PDF in Drosophila melanogaster (Helfrich-Förster 2014).
PDF Signals via AC Activation
Experiments in D. melanogaster demonstrated PDF-dependent increases in intracellular cAMP levels in most circadian pacemaker neurons via activation of different ACs and an increase of intracellular calcium in a subset of clock neurons (Shafer et al., 2008; Duvall and Taghert, 2012; Duvall and Taghert, 2013; Seluzicki et al., 2014). Also in the Madeira cockroach, calcium imaging experiments showed that PDF can modulate intracellular calcium levels of circadian pacemaker neurons mostly via activation of AC (Wei et al., forthcoming). Since incubation of optic lobe tissue with Rhyparobia PDF resulted in an elevation of cAMP, these findings provide further evidence for PDF-dependent AC activation most likely via Gαs. In accordance, the PDF-receptor of D. melanogaster is a class II G-protein coupled receptor that activates AC (Hyun et al., 2005; Lear et al., 2005). Furthermore, in both the Madeira cockroach and the fruit fly, a Gαs independent signaling pathway is assumed. This is further supported by the resemblance of the PDF receptor to the VPAC-2 receptor of VIP, which couples to both AC and phospholipase Cβ (Meyer-Spasche and Piggins, 2004; Dickson and Finlayson, 2009; An et al., 2011; Agrawal et al., 2013; Wei et al., forthcoming).
However, since cAMP and cGMP elevations do not change in synchrony with the same phase, neither in the AMe nor in other optic lobe neuropils under DD, it is likely that cGMP levels depend on additional excitatory photic inputs. Accordingly, accumulation of cGMP concentrations was obtained after exposure to light in the eyes of the mollusk Aplysia (Eskin et al., 1984). It was assumed that light-dependent excitatory neurotransmitters such as acetylcholine or other neuropeptides and neurotransmitters result in activation of guanylyl cyclases (Prosser et al., 1989). Therefore, receptor-type guanylyl cyclases or intracellular calcium levels might be affected, which activated calcium-sensitive nitric oxide synthase resulting in increased nitric oxide–sensitive guanylyl cyclase activity. A candidate for such a neuropeptide is Rhyparobia MIP-1, since injections resulted in an all-delay PRC resembling the cGMP-dependent PRC (Schulze et al., 2013). To test whether acetylcholine affects the circadian locomotor activity in cGMP-dependent manner, injection experiments need to be performed.
PDF Appears to Be Released by Morning and Evening Oscillators in the Circadian Pacemaker Center of the Madeira Cockroach
The morning (M) and evening (E) dual oscillator model is a very useful concept (Aschoff, 1966; Pittendrigh and Daan, 1976) that can explain adaptations to different photoperiods as well as internal desynchronization into 2 free-running activity components with long or short period (Grima et al., 2004; Stoleru et al., 2004; Inagaki et al., 2007; Naito et al., 2008; Helfrich-Förster, 2009). The M oscillator couples to dawn and is advanced (accelerated) by light resulting in a shorter period, while the E oscillator with a longer period is delayed (decelerated) by light and synchronizes to dusk. In the fruit fly, the M oscillator but not the E oscillator is assumed to consist of PDF-releasing neurons of the AMe (Yoshii et al., 2009; Peschel and Helfrich-Förster, 2011), whereas in the cockroach, the cellular and molecular natures of M and E oscillators are not known. However, because 2 maxima of cAMP concentrations were observed, dual oscillator circuits also might be present in the Madeira cockroach. Thus, the first cAMP peak at CT 12 seems to be associated with an E oscillator and the second peak at CT 24 with an M oscillator circuit. In agreement with the assumption of 2 oscillator circuits controlling PDF release is our finding of the resemblance of the cAMP-dependent PRC and the Rhyparobia PDF–dependent PRC (Petri and Stengl, 1997). Thus, we hypothesize that circadian pacemaker neurons, which form phase-coupled ensembles (Schneider and Stengl, 2005), are recruited as either M or E oscillators via PDF as the major coupling factor that is released via photic inputs at dusk and dawn. It needs to be examined further whether additional neuropeptides and neurotransmitters are also involved.
Consistent with the assumption of light-controlled PDF neurons, photoperiod-dependent changes in the number of medium-sized and posterior PDFMes were observed (Wei and Stengl, 2011). Thus, light appears to affect the expression of PDF in the aPDFMes, making them ideal candidates for adjustment to annual changes in photoperiods (Wei and Stengl, 2011). Furthermore, in agreement with this hypothesis, light controls cyclic nucleotide concentrations, decreasing them in LD. Possibly, the strong inhibitory input into the AMe during the day is a light-dependent gain control mechanism preventing light-dependent overstimulation. A good candidate for light-dependent inhibition is the neurotransmitter γ-aminobutyric acid (GABA). The GABAergic distal tract connects the AMe to the ipsilateral medulla and lamina and could function either as entrainment pathway (Petri et al., 2002 ; Schendzielorz and Stengl, 2014) or as gain control mechanism keeping light-dependent circuits in their response range. Furthermore, metabotropic GABA receptors (GABAB) couple to Gi proteins, which reduce AC activity (Hamasaka et al., 2005b).
Whether the same or different PDFMes can be inhibited and/or excited by light, depending on the internal state of the cells and additional environmental signals, is not known but is likely. Thus, it is not surprising that we found evidence that PDF can both be excitatory or inhibitory for AMe pacemakers (Wei et al., forthcoming). Current experiments examine whether input-dependent activation of circadian pacemaker neurons results in phase advances and short periods and whether inhibitions result in delays and longer periods in the circadian clock of the Madeira cockroach.
Footnotes
Acknowledgements
We thank Petra Gawalek for critical reading and discussion of the manuscript. This work was supported by the Deutsche Forschungsgemeinschaft (STE531/18-2 to M.S.).
Conflict of Interest Statement
The authors have no potential conflicts of interest with respect to the research, authorship, and/or publication of this article.
Notes
References
Supplementary Material
Please find the following supplemental material available below.
For Open Access articles published under a Creative Commons License, all supplemental material carries the same license as the article it is associated with.
For non-Open Access articles published, all supplemental material carries a non-exclusive license, and permission requests for re-use of supplemental material or any part of supplemental material shall be sent directly to the copyright owner as specified in the copyright notice associated with the article.