
Abstract
Caffeine promotes wakefulness during night shift work, although it also disturbs subsequent daytime sleep. Increased alertness by caffeine is associated with a higher core body temperature (CBT). A lower CBT and a narrow distal-to-proximal skin temperature gradient (DPG) have been reported to be associated with improved sleep, yet whether caffeine influences the DPG is unknown. We tested the hypothesis that the use caffeine during nighttime total sleep deprivation would reduce the DPG, increase CBT and alertness, and disturb subsequent daytime recovery sleep. We also expected that a greater widening of the DPG prior to sleep would be associated with a greater degree of sleep disturbance. Thirty healthy adults (9 females) aged 21.6 ± 3.5 years participated in a double-blind, 28-h modified constant routine protocol. At 23 h of wakefulness, participants in the treatment condition (n = 10) were given 2.9 mg/kg caffeine, equivalent to ~200 mg (or 2 espressos) for a 70-kg adult, 5 h before a daytime recovery sleep episode. Throughout the protocol, core and skin body temperatures, DPG, sleep architecture, and subjective alertness and mood were measured. Prior to sleep, caffeine significantly widened the DPG and increased CBT, alertness, and clear-headedness (p < 0.05). Caffeine also disturbed daytime recovery sleep (p < 0.05). Increased CBT and a wider DPG prior to sleep were associated with a longer latency to sleep, and a wider DPG was associated with disturbed recovery sleep (i.e., increased wakefulness after sleep onset, increased stage 1 sleep, decreased sleep efficiency, and decreased slow wave sleep) (p < 0.05). A widening of the DPG following nighttime caffeine may represent a component of the integrated physiological response by which caffeine improves alertness and disturbs subsequent daytime recovery sleep. Furthermore, our findings highlight that sleep disturbances associated with caffeine consumed near the circadian trough of alertness are still present when daytime recovery sleep occurs 5 h or approximately 1 half-life later.
Sleep, circadian, and thermoregulatory systems are highly integrated. Associations between the circadian core body temperature (CBT) rhythm and circadian rhythms in performance and sleep propensity have long been acknowledged (Kleitman and Jackson, 1950; Czeisler et al., 1980; Wright et al., 2002). Humans typically initiate sleep on the descending limb of the circadian CBT rhythm and subsequently initiate wakefulness on the rising limb of the circadian CBT rhythm (Czeisler et al., 1980; Zulley et al., 1981; Campbell and Broughton, 1994; Kräuchi and Wirz-Justice, 2001). Additionally, during circadian desynchrony, sleep propensity is strongest when CBT is maximally declining and near its circadian low (Campbell and Broughton, 1994; Dijk and Czeisler, 1994). Findings from the literature suggest that the circadian decline in CBT is in part the result of heat loss via the periphery (Smolander et al., 1993; Kräuchi et al., 2000). The distal-to-proximal skin temperature gradient (DPG) is an indirect measurement of heat loss where temperature at distal skin sites (e.g., hands or feet) is subtracted from temperature at proximal skin sites (e.g., subclavicular area, head, or stomach). Proximal skin temperature is located near the core of the body and is thus typically warmer than distal skin temperature. A larger difference between proximal and distal skin temperature is described as a wider DPG, whereas when distal skin temperature warms and becomes closer to proximal skin temperature, the DPG is described as more narrow. Narrowing of the DPG is associated with peripheral vasodilation that allows increased blood flow to distal skin sites, promoting heat loss by way of cutaneous vascular structures (i.e., arteriovenous anastomoses and capillaries) (Krogstad et al., 1995). The DPG shows a circadian rhythm such that prior to habitual sleep time the DPG narrows, whereas prior to habitual wake time the DPG widens (Smolander et al., 1993; Kräuchi and Wirz-Justice, 1994; Kräuchi et al., 1997). The change in DPG is reported to be a better predictor for sleep onset latency (SOL) than is melatonin onset, subjective sleepiness rating, or rate of CBT decline (Kräuchi et al., 1999; Kräuchi et al., 2000). Furthermore, manipulation of skin temperature leads to changes in alertness and sleep (Raymann et al., 2005; Raymann and Van Someren, 2007; Raymann et al., 2008).
Both the circadian rhythm in sleep propensity and the homeostatic pressure for sleep are modifiable by behavior and exogenous stimuli (Wyatt et al., 2004). One such stimulus, caffeine, is among the most widely used drugs in the world. Caffeine affects sleep and wakefulness, to a large extent, by binding to adenosine receptors altering central and peripheral physiology (Porkka-Heiskanen and Kalinchuk, 2011). Many occupations require individuals to maintain long hours of wakefulness and work at night when the circadian clock promotes sleep. Therefore, caffeine is often used as a countermeasure to improve performance and reduce fatigue under such conditions of circadian misalignment (Roehrs and Roth, 2008; Wright et al., 1997a). Caffeine also increases CBT and attenuates its circadian decline (Wright et al., 1997b; Wright et al., 2000). One mechanism by which caffeine increases CBT is via vasoconstriction and decreased blood flow to the periphery (Pincomb et al., 1985; Hartley et al., 2004; Umemura et al., 2006), an action that may widen the DPG and influence sleep. Findings from studies investigating effects of caffeine administered prior to a daytime recovery sleep episode show decreases in stage 2 sleep, slow wave sleep (SWS; stages 3 and 4 combined), total sleep time (TST), and rapid eye movement (REM) sleep, along with increases in SOL, wakefulness after sleep onset (WASO), and the percentage of time spent in stage 1 sleep (LaJambe et al., 2005; Carrier et al., 2007; Carrier et al., 2009). This disturbed daytime recovery sleep architecture from caffeine is observed even though homeostatic pressure for sleep is high, as the circadian drive for wakefulness is also high (Czeisler and Gooley, 2007). In the latter caffeine studies, drug was administered 1 to 3 h prior to the daytime recovery sleep episode. It is unknown whether caffeine taken approximately 1 half-life prior to a daytime recovery sleep opportunity still disturbs sleep, and this was therefore examined in the current study.
It is also unknown whether caffeine influences the DPG, yet if it does, changes in skin temperature may represent a component of the integrative physiological response by which caffeine increases alertness and disturbs sleep. We hypothesized that caffeine administration during circadian misalignment and sleep deprivation, as common in night shift work, would widen the DPG, increase CBT, improve alertness and mood, and disturb subsequent daytime recovery sleep. We also hypothesized that a greater widening of the DPG prior to sleep onset would be significantly correlated with a greater degree of sleep disturbance during daytime recovery sleep.
Materials and Methods
Participants
Thirty healthy participants (9 females) aged 18 to 33 years (mean ± SD, 21.6 ± 3.5 years), with body mass index (BMI) between 18.5 and 27 kg/m2 (22.45 ± 2.13 kg/m2) and with self-reported habitual low to moderate caffeine use (>0 and <500 mg/day), took part. The control condition consisted of 20 healthy participants (5 females) aged 18 to 33 years (21.5 ± 3.9 years), with BMI between 18.5 and 26.4 kg/m2 (22.67 ± 2.14 kg/m2). The caffeine condition consisted of 10 healthy participants (4 female) aged 18 and 26 years (21.8 ± 2.7 years) with BMI between 19.8 and 27 kg/m2 (22.18 ± 2.17 kg/m2), values similar to those of the control group (p > 0.55). Exclusion criteria included current smoker, drug use, pregnancy, habitual sleep duration <7 h or >9 h, and any known medical, psychiatric, or sleep disorder. Participants were deemed healthy based on physical examination, interview, psychological tests, blood chemistries (complete blood cell count and comprehensive metabolic panel), clinical electrocardiogram, and medication-free status. None of the participants reported regular night work in the preceding year or crossing more than 1 time zone in the previous 3 weeks. Health screening tests were conducted at the Clinical Translational Research Center (CTRC) of the University of Colorado Boulder. Participants were asked to maintain a self-selected sleep schedule of ~8 h per night for 1 week prior to admission to the laboratory, verified by sleep-wakefulness logs, call-in bed and wake times to a time-stamped voice-mailbox recorder, and wrist activity with light exposure recordings (Actiwatch-L, Mini Mitter Respironics, Bend, Oregon). Participants refrained from drugs (including caffeine and nicotine) for 2 weeks and from alcohol for 2 days prior to the laboratory session and throughout the protocol. Drug use was determined by self-report and verified by urine toxicology at screening and by urine toxicology and a breath alcohol tester (Lifeloc Technologies Model FC10, Wheat Ridge, Colorado) upon laboratory admission. Participants gave written informed consent, and the scientific advisory and review committee of the Colorado Clinical and Translational Sciences Institute and the institutional review board approved the research protocol.
Procedure
Participants lived in the Sleep and Chronobiology Laboratory at the University of Colorado Boulder for ~3.7 days in a sound-attenuated, temperature-controlled, sleep and chronobiology suite that was an environment free from time cues. Data presented in the current report are from the first 2 days of a larger study, of which portions have been published (Burke et al., 2013). Participants were admitted to the laboratory ~4 h prior to their habitual bedtime. Females, 6 of whom were free of oral contraceptives (4 studied in follicular phase and 2 in luteal phase) and 3 of whom used oral contraceptives (2 in pseudo-follicular phase and 1 in pseudoluteal phase), were administered a pregnancy test to verify they were not pregnant. Polysomnography (PSG) was used to record an 8-h baseline nighttime sleep episode at the participants’ habitual bedtime. Following the baseline night, participants were tested using a 28-h modified constant routine protocol. Room temperature was maintained in the thermoneutral range (22-24 °C), and lighting was maintained at dim ~1.9 lux (~0.6 W/m2) levels in the angle of gaze during scheduled wakefulness and 0 lux during scheduled sleep. During scheduled wakefulness of the constant routine, participants maintained a semi-recumbent seated posture in a hospital bed with the head raised to ~35 degrees, except for brief scheduled bathroom breaks (a commode <0.5 m from the bed). After the first 16 h of the constant routine, participants remained semi-recumbent and were provided urinals/bedpans when needed. During wakefulness, participants wore a light-fitting t-shirt and kept the bed sheet at waist level to maintain consistent microclimates of skin temperature recording sites. Participants received scheduled isocaloric meals every hour and completed a series of visual analog scales (VAS) every 2 hours until ~27 h and 26 h of scheduled wakefulness, respectively. Outside of the scheduled tests, participants had free time to engage in sedentary activities (e.g., read, watch movies, talk or play board games with a researcher, etc.). Wakefulness during constant routines was verified by continuous monitoring by research staff in the research suite and by continuous electroencephalography (EEG) recordings. Participants were informed they could receive pills that contained 5 mg of melatonin, 2.9 mg/kg of caffeine, or rice powder placebo. Participants who received melatonin did so later in the protocol after the timing of the data presented in the current analyses, and thus their data are included in the control condition. The CTRC pharmacist maintained double-blind conditions. Caffeine was administered double-blind at 23 h of wakefulness, and at 28 h of wakefulness participants were lowered to a supine position for a 5-h daytime recovery sleep episode in darkness (Fig. 1).
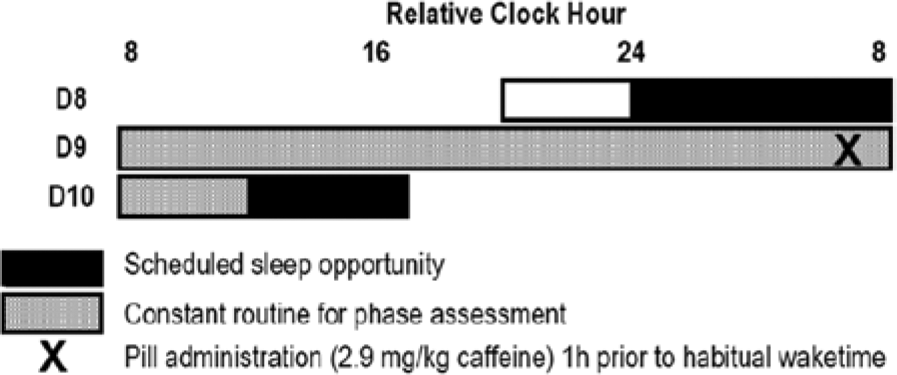
Diagram of the laboratory protocol. Procedures were scheduled according to each subject’s habitual sleep and wake times. Gray shaded areas indicate the modified constant routine protocol, and black shaded areas indicate sleep opportunities. Caffeine administration is denoted with an X at 23 h awake. The diagram shows an example protocol for a subject with a 0800 h habitual wake time. For the first 7 days of the study, subjects maintained consistent wakefulness-sleep schedules at home; days 8 to 10 were spent in the laboratory.
Materials
Temperature recordings
Skin temperatures were recorded every minute (iButton, Maxim, Sunnyvale, California, or Vital Sense, Mini Mitter Respironics) from the dorsal nonglabrous portion of the foot and subclavian regions (van Marken Lichtenbelt et al., 2006). The DPG was calculated as the difference between the distal foot (TFd) and the proximal subclavian region (Tsub). iButton temperature sensors were taped to the skin surface using hypoallergenic surgical tape (Durapore, 3M, St. Paul, Minnesota). Core temperature was sampled every minute with an ingested core temperature capsule (Vital Sense, Mini Mitter Respironics).
Polysomnography recordings
PSG recordings were obtained with Siesta digital sleep recorders (Compumedics USA Ltd, Charlotte, North Carolina) from C3-A2, C4-A1, O1-A2, F3-A2, right and left electrooculogram (EOG), chin electromyogram (EMG), and electrocardiogram (ECG). Sleep was manually scored in 30-sec epochs according to standard guidelines from brain region C3-A2 (Rechtschaffen and Kales, 1968) or C4-A1 if C3-A2 contained artifact. Sleep onset latency was defined in 2 ways: (1) SOL, time from lights out to the onset of 3 continuous epochs of PSG defined sleep, and (2) the latency to persistent sleep (LPS), time from lights out to the onset of 10 continuous minutes of PSG defined sleep. We also calculated the latency to SWS (SWSL) and REM sleep (REML) from SOL.
Alertness and mood ratings
Participants’ alertness and mood during sleep deprivation and after caffeine administration were assessed using VAS. Of the 17 VAS items measured, we chose to analyze alertness, clear-headedness, relaxed, and sadness, as we have found that these items show high correlation with other VAS items during sleep deprivation (unpublished results).
Data Analysis
Skin temperature and CBT measurements were analyzed starting 2 h prior to pill administration and continued throughout the 5-h sleep episode. Individual TFd and TSub were averaged into 10-min bins, and DPG (TFd – TSub) was calculated. CBT was also averaged into 10-min bins and analyzed as deviation from pre-pill baseline to control for individual differences in CBT level. CBT levels at baseline were 36.72 °C in the control and 36.61 °C in the caffeine conditions (p = 0.14). Effects of caffeine on DPG, CBT, TFd, TSub, and VAS were analyzed using mixed-model analysis of variance (ANOVA) with condition and time as fixed factors. Modified Bonferroni correction factors were used to correct for multiple planned comparisons performed using independent t tests and to reduce type 1 error (Keppel, 1991). One subject in the caffeine condition had missing data for the TSub and CBT and was therefore excluded from those analyses. The first 5 h of each sleep episode were analyzed using repeated-measures ANOVA with dependent or independent t tests, as appropriate, for planned comparisons to examine the effects of condition (control, caffeine), sleep episode (baseline, recovery sleep), and the interaction between condition and sleep episode for percent and minutes stage 1 sleep, stage 2 sleep, SWS, REM sleep, minutes SOL, LPS, WASO, SWSL, REML, and number and duration of awakenings that lasted 1 or more epochs.
Pearson correlation coefficients were used to examine associations between changes in the DPG and in the CBT (change in average temperature level for baseline 1 h prior to pill administration to the average temperature level for the 1 h immediately prior to the recovery sleep episode) with percent stage 1, stage 2, SWS, REM sleep, and minutes WASO, SOL and LPS for the recovery sleep episode. Associations were also examined for average DPG and CBT levels during the sleep episode and sleep measures. Correlations were first computed for the total number of subjects irrespective of condition and then individually for each condition. Sleep and temperature analyses were performed with Statistica, version 10.0 (StatSoft Inc, Tulsa, Oklahoma), and correlation analyses were performed with Origin Pro 9 (OriginLab Corp, Northampton, Massachusetts). Two subjects, 1 in the caffeine condition and 1 in the control condition, had missing data for the TFd, TSub, and CBT for the hour immediately prior to the sleep episode and were therefore excluded from the correlation analyses. During the sleep episode, 2 subjects in the caffeine condition and 1 in the control condition had missing data for the DPG and the CBT. One subject showed a sleep efficiency (SE) of less than 30% in the caffeine condition during the daytime recovery sleep episode and was identified as an extreme (interquartile range * 3) outlier. Therefore, the data from this subject were omitted from the analysis of sleep architecture during the recovery episode and correlation analyses. When this individual’s data are included in the analyses, effects of caffeine on the reported sleep findings are even larger.
Results
Effects of Caffeine on Alertness and Mood Ratings during Sleep Deprivation
Significant main effects of time for 3 of the 4 VAS items were observed with significantly lower alertness (p < 0.001), less clear-headedness (p < 0.001), and more sadness (p < 0.001) across sleep deprivation (Fig. 2, A-C). A significant interaction of condition by time was also observed for alertness (p < 0.05) (Fig. 2A). Planned comparisons revealed higher clear-headedness and lower sadness 17 h prior to caffeine administration (Fig. 2B and 2C) and higher clear-headedness and alertness reported by participants in the caffeine condition 1 h after caffeine administration (Fig. 2A and 2B).
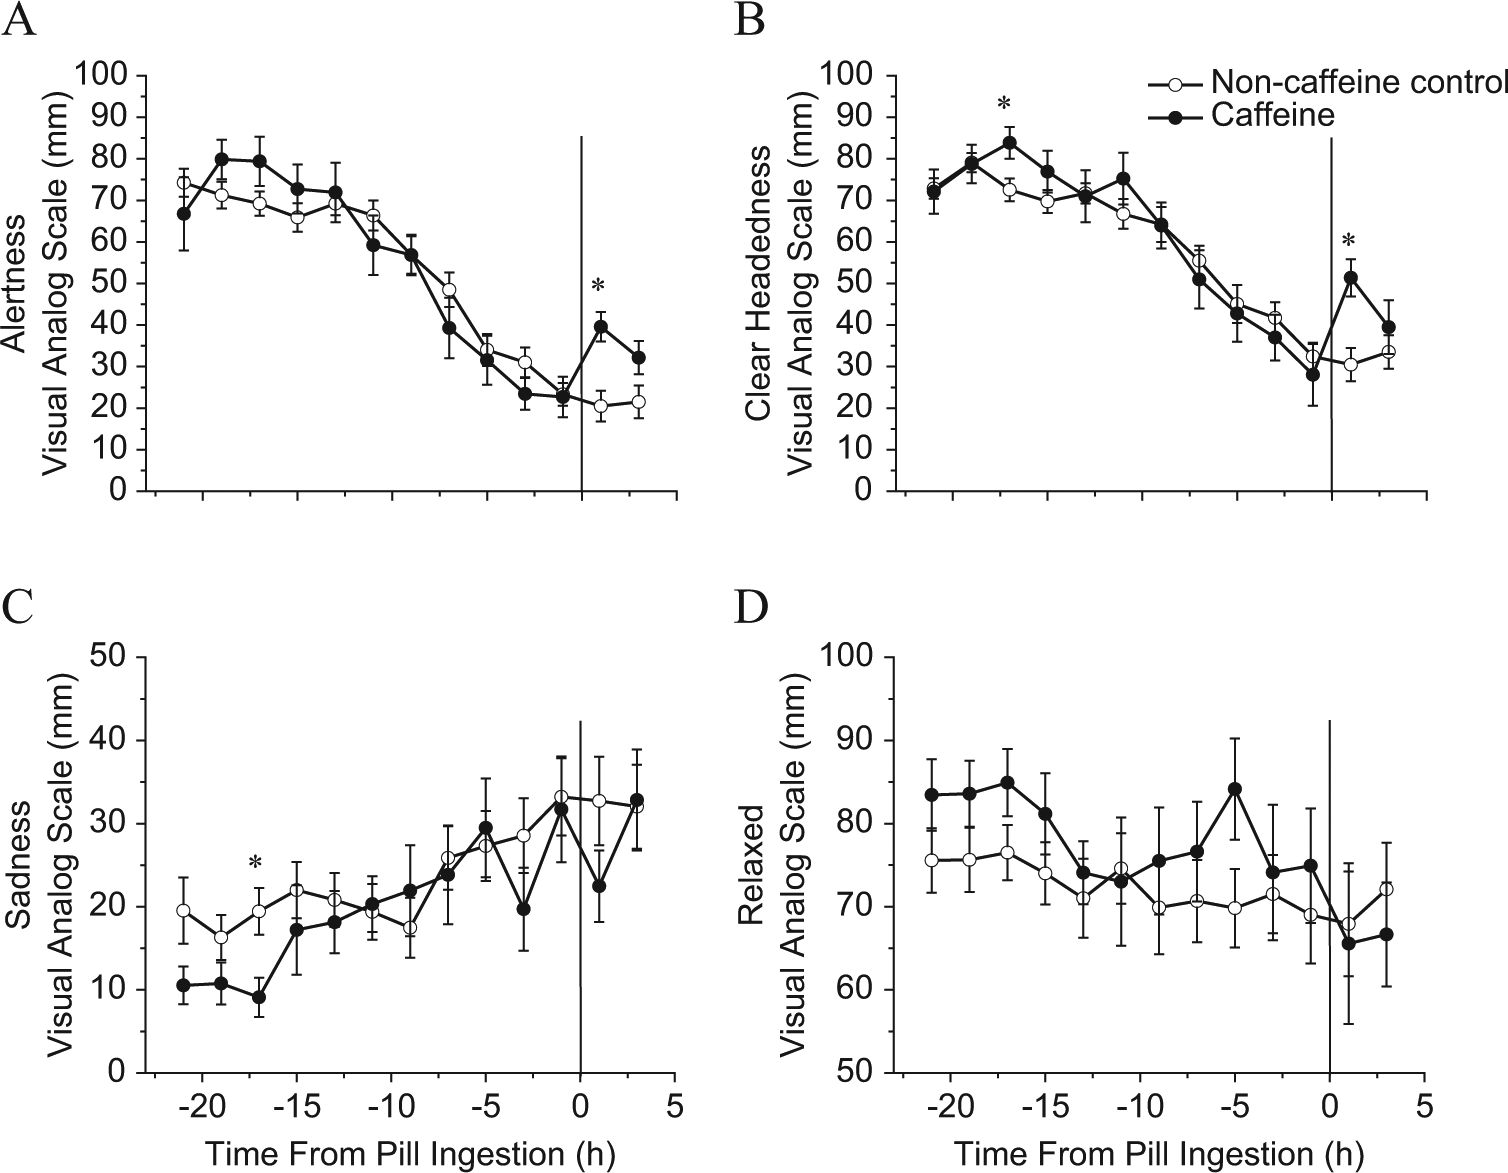
Mood and alertness during sleep deprivation. Visual analog scale (VAS) scores for the 2.9 mg/kg caffeine condition (closed circles, n = 10) versus the noncaffeine control condition (open circles, n = 20) during sleep deprivation prior to the daytime recovery sleep episode. The zero point represents the time of caffeine administration. A higher score on the y-axis denotes a higher rating for the VAS score plotted. *Significant difference between conditions (p < 0.05). Error bars are standard error of the mean. Note that the y-axes for sadness and relaxed are half of the range as those presented for alertness and clear-headedness.
Effects of Caffeine on Body Temperature during Wakefulness
Skin and CBT levels were similar between conditions before caffeine administration (Fig. 3). Caffeine significantly widened the DPG (p < 0.001) and significantly increased CBT (p < 0.001) (Fig. 3A and 3C). There was a significant main effect of time (p < 0.001) and interaction of condition by time (p < 0.01) for both the DPG and CBT. Furthermore, there was a significant main effect of condition (p < 0.001), time (p < 0.001), and interaction of condition by time (p < 0.001) for TFd (Fig. 3B). There was also a significant main effect of condition (p < 0.001) showing a higher Tsub after caffeine administration (Fig. 3D). Planned comparisons revealed significant differences between caffeine and control in the TFd beginning 20 min after pill ingestion (Fig. 3B), in the DPG beginning 40 min after pill ingestion (Fig. 3A), and in the CBT beginning 60 min after pill ingestion (Fig. 3C). There were no significant differences between caffeine and control conditions for the Tsub at individual time points.
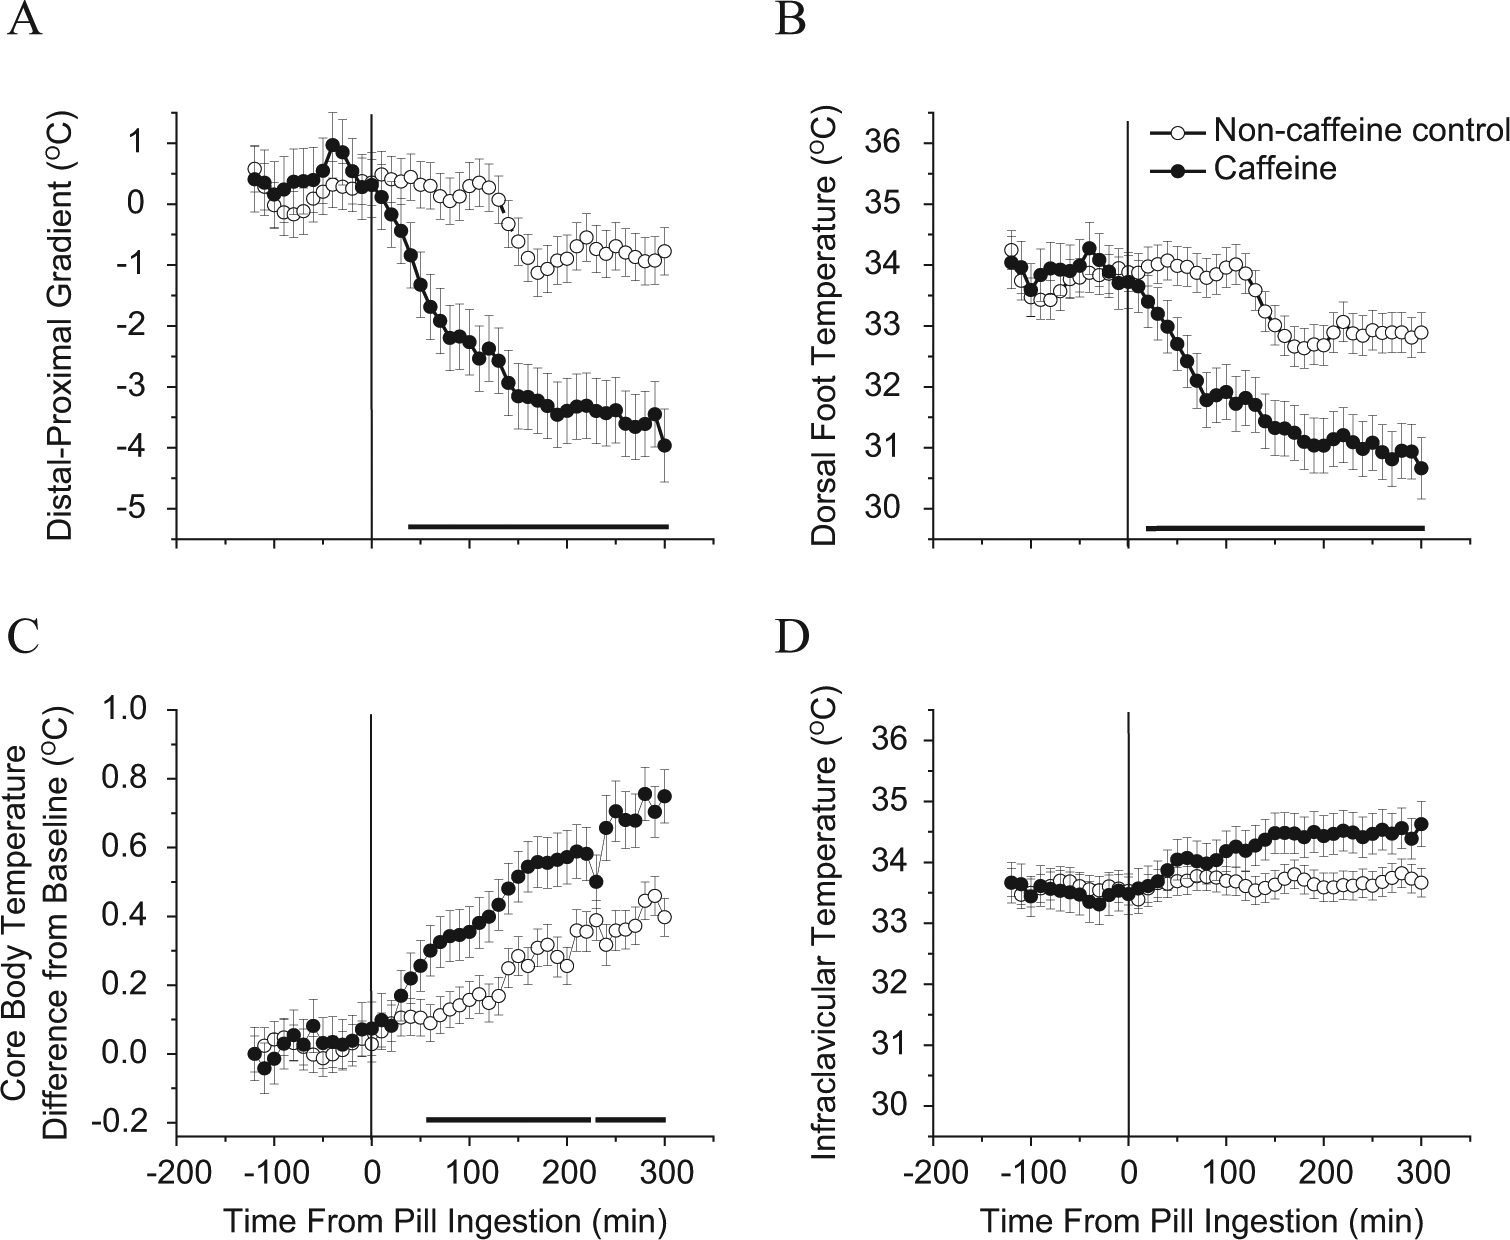
Body temperatures prior to daytime recovery sleep. Skin and core body temperature recordings for the 2.9 mg/kg caffeine condition (closed circles, n = 9) versus the noncaffeine control condition (open circles, n = 20) during sleep deprivation prior to the daytime recovery sleep episode. The zero point represents the time of caffeine administration. Bars under the data points near the x-axes denote significant differences between conditions (p < 0.001). Error bars are standard error of the mean.
Effects of Caffeine on Body Temperatures during Daytime Recovery Sleep
Caffeine significantly increased CBT and decreased the DPG during the sleep episode (p < 0.001), and there was a significant main effect of time for CBT (p < 0.05) and a nonsignificant trend for DPG (p = 0.06) (Fig. 4) showing a sleep-induced decrease in CBT and sleep-induced narrowing of DPG. Planned comparisons revealed significantly higher CBT for caffeine versus control from the start of the sleep episode to 190 min, between 210 and 220 min, and from 280 min to the end of the sleep episode (p < 0.05; Fig. 4A) and significantly lower DPG in caffeine versus control from the start of the sleep episode to 40 min and between 60 and 70 min (p < 0.05; Fig. 4B) after lights out.
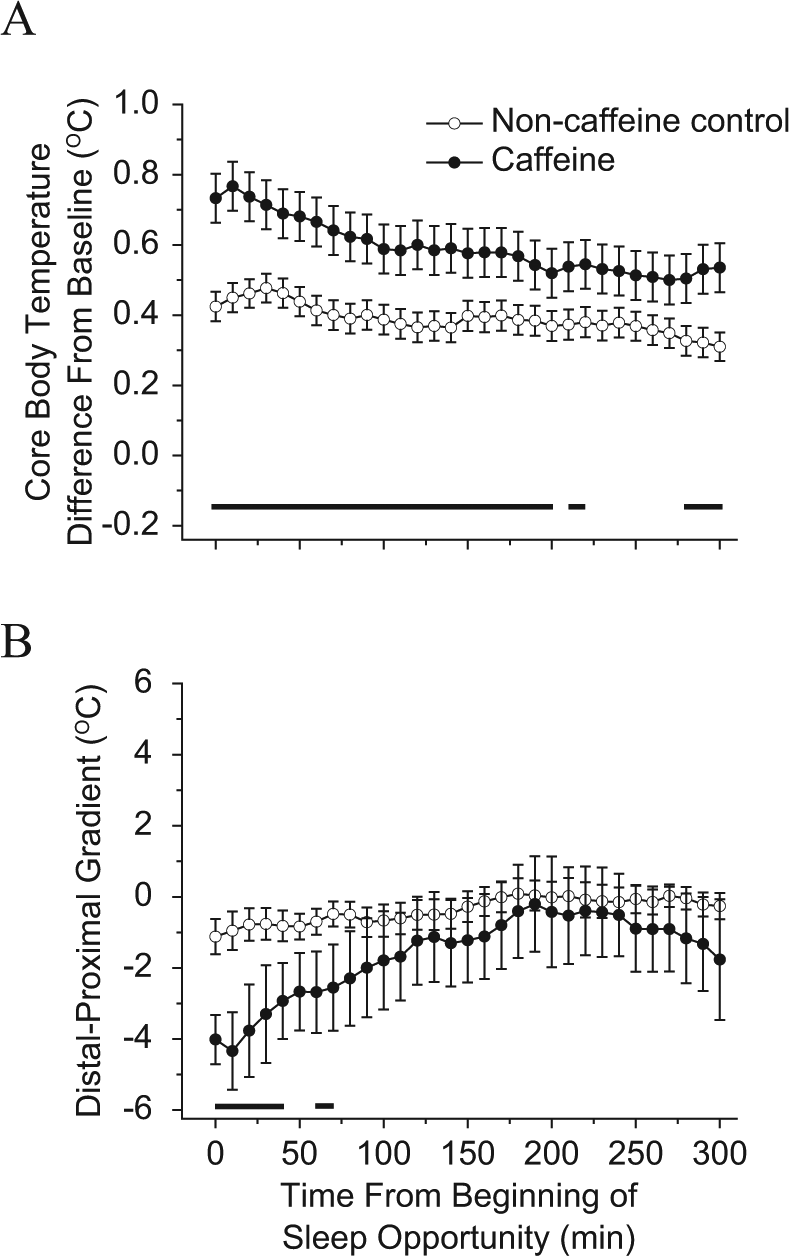
Core body temperature (CBT) and distal-to-proximal skin temperature gradient (DPG) during daytime recovery sleep. CBT and DPG recordings for the 2.9 mg/kg caffeine condition (closed circles, n = 8) versus the noncaffeine control condition (open circles, n = 19) after sleep deprivation during the daytime recovery sleep episode. The zero point represents the time of lights off and the beginning of the 5-h sleep episode. Note that data are a continuation of those shown in Figure 3C. Bars under the data points near the x-axes denote significant differences between conditions (p < 0.048). Error bars are standard error of the mean.
Effects of Caffeine on Daytime Recovery Sleep: First 5 Hours of Baseline versus 5-Hour Recovery Sleep Episode Comparison
Table 1 shows sleep measures for baseline and daytime recovery sleep by condition. No significant differences in sleep measures were observed at baseline between conditions for the first 5 h of recording (Table 1 and Suppl. Table S1) or for the full 8-h sleep episode (Suppl. Table S2). Condition comparisons for the 5-h daytime recovery sleep episode show that caffeine significantly reduced the percent SWS and SE, and the minutes of SWS and TST, with significantly increased WASO, SOL, LPS, and duration and number of awakenings compared with the control condition (Table 1). We also observed a nonsignificant trend for increased SWSL (p = 0.08) in the caffeine condition compared with the control condition. In both conditions, daytime sleep consisted of significantly lower percentage and fewer minutes of stage 2 sleep compared with baseline. Additionally, the control condition showed significantly higher percentage and more minutes of SWS, higher percentage of SE, and lower percentage and fewer minutes of stage 1 sleep (Table 1) compared with baseline.
Sleep architecture for the first 5 hours of each sleep episode.
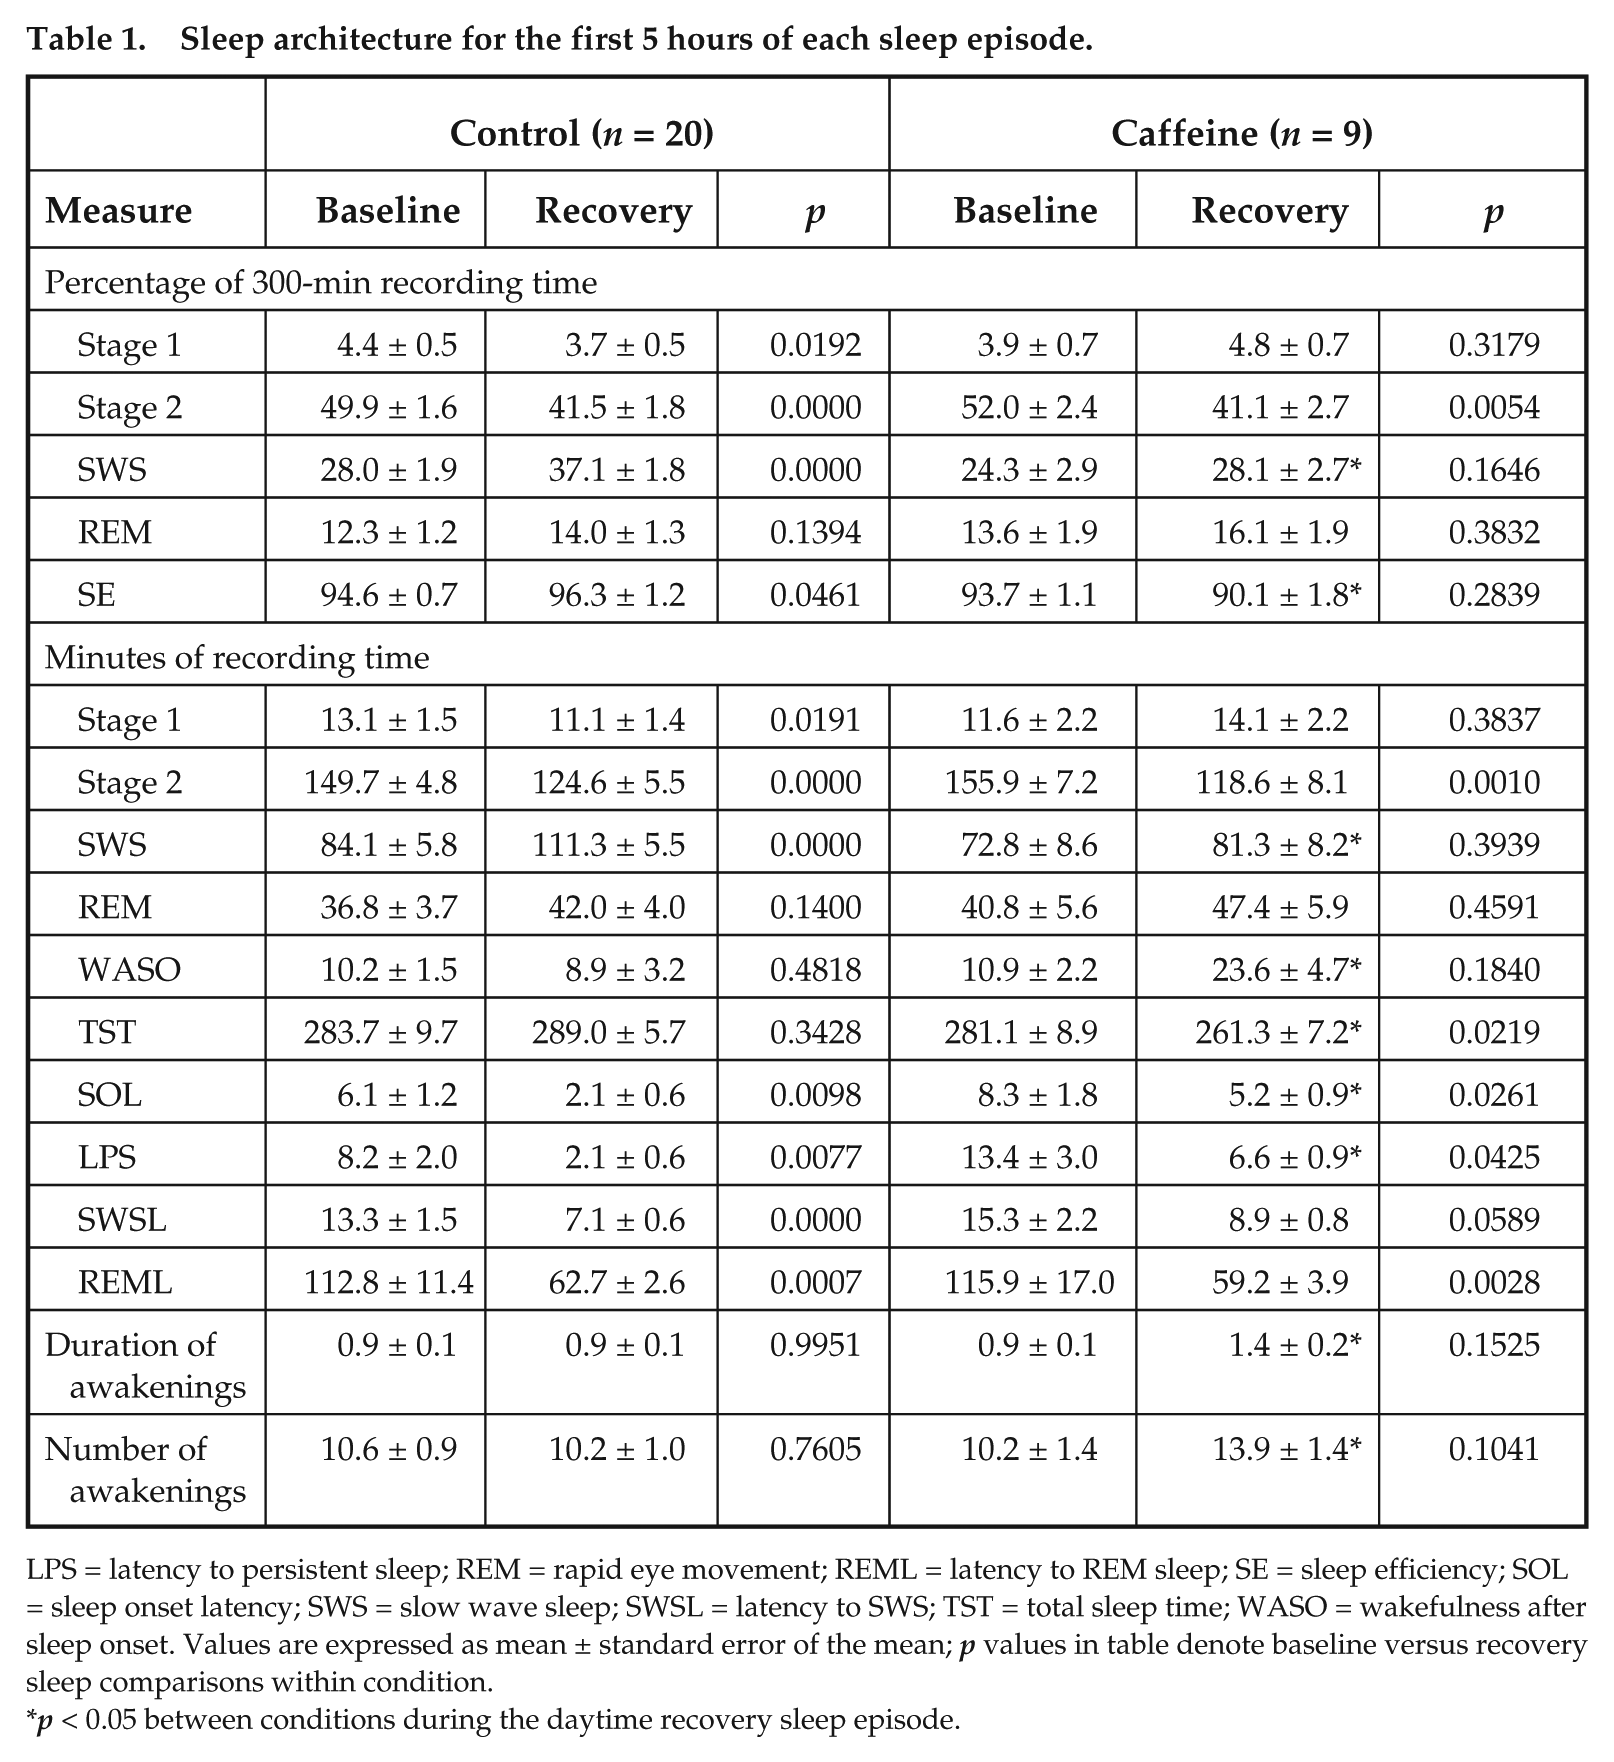
LPS = latency to persistent sleep; REM = rapid eye movement; REML = latency to REM sleep; SE = sleep efficiency; SOL = sleep onset latency; SWS = slow wave sleep; SWSL = latency to SWS; TST = total sleep time; WASO = wakefulness after sleep onset. Values are expressed as mean ± standard error of the mean; p values in table denote baseline versus recovery sleep comparisons within condition.
p < 0.05 between conditions during the daytime recovery sleep episode.
Associations between Changes in Temperature prior to and during Sleep and Sleep Architecture
Widening of the DPG prior to the daytime recovery sleep episode, including all subjects in the analysis, was significantly associated with increased percent stage 1 sleep, SOL, LPS, and minutes of WASO (Suppl. Table S3; Fig. 5, A-D; p < 0.05) and was significantly associated with decreased percent SWS and SE (Suppl. Table S3, Fig. 5E and 5F; p < 0.05). Widening of the DPG was not statistically associated with percent stage 2 or REM sleep (Suppl. Table S3). Similar findings were observed for the DPG during the recovery sleep episode, except for SWS (Suppl. Table S4). An increase in the CBT prior to the daytime recovery sleep episode was significantly and negatively correlated with LPS (Fig. 6A) but not with any other sleep architecture measure. Nonsignificant trends for a negative correlation with SOL (Fig. 6B) and a positive correlation with SWS were observed (Suppl. Table S3). Average CBT during the sleep episode was not statistically associated with any sleep architecture measure (Suppl. Table S4).
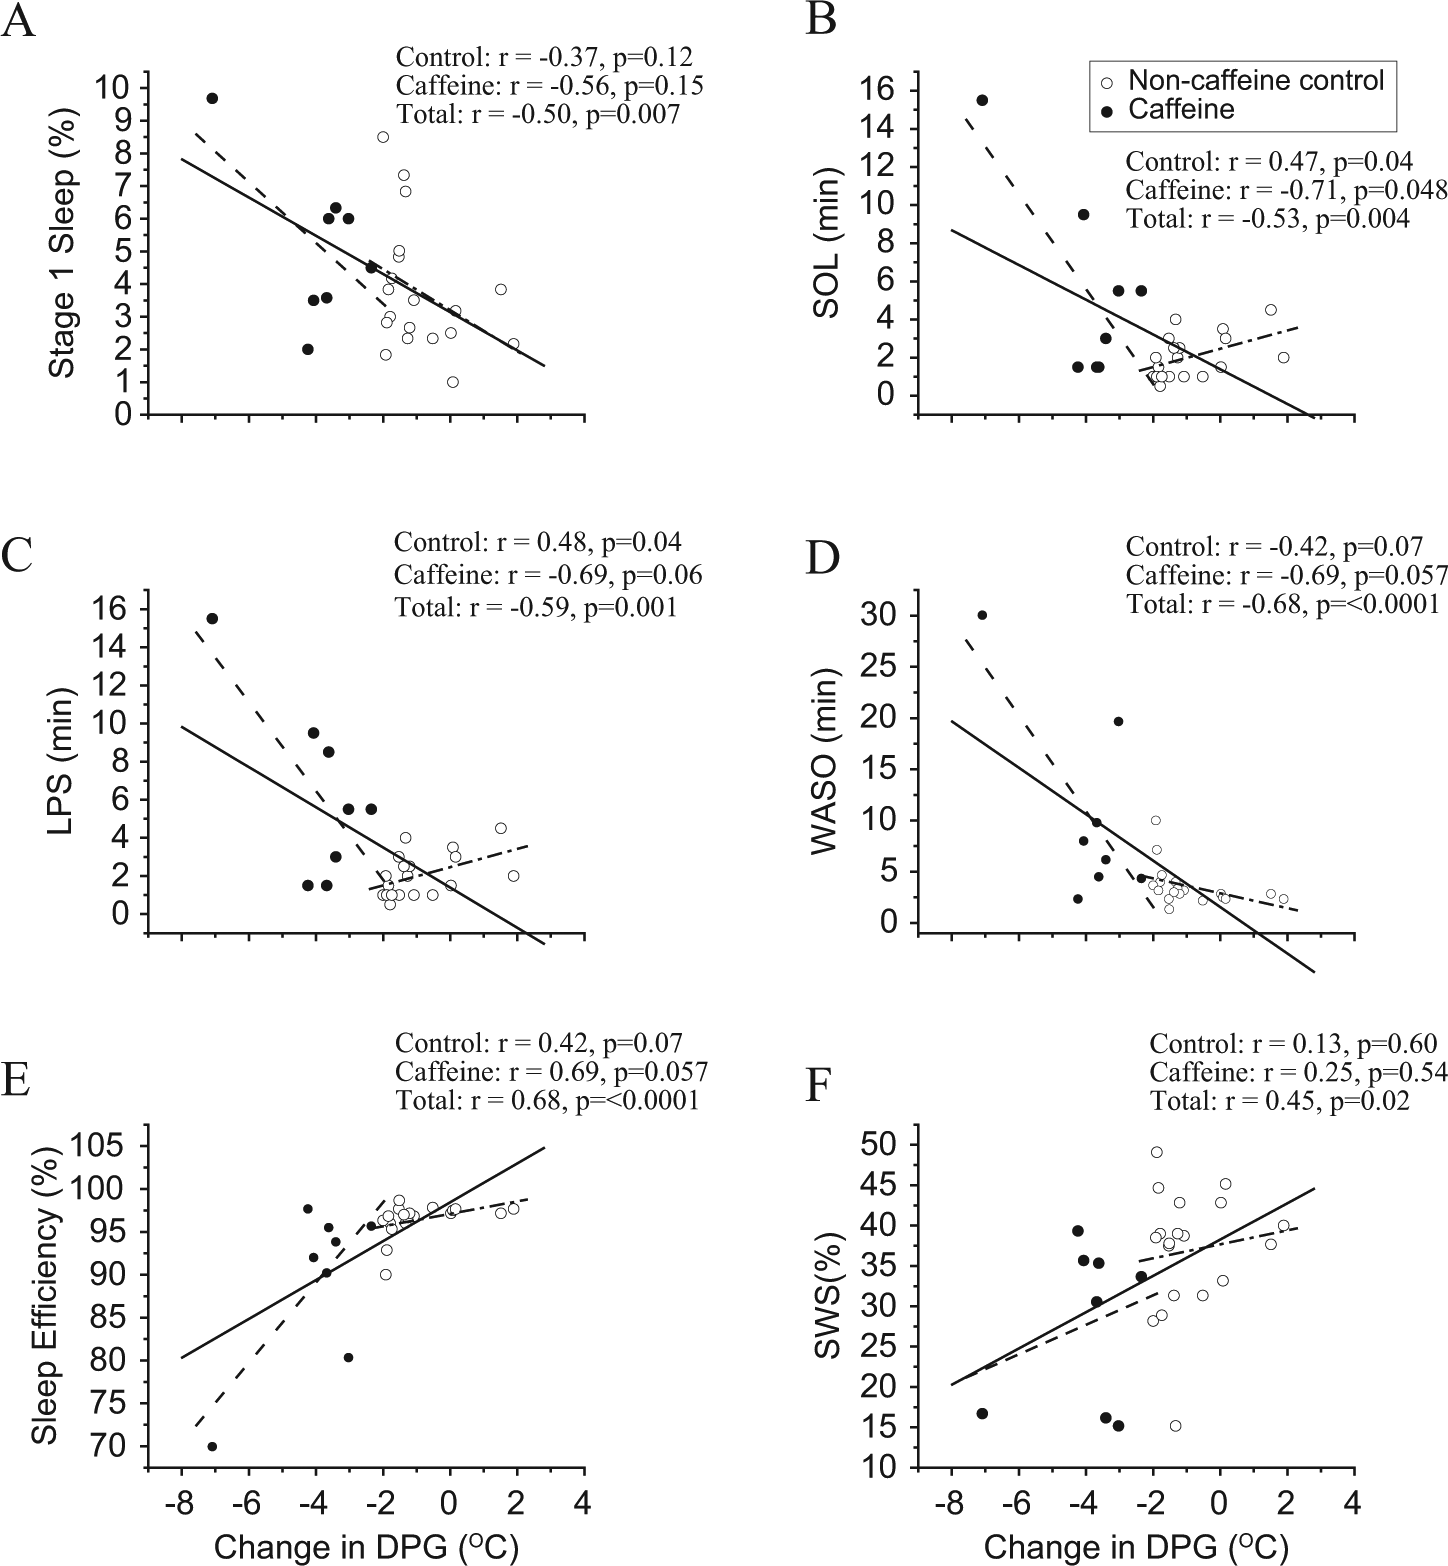
Associations between the change of the distal-to-proximal skin temperature gradient (DPG) and sleep. A more negative value of the DPG indicates a greater widening of the DPG prior to the daytime recovery sleep episode (i.e., the distal site is becoming less similar in temperature to the proximal site). The solid lines represent the best linear fit through both conditions combined (total subjects), the dashed lines represent the best linear fit through the control condition, and the dash-dot lines represent the best linear fit through the caffeine condition. Closed circles represent the 2.9 mg/kg caffeine condition (n = 9), and open circles represent the noncaffeine control condition (n = 19).
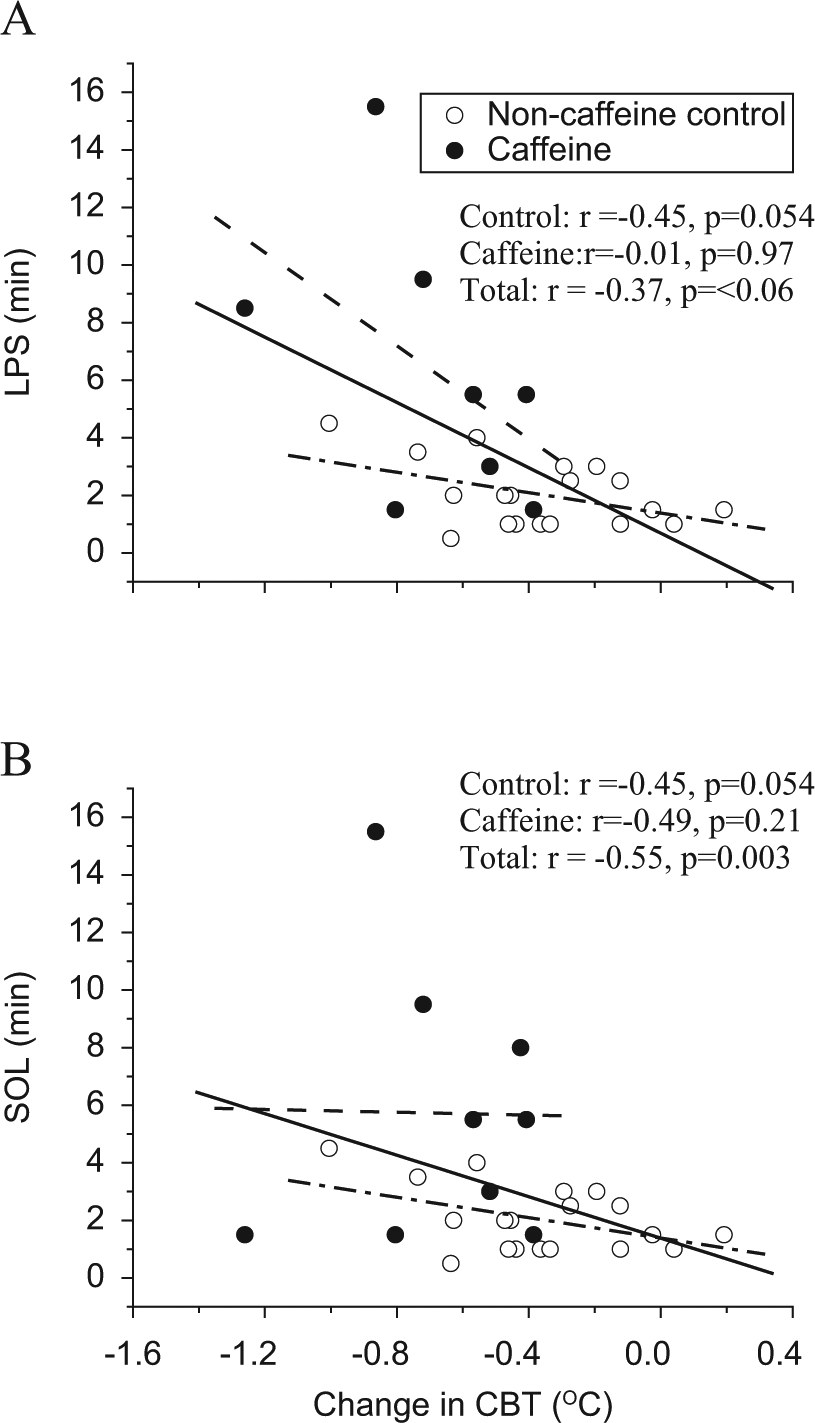
Associations between change in core body temperature (CBT) and sleep onset latencies. The solid lines represent the best linear fit through both conditions combined (total subjects), the dashed lines represent the best linear fit through the control condition, and the dash-dot lines represent the best linear fit through the caffeine condition. Closed circles represent the 2.9 mg/kg caffeine condition (n = 9), and open circles represent the noncaffeine control condition (n = 19).
Analyses for each condition separately show that for most sleep measures, associations with temperature prior to sleep were in the same direction as that reported for correlation analysis using the total of all subjects with some correlations being significant and some nonsignificant trends (4 out of 6 DPG correlations for each condition; 2 of 2 correlations for CBT in the control and 0 of 2 correlations in the caffeine condition that were significant or trends in the total subject analysis; Fig. 5). Sleep latency, however, showed opposite associations between the change in DPG prior to sleep and SOL and LPS (Fig. 5B and 5C) between conditions. Specifically, the control condition showed longer latencies to sleep associated with narrower DPGs prior to sleep, opposite to that for the caffeine condition and the total subject analyses described above. Analyses for each condition separately for associations between temperature during the sleep episode and sleep measures demonstrate condition differences showing significant DPG findings only for the caffeine condition and significant CBT findings only for the control condition (Suppl. Table S4).
Discussion
Findings from the current study further our understanding of caffeine’s influence on thermoregulatory physiology in the early morning hours during circadian misalignment, sleep deprivation, and subsequent daytime recovery sleep as common in night shift work. We highlight 4 findings: First, 2.9 mg/kg caffeine, equivalent to a double espresso, significantly widened the DPG primarily by attenuating heat loss through the periphery as observed via heat reduction in the foot 20 minutes prior to DPG widening and 40 minutes prior to CBT increases. Second, circadian misalignment and sleep deprivation reduced alertness and clear-headedness and increased sadness, whereas caffeine administered at 23 h awake acutely increased alertness and clear-headedness 1h after administration. Third, caffeine disturbed daytime recovery sleep such that there was increased WASO, SOL, LPS, and duration and number of awakenings and reduced SWS, TST, and SE compared with recovery sleep for the control condition. Fourth, a widening in the DPG prior to the daytime sleep episode as well as during the sleep episode was associated with disturbed recovery sleep (i.e. increased SOL, LPS, WASO, light Stage 1 sleep, and decreased SWS and SE) and an increase in CBT prior to the daytime sleep episode was associated with longer LPS.
Findings from the VAS indicate that self-reported alertness and mood were reduced by circadian misalignment and sleep deprivation (Dinges et al., 1997; Wright et al., 2002; Caldwell et al., 2004; Lieberman et al., 2005) and that caffeine administration increased alertness and mood, both consistent with prior findings (Lieberman et al., 1987; Penetar et al., 1993; Wright et al., 1997a).
Regardless of caffeine or control condition, circadian misalignment and sleep deprivation reduced LPS, REML, and minutes and percent stage 2 sleep, all reflective of higher homeostatic sleep pressure during daytime recovery sleep compared with baseline sleep at night (Borbély, 1982; Borbély and Achermann, 1999; Carrier et al., 2007). The shorter REML during the daytime recovery sleep episode, regardless of condition, is consistent with the circadian rhythm in REM sleep propensity as the recovery sleep episode was scheduled just after the circadian peak for REM sleep (Dijk and Czeisler, 1995; Carrier et al., 2007).
As noted, in prior research studies on caffeine and daytime recovery sleep following sleep deprivation, caffeine was administered 1 h to 3 h prior to the daytime recovery sleep episode and was shown to increase SOL, SWSL, and percent stage 1 sleep (LaJambe et al., 2005; Carrier et al., 2007; Carrier et al., 2009). Caffeine also decreased minutes of stage 2 sleep, SWS, REM sleep, TST, and SE (Carrier et al., 2007). Our time of administration of caffeine 5 h prior to recovery sleep is likely to be more common in real work operations than administration in closer proximity to sleep. As the half-life of caffeine is approximately 5 to 6 h (Nehlig et al., 1992; Landolt et al., 1995; Keane and James, 2008), it might be expected that caffeine would have limited influence on sleep 5 hours later (although see Drake et al., 2013). Our findings provide evidence that caffeine consumption ~1 half-life before sleep negatively affects daytime recovery sleep. Caffeine reduced the amount of SWS, and because caffeine is an adenosine antagonist, this finding is consistent with a role of adenosine in the modulation of SWS (Schwierin et al., 1996). Caffeine, compared with control, also increased WASO, SOL, LPS, and duration and number of awakenings and decreased TST and SE, as expected. Further research is needed to examine whether the disturbed recovery sleep observed has consequence for next-day cognitive and physiological functions.
Results from the correlation analyses for all subjects combined revealed that the more the DPG widened prior to sleep and during sleep, the greater the sleep disruption as shown by lower SE, longer SOL and LPS, more WASO, more percent stage 1 sleep, and less percent SWS (prior to sleep only). When analyzing each condition separately, we found similar findings although some were no longer significant, perhaps related to the reduced sample size and variance in scores as the caffeine condition appeared to compress values toward the floor for some measures. Why SOL and LPS showed different associations with the DPG for the control and caffeine conditions is unknown, and our control condition findings during daytime recovery sleep are inconsistent with DPG and SOL associations reported in the literature for nighttime sleep (Kräuchi et al., 1999; Kräuchi et al., 2000).
A growing body of evidence indicates that changes in skin temperature are associated with variations in alertness and sleep under bright light exposure (Cajochen et al., 2005), skin temperature manipulation via a thermal suit (Raymann et al., 2005; Raymann and Van Someren, 2007; Raymann et al., 2008), administration of melatonin or melatonin agonists (Kräuchi et al., 1997; Kräuchi et al., 2002; Aoki et al., 2008; Markwald et al., 2010), and, now, administration of caffeine. Taken together, these findings provide evidence for a role of skin temperature changes in arousal states, although most findings reflect associations that require further examination at a mechanistic level using animal models.
Correlation analyses also revealed a positive association between the change in CBT prior to bedtime and LPS. The increase in CBT observed after caffeine administration is consistent with previous findings of higher CBT and longer latencies to sleep on the maintenance of wakefulness test after caffeine administration during nighttime sleep deprivation (Wright et al., 1997a; Wright et al., 1997b; Schweitzer et al., 2006). Because the circadian CBT rhythm exhibits a rise in temperature in the morning prior to habitual wake time, the observation of increased CBT during wakefulness in both caffeine and control conditions was expected (Czeisler et al., 1980; Zulley et al., 1981), as was the sleep-induced decrease in CBT even though sleep occurred during the circadian rise of the CBT rhythm (Dijk and Czeisler, 1995). Yet CBT remained higher after sleep onset for caffeine versus control for the majority of the sleep episode, and the DPG was initially wider after sleep onset for caffeine versus control.
Significant changes in distal skin temperature following caffeine were observed prior to changes in the DPG and core body temperature, indicating that the change in distal temperature represents the initial or a faster measured thermoregulatory response to a delayed caffeine response. Mechanisms by which the circadian increase in distal skin temperature may promote sleep and by which decreased distal skin temperature is associated with disturbed sleep and increased arousal are not fully understood. The preoptic anterior hypothalamus (POAH) is primarily responsible for thermoregulation (e.g., vasodilation/constriction of the vasculature, shivering and breathing rate) (Boulant and Dean, 1986), and POAH thermosensitive neurons have been found to affect sleep and wakefulness. Prior to sleep onset, warm sensitive neurons (WSNs) in the POAH show increased firing rates and suppress arousal-related cell types, whereas prior to wakefulness, WSNs show decreased firing rates (DeArmond and Fusco, 1971; Alam et al., 1995a; Alam et al., 1996). Local warming of the POAH thermoreceptor neurons has also been observed to induce sleep (Roberts and Robinson, 1969; Alam et al., 1995b). Likewise, warming of proximal and distal skin sites also increases POAH WSN firing rates (Boulant and Bignell, 1973; Boulant and Hardy, 1974; Van Someren, 2000). Therefore, a narrowing of the DPG prior to sleep may trigger temperature-sensitive neurons in the distal skin that excite WSN in sleep-promoting areas of the brain to promote sleep or decrease arousal (Boulant and Bignell, 1973; Boulant and Hardy, 1974; Lowry et al., 2009). Conversely, caffeine administration and the observed widening of the DPG may decrease the excitement of the WSNs and, after a delay, disturb subsequent sleep and increase CBT. Furthermore, both adenosine receptors A1A and A2A, are localized in most vascular beds in the periphery (Tabrizchi and Bedi, 2001), and acute adenosine administration can increase forearm blood flow by 572% (Smits et al., 1990). In contrast, acute caffeine administration constricts peripheral blood vessels leading to increased peripheral resistance and rises in blood pressure (Pincomb et al., 1985; Smits et al., 1990; Hartley et al., 2004; Umemura et al., 2006). Our findings suggest that caffeine, even when consumed 5 h prior to sleep, may increase alertness and disturb subsequent daytime recovery sleep by binding to adenosine receptors in the brain and in the peripheral vasculature, both promoting arousal.
Centrally, adenosine receptors are present in several sleep-promoting regions of the brain (Porkka-Heiskanen and Kalinchuk, 2011; Brown et al., 2012). The wake-promoting basal forebrain is tonically inhibited by adenosine binding to its receptors, causing the cell to hyperpolarize through increased potassium conductance (Basheer et al., 2004). This decreased neuronal activity is thought to result in increased sleep pressure that builds throughout wakefulness (Porkka-Hesikanen et al., 1997; Basheer et al., 2004). Adenosine antagonists, such as caffeine, increase the activity of wake-promoting neurons (Porkka-Heiskanen and Kalinchuk, 2011) and can subsequently disturb sleep.
The study contained several limitations. Temperature microclimates were present during the sleep opportunity as the subjects were permitted to sleep beneath blankets, and this could have influenced both skin and core temperature measurements. Additionally, the findings of associations between the widening of the DPG and disturbed daytime recovery sleep do indicate causal relationships. Additional research is needed to explore dose and circadian time-dependent administration effects of caffeine on thermoregulatory physiology, alertness, and subsequent sleep during the daytime as well as at night, in different aged populations, in low versus high habitual caffeine users, in shift workers, and in patient populations such as those with insomnia and shift work disorder.
In summary, the current findings indicate that the use of caffeine during circadian misalignment and nighttime sleep deprivation alters thermoregulatory physiology, increases alertness and clear-headedness, and disturbs subsequent recovery sleep when caffeine is consumed 5 h prior to the daytime sleep episode. Our findings demonstrate that a widening of the DPG, primarily through decreased blood flow to the periphery, is associated with disturbed daytime recovery sleep. Additional research is needed to provide evidence-based recommendations regarding the optimal dosage and timing of caffeine administration to maximize alertness and minimize sleep disturbance during extended work operations that include work at night and daytime recovery sleep.
Footnotes
Acknowledgements
The authors thank the participants who volunteered for this study. This research was supported by NIH RO1 HL081761, R21 DK092624, and NIH/NCATS UL1 TR000154, and the Biological Sciences Initiative at University of Colorado Boulder. Contents are the authors’ sole responsibility and do not necessarily represent official views of the National Institutes of Health (NIH).
Conflict of Interest Statement
The author(s) declared no potential conflicts of interest with respect to the research, authorship, and/or publication of this article.
Notes
References
Supplementary Material
Please find the following supplemental material available below.
For Open Access articles published under a Creative Commons License, all supplemental material carries the same license as the article it is associated with.
For non-Open Access articles published, all supplemental material carries a non-exclusive license, and permission requests for re-use of supplemental material or any part of supplemental material shall be sent directly to the copyright owner as specified in the copyright notice associated with the article.