
Abstract
The fungus Neurospora crassa constitutes an important model system extensively used in chronobiology. Several studies have addressed how environmental cues, such as light, can reset or synchronize a circadian system. By means of an optimized firefly luciferase reporter gene and a controllable lighting system, we show that Neurospora can display molecular circadian rhythms in dim light when cultures receive bright light prior to entering dim light conditions. We refer to this behavior as the “bright to dim oscillatory response” (BDOR). The bright light treatment can be applied up to 76 h prior to dim exposure, and it can be as short as 15 min in duration. We have characterized this response in respect to the duration of the light pulse, the time of the light pulse before dim, the intensity of dim light, and the oscillation dynamics in dim light. Although the molecular mechanism that drives the BDOR remains obscure, these findings suggest that a long-term memory of bright light exists as part of the circadian molecular components. It is important to consider the ecological significance of such dim light responses in respect to how organisms naturally maintain their timing mechanism in moonlight.
The most common method of following circadian rhythmicity in Neurospora crassa has been to analyze the banding pattern created by periodic asexual spore (conidia) formation along race tubes (Sargent et al., 1966). Genetic and biochemical characterization of mutant strains displaying altered rhythms on race tubes was critical for identifying the gene frequency (frq) as a central component in the transcriptional-translational negative feedback loop circuit that allows for circadian behavior in Neurospora (Dunlap, 1999; Dunlap and Loros, 2006). The Neurospora circadian system is responsive to light (Sargent and Briggs, 1967) such that it can be phase shifted by light pulses or entrained by light-dark cycles. However, examining the effects of light on Neurospora circadian rhythms by following conidial development is complicated by the fact that conidial production, per se, is very responsive to light, independent of the influence of the circadian clock (Lauter et al., 1997). In this study, we used a firefly luciferase reporter system to molecularly monitor the circadian oscillator while examining the response to dim light. This bioluminescent reporter consists of a copy of the frq promoter in front of an optimized firefly luciferase gene transformed into the his-3 locus of Neurospora (frq-luc) (Gooch et al., 2008). Thus, the resulting luminescence reflects frq expression, informing us of the molecular status of the Neurospora circadian oscillator (Gooch et al., 2008). This system can be successfully used to follow circadian rhythms in Neurospora when grown as colonies (using sorbose in the medium), independent of the phenotypical changes of conidial banding or the effects of light on conidial production. These “colony” assays also allow us to analyze many samples per experimental run.
WHITE COLLAR-1 (WC-1) and WHITE COLLAR-2 (WC-2) are two GATA-transcriptional factors that associate to form a WHITE COLLAR complex (WCC) (Crosthwaite et al., 1995; Froehlich et al., 2002; Liu et al., 2003; Corrochano, 2007). In the absence of wc-1 or wc-2, all known photoresponses in Neurospora are lost, and the resulting strains are considered blind (Chen et al., 2009). The WCC is activated by blue light absorption of the FAD chromophore bound to WC-1. The light-activated WCC is known to stimulate transcription of over a hundred loci through direct recognition of cis-elements in the promoters of these “light-activated genes” (Vitalini et al., 2006; Chen et al., 2010b; Smith et al., 2010), including frq and several known clock controlled genes (Chen et al., 2009). The frq promoter responds to light by means of two WCC binding sites known as the proximal and distal light response elements (LREs) (Froehlich et al., 2002). The proximal LRE (pLRE), when activated by light via the WCC, is responsible for the rapid and acute increase in frq transcript levels (Crosthwaite et al., 1995). The distal LRE, also known as the Clock box (C-box), is necessary and sufficient for frq circadian expression (Froehlich et al., 2003). Despite the strong sequence resemblance between the proximal and distal LREs, and despite the fact that WC complexes bind to both, the latter cis-element has only an ancillary role in frq light regulation. In constant darkness, regulation of frq transcription by the WCC via the C-box is vital for the workings of the circadian oscillator. Transcriptional regulation of frq expression is at the center of the mechanism that gives rise to the circadian core oscillator. A single 22-h circadian cycle in DD involves several steps: (1) WCC drives frq expression, which builds up FRQ; (2) the high FRQ concentration shuts down WCC by promoting WCC phosphorylation; (3) FRQ production lessens while the existing FRQ is progressively phosphorylated and degraded, and concomitantly, as hyperphosphorylated FRQ concentration levels drop, the WCC recovers activity; and (4) frq m-RNA transcription starts up again (Dunlap and Loros, 2006).
Another protein that plays an important role in Neurospora responses to light is VIVID (VVD). The expression of vvd, in a WCC-dependent manner, is acutely increased by light, which leads to rapid changes in VVD levels (i.e., an increase of 50-fold in 5 min) (Heintzen et al., 2001). VVD represses light-activated WCC, thus inhibiting the expression of light responsive genes, among them frq and vvd. Importantly, the level of photoadaptation (Elvin et al., 2005) is dependent on the time at which light onset occurs in the circadian cycle (Heintzen et al., 2001). In constant light, vvd mRNA peaks in about 20 min and drops to a lower steady-state level after that (Malzahn et al., 2010). In constant darkness, VVD concentration drops to nearly zero in 24 to 48 h (Heintzen et al., 2001). VVD is also known to stimulate frq mRNA turnover (Hunt et al., 2010). Functionally, by negatively affecting WCC function, VVD reduces the effects of lights-on, thus lessening the phase resetting effects that can be triggered by light. In accordance with its role regulating the levels of frq under light conditions, a vvd knockout strain causes about a 4-h delay in the first conidial peak compared with wild-type (Elvin et al., 2005).
It is a common observation that circadian rhythmicity is inhibited in constant light for many organisms, including Neurospora (Sargent et al., 1966; Sargent and Briggs, 1967). The high sensitivity to ambient light of frq expression in Neurospora is often used to explain this phenomenon (Crosthwaite et al., 1995; Collett et al., 2001). Indeed, Crosthwaite et al. (1995) reported a fluence threshold of frq induction to be 8 µmol photons m−2. Threshold light intensities for the loss of oscillatory activity were reported in early works to be 0.72 ergs cm−2 sec−1 (~3 nmol m−2 sec−1) (Sargent et al., 1966) and 0.71 × 10⁻¹³ einsteins cm−2 sec−1 (=0.71 nmol m−2 sec−1) (Sargent and Briggs, 1967). Merrow et al. (1999) reported a value of about 4 nmol m−2 sec−1. Our initial study using the luciferase colonized Neurospora system (Suppl. Fig. S1) shows the loss of oscillatory activity at values greater than 1 nmol m−2 sec−1 in dim light when coming from constant dark (DD).
Rhythmic activity of Neurospora under higher light intensity has been reported in particular cases. Using riboflavin defective mutants (which also show FAD deficiencies), circadian rhythmicity could be observed in constant light at intensities of 550 lux (~4000 nmol m−2 sec−1) (Paietta and Sargent, 1981), consistent with the fact that flavin is key in blue-light reception in Neurospora. Later, using mutagenesis and selection, Paietta and Sargent (1983) found 3 different genetic strains (lis-1, lis-2, lis-2) of Neurospora that have overt circadian behavior in race tubes at light intensities of 400 lux (~2700 nmol m−2 sec−1), but phase shifting by light and photoinduced carotenogenesis are not inhibited in these strains. Nevertheless, the identity of these mutations remains unknown. Overexpression of VVD in a Neurospora strain led to free-running oscillations at an intensity of 180 nmol m−2 sec−1 (Malzahn et al., 2010). However, Elvin et al. (2005) reported damped oscillations in race tubes at 21,000 nmol m−2 sec−1 when they used previous light-dark entrainment cycles, observing that oscillations in light tend to be lost when using a vivid (vvd) knockout strain, which supports their argument that VVD is important in damping a lights-on effect. In addition, Schneider et al. (2009) described, in vvd mutants, FRQ-less associated rhythms in constant light (2700 nmol m−2 sec−1) in vvd mutants.
While characterizing the effect of photoperiod, we discovered that if Neurospora received bright light before being transferred to dim light, then strong oscillations could subsequently be observed at higher dim light intensities. We are calling this novel phenomenon the “bright to dim oscillatory response” (BDOR), and it is characterized here.
Materials and Methods
Growth Medium
The same growth medium, referred to as FGS, is used in all of the experiments described in this paper: 2% sorbose (Sigma-Aldrich, St. Louis, MO), 0.05% glucose, 0.05% fructose, 1X Vogel’s (Vogel, 1956), 50 µg/L biotin, 1.8% agar. After autoclaving, potassium firefly luciferin (BioSynth L-8200 D-luciferin firefly [synthetic] potassium salt; Biosynth International, Itasca, IL) is added to create a final concentration of 25 µM. The medium (30 mL) is added to small, deep Petri plates (60 × 20 mm). The sorbose restricts growth and induces colonization.
Inoculation
Suspensions of conidia stored at −80 °C are defrosted, and 6 aliquots of 6 µL each are distributed onto the agar surface of each plate. To set the phase and retard growth, in some experiments freshly inoculated cultures were put into a dark refrigerator (4 °C) for 1 to 3 days before being placed into the measuring chamber (inverted, darkness [DD] 25 °C). Other cultures were directly placed into the measuring chamber after inoculation (inverted, DD, 25 °C). Transfers and measurements performed in the dark were done using a red safety lamp (Kodak 1A filter; Kodak, Rochester, NY), since it is known that Neurospora is insensitive to red light (Sargent and Briggs, 1967).
Lighting
Due to the lack of a universal unit standard for the measurement of light intensity, different laboratories use different units: in this report we use nmol m−2 sec−1. In general, there is no straightforward conversion between units since it depends upon factors such as the spectral quality of the light, the spectral sensitivity of the organism, and the nature of the sensor. However, when reporting units from other authors we will attempt to make an approximate conversion to the units that we are using for comparison purposes, with the commonly used standard of 555 nm for conversion purposes.
Bright light treatments were conducted by removing the cultures from the measuring chamber and placing them in another controlled environment chamber at 25 °C using the overhead fluorescent lights and a bank of 2 other cool white fluorescent lights off to the side (19,000 nmol m−2 sec−1 ≈ 260 f.c. ≈ 2800 lux ≈ 4000 µW m−2). Dim light of 2 nmol m−2 sec−1 (≈ 0.03 f.c. ≈ 0.3 lux ≈ 0.4 µW m−2) was achieved by placing a rack of 64 “white” LEDs (Jameco 320531; Jameco Electronics, Belmont, CA) set at 20% maximum intensity 1 m from the samples in the measuring chamber. The intensity and timing of the LEDs were controlled via PhidgetsLED-64 1030 hardware and software (Phidgets Inc., Calgary, Alberta). Our subjective opinion of this brightness is that it is approximately the same as full moonlight and print can be read with this intensity of light. Different dim light intensities for Figure 5 were achieved by suspending 2 LEDs at 100% intensity directly over (5 cm) the plate receiving strongest light and placing other plates certain distances away to create lower intensities.
Light Intensity Measurement
Light intensity measurements were done using, or calibrating to, a Licor quantum sensor (Licor, Lincoln, NE). To measure intensities less than the lower limit of the Licor quantum (PAR) sensor (100 nmol m−2 sec−1), a UDT 350 optometer (Gamma Scientific, San Diego, CA) or the CCD camera was used and calibrated back to the Licor standard measurements, assuming linearity.
Temperature
Temperature was maintained at 25 ± 0.1 °C in a controlled environment room. There was no measurable change in temperature when the LEDs were turned on. The dark cold pulse of Figure 7A was achieved by placing Petri plates with cultures onto frozen ice in an insulated container. The dark warm pulse of Figure 7A was achieved by placing Petri plates with cultures onto a short metal rack to suspend the cultures over an electric frying pan. In both cases, after the 15-min pulse, the temperature of the agar was determined using a thermometer with the aid of red light.
Measurement
Time-lapse video of the samples was done using a liquid nitrogen cooled CCD camera (Princeton Instruments, Princeton, NJ; Spec-10; 700B/LN) controlled by WinSpec, Visual Basic, and Microsoft Excel software. A time-lapse interval was 30 min, with an acquisition time of 2.5 min. During lighting, a 30-min frame was interrupted by 3 min of darkness to collect luminescence data. Luminescence was quantitatively measured from the whole inverted Petri plate. Three or more replicate plates of each treatment and strain were used, and data of a representative plate are shown. Typically, experiments are run more than once.
Curve Fitting
To determine the peak and trough phase and intensity, a least squares fit to a polynomial was performed using the points around those nodes. To determine period, a least squares fit of a cosine curve with a damped amplitude and damped mesor was performed on data over at least 60 h. (Luminescence = M * e(MD*t) + A * e(AD*t) * cos (2π (t-P)/τ), where t is time, τ is the period, P is the phase, A is the amplitude, AD is the amplitude decay, M is the mesor, and MD is the mesor decay; Gooch et al., 2014.)
Neurospora Strains
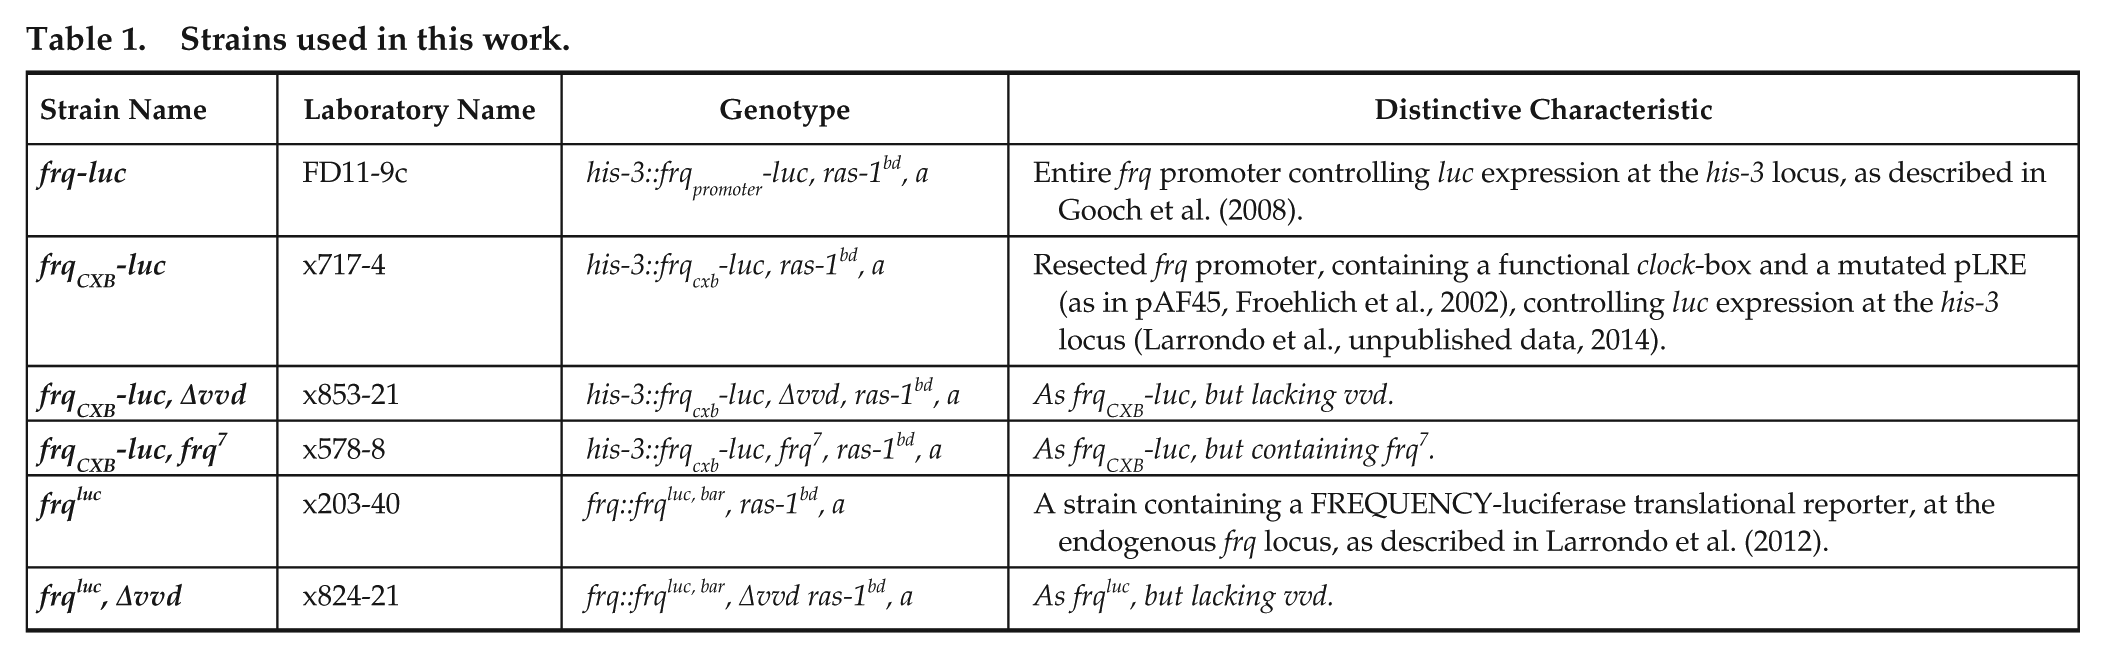
Genotypes and the distinctive characteristics of the strains used in this work are presented in Table 1. Briefly, the frq-luc reporter strain (laboratory strain: FD11-9c) contains a frq promoter controlling the optimized firefly luciferase gene at the his-3 locus (Gooch et al., 2008) and does not modify the existing frq circadian oscillatory system. A similar strain, frqCXB-luc, has a highly resected frq promoter with a mutated, nonfunctional pLRE, but the functional C-box remains (laboratory strain: x717-4) (Larrondo et al., unpublished data, 2014; also see the modified promoter AF45 of Froehlich et al., 2002). Variations of strains containing the frqCXB-luc reporter were obtained by crossing the parental strain used in obtaining x717-4, with a vvd knockout (resulting strain X853-21) and another with a frq7 background (x578-8). A fusion strain of frq and luc, called frqluc, leads to a FRQ/LUC fusion protein (x203-40) (Larrondo et al., 2009; Larrondo et al., 2012) that was analyzed in a WT or in a Δvvd background. All strains originated from a ras-1bd mat a strain. Note that although in strains containing the frqCXB-luc reporter, the frq promoter controlling luc expression is resected, the frq locus is intact and therefore the circadian properties of these and other frq-reporter strains are comparable.
Strains used in this work.
Results
Sustained circadian oscillations can be observed in constant darkness using the frq-luc reporter in sorbose colonized Neurospora, as reported by Gooch et al. (2008) and as shown in Figure 1A. For this strain (Fig. 1A), lights-on leads to a rapid increase of frq transcription, which can be observed as enhanced luciferase expression and thus an increase in luminescence, consistent with the frq promoter being induced by light via the pLRE (Crosthwaite et al., 1995; Froehlich et al., 2002). The frqCXB-luc strain (Larrondo et al., unpublished data, 2014) contains a resected minimal frq promoter, with a functional C-box and a mutated and, therefore, nonfunctional proximal light response element (Froehlich et al., 2002). Thus, this reporter allows visualization of clear rhythms in DD but does not show large transcriptional changes upon light exposure (Gooch et al., 2014, and Fig. 1). Because the frqCXB-luc reporter robustly depicts the oscillatory behavior of the core clock, without the masking and complexity associated with changes in frq due to light induction, all experiments presented in this report use frqCXB-luc, unless indicated otherwise. Note that although frqCXB-luc does not directly respond to light, the core oscillator, including frq light-responsiveness, remains unaffected in strains bearing this reporter. In addition, perturbations by light leading to changes in phase are easily reflected in the luminescence levels derived from this reporter.
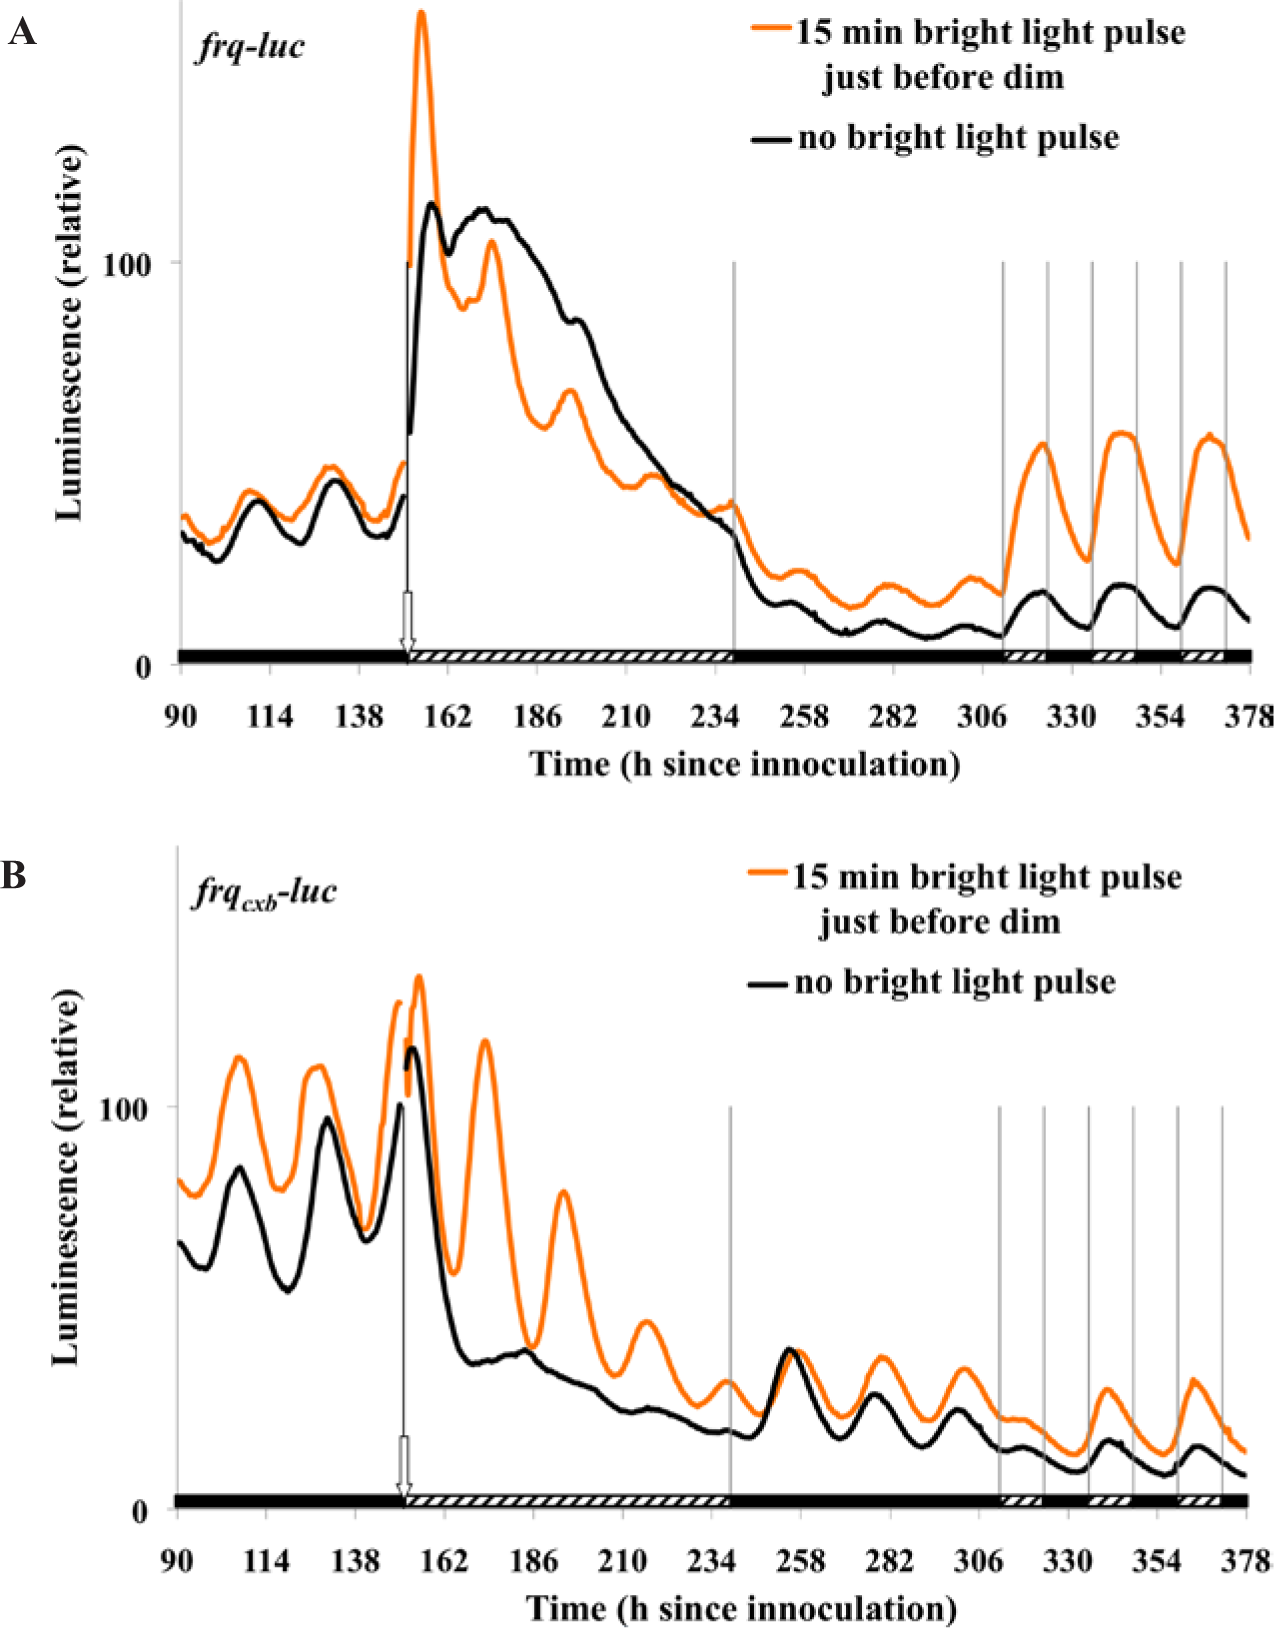
The BDOR. The frq-luc reporter strain of Neurospora was inoculated onto small Petri plates containing FGS medium and immediately placed into constant darkness at 25 °C where the cultures were monitored with a time-lapse CCD camera. The orange curve represents a culture that had a 15-min bright light exposure of 19,000 nmol m−2 sec−1 at 152.7 h after inoculation. After the pulse, all cultures were transferred to dim light (2.4 nmol m−2 sec−1). The dim lights were turned off at h 239.2. At h 311.7, three cycles of 12 h dim:12 h dark were started. Luminescence is determined for 2.5 min every 30 min and is a relative measure, but it is the same relative measure for all of the figures. We have calculated that a 100 luminescent intensity reading from a plate (relative) corresponds to an intensity of approximately 3 * 10−6 nmol m−2 sec−1. Bars at the bottom of graphs indicate lighting exposure: black bar, darkness; hatched bar, dim light; white bar, light. (A) frq-luc strain. (B) frqCXB-luc strain.
It has been thought that Neurospora circadian rhythms are heavily damped or totally inhibited when transferred to light, even at dim levels (Sargent et al., 1966). This is also what we have seen in cultures transferred from dark to dim (Fig. 1, black lines) where the loss of rhythmicity occurs at intensities above 1 nmol m−2 sec−1 (Suppl. Fig. S1). However, if the cultures are exposed to bright light prior to transferring to darkness, significant oscillatory activity can be subsequently observed (Fig. 1, orange curves). We have named this response the “bright to dim oscillatory response” (BDOR). Several lines of evidence suggest that the cultures are not simply interpreting this level of dim as dark: (1) the oscillations are repressed when going from dark to dim (h 152.6 of Fig. 1, black curves), (2) when going from dim to dark the phase of the oscillation is reset and the oscillatory robustness is stimulated (h 239 of Fig. 1), and (3) the oscillations are entrainable to cycles of 12 h dark:12 h dim (Fig. 1). In Figure 1 it can be seen that the oscillations in the BDOR are more dampened in dim light than in darkness (this will be better demonstrated using comparative data in Fig. 2). Although nutrient depletion and culture age can certainly contribute to oscillatory damping during BDOR, the fact that the 2-week-old cultures (Fig. 1) in DD still have good oscillatory capacity shows that damping during dimness cannot be completely attributed to culture age, luciferin depletion, or nutrient depletion.
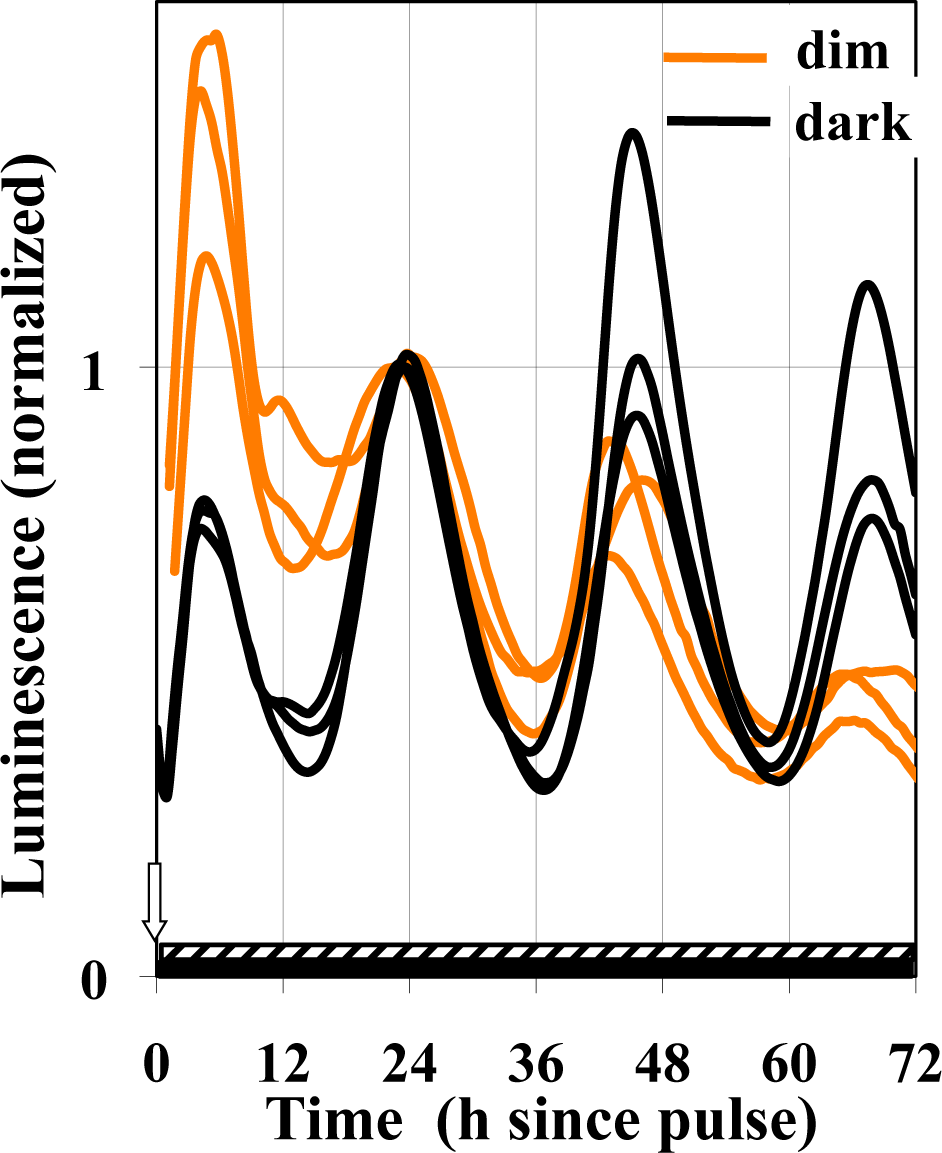
Comparison of the BDOR-driven oscillation resulting from a bright light pulse followed by transfer to either dim light or darkness. Plates of refrigerated frqCXB-luc were transferred to the measuring chamber (25 °C, DD) to reinitiate growth, and at 72 h after this transfer they received a 15-min bright light pulse (19,000 nmol m−2 sec−1, 25 °C). After the pulse (time 0 in the graph), one group of plates was exposed to darkness while another was exposed to dim light (2.4 nmol m−2 sec−1). The data are normalized to 1 at the 24-h peak.
Cultures grown in darkness were treated with a 15-min bright light pulse and then transferred to either dim light or darkness for comparison (Fig. 2 and Table 2). The amplitudes of the second peaks of the figure have been normalized to better compare phases, period, and damping. The phase that is set by the 15-min light pulse and transfer to dim light is essentially the same as that induced by a 15-min light pulse and transfer to dark. No significant difference is seen in period. Importantly, the subsequent oscillation in dim light is more damped compared with darkness, where the first damped peak is 0.43 times the value of the undamped peak.
Comparison of the BDOR-driven oscillation resulting from a bright light pulse followed by transfer to either dim light or darkness. Data for 3 replicate plates of the experiment shown in Figure 2 (24-h peak fitted with polynomial, oscillation fitted with modified cosine).
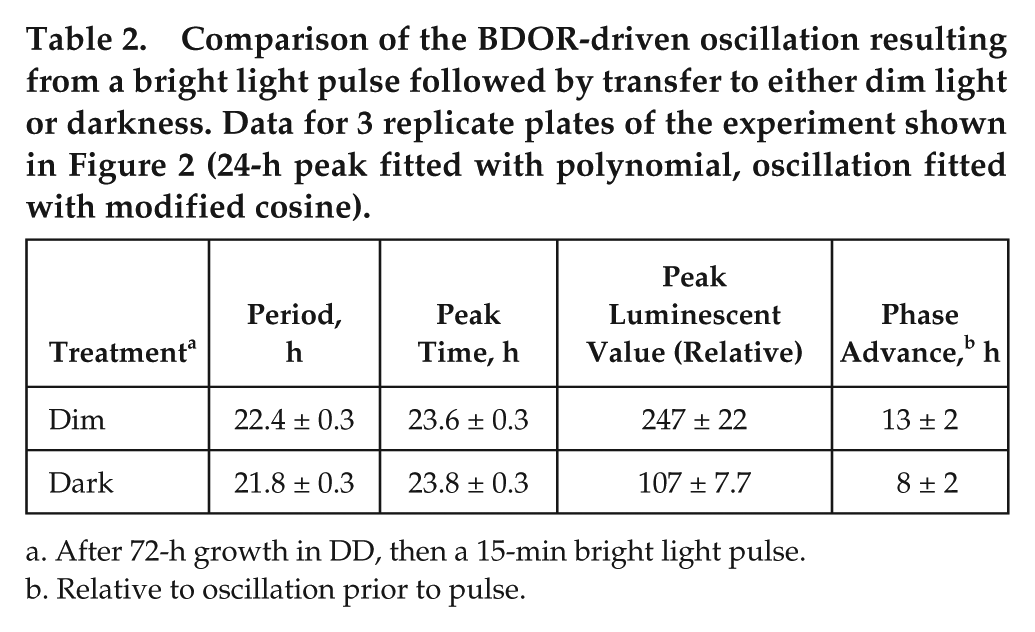
After 72-h growth in DD, then a 15-min bright light pulse.
Relative to oscillation prior to pulse.
Given that the oscillatory components exist at different levels at distinct points of a circadian cycle, it is possible that the phase in which the light pulse and dim lighting are initiated could affect the subsequent BDOR effect. Figure 3 shows that the BDOR is essentially unaffected by the time of phase initiation. Pulses longer than 15 min were used to assess whether a stronger BDOR effect could be achieved and to determine whether the initial dark-to-bright or the final bright-to-dim is primary in setting the phase once in the dim light. Longer durations of light seem to have no significant effect on magnitude, damping, or phase (Fig. 4). Figure 5 confirms that the BDOR is observed in dim light of less than 20 nmol m−2 sec−1 but that brighter intensities can block rhythmicity altogether. A dim intensity of 6 nmol m−2 sec−1 allows for a good BDOR effect.
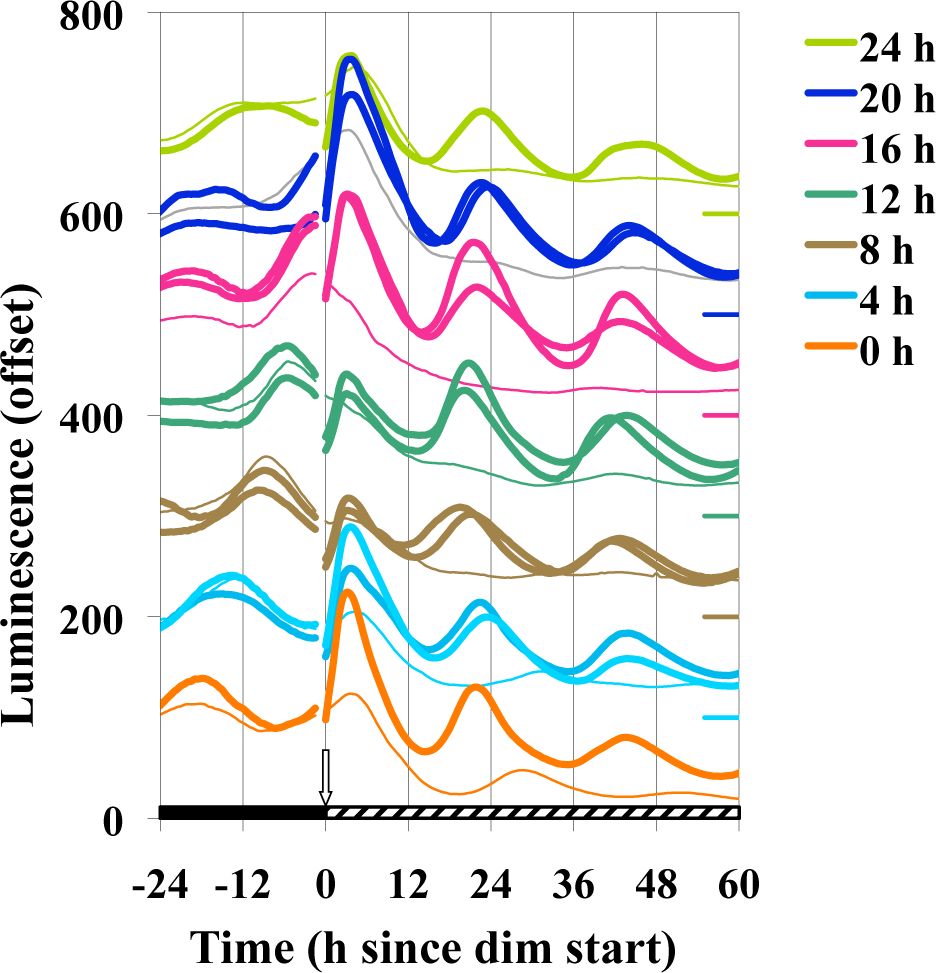
Effect of circadian phase on the BDOR. Cultures were inoculated with frqCXB-luc and were immediately refrigerated. After 72 h the first set of plates was transferred to DD 25 °C, 4 h later a second set was transferred, and so on, so each set would be at a different phase when receiving the light pulse. The first set removed is referred to as 0 h, the set removed 4 h later as 4 h, and so on. Then 149.5 h after the first plate transfer, a 60-min light pulse (19,000 nmol m−2 sec−1, 25 °C; thick lines) was simultaneously given, followed immediately by transfer to dim light (2.4 nmol m−2 sec−1). Control cultures that received no light pulse are represented by thin lines. The data are vertically offset for easier visualization, and the zero level is indicated by a short line on the right axis with the corresponding color (as will be the case for subsequent offset figures). Other experimental conditions are the same as Figure 1.
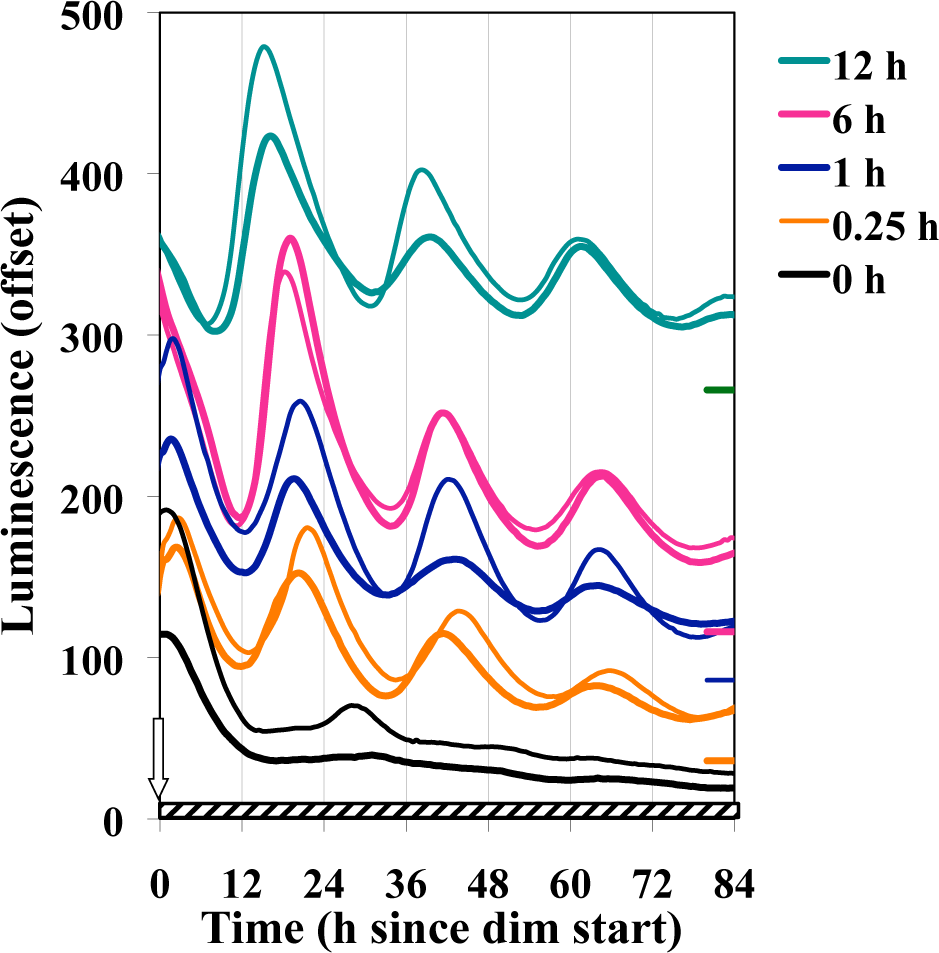
Effect of the duration of the bright light pulse on the BDOR. Experimental conditions are the same as in Figure 1, except the different cultures received different lengths of time of bright light exposure (19,000 nmol m−2 sec−1) just prior to dim (2.4 nmol m−2 sec−1).
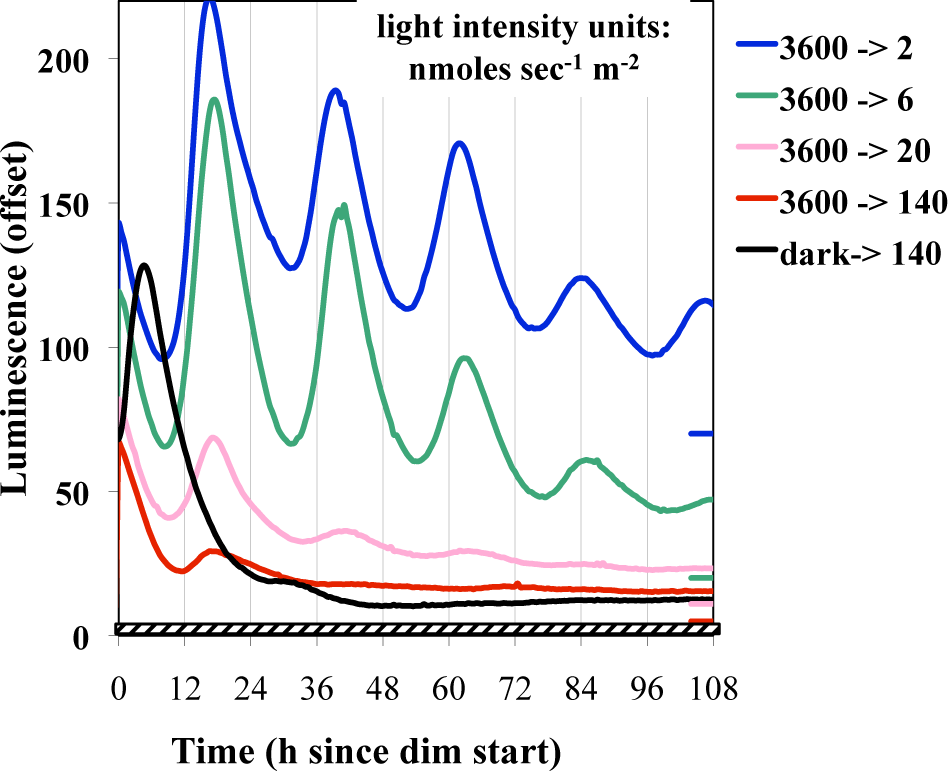
Effect of different levels of dimness on the BDOR. Cultures were exposed to 12 h of bright light (3600 nmol m−2 sec−1) and then placed into dim light (except for one dark control). Different plates were exposed to different levels of dimness, as indicated.
To determine whether the bright light pulse had to occur immediately before the transfer to dim, we conducted experiments where the 15-min light pulse was given at other times prior to the transfer to dim. We found that an excellent response occurred if the pulse was 2 to 6 h before the transfer to dim and that some response was seen even at 76 h (Fig. 6). The phase of the eventual rhythm tends to relate to the time the cultures experienced lights-off at the end of the light pulse rather than light-onset associated with the dark to dim transfer. This is consistent with the bright light pulse eliciting a strong (Type 0) response and the dark-to-dim shift a weaker Type 1 phase response (Johnson et al., 2004).
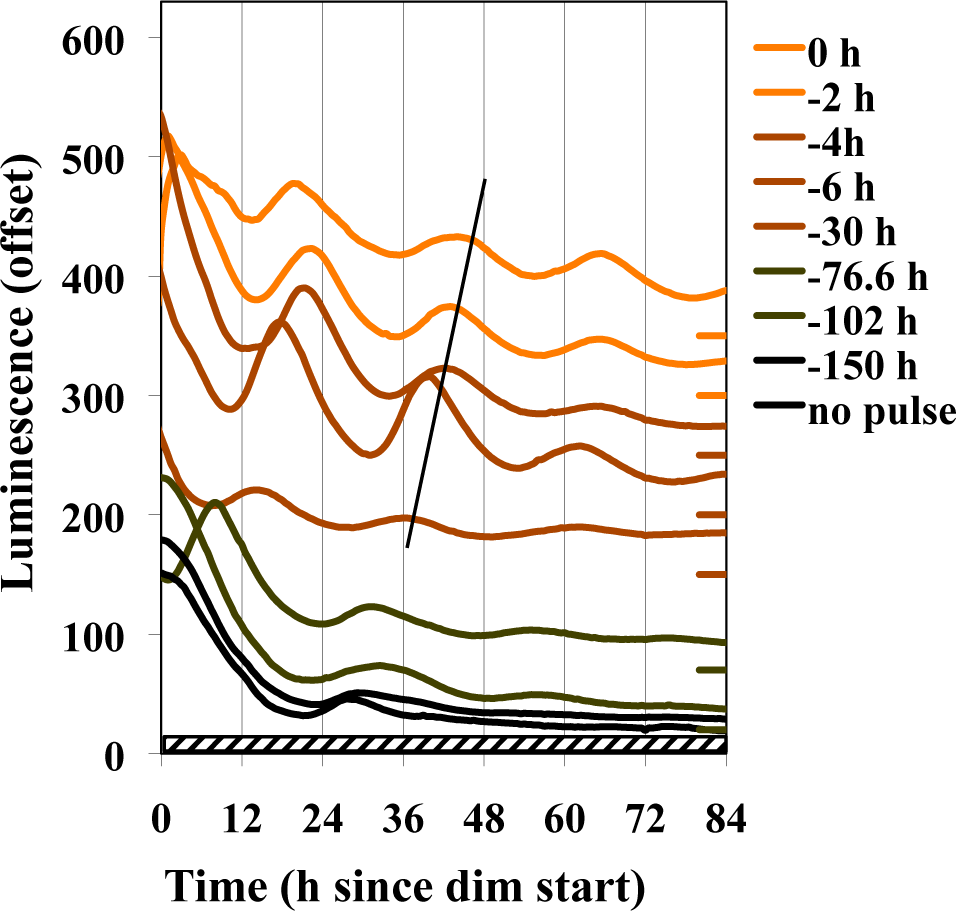
Effects of a 15-min light pulse at different times before the transfer to dim light. Plates inoculated with frqCXB-luc were immediately refrigerated for 91 h and then placed into the measuring chamber (25 °C, DD). The cultures were exposed to 150 h of darkness before being transferred to dim (2.4 nmol m−2 sec−1), with the darkness being interrupted by a 15-min light pulse (19,000 nmol m−2 sec−1) at the indicated times before dimness. The slanted line tracks the end of the light pulse.
Experiments thus far have documented the existence of the BDOR and characterized it, but they have provided few insights into a mechanistic explanation. We reasoned that the BDOR could be just an acute effect of bright light treatment (causing an acute and transient increase in FRQ levels), or it could additionally reflect the effect of light on the clock. To examine these possibilities, we used temperature treatments that would be expected to influence the clock, by affecting frq expression, but not to trigger other responses attributable to light effects. Previous experiments have shown that phase response curves using high temperature pulses are nearly identical to those using light pulses (Gooch et al., 1994), and low temperature can reset the phase of Neurospora rhythms as well (Gooch et al., 1994). Therefore, we asked whether either a high-temperature pulse or a low-temperature pulse could be used in place of a light pulse to yield the BDOR (Fig. 7A). The samples given the light pulse gave the strongest BDOR. The warm pulsed cultures showed erratic oscillatory responses, and some cold pulsed cultures showed a weak oscillatory response while others showed none. Control cultures given the same temperature pulses, but transferred back to dark rather than dim light, showed expected phase shifts and good rhythmicity (Suppl. Fig. S2) indicating that the cells tolerated the temperature pulses well and that the poor response in dim light was not due to thermal senescence or cell death. These data suggest that the BDOR is more than just an acute response to light and that it involves the circadian system. The circadian nature of the rhythm was further confirmed by using the same frqCXB-luc reporter system in a frq7 mutant genetic background that confers a longer circadian period of about 29 h. Figure 7B shows that this strain indeed demonstrates the BDOR and that the period in the dim is indeed longer (the period of frq7 strain was 27.9 compared with 22.7 h of the wild-type frq strain.)
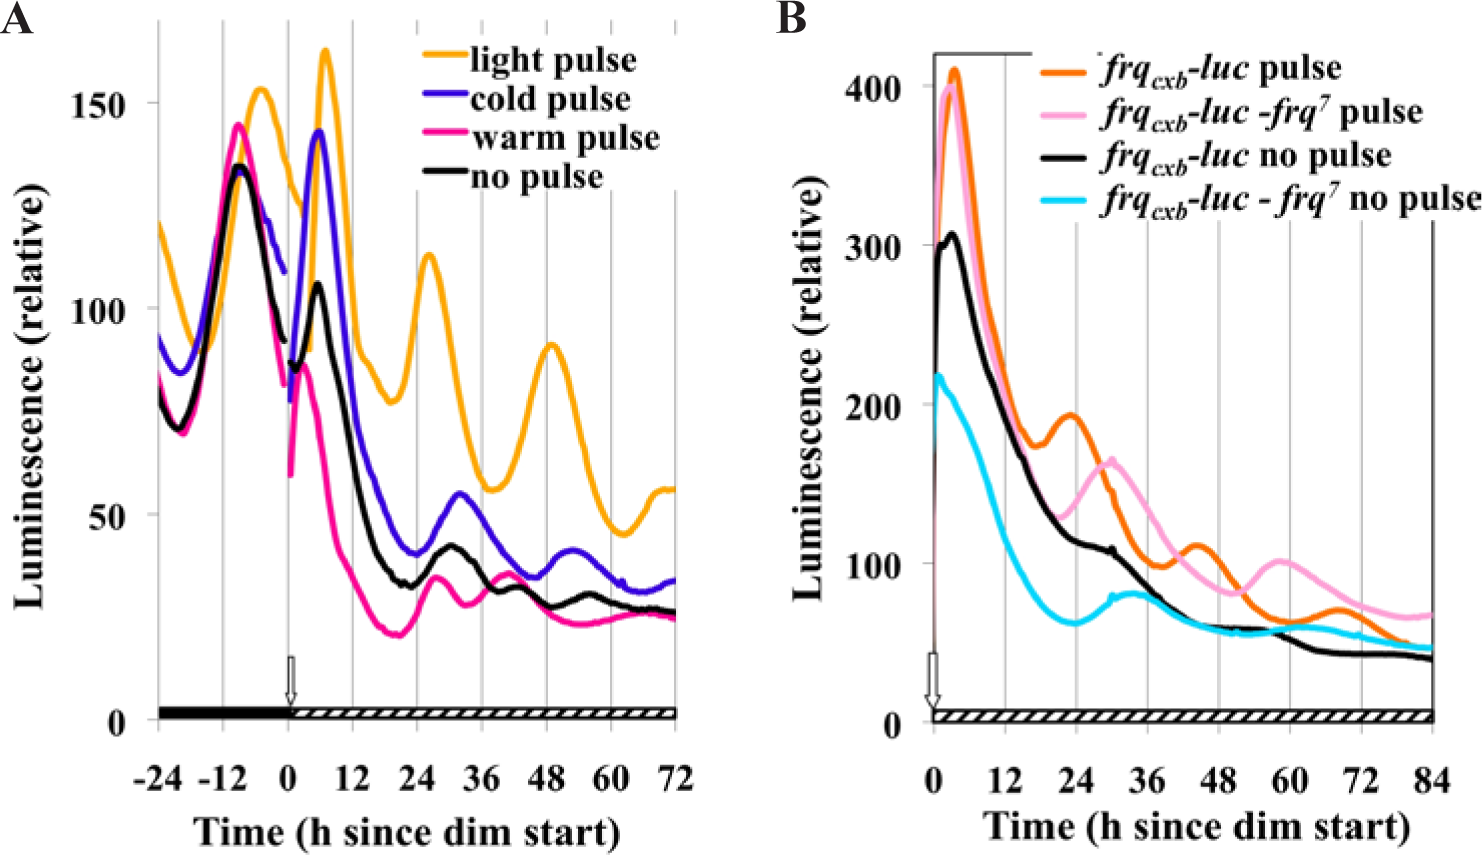
BDOR involves the clock mechanism rather than an acute effect of light. (A) Temperature pulses can elicit the BDOR but are not as effective as light. The same experimental conditions were used as in Figure 2. All pulses are for 15 min just prior to going to dim light (2.4 nmol m−2 sec−1). The light pulse was 19,000 nmol m−2 sec−1 (25 °C). The agar temperature after the 15-min warm pulse was 39 °C and for the cold pulse it was 13.7 °C. (B) The BDOR in a circadian mutant genetic background. Cultures of frqCXB-luc were compared with frqCXB-luc - frq7. These cultures were refrigerated for 69 h and then placed into the measuring chamber (25 °C, DD). The cultures were exposed to 150 h of dark before receiving a 15-min light pulse (19,000 nmol m−2 sec−1, 25 °C) and then they were transferred to dim (2.4 nmol m−2 sec−1). The data were curve fitted to determine the periods: frqCXB-luc, 22.7 h; frqCXB-luc - frq7, 28.9 h.
A series of papers has emerged elucidating the role of the VVD protein in modulating the activity of the WCC and in allowing rhythmicity in dim light, as present under a full moon (Chen et al., 2010a; Hunt et al., 2010; Malzahn et al., 2010). Given this, the simplest interpretation of our results is that bright light simply increased VVD levels, allowing the oscillator to function in dim light. The simplest direct test of this hypothesis is to look for the BDOR in a vvd-null strain. Figure 8 shows that the vvd knockout strain still shows the BDOR, albeit perhaps not as strong. We have conducted other experiments with a frqluc translational fusion strain (Suppl. Fig. S3) and compared that with a vvd knockout of that strain. Again, the light to dim response is seen in both, with the vvd knockout strain again seeming to have a weaker but still apparent response. Importantly, the vvd null strains used for these experiments show the characteristic phase delay in going from LL to DD that is expected in the absence of VVD (see Fig. 8) (Elvin et al., 2005).
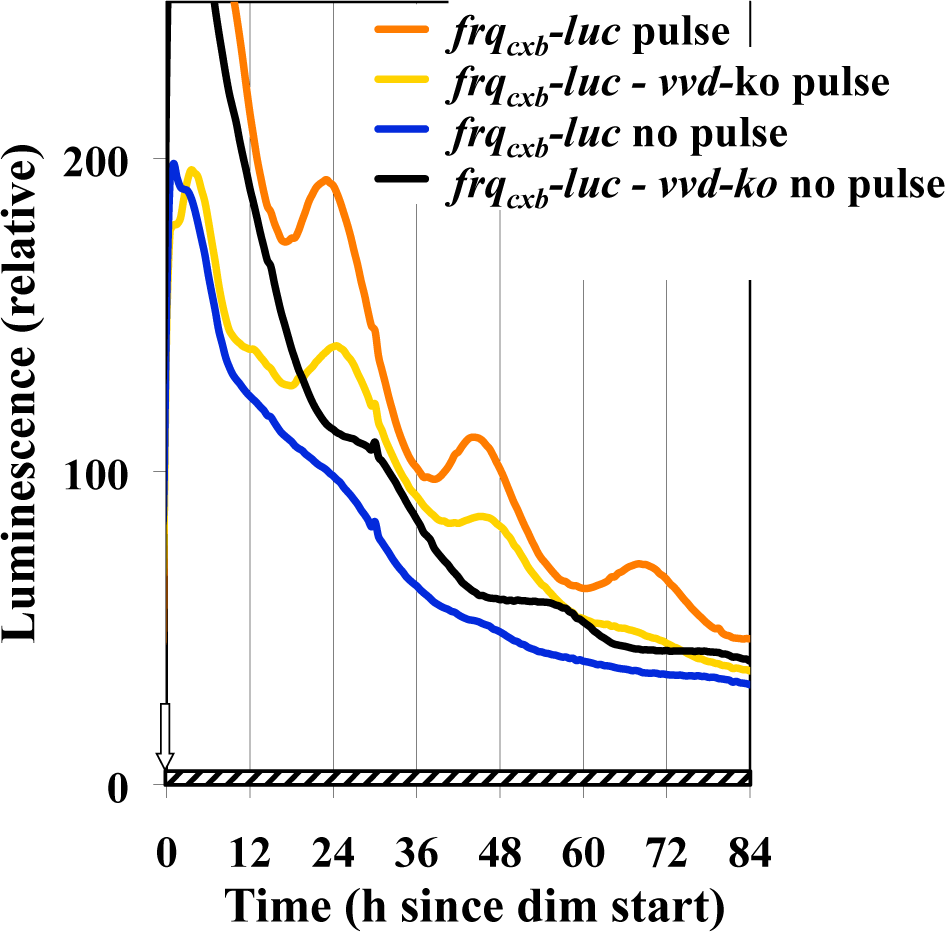
VVD is not required for the BDOR. Plates inoculated with the frqCXB-luc or the frqCXB-luc, Δvvd strains were refrigerated for 69 h and then placed into the measuring chamber (25 °C, DD). The cultures were exposed to 150 h of dark before receiving a 15-min light pulse (19,000 nmol m−2 sec−1, 25 °C), and then they were transferred to dim (2.4 nmol m−2 sec−1). The controls were directly transferred to dim without a light pulse.
Discussion
We have observed circadian oscillations in Neurospora in dim light, by applying a short light pulse prior to transferring to constant dim light conditions (Fig. 1). This light pulse can be as little as 15 min (Fig. 4), and it can be performed up to 3 days before going into dim (Fig. 6). Since all documented photoresponses in Neurospora involve WCC, it is likely that the BDOR also is mediated by the WCC. Indeed, it is known that WCC itself can respond to bright light in as little as a few seconds (Crosthwaite et al., 1995; Froehlich et al., 2002). Once activated by bright light and then placed back into darkness, the decay of activated WCC is thought to be on the order of 4 h (Chen et al., 2010b; Malzahn et al., 2010). However, the “memory” of the bright light event in BDOR can last over several days, as shown by our experiments (Fig. 6). Thus, it is not likely that light-activated WCC itself is the source of this memory; rather, the memory is probably a product of the light-activated WCC. Since activated WCC can stimulate transcription of many genes (Chen et al., 2010b; Smith et al., 2010), there would be a long list of candidates that might account for this molecular memory. VVD is known to repress light-activated WCC, and thus one could envision its presence in allowing oscillations in dim light after a bright light response. VVD has even been referred to as “a molecular memory of the brightness” (Malzahn et al., 2010). However, although published data suggest that VVD does not last for days in the darkness (Elvin et al., 2005), it is possible that very low (but physiologically relevant) levels could still exist. Most important, it is probable that VVD is not solely responsible for BDOR because the response tends to still exist in vvd-null strains (Fig. 8 and Suppl. Fig. S3).
We repeatedly see that a dim-to-dark transition sets the phase such that a peak occurs about 26 h after the transfer, independent of the starting phase) (e.g., Fig. 1); in contrast, dark-to-dim does not set the phase (e.g., Fig. 6). When we use light pulses of different durations before transfer to dim (Fig. 4), we see that once in dim it is not the previous bright onset that sets the phase—rather, it is primarily the bright-to-dim event. These data show that a step-down in light tends to set the phase while the step-up from dark-to-dim does not. Since there are no oscillations in bright light, we do not know whether a step-up to bright light sets phase, but we can at least say from Figure 4 that bright-to-dim resets the phase. Therefore, we conclude that a step-down in light (dim-to-dark or bright-to-dim) is important in setting phase, as has been previously concluded (Elvin et al., 2005). Having said this, it is important to note that there is some variation in the phase after the step-down event, depending upon previous conditions (Figs. 4 and 6). This variation is consistent with other circadian data and limit cycle modeling that show a step-up or step-down can largely set the phase, but other previous conditions will also have an effect on that phase (this issue is beyond the scope of this paper, but Johnson et al. 2003 provide an excellent and detailed discussion). Molecularly, it has been shown that phase setting at dark-to-light is affected by the rapid production of VVD at light-onset, which in turn diminishes the stimulatory effect of activated WCC on frq transcription (Elvin et al., 2005; Malzahn et al., 2010). The events that occur at dark-onset have not been studied as well, but no events of molecular activation have been demonstrated in Neurospora at dark-onset (private discussions). Presumably, dark-onset leads to a relatively slow decay of molecules that had been light activated, and such decay apparently allows for the start of a sequence of events that have a major effect in setting the phase of the subsequent Neurospora circadian rhythmicity in DD.
Examination of the data of Figure 1A of frq-luc during 12L:12D treatment, where L is dim light, gives the appearance of entrainment to a 24-h cycle. However it is not clear whether this is true entrainment or a one-time response at each lights-on event, thus creating a masking effect. The rapid light induction response is thought to be primarily due to the pLRE, while the Clock box is largely responsible for the circadian kinetics. When using frqCXB-luc, which contains a nonfunctional pLRE (Fig. 1B), there appears to be no transient change with the lights-on event. Moreover, there is a clear rise in luciferase levels, reflecting an increase if C-box regulated transcription, before the transitions from dark to dim light. Interestingly, there appears to be no transient change at lights-off either; nevertheless, it does seem to be entraining to this dim-dark cycle. It is interesting that no peak is observed in the first day of entrainment in this frqCXB-luc reporter strain (these repeated observations are examined more closely in another publication, Gooch et al., 2014).
It has been previously shown in Neurospora that a warm temperature pulse has a similar phase resetting effect as a light pulse (Gooch et al., 1994). We conducted control experiments showing that a 15-min 40 °C pulse in DD does give strong phase resetting similar to light (e.g., Suppl. Fig. S2). However, the data in Figure 7 show that a warm temperature pulse does not replace the light pulse in eliciting the BDOR, thus suggesting that warm temperature and light are not creating the same molecular events. Part of the BDOR effect could be due to the light pulse synchronizing out-of-phase individual oscillators in a culture. However, a temperature pulse should have the same synchronizing effect, yet a warm pulse does not mimic BDOR, thus speaking against any important role regarding synchronization. Another consideration is that Neurospora grows as a syncytium so that the many clocks are in the same cytoplasm and should largely constitute a very tightly integrated synchronized culture regardless of lighting conditions. If synchronization is playing a role, then our experiments are unmasking oscillations in dim light that have not been previously seen.
We regulate conditions in a laboratory to study circadian rhythms for our convenience and to isolate and control the variables, but evolution and adaptation have occurred in the organism’s natural ecological environment. Persistence of a circadian rhythm, even in bright moonlight, would be important to an organism (Roenneberg and Foster, 1997; Evans et al., 2007; Rieger et al., 2007; Malzahn et al., 2010). Our experiments show that circadian rhythms in Neurospora could persist with the light intensities that occur at night after bright light exposure during the day. This response is not wholly dependent upon VVD, since frq expression seems to clearly persist in the absence of VVD under dim light conditions. While these observations reveal unexpected mechanisms regarding the Neurospora circadian system, the mechanism underlying the BDOR remains unknown.
Footnotes
Acknowledgements
We thank Brian Bourne and Jonna Maas for their help in data collection and interpretation. Grants from the University of Minnesota–Morris to A.E.J. (MAP 2008) and Jonna Maas (MAP 2008, UROP 2009) and NIH grants to J.C.D and J.J. Loros (RO1 GM34985 primarily, with GM08336 and P01 GM68087) and Fondo Nacional de Desarrollo Científico y Tecnológico FONDECYT 1131030 to L.F.L. supported the research.
Conflict of Interest Statement
The author(s) declared no potential conflicts of interest with respect to the research, authorship, and/or publication of this article.
References
Supplementary Material
Please find the following supplemental material available below.
For Open Access articles published under a Creative Commons License, all supplemental material carries the same license as the article it is associated with.
For non-Open Access articles published, all supplemental material carries a non-exclusive license, and permission requests for re-use of supplemental material or any part of supplemental material shall be sent directly to the copyright owner as specified in the copyright notice associated with the article.