
Abstract
The role of the frq gene in the Neurospora crassa circadian rhythm has been widely studied, but technical limitations have hindered a thorough analysis of frq circadian expression waveform. Through our experiments, we have shown an improved precision in defining Neurospora’s circadian rhythm kinetics using a codon optimized firefly luciferase gene reporter linked to a frq promoter. In vivo examination of this real-time reporter has allowed for a better understanding of the relationship of the light responsive elements of the frq promoter to its circadian feedback components. We provide a detailed phase response curve showing the phase shifts induced by a light pulse applied at different points of the circadian cycle. Using the frq-luc reporter, we have found that a 12-h light:12-h dark cycle (12L:12D) results in a luciferase expression waveform that is more complex and higher in amplitude than that seen in free-running conditions of constant darkness (DD). When using a lighting regime more consistent with solar timing, rather than a square wave pattern, one observes a circadian waveform that is smoother, lower in amplitude, and different in phasing. Using dim light in place of darkness in these experiments also affects the resulting waveform and phasing. Our experiments illustrate Neurospora’s circadian kinetics in greater detail than previous methods, providing further insight into the complex underlying biochemical, genetic, and physiological mechanisms underpinning the circadian oscillator.
There is extensive evidence showing that the circadian behavior of Neurospora crassa largely relies on the frq gene and related feedback mechanisms (Dunlap and Loros, 2006; Lakin-Thomas et al., 2011). Understanding frq transcription involves understanding not only the regulation of the frq promoter but also the dynamic processes that govern its expression. Recently, fine resolution kinetics of frq transcription became possible by having a copy of the frq promoter controlling a fully codon optimized firefly luciferase gene as a reporter (frq-luc) (Gooch et al., 2008). Most of the molecular core clock studies in Neurospora have concentrated on frq expression under constant conditions (constant darkness, DD), while the study by Tan et al. (2004) has been one of the few efforts to monitor frq dynamics under more realistic photo-cycle conditions. In this article, we have focused on the effects of light on frq expression.
Earlier work (Froehlich et al., 2002) has shown that there are 2 light response elements (LREs) within the frq promoter, known as the proximal LRE (pLRE) and the distal LRE (dLRE). The pLRE plays a major role in frq rapid transcriptional response to light as well as in maintaining high levels of expression under constant light conditions (Crosthwaite et al., 1995; Froehlich et al., 2002). Although the dLRE has a minor role in transcriptional light responses, it has been shown to be fundamental for frq circadian expression; not surprisingly, this region is now commonly referred to as the Clock Box or simply the C-box (Froehlich et al., 2003; Belden et al., 2007). Light activation in Neurospora is mediated by the proteins WHITE COLLAR-1 (WC-1) and WHITE COLLAR-2 (WC-2) (Chen et al., 2010b; Corrochano, 2011). These proteins form a WHITE COLLAR COMPLEX (WCC) that can bind to defined LREs in the promoters of hundreds of genes (Vitalini et al., 2006; Smith et al., 2010), controlling their fast transcriptional response to light (Chen et al., 2009) and also the circadian expression of several of them (Correa et al., 2003). Blue light, when absorbed by the FAD cofactor of WC-1, rapidly leads to a drastic increase in frq expression (Dunlap and Loros, 2005), mediated mainly by the pLRE of the frq promoter.
Two common methods are used to show the effects of light on Neurospora circadian rhythms. In one, a pulse of light is applied during a free-running circadian rhythm in constant dark (DD) yielding phase advances or phase delays dependent upon when the pulse is given in the cycle, which leads to the plotting of a phase response curve (PRC) (Sargent and Briggs, 1967; Dharmananda, 1980; Heintzen et al., 2001). Alternatively, a specific light-dark cycle (e.g., a repeated cycle of 12 h of light and 12 h of dark: 12L:12D) can be applied, yielding entrainment, whereby the period and phase of the circadian rhythm are controlled by the imposed cycle (Sargent et al., 1966; Johnson et al., 2003).
The expression of frq has been mainly followed in liquid culture by Northern and Western blots, but a luminescent reporter allows us to follow the activity of the frq promoter with much improved quantitative and time resolution on a solid medium and in real-time. In this work we use the wild-type frq promoter (frq-luc) (Gooch et al., 2008) or a modified frq promoter (frqCXB-luc) to drive a codon optimized firefly luciferase gene incorporated into the his-3 locus of Neurospora. Strains bearing these constructs simply report the activity of the frq promoter and do not modify the existing frq circadian oscillatory system. The frqCXB-luc strain contains a highly resected frq promoter bearing an intact C-box element and a nonfunctional pLRE. We favored frqCXB-luc as a reporter in many of the experiments, since it avoids complicating issues associated with direct light induction of frq expression (and therefore acute changes in LUC levels if using a full frq promoter reporter). In addition, the frqCXB-luc reporter displays a more robust rhythm while still allowing the core clock to fully respond to environmental cues.
Materials and Methods
Medium and Inoculation
FGS medium consisted of 0.05% fructose, 0.05% glucose, 2% sorbose, 1X Vogel’s salts (Vogel, 1956), 1.8% agar, and 50 µg/L biotin. This medium is autoclaved for 30 min (autoclaving the entire medium, opposed to using autoclaved components, has been found to be necessary to get good circadian activity). Potassium firefly luciferin (BioSynth L-8200 D-luciferin firefly [synthetic] potassium salt, Biosynth International, Itasca, IL) is added (25 µM). Thirty milliliters of this medium is added per small and deep Petri plate (60 mm × 20 mm). Neurospora strains are stored at −80 °C as conidial suspensions. Defrosted aliquots of 6 µL each are placed in a format of 6 dots in a circular pattern onto the FGS agar medium.
Neurospora Strains
The frq-luc strain (laboratory strain: FD11-9c: his-3::frqpromoter-luc, ras-1bd, a) has a frq promoter controlling the optimized firefly luciferase gene at the his-3 locus (Gooch et al., 2008). The frqCXB-luc strain (laboratory strain: x717-4: his-3::frqcxb-luc, ras-1bd, a) uses a resected form of the frq promoter to drive the
Lighting and Measurement of Luminescence
The measuring chamber is a light-tight box in a light-tight controlled environmental room maintained at 25 ± 0.1 °C. Every 30 min, a 2.5-min image is captured of up to 45 inverted Petri plate cultures using a liquid nitrogen cooled CCD camera (Princeton Instruments, Trenton, NJ; Spec-10; 700B/LN). If the cultures are in an illuminated phase, the lights are turned off for 3 min every 30 min to capture the luminescent image. Total luminescence, relative to background, of each plate of 6 colonies is determined and these data are plotted. The camera and lighting are controlled using Visual Basic macro programming within Microsoft Excel and WinSpec software. Lighting times and intensities of LEDs are software controlled using a PhidgetLED 64 controller board (Phidgets, Inc., Calgary, Alberta). The white LEDs (Jameco MCDL-5013UWC) have a spectral range of 420 to 750 nm, with peaks at 455 and 550 nm. White bars along the x-axis of the graphs indicate times of light exposure; dark bars, darkness; and slashed bars, dimness. Light intensity was measured using a Licor quantum sensor (Licor, Lincoln, NE). With the exception of Figure 2A, light from the LEDs was about 5 cm above inverted Petri plates with the light intensity (µeinsteins sec-1 m-2) at different surfaces being as follows: upper plate surface, 1.6; agar surface, 1.0; and lower plate surface, 0.65, all of which were used at durations that were saturating for Neurospora photoresponses (Crosthwaite et al., 1995). In this report, we use the value at the agar surface of 1 µeinsteins sec-1 m-2, but one must appreciate that mycelia grow completely throughout the agar and it is not obvious what the light intensity is at the light receiving components within the cell.
Curve Fitting
In some figures, free-running oscillatory data are fitted by use of a modified cosine function using Solver of Microsoft Excel 11.5 for Macintosh. The fitted cosine equation allows for an exponential amplitude and an exponential mesor: Luminescence = M * e(MD*t) + A * e(AD*t) * cos (2π (t-P)/τ), where t is time, τ is the period, P is the phase, A is the amplitude, AD is the amplitude decay, M is the mesor (a rhythm-adjusted mean), and MD is the mesor decay.
Phase Setting by Light Treatment
Phase resetting by light pulses at different phases of the circadian cycle
The frq-luc strain of Neurospora was grown for 3 days in DD at 25 °C, and then all plates were placed in a refrigerator (4 °C) for 2 days; the return to 25 °C sets the phase, which can be documented by data prior to light treatment. Over 48 h, at 2-h intervals, a pair of plates was removed from the refrigerator and placed into the measuring chamber at 25 °C DD. In this way, each pair of plates was 2 h out of phase with the previous pair. Then, a single 15-min light pulse was given of 0.029 µeinsteins sec-1 m-2 from a rack of white LEDs 1 m away.
Phase resetting by light exposure of different durations
The frqCXB-luc strain of Neurospora was grown for 4 days in DD at 25 °C, and then all plates were placed in a refrigerator (4 °C) for 2 days to set the phase. Plates were removed from the refrigerator at 2-h intervals and placed into the measuring chamber at 25 °C in LL (1 µeinsteins sec-1 m-2) such that different plates were receiving different durations of light exposure. At a specified time, the lights were turned off and measuring commenced.
Results
Analysis of a frq-luc Neurospora strain colonized on a sorbose medium yields detailed changes in amplitude and time resolution (Fig. 1). The free-running circadian waveform in constant darkness (DD) fits well to a cosine curve (red curve of Fig. 1). There are obvious growth, aging, and damping issues in cultures; therefore, cosine curves are fitted to allow for an exponential mesor (a rhythm-adjusted mean) and exponential amplitude in our least squares fitting algorithm. The fitting in Figure 1, in DD, yields a period of 22.2 h. It is well known that a circadian rhythm, including that of Neurospora, can be phase shifted by a pulse of light. At h 252, a 27-min light pulse is given that initially induces a large increase in the luciferase signal, reflecting an acute induction of the frq promoter, as previously described (Crosthwaite et al., 1995; Shrode et al., 2001; Chen et al., 2009). After the light perturbation, it takes about 20 h before a fittable cosine curve reappears corresponding to a 9.2-h phase advance (Fig. 1). Typically, a light pulse “reinvigorates” the rhythm, leading to more robustness and larger amplitude in comparison to continued exposure to constant dark.
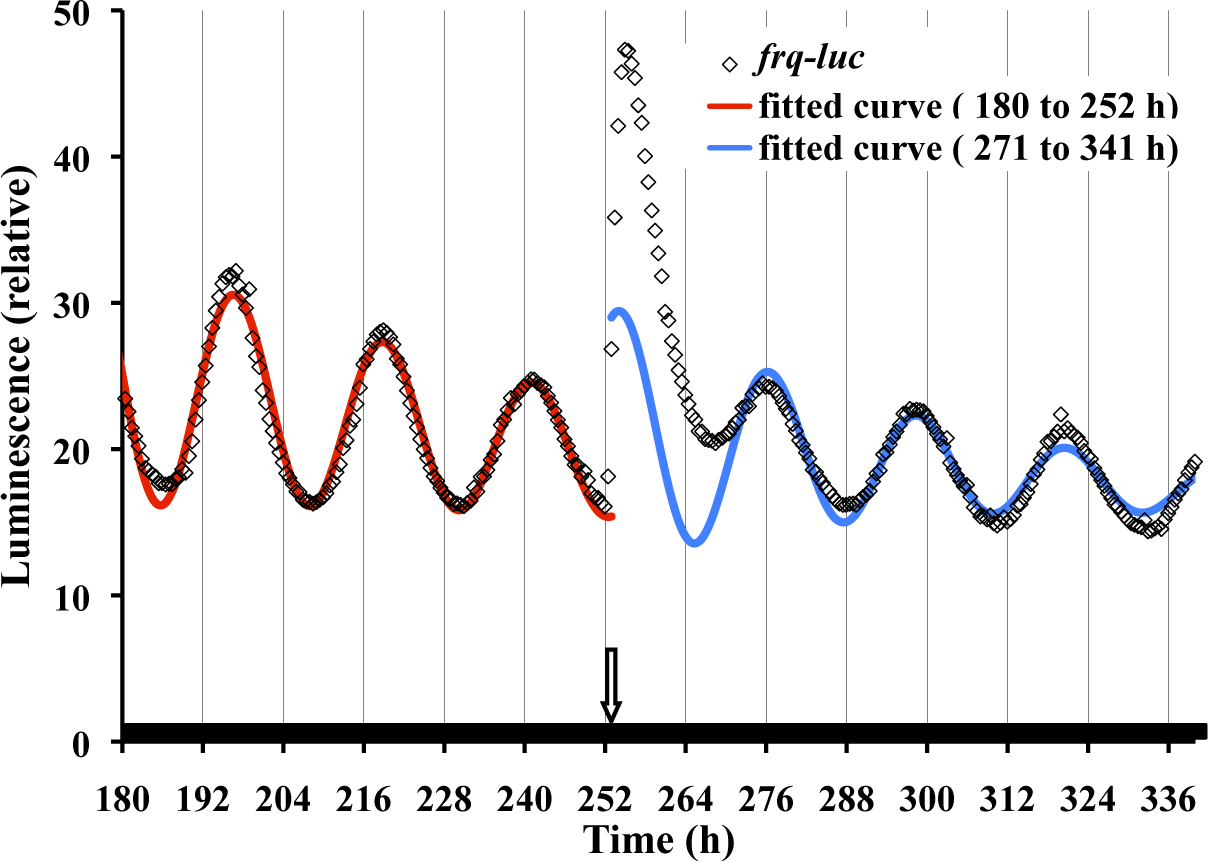
Luciferase is a precise reporter of frq expression under free-running conditions. Neurospora frq-luc was inoculated onto FGS medium. Petri plates were placed in the measuring chamber at 25 °C at time 0 and exposed to 7 days of 12L:12D treatment, with the last light cycle ending at 156 h. At h 252, a 27-min light pulse was given, represented by a downward arrow. Light intensity at the culture surface was 1 µeinsteins sec-1 m-2 from 64 LEDs suspended about 5 cm over the plates. Data from h 180 to 252 were fitted with a cosine curve (red curve), allowing for an amplitude decay and mesor decay (see Materials and Methods). The fitted curve has an R2 value of 0.97 and a period of 22.2 h. Data from h 271 to 341 are also fitted (blue curve), and for comparison reasons they are back-extrapolated to h 252. Individual datum points are shown in the figure but, for simplicity, are not shown in other figures.
An important method of studying circadian rhythms has been to apply a light pulse at different points of the circadian cycle and then determine the degree of phase shifting, thus ultimately producing a phase response curve (PRC) (Heintzen et al., 2001; Johnson et al., 2003). The level of phase shifting is very dependent upon the time within the circadian cycle at which the light pulse is applied. Sargent and Briggs (1967; see their Figs. 4 and 5) show the first published PRC of Neurospora, using a 45-min light pulse at different phases of the conidial banding circadian cycle. It is difficult to generate a phase response curve that only reflects Neurospora’s response to light, since incandescent and fluorescent lights also generate heat, and it is known that Neurospora circadian rhythmicity is very responsive to temperature changes (Gooch et al., 1994; Liu et al., 1998; Gooch et al., 2008). Therefore, we conducted a detailed phase resetting experiment with the frq-luc reporter in a highly controlled thermal environment and using LED lighting, which produces little heat and no measurable change in temperature in our system (Fig. 2A). Our goal was also to obtain highly precise phase response data over a 2-cycle period. This was achieved by using curve fitting on the resulting waveforms with data collected every 30 min over 48 h. Furthermore, we used a strain that directly reports the promoter activity of the core oscillatory feedback loop, thus avoiding the effects of acute light regulation on a hand of the clock such as the conidiation process. The result is seen in Figure 2A, whereas a more classic plotting of the PRC is shown in Supplemental Figure S1a and the same data are plotted as a phase transition curve (PTC) in Supplemental Figure S1b. Our data, obtained using 15-min light pulses, show very strong phase resetting known as type 0 (yielding averaged curves with a zero slope in a PTC plot; Winfree, 1980). When compared with a previously determined Neurospora light PRC (Dharmananda, 1980) and temperature PRC (Gooch et al., 2008), the curves are very similar (Suppl. Fig. S2).
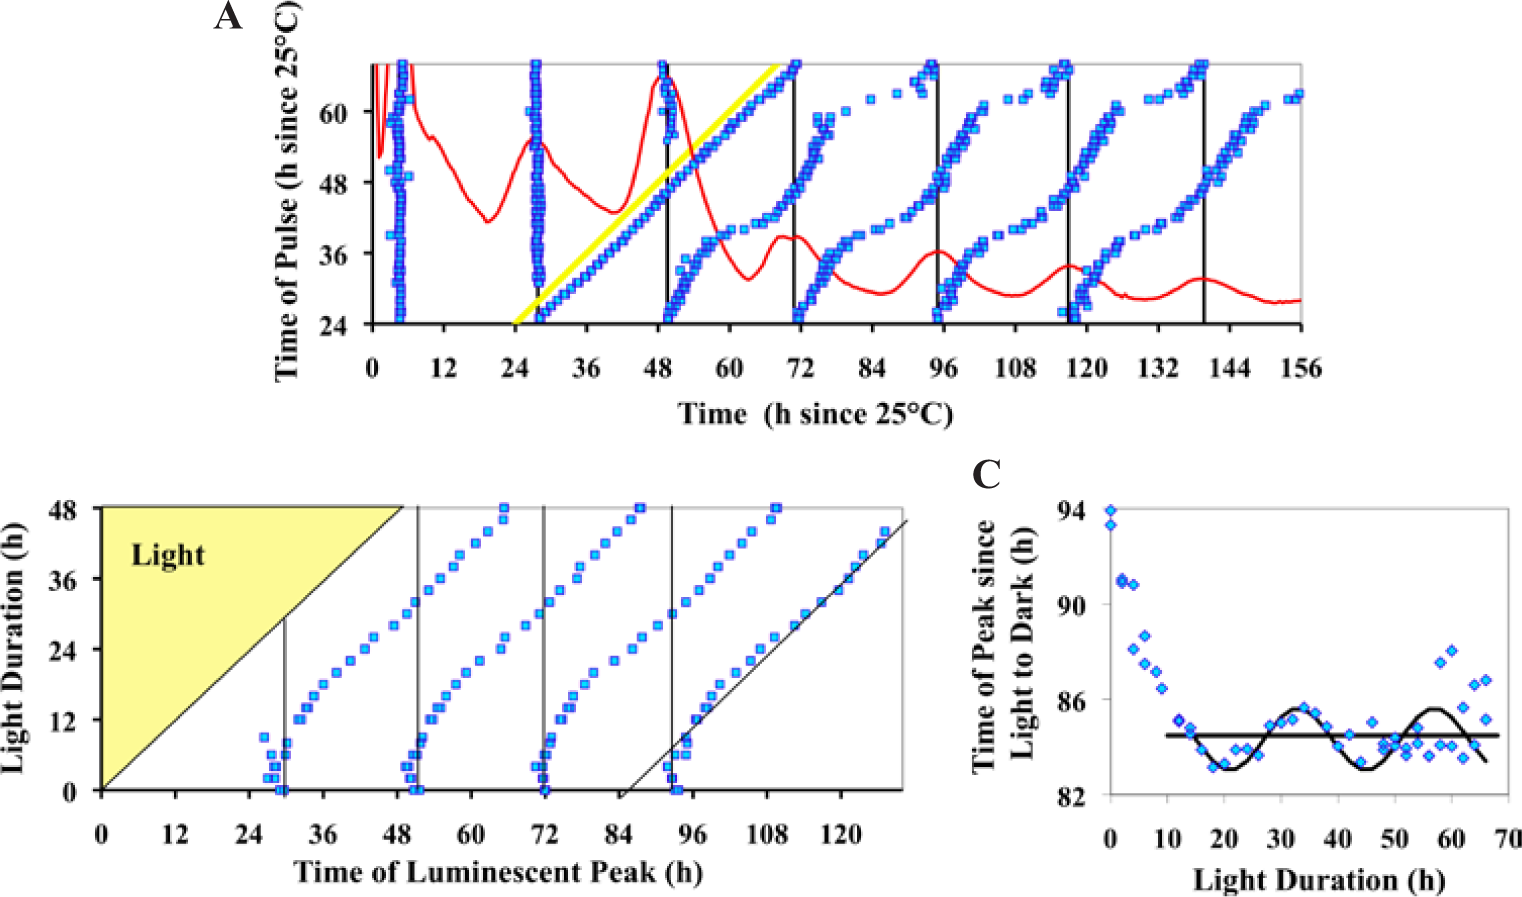
Neurospora displays strong phase setting in response to light. (A) The frq-luc strain of Neurospora at different phases of the circadian cycle, was exposed to a single 15-min light pulse (0.029 µeinsteins sec-1 m-2) (see Materials and Methods). The time of the pulse, relative to the time the culture was placed into the measuring chamber, is shown by the yellow 45° line in the figure. Peak times of luminescence were determined before and after the pulse using cosine fitting, and the average times of the peak of 2 replicate plates were plotted. The first peak after the pulse is regarded as a light-induction effect followed by circadian rhythm peaks. The vertical dark lines represent the peak times of nonpulsed controls. The red curve is the relative luminescence of a nonpulsed control. (B) Phase resetting by light exposure of different durations provides evidence for rhythmicity in constant light. Cultures of the frqCXB-luc strain of Neurospora were exposed to different durations of light (1 µeinsteins sec-1 m-2) (see Materials and Methods). Peak times of luminescence were determined as described in Figure 2A. The peak times are plotted relative to when light exposure started. The bottom row of data and vertical black lines represent cultures that received no light exposure. An average phase line is shown by the 45° black line (averaged for light duration h 6 to 48). Part C is a replot of the last peak of data relative to the time since the transition of light to dark.
Easily seeing strong type 0 phase resetting in these colonized FGS grown Neurospora was unexpected. Although many attempts have been made in this laboratory (V.G.) to observe type 0 phase resetting in Neurospora by measuring conidiation banding in race tubes using race tube medium under tightly controlled temperature conditions, we have always only observed weak type 1 resetting. At the suggestions of others, as well as after examining other publications, we have systematically tried (data not shown) (a) new wild-type bd strains from different laboratories and the Fungal Genetics Stock Center (Kansas City, MO); (b) different pHs; (c) different carbon sources and concentrations; (d) different nitrogen sources and concentrations; (e) different light spectra, intensities, and durations; (f) pulse application at different times after being in DD; and (g) and different media (such as Westergaard’s and FRIES). While conducting a similar experiment as shown in Figure 2A, we simultaneously ran the same frq-luc strain in classic race tubes and race tube medium. We analyzed the results both in the classic way of determining banding by conidia formation as well as by examining the luminescent waveforms from race tubes. The race tube cultures only showed weak phase resetting of type 1 (Suppl. Fig. S3), while the sorbose colonized cultures again reveled strong phase resetting of type 0 (Fig. 2A).
For Neurospora and other circadian systems, when given an extended bright light exposure followed by transfer to dark, the phase in DD tends to be set relative to the time of the transfer from light to dark. However, limit cycle modeling and experimentation have shown a slight oscillation (often referred to as a “wiggle”) in such data that is thought to represent circadian behavior that was occurring while in light (Saunders, 1976; Peterson, 1980; Johnson et al., 2003; Gooch, 2007). We performed such a phase release experiment using frqCXB-luc to see if this system also demonstrates the wiggle (Fig. 2B). On average, the phase of the peak after transfer from extended light to dark is 18.6 h, and there is, indeed, an oscillation around this average phase line. The wiggle has a period of about 22 to 25 h and a peak to trough amplitude of about 2 h relative to this average phase line (Fig. 2C). These data suggest that the Neurospora clock oscillates with a greatly suppressed amplitude in light, as previously suggested (Elvin et al., 2005).
Using frq-luc and classic entraining conditions of 12L:12D, we observe in replicate cultures (Fig. 3) that the waveform of luciferase levels differs significantly from the cosine curve described under free-running conditions (compare with Fig. 1). After each lights-on event in the 12L:12D treatment, there is a dramatic increase in signal, consistent with the reported acute light induction of frq expression (Crosthwaite et al., 1995; Tan et al., 2004). Typically, the waveform during the light stage shows biphasic kinetics for frq-luc. While replicate plates within an experiment are very consistent (Fig. 3), the exact timing of the biphasic kinetics varies greatly from cycle to cycle and experiment to experiment. For example, the amplitude of the peak between h 144 and 156 of Figure 3 is substantially lower than the peak before or after. Such variability is reproducible in all of the replicate plates of an experiment (Fig. 3), but another experiment with the same protocol may show very different behavior (e.g., compare during 12L:12D between h 48 and 84 of Fig. 6A). Following lights-off on a 12L:12D treatment, there is always a dramatic decrease in signal after about a 30- to 60-min delay, consistent with prior biochemical data (Tan et al., 2004). Compared with the free-running rhythm in DD, the peak to trough amplitude of the entrained cycle is much larger (up to 4 times larger). A peak of luminescent signal is observable at about 18 to 19 h after the last lights-off, and the first established circadian trough is seen at 31 h (Fig. 3).
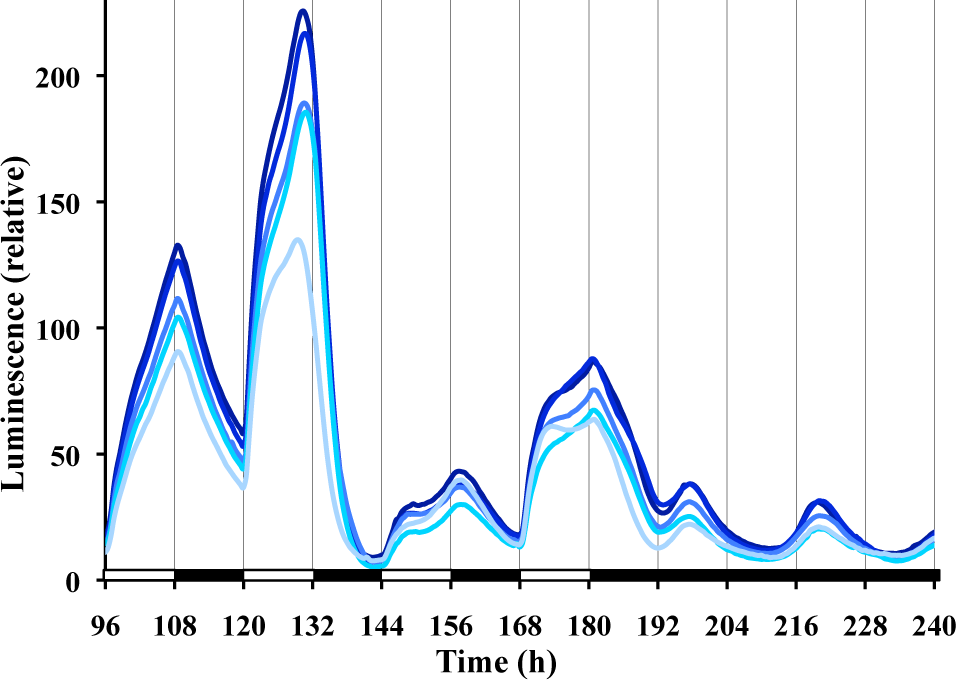
Daily waveforms of frq expression are irregular during 12L:12D cycles. The same conditions exist as for Figure 1, except time zero represents established cultures being removed from the refrigerator and placed into the measuring chamber. Different lines represent replicate cultures.
To eliminate the signals associated with light induction kinetics, we switched to a frqCXB-luc reporter, which lacks a functional pLRE. The behavior of frqCXB-luc under 12L:12D treatment is compared with frq-luc in Figure 4. The frqCXB-luc is entrained, but there is no discontinuity of kinetics at lights-on, and, in fact, the luminescent signal increases before lights-on. During the 12-h L phase, the luminescent signal increases to a peak after about 6 h and then drops with no observable biphasic kinetics. At each lights-off there is no discontinuity in kinetics of the dropping signal. Under free-running conditions of DD there is a 22-h free-running rhythm. The peaks and troughs match closely with the ultimate rhythm of the frq-luc strain in DD; however, the frqCXB-luc strain tends to have higher amplitude and a more robust rhythm.
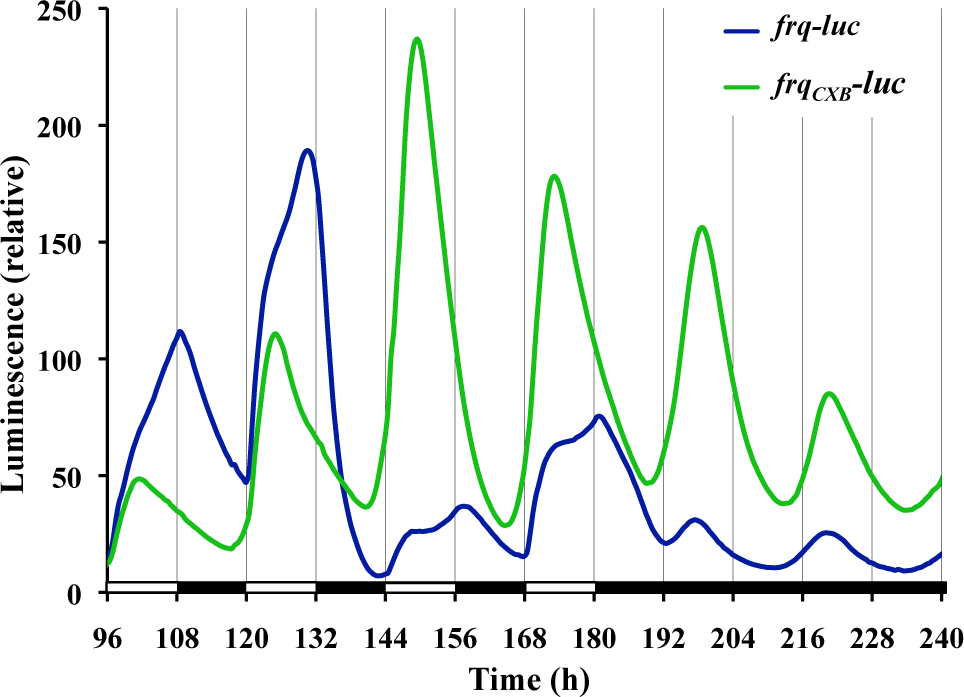
Use of a reporter (frqCXB-luc) lacking an acute light response allows separation of acute and circadian response of frq expression to light. The experimental run is the same as Figure 3. Each line is a typical trace of replicate cultures.
Knowing that a 15-min light pulse affects the phase (Fig. 1), we wanted to assess whether such a pulse every 24 h (a 1-pulse skeleton photoperiod of T = 24) would be strong enough to entrain the circadian clock and to what extent just a 15-min pulse of light per day would affect the waveform. For the data in Figure 5A, the first photoperiod light pulse was given in accordance with the time of lights-on of the previous 12L:12D treatment, while in Figure 5B the first light pulse correlated with the last lights-off of the previous 12L:12D treatment. In both cases frq-luc cultures show rapid light induction when the 15-min light pulse is initiated, and this is repeated every 24 h during the 4-day photoperiod treatment. It is not clear whether this repeated 24-h event is true circadian entrainment to 24 h or whether it is merely a repeated light induction response to each lights-on event. Once placed back into DD, a free-running rhythm of 22 h occurs. The absence of a functional pLRE removes the rapid light induction effect on frq expression (Fig. 5, frqCXB-luc reporter). The data for the frqCXB-luc reporter during the 4 cycles of photoperiod had a good fit to the damped cosine model and showed no deflections in response to the pulses. For both strains, a free-running rhythm of 22 h occurs once placed back into DD, with peaks occurring at about 24 and 46 h after the end of the last pulse, independent of when the photoperiod pulsing started. This phase is nearly the same as the unpulsed control if the photoperiod pulsing started 12 h after the lights-off of the 12L:12D treatment (Fig. 5A) but is 12 h out of phase of the unpulsed control if the pulsing started 24 h after lights-off (Fig. 5B). This latter result suggests that Neurospora weakly entrains to this skeleton photoperiod, a phenomenon that can be observed with both the frq-luc and frqCXB-luc reporter strains. To make these phase adjustments, it is interesting to note that the frqCXB-luc had a period of about 22 h during the T = 24 treatment of Figure 5A but a period of 25 h during the T = 24 treatment of Figure 5B, which started at a different phase.
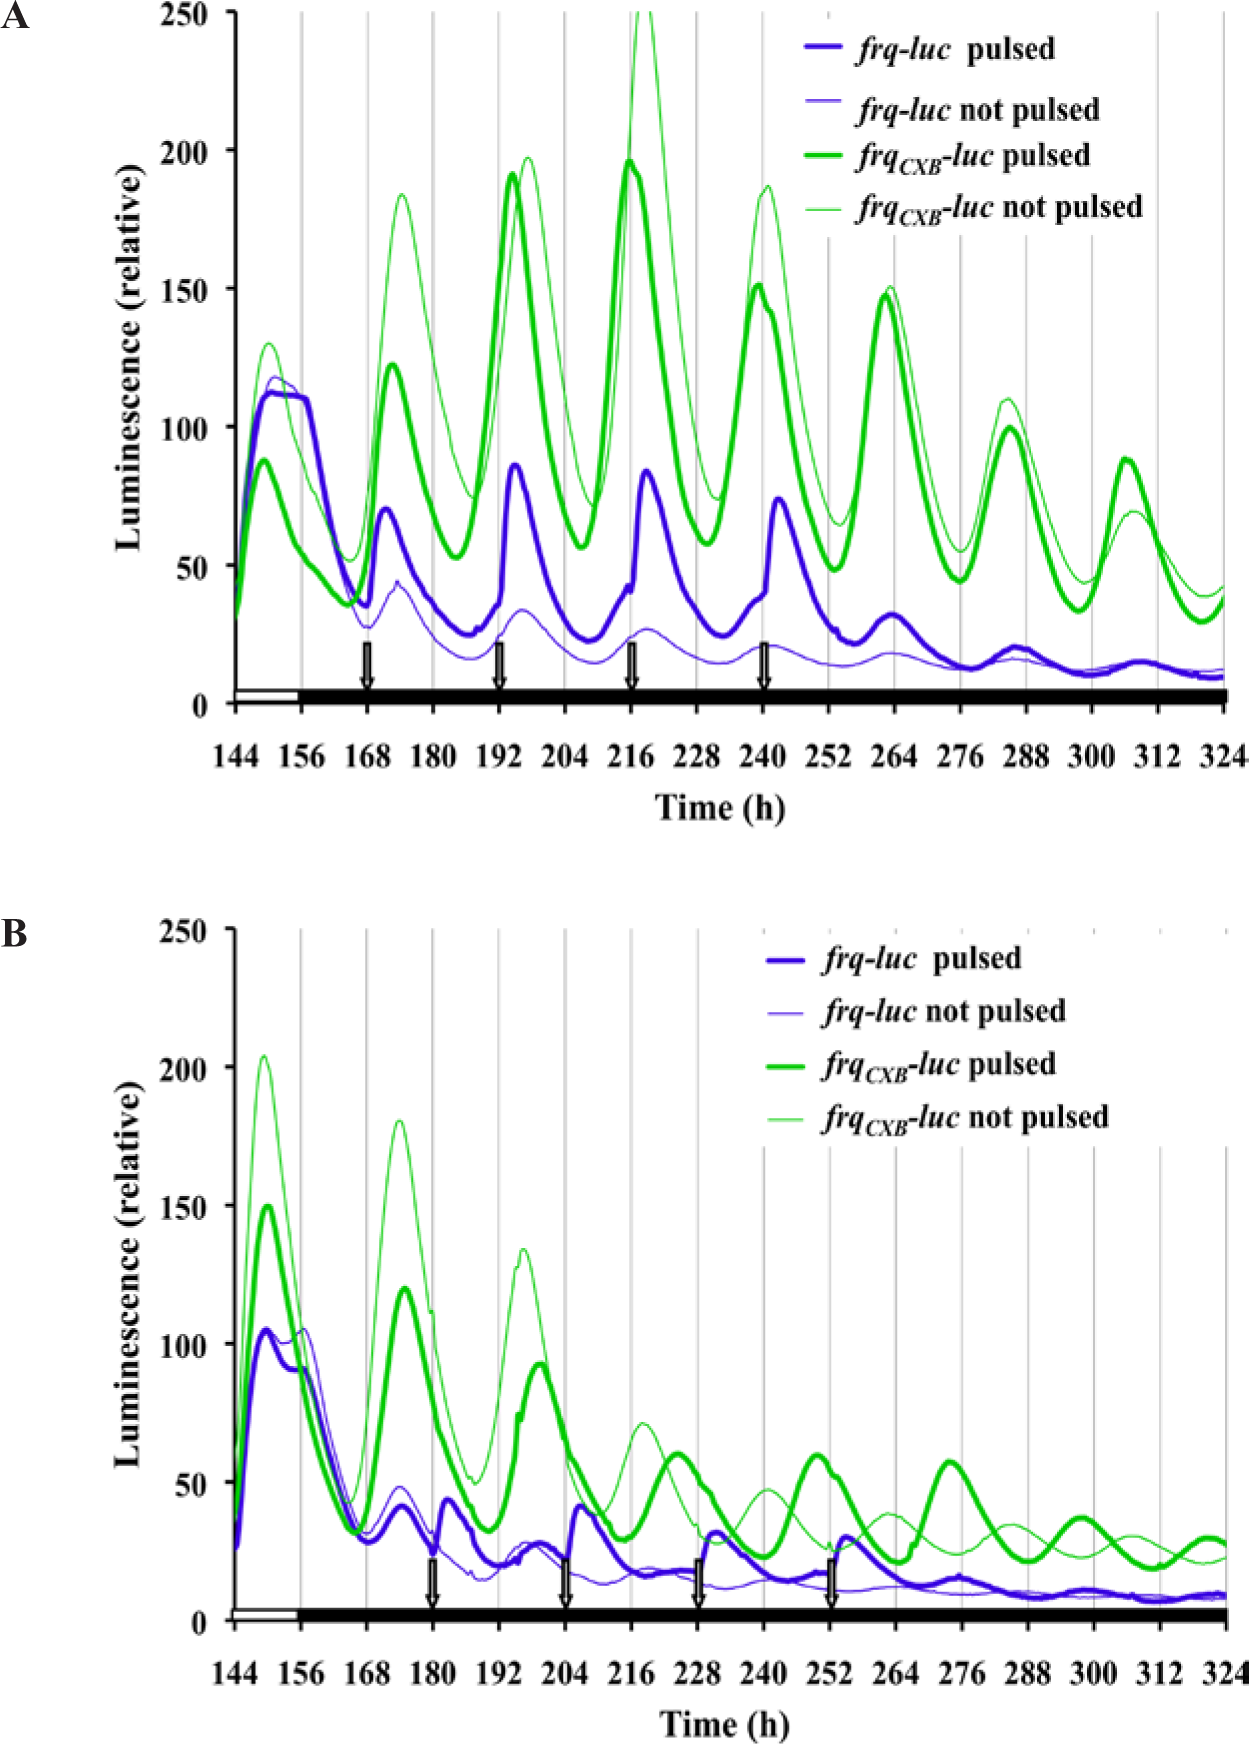
frq expression using a 24-h single pulse skeleton photoperiod shows acute circadian responses to light (T = 24). Cultures, as shown, were placed into the measuring chamber at time 0 and exposed for 7 days to 12L:12D light treatment. DD followed except for 4 events of 15-min light pulses that occurred every 24 h. Unpulsed control cultures did not receive the pulses, as they were sequestered into a dark can during the 15-min light treatment. Other conditions are as described in Figure 1. (A) Pulsing starts 12 h after lights-off of the 12L:12D treatment. Data for frqCXB-luc were fitted from 162 h to 252 h to determine the period: pulsed, 22.1 h; not pulsed, 21.8 h. (B) Pulsing starts 24 h after lights-off of the 12L:12D treatment on a new experimental run. Data for frqCXB-luc were fitted from 180 h to 264 h to determine the period: pulsed, 25.0 h; not pulsed, 22.0 h.
Instead of using an abrupt 12L:12D square wave pattern or a skeleton photoperiod pattern, we were interested in examining the effects of lighting with a timing of intensity changes more similar to a natural daily solar lighting cycle. The natural daily lighting pattern is complex and depends on latitude, longitude, air quality, shading, cloud formation, and other environmental factors (Bird and Hulstrom, 1981). We used a half sine wave pattern, which is an approximate representation of the natural solar timing. We used a 12L:12D format, and during the lighting phase the intensity was changed every minute according to a sine wave representation. The resulting entrained waveform of frq-luc (Fig. 6A) is very different from the high-amplitude angular and biphasic pattern seen using the 12L:12D square wave pattern. This waveform is also different than the cosine waveform seen under free-running DD conditions. There is a distinct increase in signal with the slightest initiation of light. The luminescent signal peaks at about the same time as the light treatment peaks. The subsequent drop in signal is slower than the initial rise. With lights-off, there is a slightly faster drop in signal. The solar wave pattern treatment yields a trough to peak amplitude about one third the magnitude of the amplitude of the 12L:12D square wave treatment.
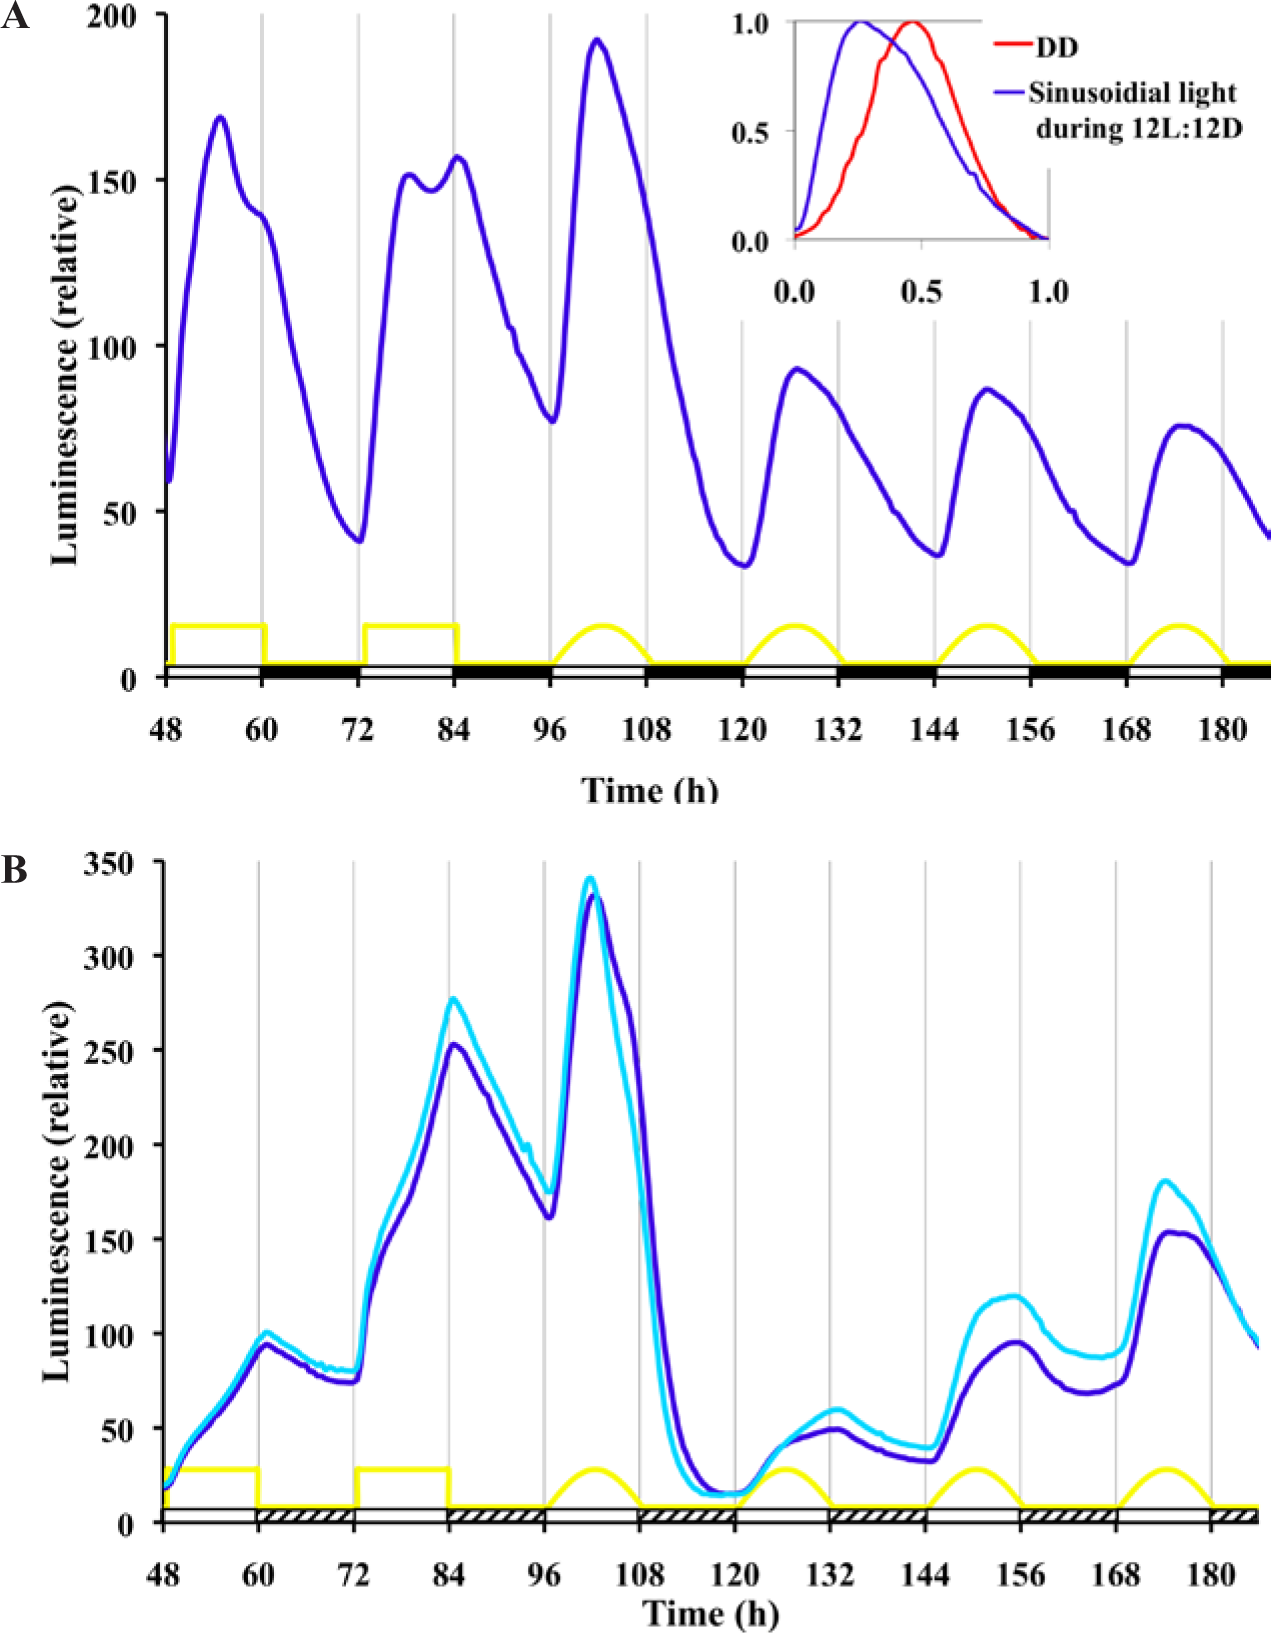
Response to a quasi-natural sinusoidal pattern of light during 12L:12D treatment reveals very different waveforms of frq expression compared with LD square waves. (A) Cultures of frq-luc are treated with 4 days of square wave 12L:12D (1 µeinsteins sec-1 m-2) and then 4 days of 12 L:12D where the light phase follows a half sinusoidal pattern adjusted every minute (yellow curve). Other conditions are the same as Figure 1. Inset: For waveform comparison, a free-running trough to trough curve from Figure 1 (hour 208 to 230) is compared with a sinusoidal treated curve of this figure (hour 144 to 168). The time and amplitude are normalized to 1. (B) Exposure of Neurospora to twilight results in a unique waveform. The experimental setup is the same as part A, except a dim light intensity (hatched bar) is used (0.01 µeinsteins sec-1 m-2) in the place of darkness. The different curves represent replicate cultures.
In nature, night is never completely dark. The level of light at night varies due to many factors that are difficult to replicate under controlled laboratory conditions. Therefore, we ran square wave and solar pattern treatment experiments, but instead of 12 h of dark, we used 1/100 of the maximal intensity (0.01 µeinsteins sec-1 m-2) that we used during the light phase (1 µeinsteins sec-1 m-2). Neurospora has a 24-h response to this twilight situation (Fig. 6B); however, the response is quite different compared with the use of complete darkness. In particular, it seems to take a couple of days to reach a stable rhythm when given the sinusoidal light-twilight treatment. It is also interesting to note that a free-running rhythm persists in constant dim light (Suppl. Fig. S4) (more deeply explored in Gooch et al., 2014).
Discussion
The ability to collect data, in vivo, every 30 min allows us to compile 48 points every 24 h, therefore providing not only a detailed description of the waveform of frq gene expression but also a better understanding of the Neurospora circadian oscillator itself (Fig. 1). A damped cosine curve fits the data of Figure 1 with an R2 value of 0.97. Light induction of the frq promoter occurs after a light pulse and peaks at about 3.3 h after the pulse. After about 20 h, the transient induction signal dissipates and the cosine free-running rhythm reestablishes itself with a new phase. The new phase depends on the point in the circadian cycle where the pulse is applied (Fig. 2A). Detailed phase response data show strong type 0 phase resetting. The light induction peak seen in Figure 2A, after lights-off, should not be regarded as independent of circadian behavior. Light induces a surge of nonphosphorylated FRQ protein that plays a major role in setting subsequent circadian phase in DD. It will not exactly set the phase, since the subsequent circadian activity will also depend on the state of the other circadian components at the time of the nonphosphorylated FRQ surge. The extent of phase resetting would also depend on the magnitude of FRQ production during light induction, which could depend on the point in the cycle that the light is applied. Thus, we tend to see a circadian peak of luciferase activity about 22.6 h after lights-off and about 19.3 h after the induction peak, but the exact peak depends on the duration, intensity, and phase of light application.
It is interesting that we were able to easily observe strong type 0 phase shifting using light pulses in sorbose colonized Neurospora while failing, despite many attempts, to do so using classic race tube medium (RTM) in race tubes. The difference is most likely either a component of the FGS medium or the colonization process itself. In FGS medium, growth is limited to a small fungal colony, in which conidiation happens early on in the process, in contrast to the race tube assay, where conidiation occurs actively while the growth front advances. When we have physically confined the growth of Neurospora while using RTM, nice circadian rhythms using the luciferase reporter are observed, yet we again fail to induce strong phase shifting (data not shown). Likewise, we transformed a colonized mutant (col-16) with the luciferase reporter and attempted to find strong phase shifting on RTM without success (data not shown). At this point, we do not know why the sorbose-colonized Neurospora seems to be more sensitized to light than dark-adapted Neurospora on RTM. It is known that VIVID (VVD) levels can modulate Neurospora’s response to light (Elvin et al., 2005; Chen et al., 2010a; Hunt et al., 2010; Malzahn et al., 2010). Whether these differences are due to extremely low levels of VVD when using FGS medium is something to consider. Nevertheless, it is important to highlight that media conditions (carbon sources) have been reported to modulate light responses, at least in the case of Trichoderma reesei (Friedl et al., 2008). Whether such a phenomenon also occurs in Neurospora, and its dependence on VVD, has not been explicitly studied.
The waveform induced by 12L:12D (Figs. 3, 4, and 6A) treatment is dramatically different than simply contracting, or expanding, the smooth waveform that we observe under free-running DD conditions (Fig. 1). The waveform induced by a light-dark cycle tends to be more angular, has much higher amplitude, shows peaks and troughs at different relative phases, and is inconsistent from cycle to cycle. It is likely that these characteristics are true for essentially all circadian rhythms and are predictable using limit cycle modeling (Johnson et al., 2003; Gooch, 2007). It is common practice to normalize the free-running DD cycle to 24 h (circadian time) and then extrapolate the peak and trough time to the time of maximum and minimum activity occurring for the organism in its natural environment (subjective day or subjective night). Such extrapolation is not justified, particularly when we know that lights-on or lights-off induces dramatic changes and that an entirely different cellular chemistry exists while lights are on. Furthermore, our 12L:12D treatments do not mimic nature since light does not suddenly appear at a constant level and then go off after 12 h. When we use solar timing in comparison to square wave lighting (Fig. 6A), we observe a distinctly less angular waveform with different relative phases (Boulos et al., 2002; Rieger et al., 2007; Rieger et al., 2012; Vanin et al., 2012). Laboratory settings are not a good approximation of natural conditions since in the natural environment the sun is intense (up to 2000 µeinsteins sec-1 m-2), there are daily temperature changes, and the temperature and light can have large variation due to clouds and weather conditions. It is not clear how these changes generate a specific circadian waveform, but it is clear that the waveform in nature is not simply a variation of the free-running circadian rhythm in DD, which compromises the use of the terms “subjective day/night” and “circadian time.” Recent studies in Drosophila have also highlighted the discrepancies of laboratory-based observations compared with what more closely occurs in nature, under progressive light and temperature fluctuations (Rieger et al., 2012; Vanin et al., 2012).
Using frq-luc, we observe biphasic kinetics during the light phase of 12L:12D treatment (e.g., Fig. 3). The biphasic nature is likely due to a combination of the light induction effects on the reporter frq promoter plus the circadian related feedback mechanisms. There is a drop in luminescent signal in response to lights-off (if the signal is already dropping at lights-off, then the signal subsequently drops faster), but the drop does not start until 30 to 60 min after lights-off (Fig. 3). The delay may be due, in part, to the decay time of luciferase mRNA after the promoter shutdown.
The rapid light induction seen with the frq-luc is dependent on the presence of the pLRE, as it can be confirmed by the use of the frqCXB-luc reporter (see Figs. 4 and 5). The biphasic behavior of luciferase levels observed during the light phase of the 12L:12D treatment is only present in the frq-luc reporter, and not when using frqCXB-luc (Fig. 4). Moreover, in the latter there is no clear discontinuity in kinetics with either lights-on or lights-off, yet the pattern is clearly conforming to the imposed 24-h cycle. In fact, the signal starts to increase 2 h before lights-on, which can only be attributed to Neurospora’s inherent circadian kinetics. The modification of the pLRE region of the frq promoter not only may be affecting the light responsiveness of the promoter but also may be reducing the responsiveness of this resected frq promoter to other feedback mechanisms.
We used a 15-min light pulse every 24 h (T = 24) to determine whether such a treatment could entrain the circadian cycle. Using frq-luc, there is an overt appearance of a perfectly entrained rhythm because of the surge of frq promoter activity after each light exposure. However, one might argue that this observation is merely a response to light-onset every 24 h and that there may be no effect on the inherent circadian mechanism, a phenomenon known as masking (Johnson et al., 2003). When we use the frqCXB-luc reporter strain, which only tracks frq circadian regulation but not frq light-induction, there is no observable deflection in kinetics at each light intensity change, which suggests no instantaneous phase shifting. However, the period during our 4 days of T = 24 treatment creates a period of about 22 h in one case and 25 h in another case, depending on the starting phase of the treatment. These results suggest that this skeleton photoperiod treatment is inducing entrainment, but it takes a few days to adjust. This is consistent with previous observations (Remi et al., 2010) that phase adjustment during entrainment, under certain treatments, seems to involve a change in velocity of the clock (nonparametric) rather than instantaneous changes (parametric). However, Roenneberg et al. (2010) argued that using such biophysical concepts may not be the best approach in thinking about circadian entrainment.
It is useful to ask whether even cycles of 12L:12D induce conforming cycles of entrainment. Phase, amplitude, and waveform of Figures 3 and 4 during 12L:12D treatment are dramatically different than simply an expansion of the DD free-running cycle. Each lights-on event of 12L:12D will cause a surge of FRQ, but at this time the other oscillating components in Neurospora may be at different stages. This could explain why we observe somewhat different patterns and amplitude during each subsequent light phase of the 12L:12D treatment. With lights staying on, other events are initiated (e.g., VVD production) and unique lights-on feedback would be enacted. A complex set of biochemical/genetic feedback mechanisms occur in the presence of light (Yu et al., 2007), and thus it is not surprising that we see complex waveforms while lights are on. If entrainment has occurred, then once released into free-running conditions the phase of the free-running cycle should correspond to that of the entrained cycle. Since phase is normally determined by the peak or trough, and waveforms forming the peak and troughs during 12L:12D treatment are very different than those during free-running, it becomes awkward to compare phases.
In nature, night also creates an interesting circumstance. When we create a light-dark cycle in the laboratory, we usually use complete darkness for the “night phase” of the experiment. Complete darkness at night is unrealistic, since there is always some level of light from stars and the moon as well as consideration of light pollution from human activity. This laboratory (V.G.) and others (Roenneberg and Foster, 1997; Evans et al., 2007; Rieger et al., 2007; Malzahn et al., 2010) have shown that the circadian rhythms can be sensitive to very low levels of light, well within the range of moonlight intensities. In Figure 6B we attempted some level of simulation of nature by using dim light during the “night-phase” and discovered that this treatment led to yet another waveform different than if it were total darkness. Experiments have repeatedly shown that light and temperature dramatically affect Neurospora biochemistry of circadian components. In nature, we should not consider circadian output to follow a smooth pattern, but rather, we can expect complex patterns related to complex responses and feedback mechanisms.
Footnotes
Acknowledgements
The authors thank Amanda (Spielman) Tembreull, Melissa Touroutoutoudis, and Alexandra Pagel for their help in data collection and interpretation. They also thank L.L. and J.C.D. for the development and supply of the Neurospora strains. NIH grants to J.C.D and J.J.L. (RO1 GM34985 primarily, with GM083336 and P01 GM68087) supported the research. Fondo Nacional de Desarrollo Científico y Tecnológico FONDECYT 1131030 to L.F.L. Undergraduate research rewards from the University of Minnesota at Morris supported the following students: A.E.J. (MAP 2008), B.T.N. (UROP 2008), J.A.F. (MAP 2006, UROP 2005), J.A.M. (MAP 2008, UROP 2009), Melissa Touroutoutoudis (MAP 2005), Alexandra Pagel (UROP 2007), and Amanda Spielman (UROP, 1999).
Conflict of Interest Statement
The author(s) declared no potential conflicts of interest with respect to the research, authorship, and/or publication of this article.
References
Supplementary Material
Please find the following supplemental material available below.
For Open Access articles published under a Creative Commons License, all supplemental material carries the same license as the article it is associated with.
For non-Open Access articles published, all supplemental material carries a non-exclusive license, and permission requests for re-use of supplemental material or any part of supplemental material shall be sent directly to the copyright owner as specified in the copyright notice associated with the article.