
Abstract
There is evidence in mammals that recovering from jetlag after westward travel is faster than after eastward travel. To understand why, mathematical models have been used, along with theories of entrainment rooted in experimental evidence. The most complete understanding relies on detailed mathematical modeling, so it is helpful to develop an intuition about why there is an east-west asymmetry. One such intuition is that humans have long periods and therefore recover better when they can delay. Although this is part of the reason, it does not explain why short-period mice also recover from westward travel faster. Our goal is to provide a simple intuition consistent with detailed mathematical theories, but which does not require mathematical expertise to follow. Here, we present the intuition that westward travel is easier to recover from because of a simple principle: delays are self-enhancing.
The mammalian circadian clock is remarkable in its ability both to maintain rhythms and to adapt to changing conditions. Humans are most keenly aware of their circadian clocks when they experience and then overcome jetlag. There is evidence that recovering from westward travel (requiring the clock to delay) is faster than recovering from eastward travel (requiring the clock to advance) in both nocturnal mammals (Yamaguchi et al., 2013) and humans (Aschoff et al., 1975), and that jetlag symptoms are more severe after eastward travel in humans (Waterhouse et al., 2007; Song et al., 2017). A common intuitive explanation of this imbalance in humans is that the intrinsic clock period is longer than 24 h, so delaying is easier. Although the intrinsic period plays a role in determining the severity of east-west asymmetry in recovery time, it does not by itself explain the process that leads to the asymmetry (Diekman and Bose, 2018). Furthermore, it does not explain why it is also easier for nocturnal mammals (with intrinsic periods that are shorter than 24 h) to recover from 8-h advances than 8-h delays (Yamaguchi et al., 2013). Here, we provide an intuitive explanation that does not rely on the intrinsic period: delays are self-enhancing, which makes it easier to recover from jetlag by repeated delays. The key idea is that light perceived during the delay zone of the phase response curve (PRC) slows down the clock, which expands the delay zone, allowing light to slow down the clock even further. This is grounded in mathematical modeling and is supported by conventional theories of entrainment (Daan and Pittendrigh, 1976).
Simple models serve as the basis for theories of entrainment that help us to understand and explain the process of entrainment to external signals (zeitgebers, or “time givers”) (Johnson et al., 2003; Roenneberg et al., 2010). Historically, there are 2 theories of entrainment: one that daily adjustments are made continuously by changing the period (Aschoff, 1979) and the other that daily adjustments are made discretely by shifting the phase (Pittendrigh and Daan, 1976). The discrete theory uses a PRC from short pulses of light to predict the stable phase of entrainment (relationship between the light/dark cycle and the internal clock). The continuous theory is built on the observation that, under constant light, the light’s intensity controls the clock’s period. Here, we use a unified theory that daily adjustments are made continuously by adjusting the phase velocity (Swade, 1969; Taylor et al., 2010). These continuous adjustments are made according to a velocity response curve (VRC), which is similar in shape to a PRC collected for a short pulse of light. Depending on the phase of the clock, its phase velocity is increased, remains the same (during a dead zone), or is decreased.
Theoretical studies consistent with the unified theory contribute to our understanding of aspects of entrainment such as seasonal adjustments (Flôres and Oda, 2020; Schmal et al., 2020), the effects of clock amplitude on its ability to be entrained (Ananthasubramaniam et al., 2020; Tokuda et al., 2020), and how the shape of the PRC leads to entrainment that is robust to fluctuations in the light signal (Pfeuty et al., 2011). In concert with simple models and theories of entrainment, mechanistic models demonstrate how changes at the molecular level can entrain an entire organism (J. K. Kim et al., 2013). Simulation and analysis identify interactions between light pathways and pharmacologically induced phase shifts (An et al., 2013; J. K. Kim et al., 2013; D. W. Kim et al., 2019) and relate gating to the phase of entrainment (Geier et al., 2005) not only in mammals but also in organisms such as flies (Bagheri et al., 2008; Roberts et al., 2015) and algae (Thommen et al., 2012). Multi-oscillator models capture the complexity of the mammalian suprachiasmatic nucleus (SCN), which contains a network of coupled heterogeneous intracellular oscillators (Antle et al., 2003, 2007; An et al., 2013). Taking into account the coupling network explains the difference between the range of entrainment of SCN and of peripheral oscillators (Abraham et al., 2010; Bordyugov et al., 2011), the role of neuropeptides on recovery from jet lag (Kori et al., 2017), and an asymmetry in the dynamics of recovery, such as recovering from eastward travel by delaying (Lu et al., 2016). Control theory allows us to devise light programs to re-entrain oscillators quickly (Bagheri et al., 2007; Serkh and Forger, 2014; Qiao et al., 2017) and has led to the development of an app to help individuals overcome jetlag (ENTRAIN; http://entrain.math.lsa.umich.edu).
In this article, we use a phase-only model and phase response analysis to demonstrate that re-entrainment after westward travel is made easier because of a simple principle: delays are self-enhancing. We then discuss the limits of the theory and how intrinsic period relates to re-entrainment. Our goal is to provide an intuitive explanation that can be formalized mathematically.
Review: Prcs and Entrainment
PRCs measure the shift in phase of rhythms after a specific stimulus, for example, 1 h of light at 100 lux (Figure 1 and Suppl. Fig. S1A). By convention, delays are negative and advances are positive. In the discrete theory of entrainment, the PRC to a short pulse of light is used to predict the phase of entrainment. Consider a mouse with a period of 23.5 h in its activity rhythms. To entrain to a 1-h 100-lux signal every 24 h, the mouse must adjust its rhythms to have a period of 24 h with a stable relationship between activity onset and the pulse. The pulse of light must arrive when the corresponding value on the PRC is −0.5 h. For that entrainment to be stable, the slope of the PRC should be negative so that shifts will adjust with the period (Suppl. Fig. S1B and S1C).
PRCs to short pulses of light measure how light affects the clock at different times of the day, but do not take into account the effects of full photoperiods of light, such as saturation or adaptation. To understand how light affects the clock at longer intervals will help both to make better predictions and to provide insight into how the delays and advances change.
Experimental Prcs Show that Delays are Self-Enhancing
PRCs were collected for Mus musculus activity rhythms with 1-, 3-, 4-, 6-, 9-, 12-, and 18-h pulses of light at 100 lux (Figure 1a). As the duration of the light increased, so did the relative area under the curve in the delay zone, which we call the delay zone dominance (DZD). DZD is computed according to D/(A + D), where D is the area under (the absolute value of) the curve in the delay zone and A is the area under the curve in the advance zone (Figure 1b). The value of DZD increases from 0.7 for a 1-h pulse to 1 for an 18-h pulse, indicating that for mice delays dominate with longer light. Comas et al. (2006) determined that PRCs to shorter pulses of light could predict those to longer pulses, if the effects of light were reduced to 22% after the first hour. This relationship between short and long pulses is consistent with the unified theory of entrainment. Furthermore, it provides evidence that delays are self-enhancing in the mouse circadian clock and motivates us to examine the principle from the perspective of the unified theory of entrainment.
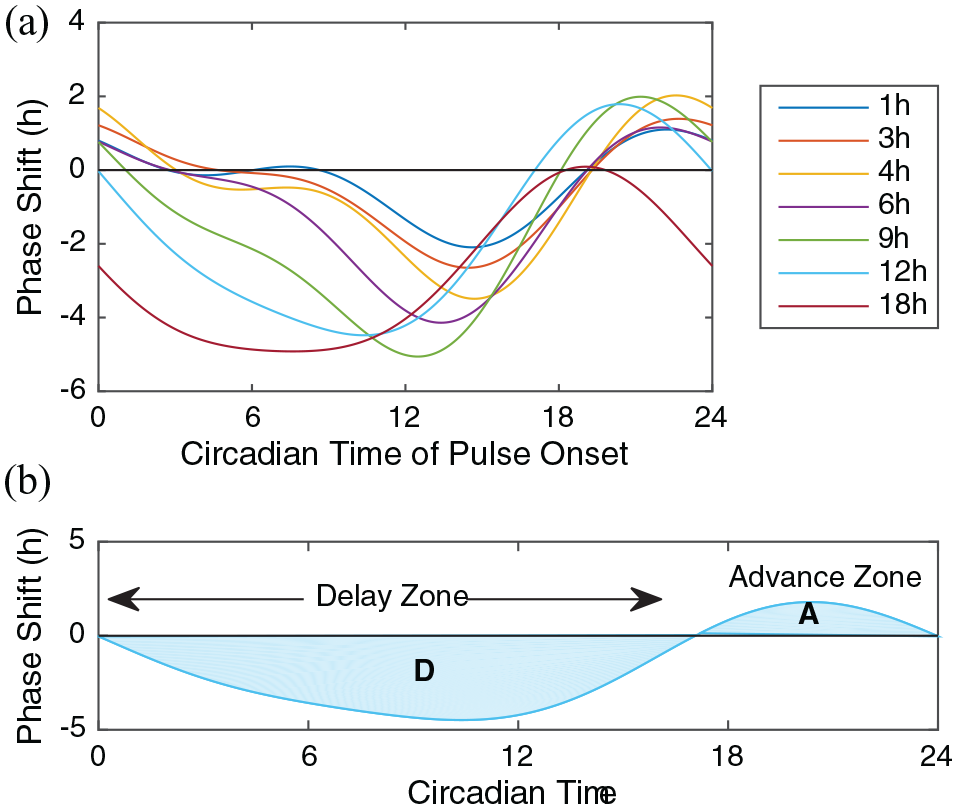
Phase response curves (PRCs) measure the shift in behavioral rhythms of M. Musculus. (a) PRCs to pulses of increasing duration. (b) We highlight the PRC to a 12-h pulse of light, showing the delay zone (ranging from CT0 to CT17) with area D and the advance zone (ranging from CT17 to CT24) with area A. The delay zone dominance (DZD), defined as D/(A + D), measures the balance of the delay and advance zone areas. For these curves, DZD ranges from 0.71 (1-h pulse) to 1.0 (18-hour pulse). Data from Comas et al. (2006), fitted to Fourier curves with 2 harmonics.
Dynamics of the Vrc Model Show Delays are Self-Enhancing
To visualize the tendency for delay, and ultimately to demonstrate its role in entrainment, we use a standard phase-only ordinary differential equation that models the VRC theory of entrainment. This model captures the subjective time (phase), which we track in units of radians. Without any input, the model is this:

where
To capture the effects of light, the model is augmented to use a VRC. It describes how the phase velocity (
The updated model is

where t is the time (h),
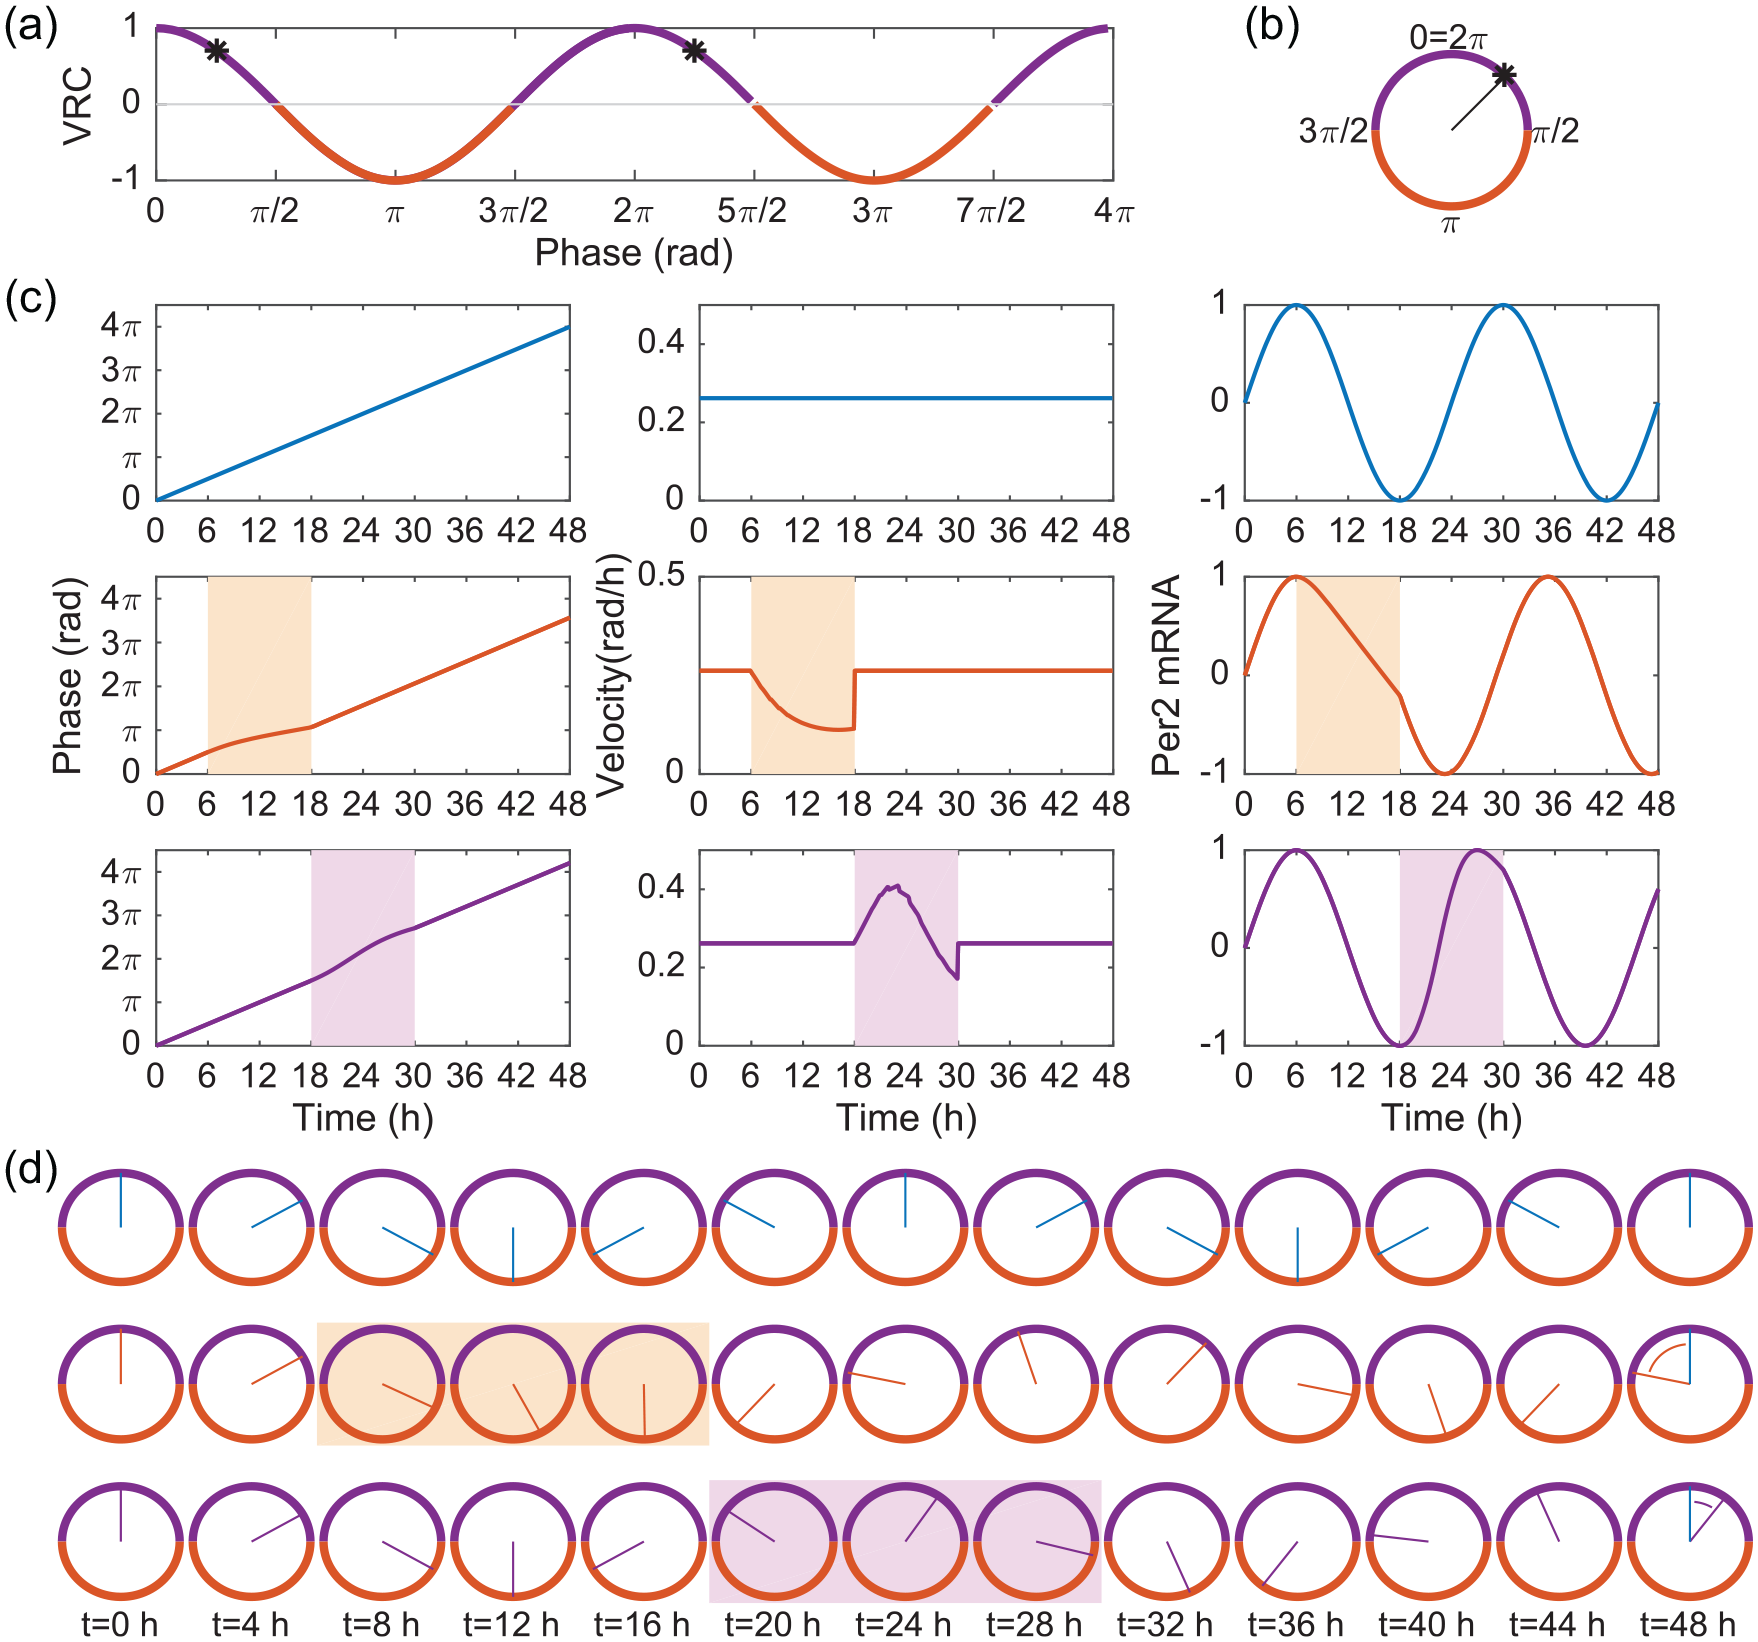
Dynamics of the VRC model show that delays are self-enhancing. The VRC (a) is the cosine function, plotted over 2 periods. Delays are indicated with dark orange and advances with dark purple. An arbitrarily chosen clock phase of π/4 is highlighted with asterisks and shown graphically in (b). The phase is indicated by the clock’s hand, which travels clockwise from phase 0 on the top. The edges of the clock indicate whether the VRC for that phase is an advance (purple) or delay (orange). Simulations are shown for an oscillator (c) in constant darkness (Scenario 1; top), subjected to light for 12 h beginning at the start of the delay zone (Scenario 2; middle), and subjected to light for 12 h beginning at the start of the advance zone (Scenario 3; bottom). The phase over time (left), the phase velocity over time (middle), and the modeled Per2 messenger RNA output (right) are shown for each scenario. The phases over time for all 3 scenarios are illustrated with clock drawings (d), where ZT0 indicates the phase at time = 0 h. At ZT48, the ultimate phase delay is indicated with the orange arc and the ultimate phase advance with the purple arc. The light orange box indicates when light is shining on the oscillator in Scenario 2. Light arrives at the beginning of the delay zone and the phase velocity is slowed down (c, middle panel), which forces the phase to progress more slowly, which forces the clock to remain in its delay zone for longer. The phase remains in the delay zone during the entire photoperiod and is not even half way through it by ZT16 (only 2 h before the light ends). The total delay incurred is nearly one-fourth of a cycle. Extending the duration of the light signal would incur even further delays. In contrast, if light arrives at the beginning of the advance zone, the phase velocity increases (c, middle bottom panel), causing the phase to advance faster. The purple box (d, bottom row) shows that light speeds up the clock enough that the phase advances back into the delay zone before the photoperiod ends. Consequently, long light periods will not spend the entire time advancing the clock. The total advance is only one-tenth of a cycle (intrinsic period = 24 h, light strength = 0.5). Abbreviation: VRC = velocity response curve.
Simulating the model results in a phase trajectory over time. To make this output more easily interpretable as bioluminescence data, we compute the sine curve of the phase. The sine curve peaks midday, which makes it a good estimate for the trajectory of per2 messenger RNA (mRNA) (Reppert and Weaver, 2001).
To visualize the tendency for delay, we simulate the model in 3 scenarios, all involving a clock with an intrinsic period of 24 h. The first scenario has no light input and is used as a reference (Figure 2b). The phase (in units of radians) completes 2 cycles (
The dynamics in each scenario illustrate several points:
Scenario 1: The clock without any input has the phase increase constantly and it fits exactly 2 cycles into 48 h. In particular,
Scenario 2: The clock with 12 h of light during the delay region shows constant phase velocity, except during photophase (light orange background) when it is slower. The phase at the end of the 12-h photophase is
Scenario 3: The clock with light during the advance zone has its phase advance beyond the end of the advance zone and into the next delay zone (phases indicated in light purple on VRC background of Figure 2a). Although the advance zone takes up half the cycle, we cannot speed up the clock for a full 12 h. Furthermore, the total advance is small—at the end of the light phase, this clock is only π
Theoretical Prcs Show that Delays are Self-Enhancing
Motivated by the PRCs collected for mouse behavior, we use the model to construct PRCs to light with durations of 1, 3, 4, 6, 8, 12, and 18 h. The strength of light (0.5) is chosen to elicit phase shift magnitudes that match those of Comas et al. (2006). Although the underlying VRC is symmetric (equal and opposite delay and advance zones; DZD = 0.5), the PRCs have larger delay zones (both in terms of duration of zone and magnitude of delays; DZD >0.5), with the mismatch increasing with light duration (Figure 3). This illustrates that the tendency toward delay is dependent neither on the intrinsic period being shorter than 24 h nor on the underlying VRC itself favoring delays.
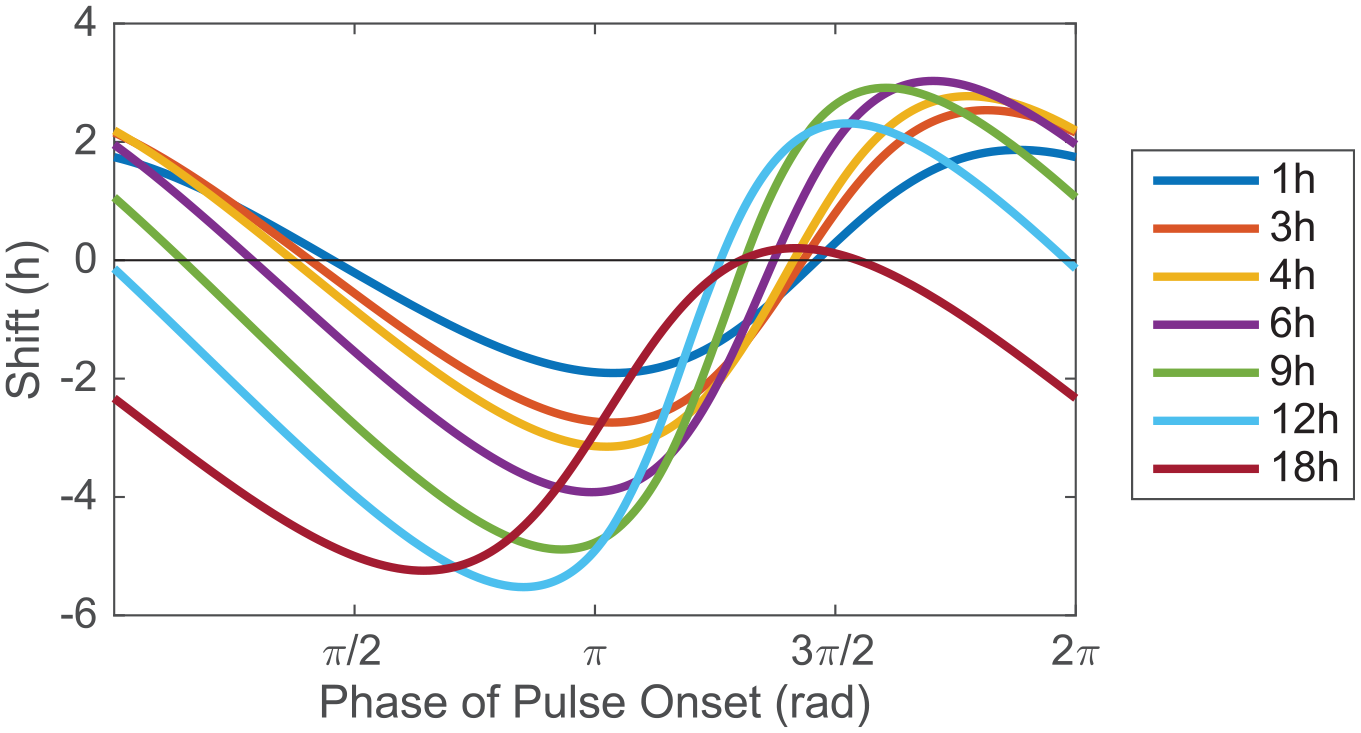
The VRC model simulation shows enhanced delays in PRCs of increasing duration. Shown are PRCs collected from 1-, 3-, 4-, 6-, 9-, 12-, and 18-h pulses of simulated light (strength = 0.5, intrinsic period = 24 h). D/(D + A) increases from 0.51 for the 1-h PRC to 0.99 for the 18-h PRC. Abbreviations: VRC = velocity response curve; PRC = phase response curve.
The Vrc Model Recovers More Quickly from Westward Travel than Eastward
To demonstrate that the principle of self-enhancing delays explains the advantage of westward travel, we simulate jetlag protocols and observe the re-entrainment process. We begin with the simplest assumptions: the intrinsic period of the clock is 24 h, each day has 12 h of light followed by 12 h of dark, and arrival in the new time zone is always at dawn. Again, we plot
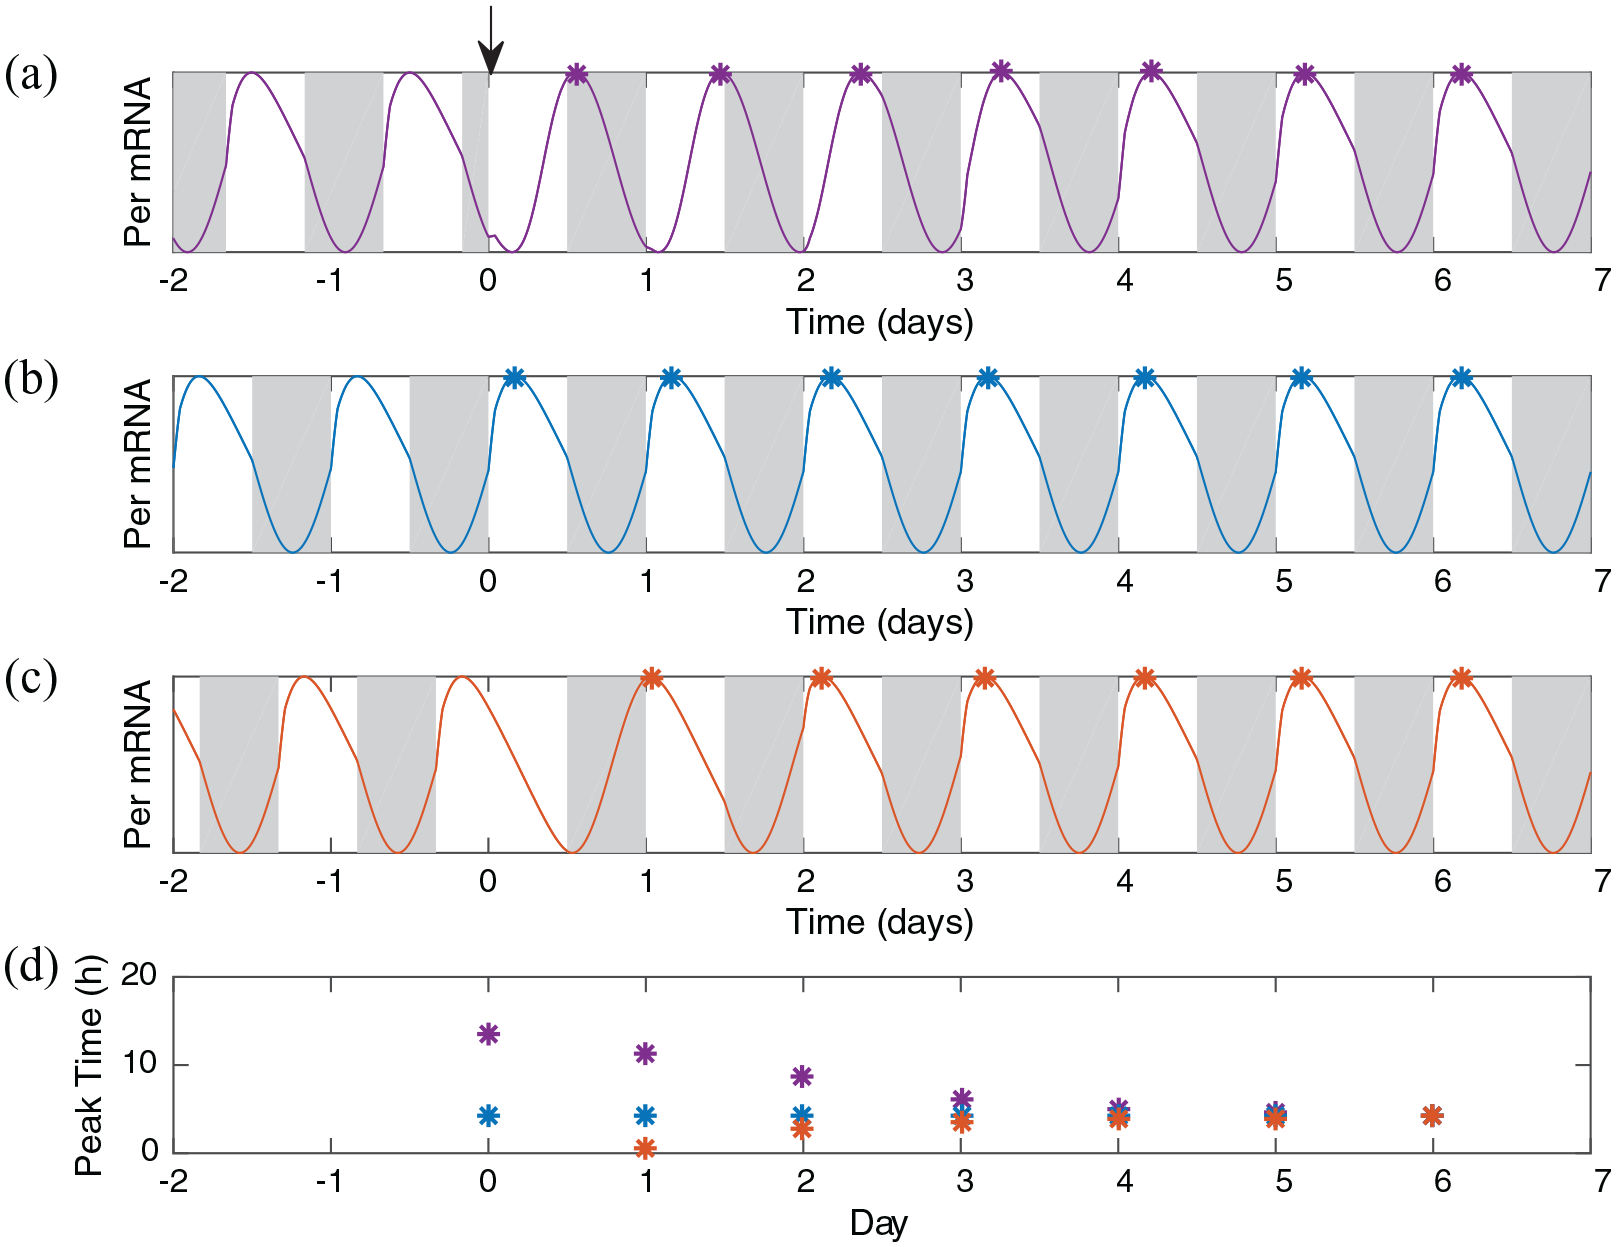
Simulations demonstrate faster recovery after an 8-h delay than after an 8-h advance. Shown are the simulations with 2 days of stable entrainment, (a) followed by an 8-h advance in the light/dark schedule (top, purple, instantaneous travel east), (b) no change in the light/dark schedule (blue), and (c) an 8-h delay in the light/dark schedule (orange, instantaneous travel west). Simulations are aligned to the beginning of the first day in the new time zone so that the process of entrainment is easy to compare across protocols. Beginning from the first day in the new time zone, the time of peak (in hours after dawn) is shown for each simulation for direct comparison (bottom, color-coded as above). The simulation with no change peaks consistently in midday. The simulation with the advance takes 4 days until the peak is approximately in the middle of the day. The simulation with the delay begins to peak midday after only 2 days.
Whether a clock recovers via advances or delays depends not only on the magnitude of the shift but also on the phase at which the clock departs from the old time zone and arrives at the new one. We evaluate the time-to-entrain with more shift magnitudes and more times of day entering the new time zone (Figure 5). Plotting the recovery time as a function of the phase shift allows us to see 2 trends: (1) the longer the phase shift, the longer the recovery time; and (2) travel to the east takes, on average, longer than travel to the west. However, it also hides important details. Recovery time also depends on the phase of the oscillator when it enters the new time zone in addition to local time in that new time zone. If we fix either the time leaving the old time zone or the time entering the new time zone, then we have pairs of scenarios with the same phase shift at the same departure (or same arrival) time with phase shifts that are equal in magnitude but opposite in direction. When each pair with common departure time is considered, the oscillator traveling westward recovers more quickly than its eastward-bound partner in 229 of the 231 scenarios. When each pair with common arrival time is considered, the oscillator traveling westward recovers more quickly than its eastward-bound partner in 223 of the 231 scenarios.
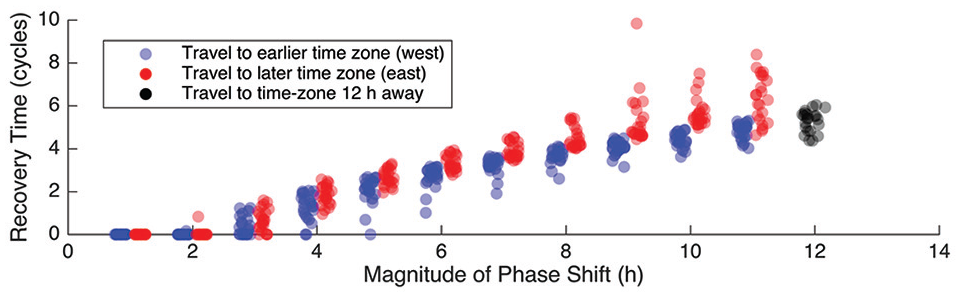
Recovery times after westward travel are shorter than recovery times after eastward travel. Shown is the recovery time after a phase shift of a given magnitude. For each magnitude, for each hour of the day, we simulated a phase shift east and then measured the time it took to re-entrain (blue circles). We repeated the process for phase shifts west (red circles). Eastward travel requires more cycles to recover, with differences increasing with the magnitude of the phase shift. The 12-h shift is labeled separately (black circles) because it represents travel of equal distance whether headed east or west.
Adjusting the Area Under the VRC Shows That Delays Enhance Delays for Most, but Not All VRCs
We have seen that if the VRC is a cosine with delay and advance zones of equal area, then PRCs collected for signals of increasing duration have an increasing value of DZD. We know that 50% of the area leads to delays taking over, but how far does this extend? What if advances really dominate the VRC? We construct cosine-like VRCs with DZD ranging from 0.1 to 0.9 at intervals of 0.1. These VRCs are simply cosine curves with the delay and advance regions scaled differently to create the imbalance (with A + D held constant; shown at the bottom of Figure 6). We collect PRCs with a light strength of 0.5 (saturating after 1 h, thereafter at 22%) and durations increasing from 1 to 18 h at 1-h intervals and compute the DZD for each PRC (Figure 6). For models with VRCs of DZD <0.3, increasing signal duration leads to increased advance areas in the PRCs (DZD ranges from 0.11 to 0 for the model with a VRC DZD of 0.1 and from 0.21 to 0 for the model with a VRC DZD of 0.2). It is possible for advances to dominate because the delay zone has such small magnitude that even if the clock is slowed down and remains in the delay zone for more than half the cycle, the magnitude of the advances speeds up the clock enough to compensate for any delays.
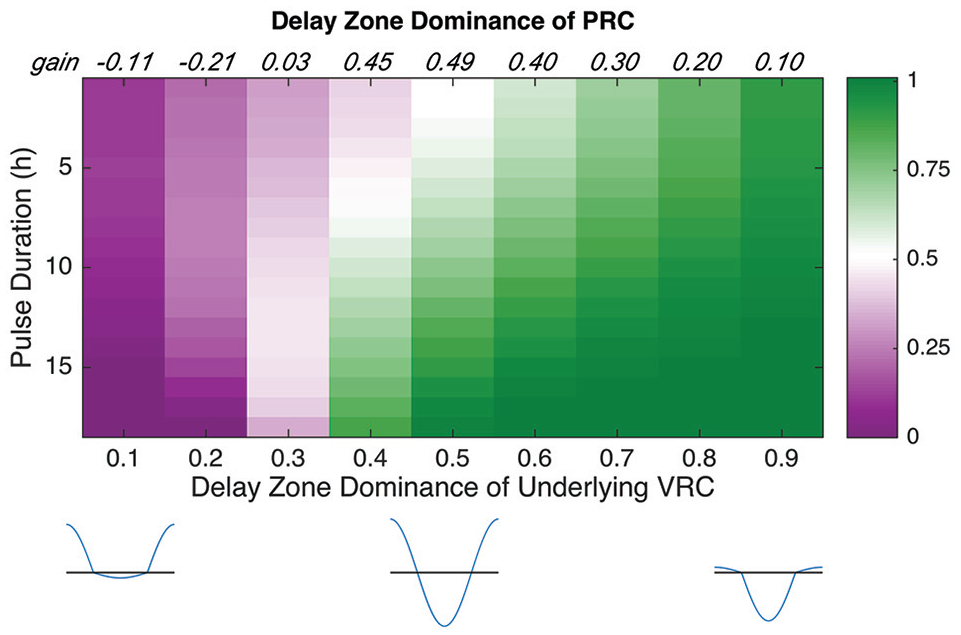
Delays enhance delays in models with cosine-like VRCs as long as the DZD is <0.3. We computed DZDs for PRCs collected from pulses of duration 1-18 h (top to bottom) for models with VRC DZDs ranging from 0.1 to 0.9 (left to right). PRC DZD = 0.5 is white, with smaller numbers becoming an increasingly bright magenta and larger numbers becoming an increasingly bright green. At the top of each column is the gain in DZD, computed as the difference in DZD between the longest and shortest pulses. For VRCs with only 10% or 20% of their area devoted to delays, increasing the duration leads to a loss in DZD, which means that advances enhance advances. For VRCs with DZD ≥0.3, the DZDs of PRCs show positive gains, meaning that delays enhance delays. Abbreviations: PRC = phase response curve; VRC = velocity response curve; DZD = delay zone dominance.
A Long Intrinsic Period Is Not Required for Westward Travel to Have an Advantage, but It Does Play a Role
We have shown that a 24-h oscillator that depends on a VRC with DZD = 0.5 will recover from westward travel more quickly than from eastward travel. But what if the intrinsic period is faster or slower than 24 h? We simulate the jetlag experiments with intrinsic periods of 22-26 h at 0.5-h intervals for models with VRCs with DZDs ranging from 0.1 to 0.9 and find that westward travel has an overall advantage, but both DZD and intrinsic period determine the strength (or weakness) of that advantage. For each model, we pair simulated travelers departing at the same time for travel and determine which traveler recovers first. The fraction of westward travelers recovering first measures the asymmetry (Figure 7). Eastward travel has the advantage for fast intrinsic oscillators with large advance zones in their VRCs. Increasing either the period or the relative size of the delay zone gives increasing advantage to westward travel. This both confirms the common intuition that long intrinsic periods lead to faster recovery from westward travel and demonstrates that this intuition is not enough. To understand why nocturnal animals (typically, with somewhat longer than 24-h periods) also display an east-west asymmetry that favors westward travel, we need intuition about how delays work dynamically. Not only does the size of the delay zone in the VRC affect recovery time, but, as long as the DZD is above 0.3, delays are self-enhancing. Our model predicts that an oscillator with DZD = 0.7, which accurately models the PRCs collected for mice (Comas et al., 2006), will recover from westward travel more quickly than from eastward travel, even when the intrinsic period is as fast as 22 h.
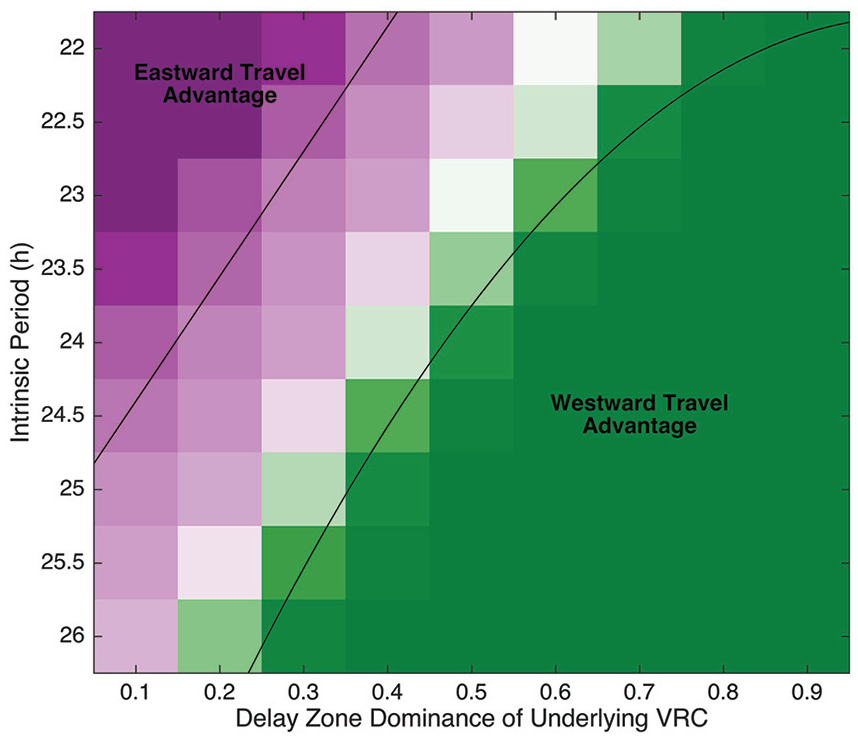
Period and delay zone dominance both affect asymmetry in recovery from jetlag, and westward travel has the advantage. Shown is the strength of asymmetry in jetlag recovery for jetlag simulations with models using VRCs with DZD ranging from 0.1 to 0.9 (at intervals of 0.1) and intrinsic periods ranging from 22 to 26 h (at intervals of 0.5 h). For each DZD value and each intrinsic period, we simulate jetlag with shifts of magnitudes 1-11 h. For each magnitude, for each hour of the day, we simulate phase shifts east and west and determine which took less time to recover from. For a given intrinsic period and DZD value, the fraction of pairs recovering from westward travel more quickly than eastward travel represents the asymmetry. Asymmetry ranges from 0 (eastward travel is always easier to recover from; magenta) to 1 (westward travel is always easier to recover from; green). Black lines approximately delineate the area with an eastward advantage (asymmetry <0.25) and the area with a westward advantage (asymmetry >0.75). Abbreviations: VRC = velocity response curve; DZD = delay zone dominance.
Discussion
We have used a simple mathematical model to demonstrate that the dynamic response of the phase velocity to light expands the delay zone and ultimate makes the clock easier to slow down, contributing to an increase in the dominance of the delay zone in PRCs and an asymmetry in recovery from jetlag. The idea that light expands the delay zone and contracts the advance zone originated with the VRC theory (Swade, 1969) and was illustrated by Daan and Pittendrigh in their classic study of circadian rhythms (Figure 10 in Daan and Pittendrigh, 1976). They used the insight to understand the effects of constant light on the period of oscillation. This is important because it relates the PRC to continuous action of light on the oscillator and emphasizes the dynamic response (they do not, for example, assume that the change in period due to constant light is proportional to the area under the PRC). The phase oscillator model serves as a mechanism for computing the effects of long exposures to light that captures those dynamics. It gives us another access point to reasoning about the clock’s response to light.
A PRC collected from short pulses of light is similar in shape to a VRC and serves as a basis from which responses to longer durations of light can be estimated (as was done by Comas et al., 2006). We expect that a clock with a short-pulse PRC that favors delays or weakly favors advances will have a long-pulse PRC that favors delays and that the clock will, therefore, recover from westward travel more quickly. On the contrary, we expect that a clock with a short-pulse PRC strongly favoring advances will also have a long-pulse PRC that favors advances and that the clock would, therefore, favor eastward travel (Figure 7). We simulated PRCs to increasing durations of light and jetlag for 2 mechanistic models with 1-h light pulse PRCs with DZD of approximately 0.7 (nocturnal mammal of Geier et al., 2005; Relógio et al., 2011). The DZD of PRCs to increasing durations of light followed the same pattern as that of the VRC model with an underlying DZD of 0.7 (Figure 6, seventh column), and as expected a clock with 24-h period (Figure 7) favored westward travel (Suppl. Figs. S2 and S3). An alternate, diurnal, version of the first model (Geier et al., 2005) generates PRCs with the same pattern as the VRC model with DZD = 0.3 (third column of Figure 7) and, as expected, favors eastward travel (Suppl. Fig. S4). An early study of asymmetry in recovery from 6-h advances and delays used an ordinary differential equation (ODE) model with larger advances than delays in its PRC (Wever, 1966) and predicted that it was easier to recover from eastward travel than westward. The predicted recovery times are in remarkable agreement with the VRC model when the DZD is 0.3, and the advantage of westward travel has the same dependence on the intrinsic period as the third column (DZD = 0.3) of Figure 7. It should be noted that although these models are excellent demonstrations of how the VRC theory can explain simulations of mechanistic models, not all limit cycle models follow both the PRC duration trajectory and the asymmetry in jetlag recovery. Nonlinear equations can lead to alternate trends, and if those alternate trends do not lead to a 12-h PRC with appropriate shape and DZD, then it will be of limited use for understanding how mammals recover from jetlag in LD cycles.
Not only do we need to accurately capture phase dynamics during long stretches of daylight, it is critical to understand how the light signal is adjusted before it reaches the clock. The effects of light saturate with remarkable similarity in nocturnal mammals and in humans (Kronauer et al., 2019), showing one trend (with strong responses) during the first hour and another (with weak responses) afterward. These processes have been captured by modeling the light input separately from the clock (Jewett et al., 1999) and by simple mathematical functions related to the timing of the signal (as used here).
In this work, although we examined the time to re-entrain, we did not discuss the dynamics of re-entrainment, such as whether the clock re-entrains in the same direction of the shift (orthodromically) or in the opposite direction (antidromically). These dynamics affect time to re-entrain and have been examined with single-oscillator models of the clock (Leloup and Goldbeter, 2013; Diekman and Bose, 2018) and in multi-oscillator models (one of the SCN; Lu et al., 2016; a second of SCN, but with two different coupling factors creating a hierarchy; Kori et al., 2017; and a third with a hierarchy of master and peripheral clocks; Leise and Siegelmann, 2006). Recovery is slowest near the threshold between orthodromic and antidromic re-entrainment (called the jetlag separatrix by Kori et al.) and is faster when all oscillators shift in the same direction (Leise and Siegelmann, 2006). These results are consistent with our emphasis on the clock adjusting under long period of light—the 12-h PRC predicts the direction and dynamics of re-entrainment (Leloup and Goldbeter, 2013).
Conclusion
We have shown that the dynamics of a phase-only model demonstrate that delays are self-enhancing: if a clock’s phase is in its delay zone, and light slows it down, it will remain in its delay zone longer. The dominance of delays is seen in PRCs collected from mice, in the phase-only model, and in mechanistic models of the clock. We related the PRCs to entrainment and jetlag recovery, showing that self-enhancing delays are coincident with faster recovery after westward travel. This relationship and principle have limits and do not apply in every situation, but do apply broadly, and we believe it is a useful intuition to develop.
Supplemental Material
sj-pdf-1-jbr-10.1177_0748730421990482 – Supplemental material for Delays are Self-enhancing: An Explanation of the East-West Asymmetry in Recovery from Jetlag
Supplemental material, sj-pdf-1-jbr-10.1177_0748730421990482 for Delays are Self-enhancing: An Explanation of the East-West Asymmetry in Recovery from Jetlag by Stephanie R. Taylor in Journal of Biological Rhythms
Footnotes
Acknowledgements
We thank Tanya Leise for feedback on the manuscript; Mary Harrington, Hanspeter Herzel, Christoph Schmal, and Bharath Ananthasubramaniam for helpful discussions; and the anonymous reviewers for valuable suggestions. This work was supported by the Office of the Provost at Colby College.
Conflict of Interest Statement
The author(s) have no potential conflicts of interest with respect to the research, authorship, and/or publication of this article.
Notes
References
Supplementary Material
Please find the following supplemental material available below.
For Open Access articles published under a Creative Commons License, all supplemental material carries the same license as the article it is associated with.
For non-Open Access articles published, all supplemental material carries a non-exclusive license, and permission requests for re-use of supplemental material or any part of supplemental material shall be sent directly to the copyright owner as specified in the copyright notice associated with the article.