
Abstract
A fundamental role of the circadian clock is to control biochemical and physiological processes such that they occur an optimal time of day. One of the most significant clock outputs from a clinical as well as basic biological standpoint is the timing of the cell cycle. Here we show that the circadian clock regulates the timing of mitosis in a light-responsive, clock-containing zebrafish cell line. Disrupting clock function, using a CLOCK1 dominant-negative construct or constant light, blocks the gating of cell division, demonstrating that this mitotic rhythm is cell autonomous and under control of the circadian pacemaker. Quantitative PCR reveals that several key mitotic genes, including Cyclin B1, Cyclin B2, and cdc2, are rhythmically expressed and clock-controlled. Peak expression of these genes occurs at a critical phase required to gate mitosis to the late night/early morning. Using clock and cell cycle luminescent reporter zebrafish cell lines, we show that light strongly represses not only circadian clock function, but also mitotic gene expression, and consequently slows cell proliferation.
A major role of the circadian pacemaker is to regulate behavioral and physiological processes such that they occur at an optimal time of day, relative to the environment, as well as to each other. Over the past decade, we have seen a dramatic increase in our understanding of the core circadian clock mechanism, but much less is known about how the clock regulates downstream, rhythmic outputs. One of the most significant biological processes influenced by the circadian clock is the timing or “gating” of the cell cycle. Circadian rhythms in cell division were described in mammalian tissues, including liver, in vivo more than 50 years ago (Halberg, 1960) and have now been shown to exist in a wide range of organisms from unicellular algae to humans (Johnson, 2010). More recent studies, which have begun to explore the possible underlying mechanisms, have also revealed a circadian rhythm in mitosis in mouse liver undergoing regeneration, following partial hepatectomy (Matsuo et al., 2003).
Many factors could play a role in regulating this clock-cell cycle link in the whole animal, including rhythms in hormonal and humoral signals, metabolic influences, and neural signals from central pacemakers. Recent studies, however, have revealed the presence of independent circadian clocks within individual cells, both in cultured tissues and in dispersed cell cultures (Nagoshi et al., 2004; Welsh et al., 2004; Carr and Whitmore, 2005; Liu et al., 2007). This has raised the obvious question of whether single cell oscillators can also regulate the timing of the cell cycle autonomously, an issue that is currently under some debate (Nagoshi et al., 2004; Yeom et al., 2010). If this is the case, does disruption of circadian clock function alter cell cycle timing and cell proliferation rates in culture? If so, how does intracellular coupling between these two oscillators occur? In the case of liver regeneration in vivo, it has been shown from studies in Cryptochrome-deficient and Clock mutant mice that the timing of mitosis is clock-gated. Rhythmic expression of the cell cycle regulator Wee1 appears to play a critical role in this gating process through its phosphorylation of the Cyclin B1/CDC2 complex, an event that blocks entry into mitosis (Matsuo et al., 2003). But is this regulation also occurring in individual cells in vitro, and if so, is the involvement of Wee1 universal, or is its regulation tissue-specific?
Addressing these questions in mammalian cell lines is possible, but is complicated by the fact that treatments used to synchronize the circadian pacemaker, such as serum shock or dexamethasone pulses, are also likely to influence the cell cycle directly (Balsalobre et al., 1998; Balsalobre et al., 2000). Manipulating the mammalian clock in culture using natural, biologically relevant zeitgebers (or synchronizers) without affecting the cell cycle is therefore extremely difficult. The situation may be easier to explore in zebrafish, since the circadian system as a whole is far more decentralized. Isolated adult tissues contain directly light-responsive circadian clocks, and the same is true for individual cells derived from early stage zebrafish embryos (Whitmore et al., 2000; Carr and Whitmore, 2005). There is currently no evidence in zebrafish for a central “master” pacemaker coordinating these peripheral oscillators. The direct light sensitivity of zebrafish tissues and cells means that the circadian clock itself is rapidly and directly entrained following light exposure (Carr and Whitmore, 2005; Tamai et al., 2007). In developing zebrafish embryos and embryonic cell lines, the timing of DNA replication is restricted to the late day/early evening, suggesting some degree of cell autonomy to this aspect of clock-cell cycle regulation (Dekens et al., 2003; Dickmeis et al., 2007). However, is this gating of S phase purely light-driven in zebrafish or due to the direct action of the circadian clock? Moreover, are other phases of the cell cycle, such as mitosis, also clock-regulated in zebrafish cells? At this time, surprisingly little is known about the underlying molecular links between the circadian clock and the cell cycle in this species. The aim of this study is to address some of these key issues in this unique model system.
Here we demonstrate a clear circadian regulation of mitotic timing in zebrafish cells, with the number of actively dividing cells showing a peak in the late night/early morning. Generating clock mutant cells by overexpressing a CLOCK1 dominant-negative (DN) construct blocks rhythms in mitosis, and exposing clock mutant cells to a light-dark (LD) cycle is unable to drive or “mask” this process. These results reveal for the first time that the circadian pacemaker, and not light, is the principal regulator of the cell cycle in this system, since activation of the light input pathway alone is not sufficient to drive a mitotic rhythm. In addition, we show a clear circadian oscillation in the expression of several key mitotic genes, which corresponds to the timing of spontaneous, rhythmic mitotic activity in these cells. The generation of a Cyclin B1 luminescent reporter cell line allows us to follow mitotic gene expression dynamically. Interestingly, sustained light strongly represses the expression of Cyclin B1, as well as other key mitotic regulators, and consequently slows cell proliferation. Light exposure of zebrafish cells and tissues has been previously shown to induce the sustained expression of Cryptochrome 1a (Cry1a) (Hirayama et al., 2005; Tamai et al., 2007). Overexpression of Cry1a mimics the effects of light on the mitotic rhythm and cell proliferation, suggesting that it is a key light-induced regulator of the cell cycle through its ability to block pacemaker function. Furthermore, disrupting the circadian pacemaker itself, in clock mutant cells, can mimic this result, showing that a functional clock is required for optimal cell proliferation rates in a normal, nonmalignant cell line.
Materials and Methods
Zebrafish Cell Lines
PAC2 cells were derived from 24-h zebrafish embryos, as previously described (Whitmore et al., 2000). A clonal Period 1 (Per1)-luciferase cell line was established from PAC2 cells and isolated by fluorescence activated cell sorting (FACS) using previously established methods (Tamai et al., 2007). To generate Cyclin B1-luciferase zebrafish cell lines, genomic DNA fragments 4.0 kb and 0.9 kb upstream of the zebrafish Cyclin B1 translational start site were amplified by PCR from bacterial artificial chromosome clone HUKGB735K07267Q8 (German Resource Center for Genome Research) and subcloned into pGL3-Basic (Promega) to create plasmids pGL3-Cyclin B1 (4.0) and pGL3-Cyclin B1 (0.9). These constructs were linearized along with vector pcDNA3.1/myc-His A (Invitrogen) and electroporated into PAC2 cells using the Cell Line Nucleofector Kit V and program T-20 (Amaxa Biosystems). Following neomycin selection, pooled populations of transfected cells were plated, and bioluminescence was monitored as described below. For some experiments, single cells were isolated by FACS, and clonal Cyclin B1-luciferase cell lines were established. Quantitative PCR analysis showed that the 4.0 kb and 0.9 kb fragments of the Cyclin B1 promoter regulated expression of luciferase, which matched that of the endogenous Cyclin B1 gene. To determine whether the only E-box–related elements in the Cyclin B1 promoter, one E-box (CACGTG) and one E′-box (AACGTG), are important for rhythmic expression of this gene, the region containing these sequences was deleted from the 0.9 kb promoter fragment by PCR, restriction digestion, and religation, resulting in plasmid pGL3-Cyclin B1 (0.9) delta E. A potential retinoid-related orphan receptor regulatory element (RRE) in the 0.9 kb fragment of the Cyclin B1 promoter was also mutated, alone or in combination with the E-box deletions, using gene synthesis (Geneart), and these fragments were subcloned into pGL3-Basic. These plasmids were transfected into PAC2 cells as above, and stable luminescent cell lines were generated.
Bioluminescence Assays
Luminescent cell lines were seeded at a density of 250,000-500,000 cells/mL in quadruplicate wells of a white 96-well plate (Greiner) in L15 media containing 15% FCS, penicillin/streptomycin (50 U/mL), gentamicin (50 mg/mL), and 0.5 mM beetle luciferin (Promega). Cells were maintained on an LD cycle of 12 h of light, 12 h of dark, unless otherwise indicated in the figure legends. Bioluminescence was monitored on a Packard TopCount NXT scintillation counter (28 °C).
Phospho-Histone H3 Flow Cytometry
PAC2 or Per1-luciferase cells described above were plated in triplicate in 25 cm2 flasks (Greiner) or 6-well dishes (Greiner) at a density of 100,000 cells/mL and maintained at 28 °C on an LD cycle (12 h of light, 12 h of dark) or in constant light (LL) for 6-7 days. At the indicated zeitgeber time (ZT), where ZT0 is defined as lights on, or circadian time (CT), cells were trypsinized, washed with PBS, fixed in cold 70% ethanol on day 6 or 7, and stored at –20 °C. To stain for phospho-Histone H3 (pH3), samples were pelleted, blocked in 0.1% albumin in PBS, and incubated in rabbit anti-pH3 (Ser10) (Upstate Biotechnology) diluted 1:100 in 0.1% albumin for 1 h at room temperature. Samples were then washed with PBS and incubated in Alexa Fluor 488 goat anti-rabbit (Molecular Probes) or Cy5 goat anti-rabbit (GE Healthcare) diluted 1:100 in 0.1% albumin for 30 min at room temperature. Cells were washed with PBS, treated with RNase A, and stained with propidium iodide. Next 30,000 cells from each sample (n ≥ 3 for each time point) were analyzed on an LSRII flow cytometer or a BD FACS Array Bioanalyzer in the FACS facility at Cancer Research UK (Lincoln’s Inn Fields, London, UK). Using FlowJo software (Tree Star Inc.), the mean percentage of cells labeled with pH3 (±SEM) was determined and then plotted in Excel (Microsoft).
Aphidicolin Treatment
Per1-luciferase cells were plated at a density of 250,000 cells/mL in triplicate in 6-well dishes or in quadruplicate in a 96-well plate for each condition. Cells were treated tonically, either with dimethylsulfoxide (DMSO) as a control or 0.5 µg/mL aphidicolin, a reversible inhibitor of DNA replication, and maintained at 28 °C on an LD cycle for up to 18 days. Cells plated in 6-well dishes were either trypsinized on day 7 and counted for growth (see below), or trypsinized on day 7, washed with PBS, fixed in cold 70% ethanol, and stored at –20 °C for cell cycle analysis. Fixed cells were washed with PBS, treated with RNase A, and stained with propidium iodide. Then 30,000 cells from each sample were analyzed on a BD FACS Array Bioanalyzer in the FACS facility at Cancer Research UK (Lincoln’s Inn Fields, London, UK). The percent of S phase cells (±SEM) was determined using the Watson Pragmatic mathematical model in FlowJo (Tree Star Inc.) and then plotted in Excel (Microsoft). Per1-luciferase cells in the 96-well plate were treated tonically with DMSO or 0.5 µg/mL aphidicolin as above in media containing 0.5 mM luciferin, maintained at 28 °C on an LD cycle, and monitored for bioluminescence for 18 days.
Retroviral Constructs and Transfections
Plasmid pCLNCX is a retroviral expression vector and part of the Retromax expression system for retroviral transfections (Imgenex). For our overexpression studies, zebrafish cells were transfected with the pCLNCX empty vector as a control. Plasmid pCLNC.Flag containing the Flag tag (MDYKDDDDK) was created by subcloning hybridized oligos encoding this sequence into retroviral expression vector pCLNCX (Imgenex). pCLNC.Flag-CLOCK1 DN was generated by subcloning a 1.2 kb fragment of zebrafish CLOCK1, encoding amino acids 1-389 and lacking the putative C-terminal transactivation domain, in-frame with the Flag sequence. The pCLNC.HA-Cry1a plasmid has been described (Tamai et al., 2007). PAC2 or Per1-luciferase cells described above were transfected with retroviral plasmids as described (Carr and Whitmore, 2005; Tamai et al., 2007). Single cells were isolated by FACS, and clonal cell lines were established. Expression of Flag-CLOCK1 DN or HA-Cry1a protein was confirmed by immunocytochemistry and Western blotting using standard protocols (data not shown; Tamai et al., 2007). Antibodies used for these analyses include mouse anti-Flag M2 (1:1000, Sigma-Aldrich), rabbit anti-Flag (1:1000, Sigma-Aldrich), rat anti-HA high affinity 3F10 (1:500, Roche), Alexa Fluor 594 goat anti-mouse (1:1000, Molecular Probes), Alexa Fluor 568 goat anti-rat (1:1000, Molecular Probes), goat anti-rabbit HRP (1:2000, Cell Signaling Technology), and goat anti-rat HRP (1:2000, Calbiochem).
Quantitative PCR
PAC2 or Per1-luciferase cells were seeded at a density of 100,000 cells/mL in triplicate wells of a 6-well dish (Greiner) and maintained on an LD cycle (12 h of light, 12 h of dark) or in LL at 28 °C. Samples were harvested in TRIzol (Invitrogen) 6-7 days after plating at the indicated ZT or CT. Total RNA was isolated following the manufacturer’s instructions, and cDNA was synthesized from 2 µg of RNA using SuperScript II Reverse Transcriptase (Invitrogen). Quantitative PCR was carried out using SYBR Green JumpStart Taq ReadyMix (Sigma-Aldrich) and 0.5 µM of gene-specific primers (Table S1) in a Mastercycler ep realplex2 (Eppendorf). ΔCt was calculated using ribosomal protein L13α (RPL13α) as a reference gene. Relative expression levels were then plotted by determining ΔΔCt by normalizing to a control LD sample with the highest ΔCt value (specific for each gene).
Growth Assays
PAC2 or Per1-luciferase cells were plated in triplicate in a 6-well dish (Greiner) at a density of 100,000 cells/mL and placed on an LD cycle or in LL at 28 °C. Cells were trypsinized 4, 5, 6, and 7 days after plating, resuspended in media, diluted with trypan blue, and counted using a hemocytometer. The average number of cells/mL (±SEM) was calculated and plotted.
Statistical Analysis
The data in this study are presented as the mean ± SEM (n ≥ 3) and were analyzed using a Student’s t-test and/or analysis of variance (ANOVA) (http://www.physics.csbsju.edu/stats). We considered p < 0.05 to be significant.
Results
Zebrafish Circadian Clock Controls Rhythmic Mitosis
Using pH3 as a marker of mitosis (Hendzel et al., 1997), we examined whether zebrafish PAC2 cells maintained on an LD cycle divide rhythmically. Cells were plated at a density of 100,000 cells/mL and harvested every 6 h for 2 days (6 and 7 days after plating). Quantification of pH3 staining by flow cytometry shows a clear circadian rhythm in mitosis, peaking in the late night/early morning (Fig. 1A). These peaks in mitosis are evident over a 2-day period, as cells become more confluent and the total percentage of dividing cells is slightly reduced (Fig. 1A). To determine whether the circadian clock controls this rhythm in mitosis, PAC2 cells were entrained to an LD cycle and transferred into constant darkness (DD) the night before harvesting. Analysis of pH3 staining reveals that the mitotic rhythm observed in LD persists in DD (Fig. 1B). We then generated a clock mutant cell line by transfecting Per1-luciferase zebrafish cells with a truncated form of CLOCK1, encoding amino acids 1-389 and lacking its putative C-terminal transactivation domain (Whitmore et al., 1998; Dekens and Whitmore, 2008). Bioluminescent traces show that overexpression of this mutant construct dramatically reduces expression of Per1-luciferase approximately 80-fold compared with empty vector pCLNCX transfected cells (Fig. 1C and Suppl. Fig. S1). The residual oscillation may reflect either cells within population that still retain a rhythm or individual cells where normal CLOCK and BMAL escape inhibition by the mutant construct and drive downstream transcription (Suppl. Fig. S1). Nevertheless, this truncated zebrafish CLOCK1 protein appears to act in a dominant-negative fashion, similar to clock mutations isolated from genetic screens in mouse and Drosophila (Antoch et al., 1997; King et al., 1997; Allada et al., 1998). Flow cytometric analysis of pH3 staining in empty vector control cells versus CLOCK1 DN cells shows that rhythmic mitosis is abolished in clock mutant cells (Fig. 1D).
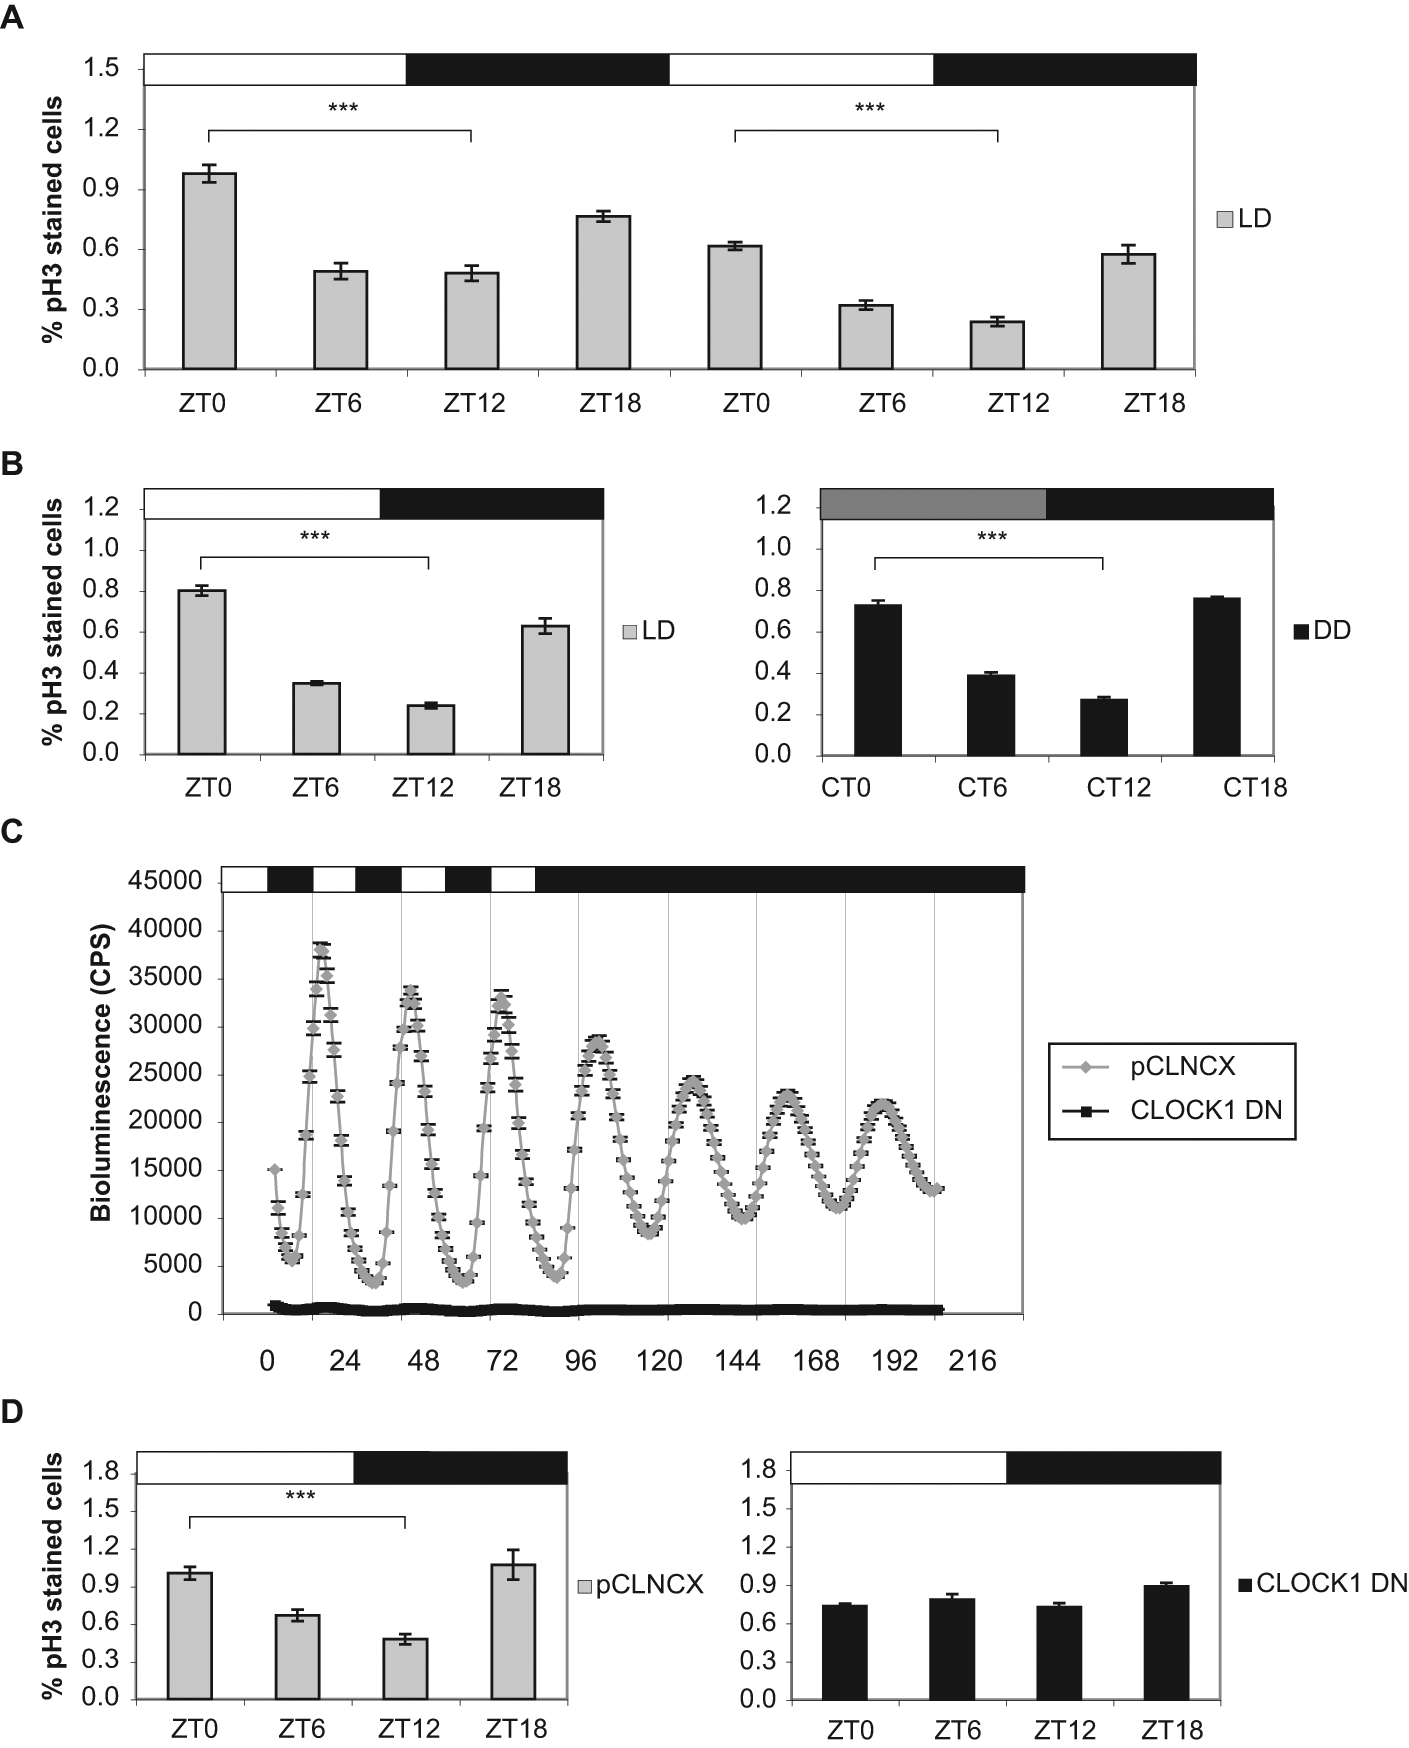
The zebrafish circadian clock controls rhythmic mitosis. (A) Phospho-Histone H3 (pH3) staining of PAC2 cells maintained on an LD cycle and harvested every 6 h over 2 days. Samples were trypsinized and fixed at the indicated zeitgeber time (ZT), where ZT0 is defined as lights on. (B) Mitotic rhythms in PAC2 cells maintained in LD (left) compared with cells in DD after LD entrainment (right). Samples were collected at the indicated ZT for cells in LD or circadian time (CT) for entrained cells transferred into DD. (C) Per1-luciferase expression in CLOCK1 DN cells (black squares) compared with pCLNCX empty vector control cells (gray diamonds). Luminescent cells were maintained on an LD cycle for 4 days and transferred into DD for 4 days. (D) pH3 staining of pCLNCX empty vector control (left) and CLOCK1 DN cells (right) maintained on an LD cycle and harvested at the indicated ZT. Black and white bars above the graphs represent the dark and light periods, respectively, and the gray bar in (B) represents the subjective day. Peak and trough values at ZT0 (or CT0) and ZT12 (or CT12), respectively, were compared using a Student’s t-test and found to be significantly different (***p < 0.0001). Analysis of variance (ANOVA) of CLOCK1 DN samples showed no significant variation.
Light Abolishes Rhythmic Mitosis by Inhibiting Circadian Clock Function
Our previous work has shown that light has a potent repressive action on clock function in zebrafish cells and, at high intensities, severely disrupts the circadian oscillator (Tamai et al., 2007). Bioluminescent traces of Per1-luciferase cells reveal high amplitude rhythms of Per1 expression on an LD cycle that are dramatically reduced in constant light (LL). Per1 rhythms are then reestablished once cells enter DD (Fig. 2A). To determine whether sustained light affects rhythmic cell division, we analyzed pH3 staining in PAC2 cells in LD versus LL. In contrast to the robust rhythms observed on an LD cycle, zebrafish cells maintained in LL divide arrhythmically (Fig. 2B). These results are similar to those observed in clock mutant cells (Fig. 1D) and are consistent with light repressing the circadian clock.
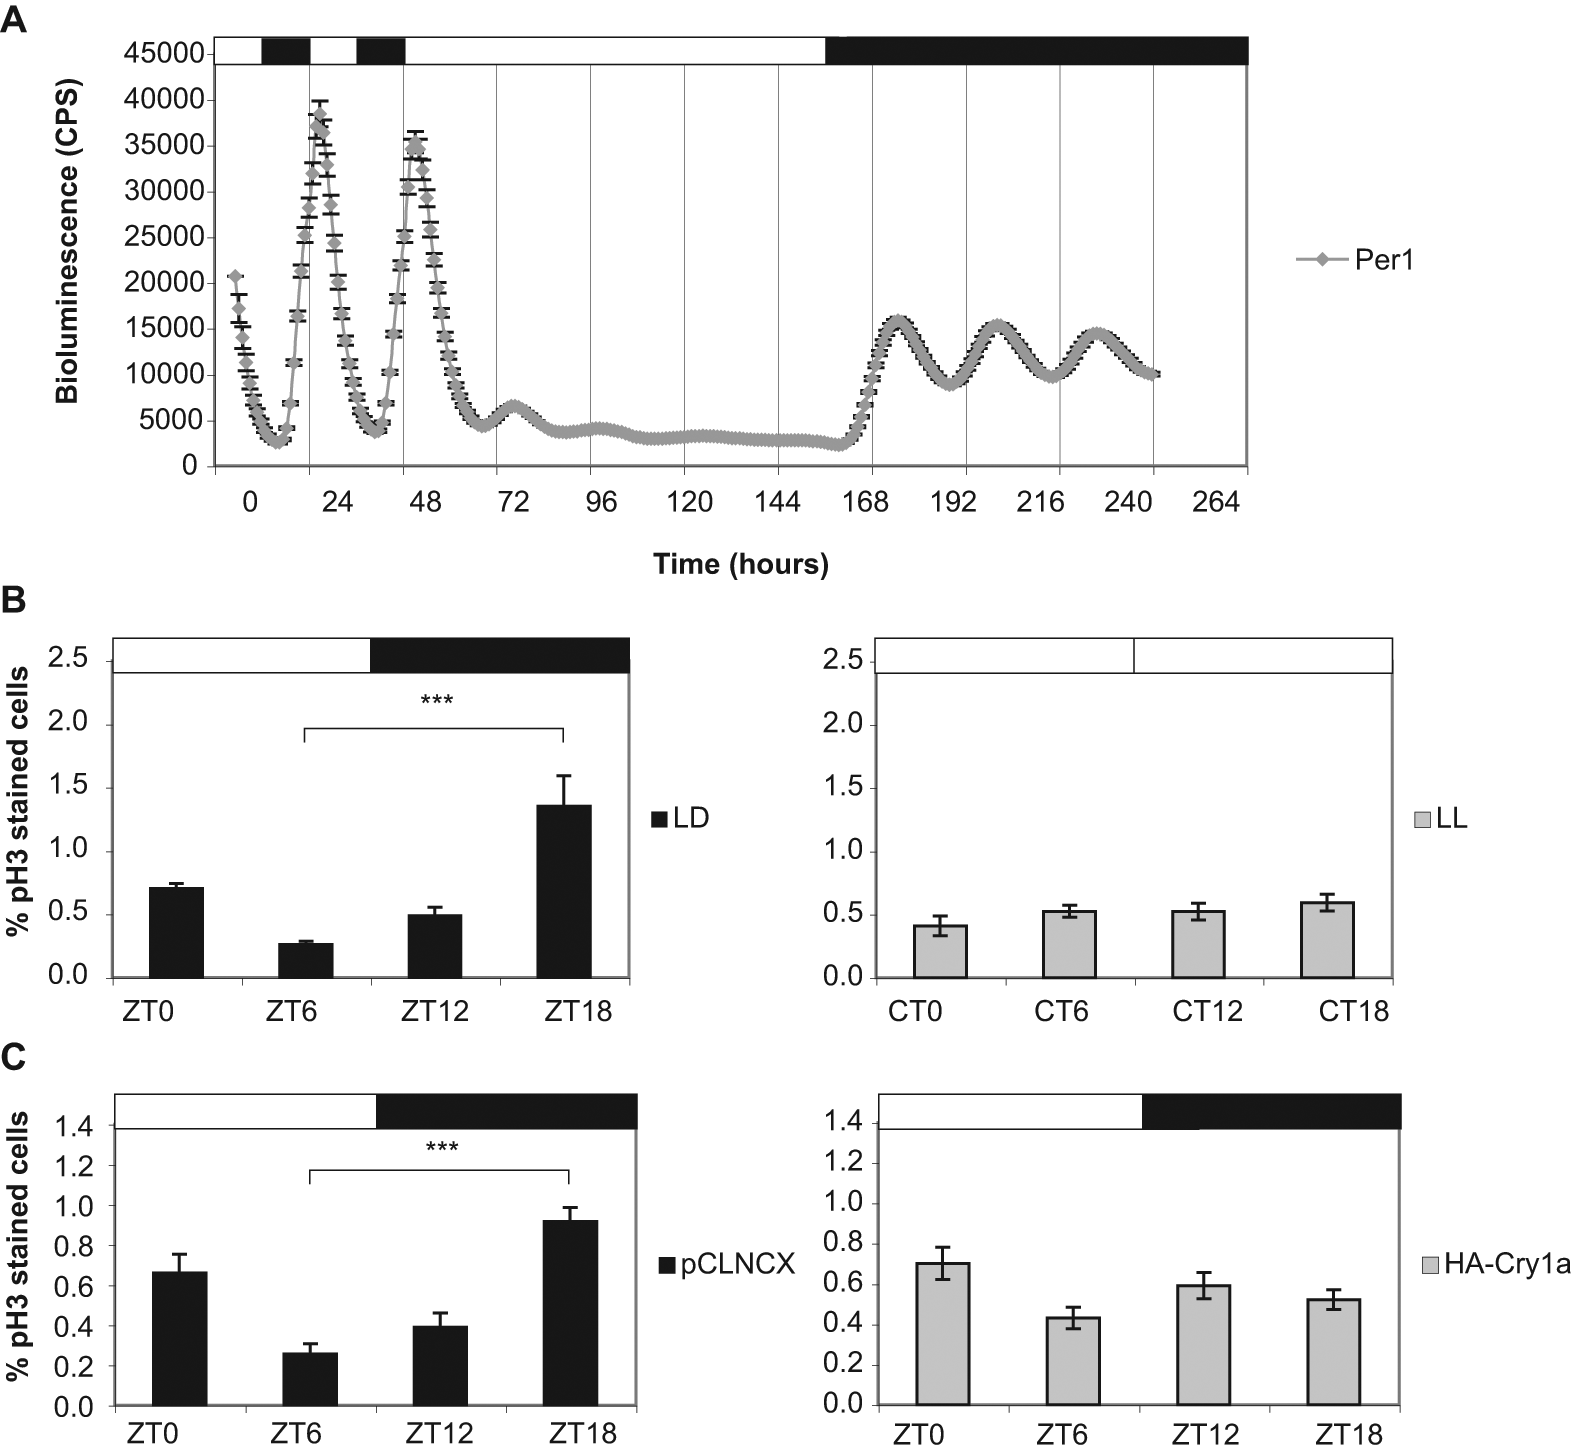
Light abolishes rhythmic mitosis by inhibiting circadian clock function. (A) Bioluminescent traces of Per1-luciferase cells entrained to an LD cycle for 2 days, transferred into LL for 4 1/2 days, and returned to DD for 3 1/2 days. (B) pH3 staining of PAC2 cells maintained in LD (left) versus LL (right). Samples were collected every 6 h at the indicated ZT for LD cells or CT for LL cells. (C) pH3 staining of pCLNCX empty vector controls (left) compared with cells overexpressing HA-Cry1a (right). Samples were harvested at the indicated ZT. Black and white bars represent the dark and light periods, respectively. Peak and trough values at ZT6 and ZT18, respectively, were compared using a Student’s t-test and found to be significantly different (***p < 0.0001). ANOVA of samples from LL and HA-Cry1a cells showed no significant variation.
Light-dependent repression of clock function in zebrafish cells occurs, at least in part, through the light induction of Cry1a, which encodes a potent transcriptional repressor. The Cry1a protein binds directly to core clock proteins CLOCK and BMAL and inhibits their ability to activate transcription, and its overexpression in Per1-luciferase cells appears to mimic the effect of LL (Tamai et al., 2007). We therefore examined whether PAC2 cells overexpressing Cry1a divide rhythmically. pH3 staining shows no circadian rhythm in cell division in Cry1a overexpressing cells (Fig. 2C).
Inhibition of the Cell Cycle Has No Effect on Per1-luciferase Rhythms
We have shown above that the zebrafish clock is clearly regulating circadian rhythms in cell division. We then asked whether blocking the cell cycle might affect the circadian clock. To test this hypothesis, we plated Per1-luciferase cells at a density of 250,000 cells/mL and treated cells tonically with either DMSO or 0.5 µg/mL aphidicolin, a reversible inhibitor of DNA replication. Supplemental Figure S2A shows that 0.5 µg/mL aphidicolin significantly slows zebrafish cell growth compared with the control, as one would expect for an inhibitor of DNA replication. In addition, flow cytometry reveals nearly a 3-fold increase in the percentage of S phase cells in aphidicolin-treated compared with DMSO control cells (Suppl. Fig. S2B). Bioluminescent traces in Supplemental Figure S2C show that the overall photon counts and amplitude are reduced in aphidicolin-treated Per1-luciferase cells compared with controls, probably due to a decrease in the number of cells (as shown in Suppl. Fig. S2A). However, there is no difference in the entrained phase of the Per1 rhythm between treated and DMSO control cells (Suppl. Fig. S2C).
Expression of Several Key Mitotic Regulators Is Clock-Controlled and Suppressed by Constant Light
To determine how the circadian clock and light might influence cell division, we compared the expression of several key mitotic regulators to that of known oscillatory (Per1) and light-regulated (Cry1a) genes (Vallone et al., 2004; Hirayama et al., 2005; Tamai et al., 2007). Quantitative PCR (qPCR) analysis reveals that expression of the zebrafish Cyclin B1, Cyclin B2, and cdc2 genes is rhythmic on an LD cycle (Fig. 3) and, importantly, closely mirrors the precise timing or phase of the mitotic rhythms observed in zebrafish cells (Fig. 1). These genes are required for entry into mitosis and are known to be expressed at high levels during the G2/M phase of the cell cycle (Pines and Hunter, 1989). Rhythmic expression of zebrafish Cyclin B1, Cyclin B2, and cdc2 persists after transfer into DD (Suppl. Fig. S3) and is dramatically reduced in CLOCK1 DN mutant cells (Suppl. Fig. S4). These results demonstrate that several key mitotic genes are clock-controlled in zebrafish cells and provide important clues as to how the circadian clock might regulate the timing of cell division in this system. Unlike mammals, the zebrafish Wee1 and Wee2 genes are not rhythmically expressed in PAC2 cells and appear relatively unaffected in CLOCK1 DN mutant cells (Fig. 3, Suppl. Figs. S3 and S4).
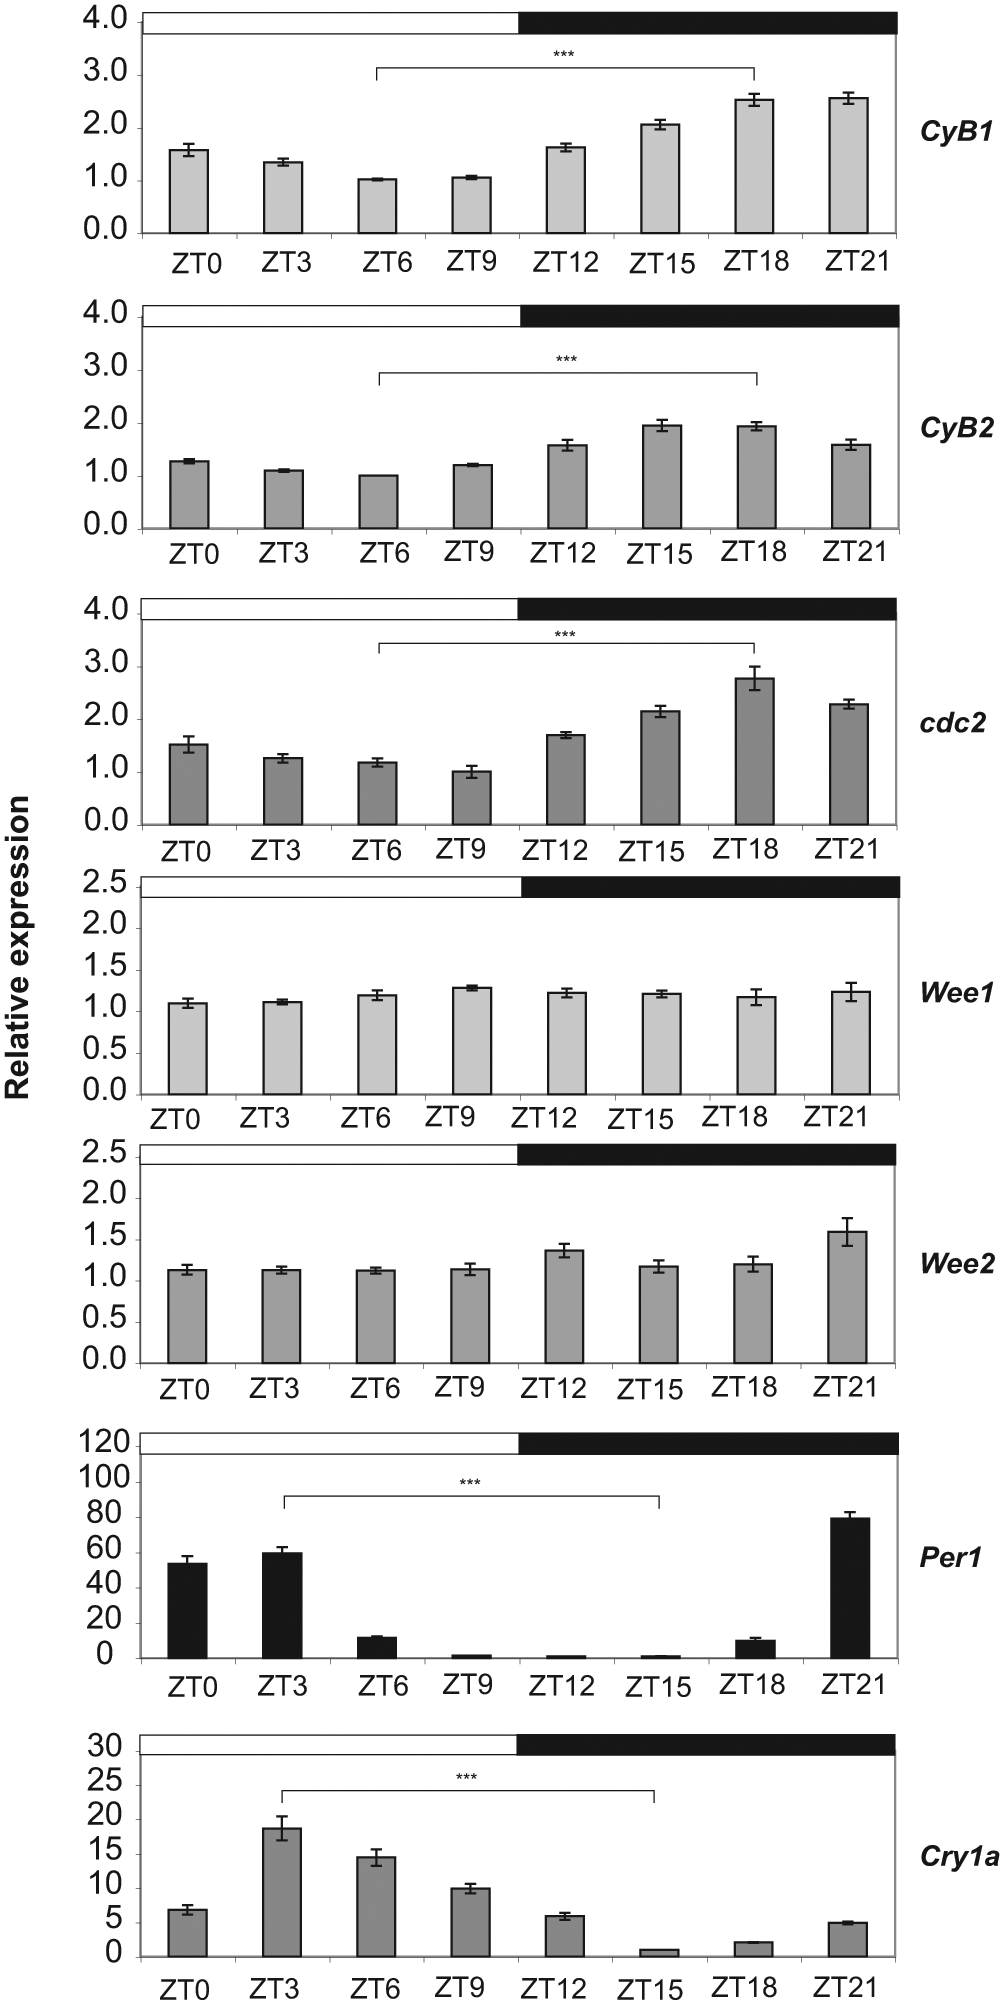
Expression of several key mitotic regulators is rhythmic and clock-controlled. Quantitative PCR analysis of Cyclin B1 (CyB1), Cyclin B2 (CyB2), cdc2, Wee1, Wee2, Per1, and Cry1a gene expression in PAC2 cells on an LD cycle. Total RNA was extracted from PAC2 cells at the indicated ZT. Black and white bars represent the dark and light periods, respectively. Relative expression levels were compared using a Student’s t-test at ZT6 and ZT18 for the CyB1, CyB2, cdc2, Wee1, and Wee2 genes and at ZT3 and ZT15 for Per1 and Cry1a. Differences found to be significant are shown (***p < 0.001). ANOVA tests revealed no significant variation in Wee1 and some variation in Wee2 expression, but this was not circadian.
To monitor mitotic gene expression dynamically, we generated a Cyclin B1-luciferase reporter cell line by stably transfecting PAC2 cells with 4.0 kb of the Cyclin B1 promoter fused to luciferase. Along with our Per1-luciferase cells, these Cyclin B1-luciferase cells allow us to follow both cell cycle and circadian oscillations in parallel in living cells and determine how cell cycle timing alters in response to changes in lighting conditions. Bioluminescent traces of Cyclin B1- and Per1-luciferase cells are consistent with our qPCR data and show rhythmic expression of both genes on an LD cycle, which persists in DD (Fig. 4A). Cyclin B1 expression clearly oscillates, with its peak levels corresponding to the phase of maximal mitotic activity. We believe, therefore, that the timing of this oscillation is one of the key elements in setting up the intrinsic “gate” or “window” in which cells are mostly likely to enter mitosis. This high-resolution analysis also reveals a clear phase difference between Cyclin B1 and Per1 expression, suggesting that these genes might be differentially regulated. Two E-box (CACGTG) and two E′-box (AACGTG) sequences close to the transcription start site of Per1 are known to drive rhythmic expression of this gene in PAC2 cells (Vallone et al., 2004). We searched for potential regulatory elements in the zebrafish Cyclin B1 promoter and found one E-box and one E′-box, which were the only E-box–related sequences in the entire 4.0 kb fragment (Suppl. Fig. S5). A 0.9 kb fragment of the Cyclin B1 promoter contains both E-box and E′-box regulatory elements and shows similar rhythms to the 4.0 kb fragment (Fig. 4B and Suppl. Fig. S5). Deletion of these E-box sequences within the 0.9 kb promoter fragment had no effect on rhythmic expression (Fig. 4B), suggesting that Cyclin B1 is not a direct target of the CLOCK/BMAL heterodimer. A potential, though imperfect, RRE is also present upstream of the two E-boxes (Suppl. Fig. S5). Mutation of this sequence, however, alone or in combination with deletion of the E-boxes, has no effect on Cyclin B1 rhythms (data not shown).
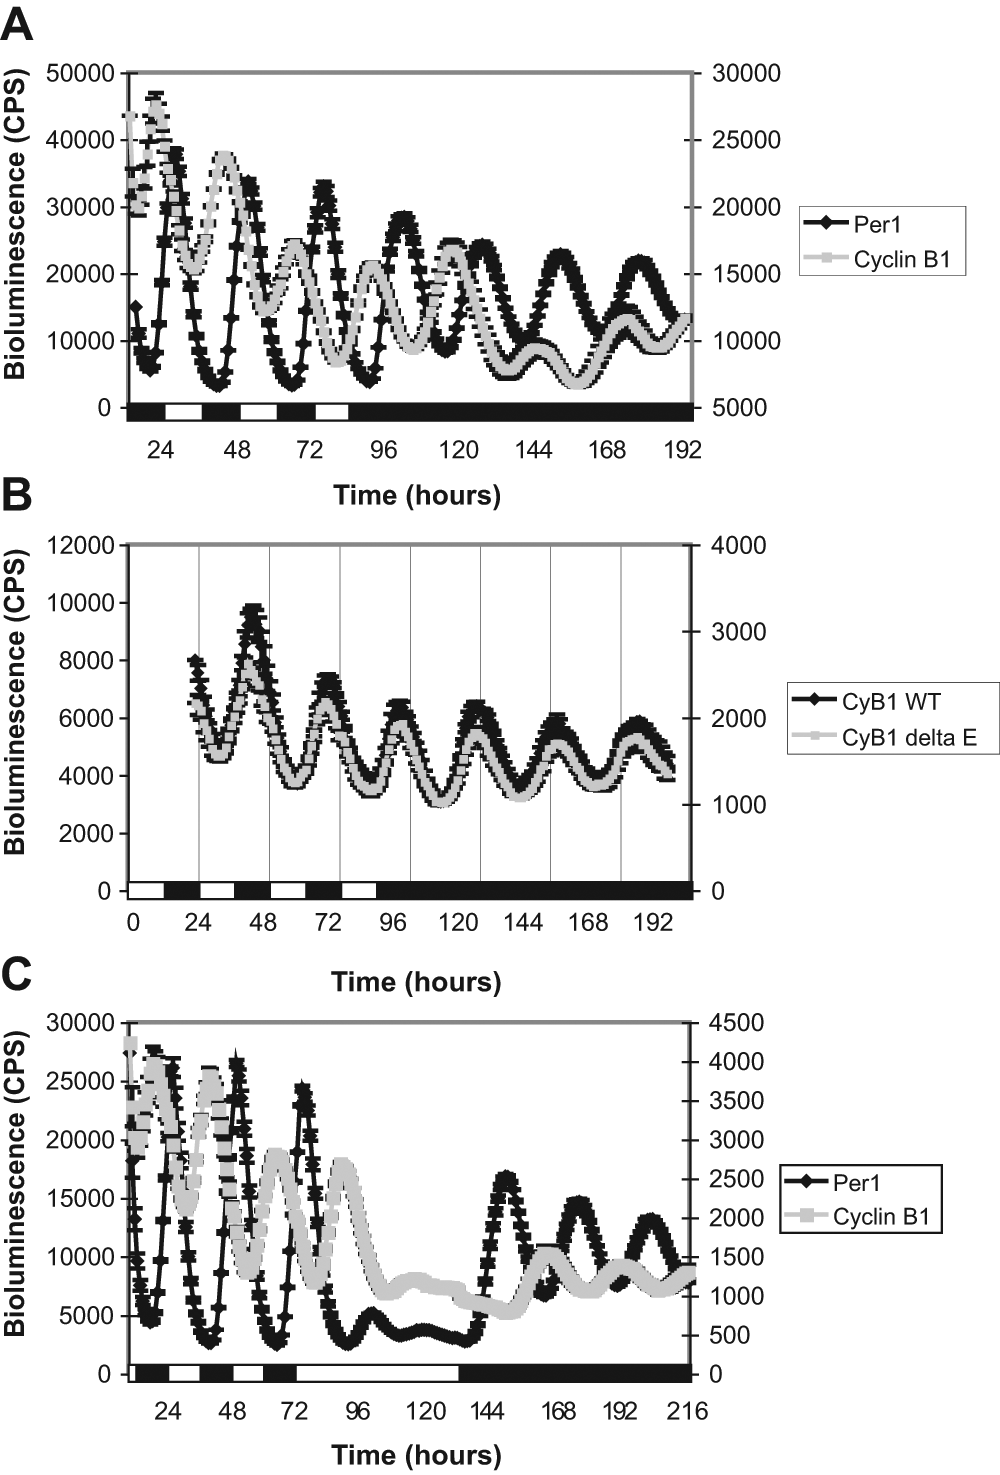
Rhythmic expression of Cyclin B1 does not require E-boxes and is suppressed by light. (A) Bioluminescent traces of Per1-luciferase (black diamonds, left y-axis) and Cyclin B1-luciferase (gray squares, right y-axis) cell lines on an LD cycle and after transfer into DD. (B) Bioluminescent traces of Cyclin B1-luciferase cell lines with wild type (black diamonds, left y-axis) or deletion of two E-box sequences (gray squares, right y-axis) in the zebrafish Cyclin B1 promoter. Cells were maintained in LD and then transferred into DD. (C) Bioluminescent traces of Per1-luciferase (black diamonds, left y-axis) and Cyclin B1-luciferase (gray squares, right y-axis) cell lines on an LD cycle, in LL, and then after transfer into DD. Black and white bars represent the dark and light periods, respectively.
To determine whether light affects mitotic gene expression, we exposed cells to sustained light after 3 days of entrainment on an LD cycle. Bioluminescent traces reveal a strong reduction in both Cyclin B1 and Per1 expression in LL (Fig. 4C). Examination of other mitotic genes by qPCR indicates that Cyclin B2 and cdc2 are also repressed by light, but that the Wee1 and Wee2 genes are not sensitive to this light signal (data not shown).
Inhibition of Circadian Clock Function Suppresses Cell Proliferation
We have shown that day lengths longer than 12 h suppress clock oscillations (Tamai et al., 2007) and repress and maintain Cyclin B1 expression at a low level until cells are returned to the dark (Fig. 4C). We were then interested to test whether light-driven Cyclin B1 repression had any effect on the global rate of cell proliferation. We therefore compared growth of zebrafish cells in LD versus LL. PAC2 cells were plated at a density of 100,000 cells/mL and maintained on an LD cycle or in LL for up to 7 days. Cells were then harvested by trypsinization and counted using a hemocytometer. These experiments show that sustained light exposure has a significant effect of slowing cell proliferation (Fig. 5A). As previously mentioned, light exposure increases the level of Cry1a expression in these cells. Interestingly, overexpression of Cry1a mimics the action of light on proliferative rates and significantly slows the cell cycle in PAC2 cells (Fig. 5B). Finally, consistent with light repressing clock function, we show that CLOCK1 DN mutant cells also proliferate significantly more slowly than control cells (Fig. 5C).
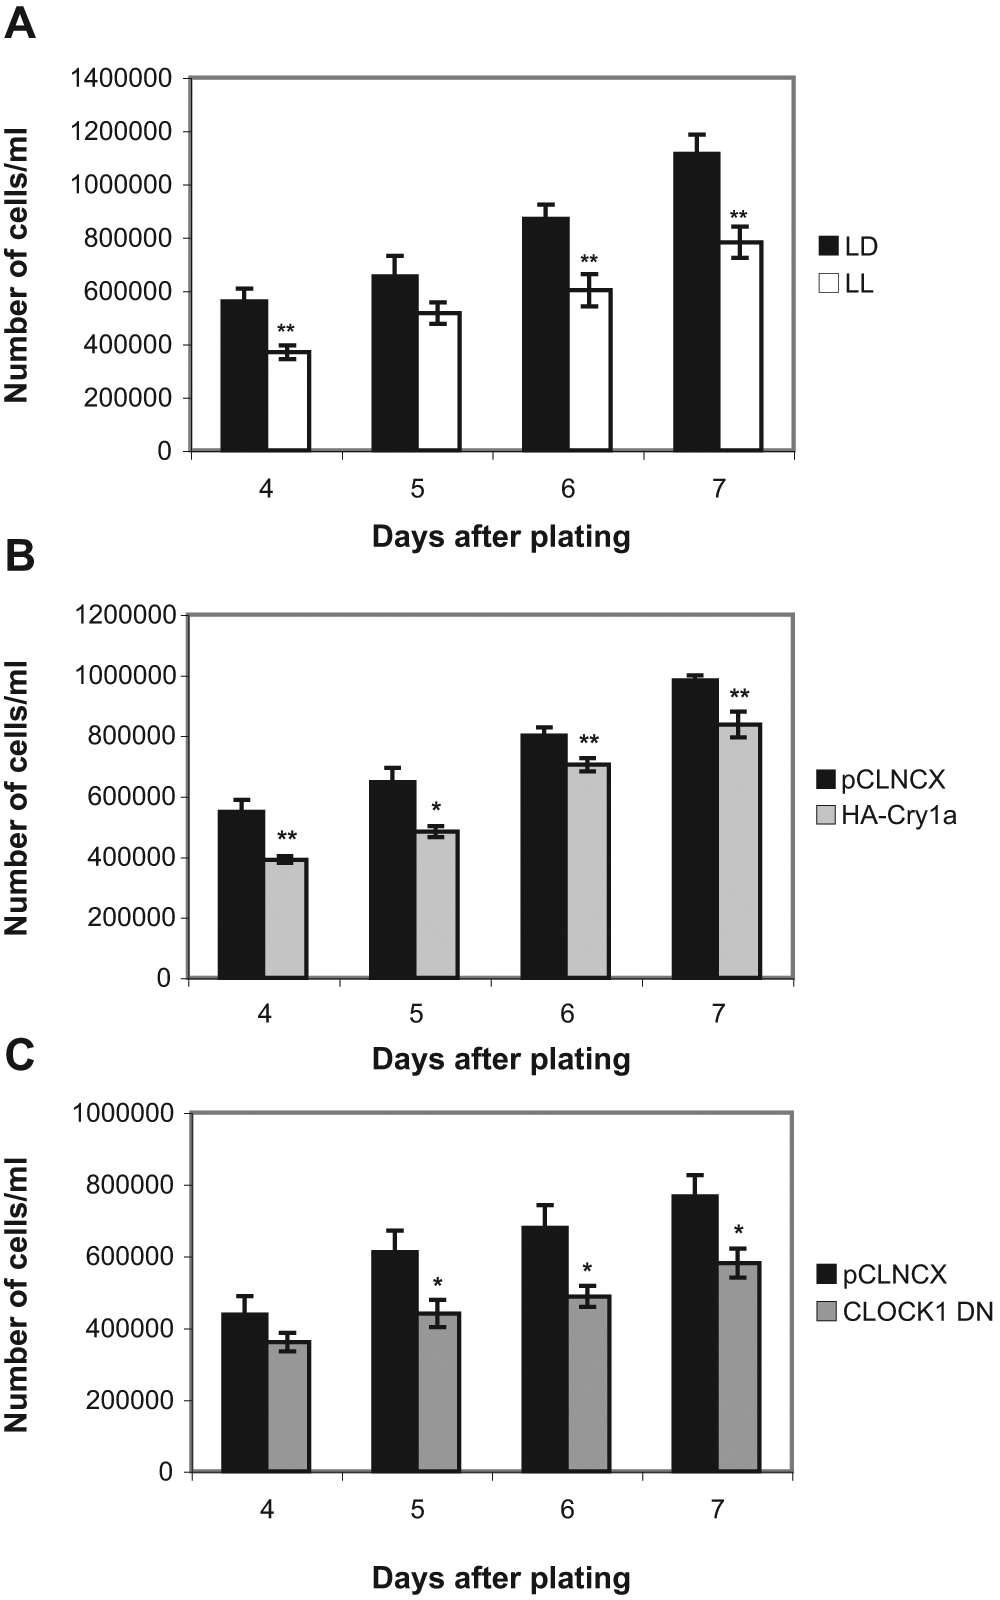
Inhibition of circadian clock function suppresses cell proliferation. Growth of zebrafish PAC2 cells was assessed in (A) LD versus LL, (B) pCLNCX empty vector control versus HA-Cry1a overexpressing cells, and (C) pCLNCX versus CLOCK1 DN cells. Data are shown as mean number of cells/mL ± SEM, and statistical analysis was performed using a Student’s t-test. Differences found to be significant between control and experimental samples are shown (*p < 0.05; **p < 0.01).
Discussion
The topic of circadian clock regulation of the cell cycle is not new, but is one that has regained interest recently, not least as a consequence of numerous epidemiological studies that have shown a link between clock disruption and cancer risk (Johnson, 2010; Gery and Koeffler, 2010; Yu and Weaver, 2011). This phenomenon clearly exists in unicellular organisms, but whether it is also a cell autonomous process in multicellular organisms is a little more contentious. Previous studies in mouse NIH3T3 cells showed circadian gating of cell cycle events (Nagoshi et al., 2004). A more recent study in Rat-1 fibroblasts drew the opposite conclusion, with a clear uncoupling of the clock from cell cycle timing (Yeom et al., 2010). From the data shown in this study, however, the situation in zebrafish cells is quite clear. There is an obvious circadian rhythm in mitosis in zebrafish embryonic cell cultures. This rhythm persists under constant dark, free-running conditions, following entrainment to a light-dark cycle, and is severely reduced in clock mutant cells. This is a clear demonstration that a functional clock in a cell line is absolutely necessary for the timed regulation of mitosis. Furthermore, exposing CLOCK1 DN cells to an LD cycle is unable to drive or “mask” rhythmic cell division, indicating that this process is directly clock-controlled. This suggests that light itself appears to have little or no influence on rhythmic control of the cell cycle in zebrafish, except via the circadian pacemaker.
Although light cannot drive a daily mitotic rhythm in zebrafish cells, it can certainly repress circadian clock function. We have previously shown that light acts on the core circadian oscillator, through the induction of Cry1a, to suppress Per1 expression levels and hold them constant, as long as light is present (Tamai et al., 2007). In this study, we show that sustained light exposure not only suppresses clock function but, as a consequence, also eliminates the cellular rhythm in mitosis. This effect is mimicked in Cry1a overexpressing cells, which fail to divide rhythmically. The light induction of Cry1a appears to be a key molecular event for the light-dependent suppression of rhythmic mitosis in zebrafish cells, via its action on the core clock mechanism.
To determine whether inhibiting the cell cycle has any effect on the circadian clock, we treated Per1-luciferase cells with the DNA replication inhibitor aphidicolin. This treatment clearly reduces cell proliferation, as shown by the significant decrease in cell number in the treated cultures compared with controls, and increases the number of cells locked in S phase (Suppl. Figs. S2A and S2B, respectively). However, the nature of the entrained Per1-luciferase rhythm is very similar between control and treated cells, with the phase and waveform of the circadian oscillation remaining identical (Suppl. Fig. S2C). There is a reduction in the strength or level of the luminescent signal following aphidicolin treatment, but we believe that this is almost certainly due to the lower number of cells remaining in this culture. This result confirms the idea that progression through the cell cycle itself, and an oscillation in the molecular components underlying the cell cycle, do not feed back onto the circadian mechanism and influence the generation of a 24-h rhythm.
We show that a number of genes known to be important for mitotic regulation are under clock control in our zebrafish cell lines. Rhythmic expression of these cell cycle genes, such as Cyclin B1, Cyclin B2, and cdc2, not only free-runs in constant darkness following entrainment, but also is disrupted in clock mutant cell lines. The robustness of the Cyclin B1 rhythm can be seen in cell lines transfected with a Cyclin-B1-luciferase reporter construct. These luminescent cells not only reveal the timing of gene expression, but clearly demonstrate how strongly a long duration light pulse suppresses Cyclin B1 expression. Light feeds into this system, not only to lower the expression of core clock genes but also to strongly repress the expression of a major mitotic regulator, Cyclin B1. Expression of Cyclin B1 is rhythmic in zebrafish cells. Our promoter analysis, however, shows that this is not the consequence of direct transcriptional control through E-boxes and CLOCK/BMAL binding. Curiously, these results are similar to the human Cyclin B1 promoter, which also contains an E-box, but is not directly bound or regulated by CLOCK/BMAL (Muñoz et al., 2002). An imperfect RRE is also present in the zebrafish Cyclin B1 promoter, but mutation of this regulatory sequence, alone or in combination with the E-box deletions, has no effect on Cyclin B1 rhythms. These results indicate that this gene is indirectly clock-regulated.
Our results show that Wee1 and Wee2 are not oscillating or clock-controlled in any manner, indicating that these genes do not drive the rhythmic regulation of mitosis in zebrafish cells, as has been hypothesized in regenerating mouse liver (Matsuo et al., 2003). This is a point worth noting, as it suggests that this proposed mechanistic link between the clock and the cell cycle might not be universally conserved and that different tissues, cell types, or even organisms may use their own unique points of regulation. Along these lines and in contrast to a recent study (Hirayama et al., 2005), our qPCR analysis shows that Wee1 is not induced by light in PAC2 cells (Fig. 3, Suppl. Figs. S3 and S4).
Cell proliferation is slowed in clock mutant cells as well as in cells exposed to constant light or overexpressing Cry1a. Possessing a functional circadian clock is therefore important for optimal cell growth. Our gene expression studies and luminescent reporter data show that not only does clock disruption prevent a daily rhythm in cell cycle gene expression, but it in fact reduces the level of expression of these critical cell cycle components. This impact on elements of the cell cycle is one likely explanation as to why cells with such timing defects show significantly slower growth rates. These results in zebrafish embryonic cell lines raise obvious questions about the role of light and the circadian clock during zebrafish development. We are currently exploring the effect of raising embryos in constant light, as well as disrupting the circadian clock itself, on zebrafish development.
It is interesting that disruption of a functional clock leads to a slowing in proliferation rates in zebrafish cells, as it has been suggested that a loss of clock control may play a role in accelerated or unregulated cell division in certain mammalian cancers (Filipski et al., 2002; Filipski et al., 2004). Our results, however, are consistent with observations in embryonic fibroblasts isolated from clock mutant mice, and in cells virally transfected with small interfering RNA constructs against mouse CLOCK, which show a significant decrease in growth rate compared with controls (Miller et al., 2007; Antoch et al., 2008). In zebrafish cells, it is clear that possessing a functional cellular clock not only is essential for cell cycle timing but also is important for achieving optimal growth rates.
Footnotes
Acknowledgements
We give special thanks to Sukhveer Purewal, Tina Luke, Kirsty Sharrock, and Derek Davies in the FACS facility at Cancer Research UK (Lincoln’s Inn Fields, London, UK) for their superb technical assistance. We gratefully acknowledge visiting students Águeda Jimena Martín Robles (University of Cádiz, Spain) for help in generating cell lines used in this study and Matt LaBella (currently at University of Utah, Salt Lake City, UT) for help with growth assays. Finally, we thank all members of the Whitmore lab for their valuable comments on the manuscript. This work was supported by grants from Cancer Research UK, the BBSRC and ERASysBio+.
The author(s) declared no potential conflicts of interest with respect to the research, authorship, and/or publication of this article.
References
Supplementary Material
Please find the following supplemental material available below.
For Open Access articles published under a Creative Commons License, all supplemental material carries the same license as the article it is associated with.
For non-Open Access articles published, all supplemental material carries a non-exclusive license, and permission requests for re-use of supplemental material or any part of supplemental material shall be sent directly to the copyright owner as specified in the copyright notice associated with the article.