
Abstract
This study investigates the impacts of upzoning and higher density zoning on housing development at the parcel level in the city of Portland (Oregon) during the period from 2000 to 2017. The study uses a quasi-experimental design to compare upzoned parcels and parcels in higher density zones with their corresponding control parcels that are identified through propensity score matching. The study shows that both upzoning and higher density zoning led to significantly greater development probabilities, higher development densities, and more housing supply. Upzoning could be an effective policy tool for increasing housing supply, particularly when it is applied to vacant and underutilized parcels.
Introduction
Upzoning has become a popular planning tool for American cities to address the housing affordability and inequality problems. In July 2019, the Oregon legislature passed a measure that banned single-family zoning and allowed at least duplexes in single-family neighborhoods in cities with more than 10,000 people and the entire Portland metropolitan area (Wamsley 2019). Before Oregon, the Minneapolis (Minnesota) City Council approved the city’s 2040 Comprehensive Plan that would upzone nearly the entire city to legalize duplexes or triplexes in neighborhoods originally zoned for single-family homes only (Capps 2018). Other cities such as Seattle (Washington) and Austin (Texas) also loosened their zoning codes recently to allow developers to build more homes on plots that were zoned for single-family homes (Holder and Capps 2019). The motivations for upzoning are multifaceted. Upzoning allows developers to build more homes, increases housing supply, and alleviates upward price pressures. For land parcels that are under-zoned, upzoning removes the regulatory barriers for them to achieve their highest and best use and speeds up development. Upzoning may also promote housing diversity in terms of price and tenure by allowing multifamily homes in single-family neighborhoods.
Despite the high expectations for upzoning, empirical research of the impacts of upzoning on housing development is limited for a few reasons. First, large-scale upzoning was rare until recently and we had few opportunities to observe the impacts of upzoning on the housing market (Freemark 2019; Gabbe 2018, 2019a). Second, housing developments usually take a few years to take place. An analysis of the impact of upzoning on housing development requires multiple-year historical data of land development and zoning at the parcel level. Such longitudinal data are not easy to collect. Third, the two-way relationship between land use control and housing developments makes it difficult to tease out cause and effect. Some studies at the regional level used instrumental variables (e.g., geographic or historical characteristics of communities) to address the endogeneity problem and to estimate the effects of land use regulations on housing prices (e.g., Ihlanfeldt 2007; Saiz 2010). Instrumental variables at the parcel level, however, are hard to find.
This study contributes to the literature by exploring the impacts of zoning and upzoning on housing developments at the parcel level in the city of Portland, Oregon. The research hypothesis is that upzoning and higher density zoning boost housing production by increasing development probability and allowing greater development density. To test this hypothesis, I obtained data from multiple sources to measure zoning, upzoning, and housing developments in Portland in an eighteen-year period (2000–2017). To mitigate the potential endogenous relationship between upzoning and housing developments, I compared upzoned parcels with control parcels that I identified via propensity score matching. Because the scale and the scope of upzoning in Portland was limited during the study period, I complemented my study of upzoning with an analysis of how higher density zoning influenced housing developments. Through the survival analysis technique, I demonstrated how the impacts of zoning and upzoning on housing development took place over time.
This study shows that both upzoning and higher density zoning lead to significantly higher development probability, greater development density, and more housing supply. The findings of this study suggest that upzoning could be an effective policy tool for increasing housing supply. The effect of upzoning are stronger when it is applied to vacant parcels and underutilized parcels rather than fully developed parcels.
The rest of this paper is structured as follows. I review prior studies that examine the impacts of land use regulations on housing developments in the next section. I introduce the study area, data, and measurement of key variables in the “Study Area, Data, and Measurement” section. I describe the quasi-experimental design in the section “Research Design.” I present the analyses of the impacts of upzoning and higher density zoning on housing development in the sections “Analysis I: Upzoning and Housing Developments,” “Analysis II: Zoning and Vacant Land Development,” and “Analysis III: Zoning, Infill Development, and Redevelopment.” The last section discusses the limitations and major findings of this study as well as their implications on planning policy and future research.
Land Use Regulations and Housing Developments in Context
My survey of literature suggests that prior studies of the impact of upzoning on housing developments are quite limited. In this section, I review three strands of literature that are broadly relevant: land use regulations and housing prices, land use control and housing construction, and zoning/upzoning and housing development.
Early empirical studies of land use regulations focused on their impacts on housing prices, with the bulk of the papers consistently finding that more restrictive regulations were associated with higher home prices (Glaeser and Gyourko 2003; Ihlanfeldt 2007; Kok, Monkkonen, and Quigley 2014; Mayer and Somerville 2000). These studies suggested that strict land use control reduced housing supply and pushed up home prices by requiring minimum lot size, causing delay in the development process, and increasing the administrative costs and fees. The studies that examined the impacts of land use regulations on land prices yielded mixed results. Ihlanfeldt (2007) found a negative impact of land use regulations on the prices of vacant residential land in Florida. A study in the San Francisco Bay area (Kok, Monkkonen, and Quigley 2014), however, found that land prices tended to be higher in municipalities where it took a greater number of reviews to obtain a building permit or a zoning change. While almost all these studies focused on how land use regulations influenced housing and land prices through the supply side of the market, it is important to note that the positive impacts of land use control on housing prices could be from the supply and/or the demand sides of the market. Higher housing prices in communities with more restrictive land use control could reflect the premium of living in a more exclusive community (Paulsen 2013). Unfortunately, few previous studies explicitly differentiated the effects from the two sides of the market (Jackson 2016).
The studies of the impacts of land use regulations on housing construction showed that strict local land controls reduced housing production (Chakraborty et al., 2010; Glaeser and Ward 2009; Jackson 2016; Mayer and Somerville 2000; Pendall 2000; Thorson 1997) or shifted new housing developments to adjacent municipalities with less restrictive land use control (Levine 1999). Most of these studies compared land use regulations and housing constructions across a number of municipalities or metropolitan areas. Some focused on one specific regulation such as density zoning (Chakraborty et al., 2010; Glaeser and Ward 2009; Thorson 1997). Others constructed summary indexes of land use regulations that included many types of land use controls such as general growth control, administrative procedures to obtain permits or rezone land, zoning control, and concurrency requirement (Jackson 2016; Levine 1999; Mayer and Somerville 2000; Pendall 2000). The majority of the studies in the latter group found that zoning control, among many land use regulations of different natures, had the strongest effect on restricting housing construction (Jackson 2016; Levine 1999; Pendall 2000).
Studies that explicitly evaluated the impacts of upzoning on housing developments were limited. A few studies explored the motivations for upzoning. Munneke (2005) showed that rezoning was more likely to occur when landowners found that the prices of their land would increase if they re-zoned their land into alternative uses. Gabbe (2018, 2019a, 2019b) examined upzoning in Los Angeles and the Silicon Valley. His studies found that upzoning was rare in both regions and occurred in a piecemeal and bottom-up fashion. The chance of upzoning was significantly associated with two major factors: future development potential and political resistance. Dong and Hansz (2019) examined the associations between development density, zoning, and single-family home prices in Portland, Oregon. Their study suggested that development density (measured as lot size) had a weak impact on single-family home prices while housing size (measured as floor area) had a much stronger effect on single-family home prices. Higher density zoning exhibited a negative association with the prices of existing single-family homes and an insignificant association with the prices of new single-family homes. Freemark (2019) conducted one of the few studies that explicitly examined the impacts of upzoning on property values and housing construction at the individual property level. He used difference-in-difference tests to evaluate Chicago’s upzoning in the city’s rail-transit station areas. His study found a significant increase in property values in upzoned areas, which was likely due to the speculation over future redevelopment at higher densities. The study, however, found no impacts of upzoning on the number of housing permits. It is unclear whether this is because the study period (five years) was not long enough to detect the impact of upzoning on housing developments.
Researchers usually had to face one or more of the following challenges to evaluate the impacts of land use regulations on housing developments. Researchers had to aggregate different land use controls into one or a few summary indexes to make inter-regional comparisons because different municipalities and regions coded their land use regulations in different ways. The aggregation could cause loss of information and even mismeasurements. It was time-consuming and costly to conduct a survey of land use regulations across many municipalities and regions. Surveys that relied on planners’ subjective evaluation of local land use controls might not provide an accurate measure of regulatory stringency (Lewis and Marantz 2019). Not only that, it took a long time period to observe significant changes of land use regulations because land use regulations tended to be static (Freemark 2019; Gabbe 2018, 2019a). This forced some researchers to use cross-sectional data to analyze the effects of land use regulations, which prevented them from making causal inference. The potential endogenous relationship between land use regulations and housing developments posed another challenge to researchers. Longitudinal data on land use regulations were difficult to obtain. High-quality instrumental variables were hard to find and this was particularly true when the spatial scale of the analysis was at the individual property level rather than at the municipal or regional level.
This study contributes to the small but growing literature on the impacts of zoning and upzoning on housing development at fine spatial scales. I measured zoning, upzoning, and housing developments at the parcel level, providing a micro-level perspective on their relationships. The analysis focused on one municipality and I measured zoning and upzoning in an objective way. The lengthy study period (2000–2017) provided the observation windows (fifteen to seventeen years) that were long enough to observe land development. I mitigated the potential selection bias in upzoning and higher density zoning by identifying control parcels via propensity score matching. The findings of this study enrich the ongoing debate over whether and how upzoning could speed up housing developments and increase housing supply.
Study Area, Data, and Measurement
Study Area
The context of this study is the city of Portland, Oregon. Portland is the largest city in Oregon with a population of 630,331 in 2017. Portland is interesting to study for a few reasons. Portland is known for its efforts to promote compact development and smart growth (Dong 2016). Portland has a flexible zoning system in which a great variation of development density is possible. The city constantly updated its zoning code in the past two decades and provided us with a sample of upzoned parcels that was large enough for meaningful statistical analysis. Home prices in Portland grew quickly in the past two decades (S&P Dow Jones Indices LLC, n.d.). There have been constant debates over the impacts of Portland’s growth management policies on housing affordability (Downs 2004). Recently, the Oregon state legislature passed the House Bill 2001, which banned single-family zoning and allowed up to fourplexes in single-family neighborhoods in the entire Portland city (Wamsley 2019). One major principle underlying the House Bill 2001 was to increase housing diversity and alleviate housing shortage. Both the advocates and opponents of the bill are watching closely to see how the bill will affect Portland’s housing market. This study provides a parcel-level perspective on the potential impacts of upzoning on housing developments in Portland and other American cities that are relaxing zoning restrictions.
Data Source
I relied on Portland Metro’s Regional Land Information System (RLIS) to identify the zoning and development status of individual land parcels in the city of Portland from 2000 to 2017. I identified 192,662 land parcels in Portland in 2000 and tracked their base zoning and development status in each year until 2017. The Bureau of Planning and Sustainability of the city of Portland provided me with the data of the city’s overlay zones and planning districts in 2001, 2011, and 2017. This study focused on the changes of base zoning while controlling for the changes of overlay zones and planning districts.
I downloaded Census 2000 data at the block group level to measure the neighborhood environment of each individual parcel in 2000. I downloaded the American Community Survey (2013–2017) five-year data at the block group level to measure neighborhood changes between 2000 and 2017. To measure non-residential activities at the neighborhood level, I downloaded the employment data from the Longitudinal Employer-Household Dynamics (LEHD) data set in 2002 (the earliest year in which the data were available) and 2017. I merged the data at the individual parcel level with the data at the neighborhood (Census block group) level.
Measurement: Zoning and Upzoning
Portland’s zoning system consists of three layers: base zones, overlay zones, and plan districts. As of 2017, Portland had six single-family residential (SFR) base zones and six multifamily residential (MFR) base zones, as shown in Table 1. About a half (51.5%) of residential land was zoned for medium-density single-family homes (R5 and R7). A quarter (24.5%) was zoned for low-density single-family homes (RF, R20, and R10). A fifth (20.7%) was zoned for high-density single-family homes (R2.5) and low-density multifamily homes (R1, R2, and R3). The remaining 3.3 percent was zoned for high-rise multifamily homes. On the top of base zones, Portland created nineteen overlay zones. Overlay zones imposed an additional layer of regulations on base zones. The alternative design density overlay zone (hereafter referred to as “density overlay”) was particularly relevant because it allowed increased density for development that met additional design compatibility requirement.
Residential Zoning in Portland in 2017.
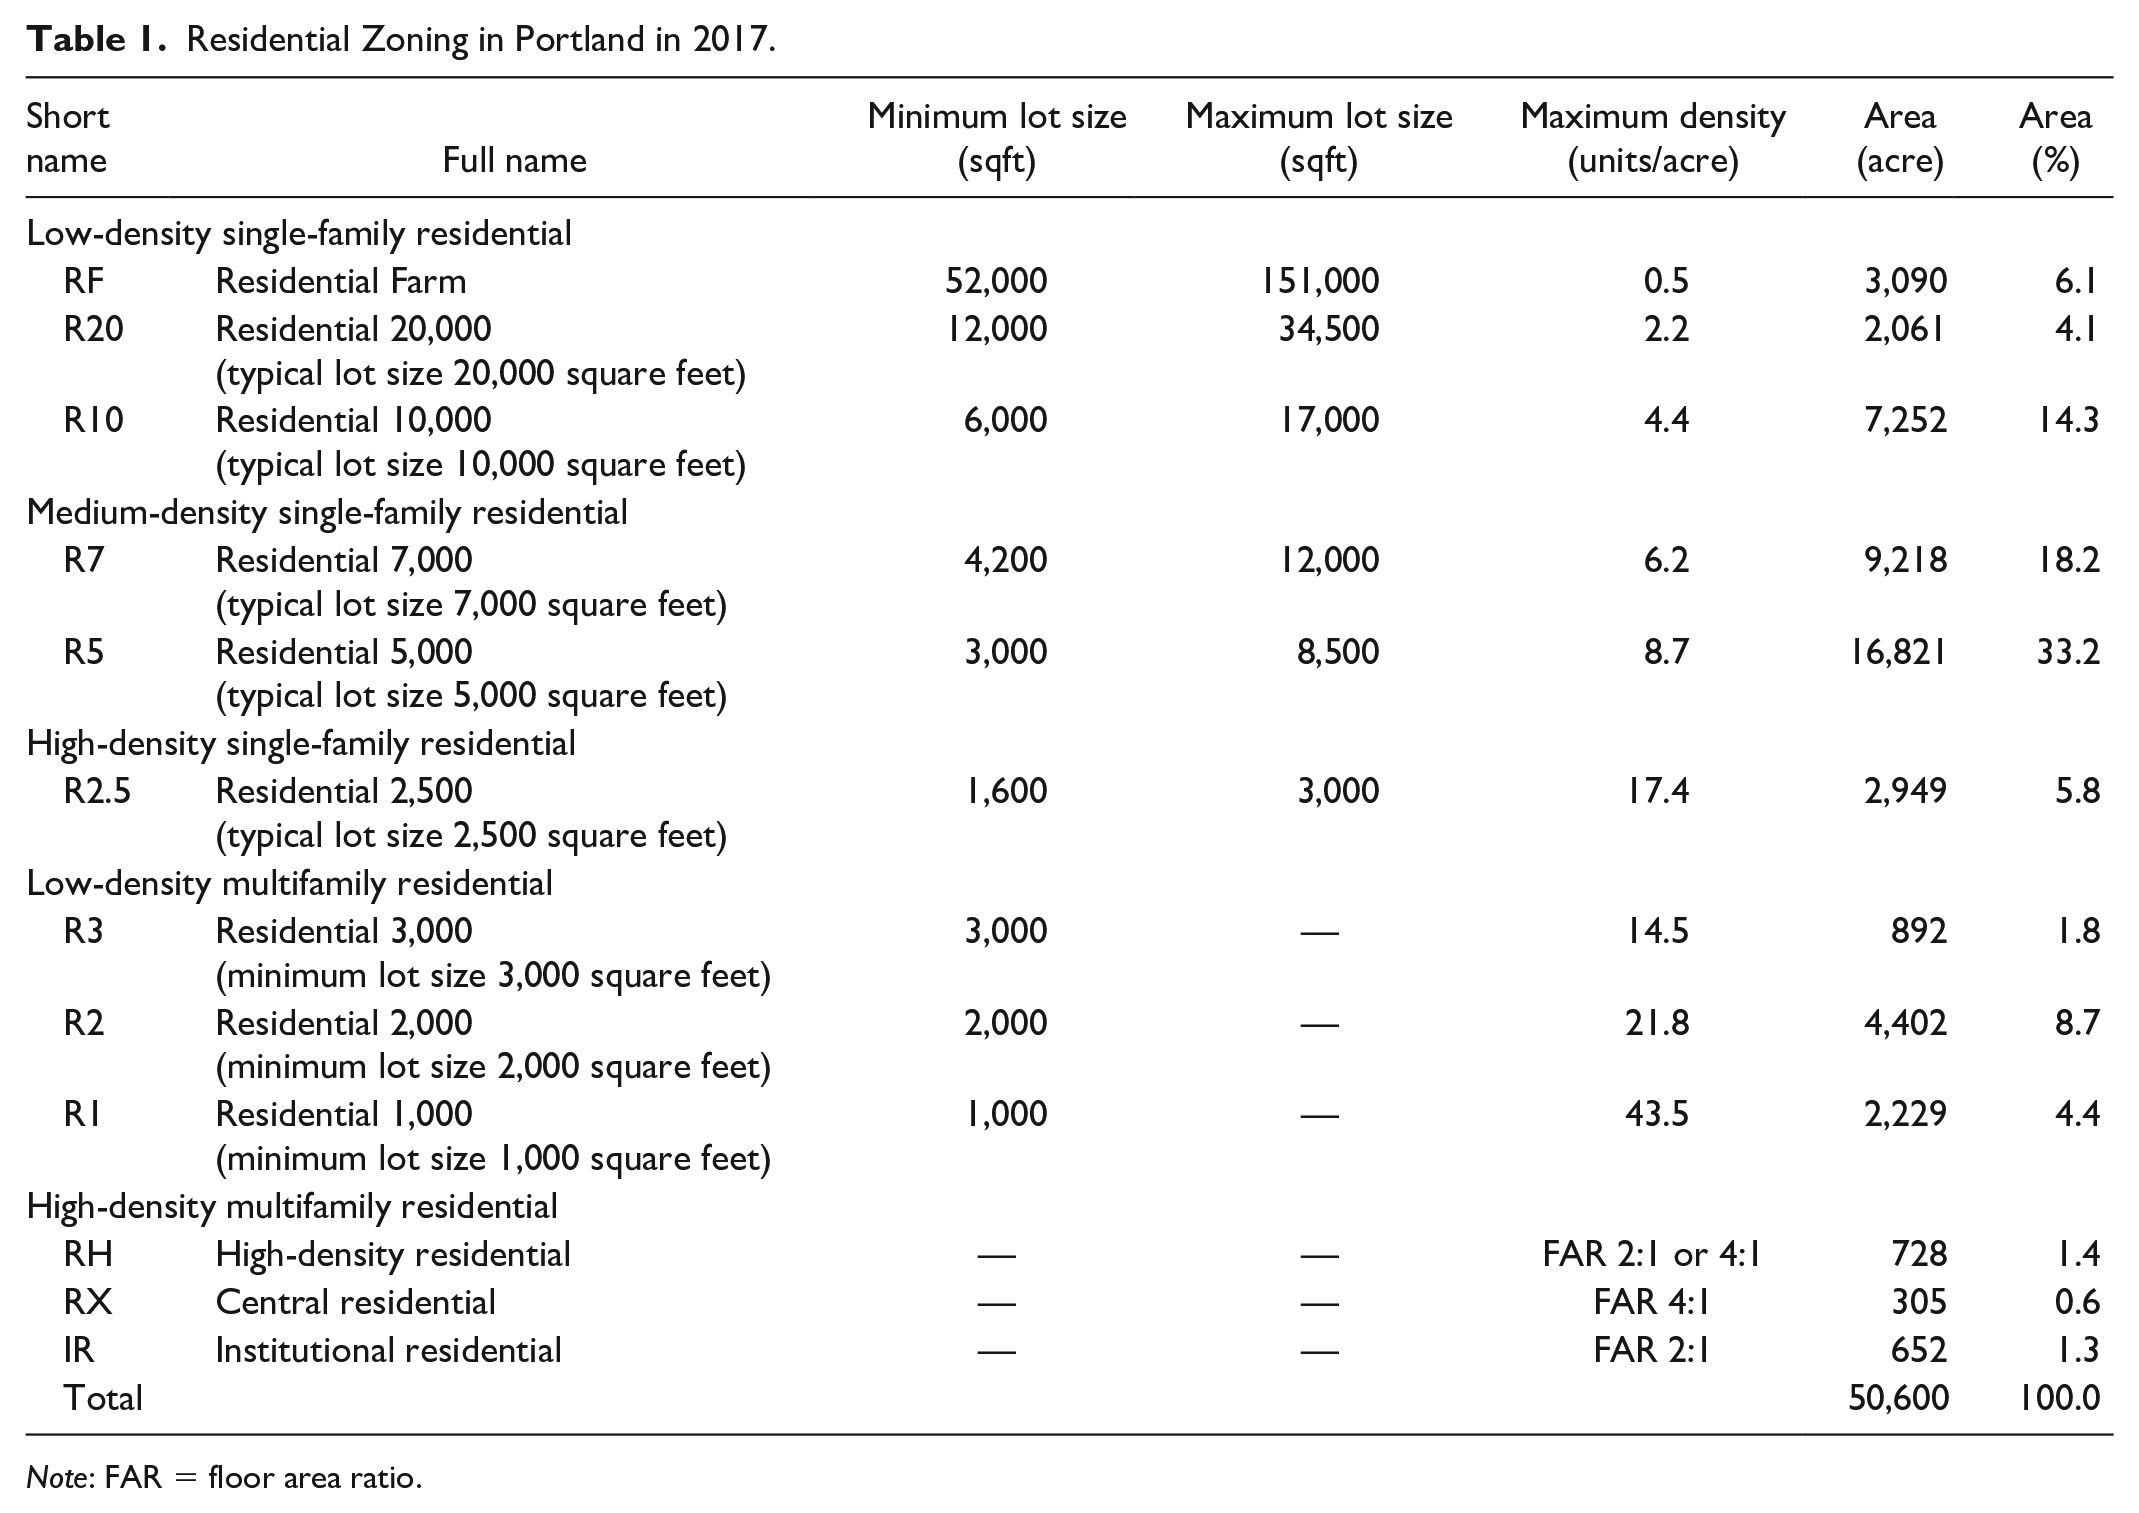
Note: FAR = floor area ratio.
I defined upzoning as an increase of the maximum residential development density that was allowed by the base zone. I controlled for the changes of overlay zones during the period from 2001 to 2011 and the period from 2011 to 2017. I confined my analysis to land parcels that were consistently zoned for residential purposes during the study period and excluded land parcels that were re-zoned from residential to non-residential purposes or vice versa.
The data suggest that a total of 1,394 acres of residential land was upzoned during the eighteen-year study period (2000–2017). Almost a half of them (679 out of 1,394 acres) took place between 2001 and 2002. Upzoning between 2000 and 2017 mainly occurred within and between low- and medium-density SFR zones. Upzoning from SFR zones to MFR zones was rare. Among the residential parcels that were upzoned between 2000 and 2017, about a third (31.9%) were from R10 to R7, 10.6 percent were from R20 to R10, and 10.3 percent were from R7 to R5. Only 14.1 percent of them (197 out of 1,394 acres) were upzoned from SFR zones to MFR zones.
Upzoning between 2001 and 2002 (the focus of the following analyses) followed a similar but stronger pattern. Among the residential parcels that were upzoned between 2001 and 2002, about half of them (52.2%) were from R10 to R7, 17.7 percent were from R20 to R10, and 14.7 percent were from R7 to R5. Almost all these upzoned parcels were in Southwest Portland. The upzoning was mainly a result of the adoption of the Southwest Community Plan by the Portland City Council in July 2000. One planning objective set by the Southwest Community Plan was to “encourage the realization of compact, transit and pedestrian-friendly, mixed-use centers” and “allow infill housing opportunities” outside of the mixed-use areas (The City of Portland, n.d.).
Southwest Portland was one of the fifteen single-family zones in Portland’s first zoning ordinance which was approved by Portland voters in 1924 (City of Portland Bureau of Planning and Sustainability 2019). Most neighborhoods in Southwest Portland are predominantly single-family neighborhoods. In 1995, Portland Metro, the metropolitan planning organization for the greater Portland region, adopted the Metro 2040 Growth Concept, setting a course for the region to reduce sprawl by concentrating urban growth in urban centers, sub-centers, and major transportation corridors (Metro, n.d.). To increase density in the city, the Portland City Council adopted new community plans in eight planning areas around 2000 and the Southwest Community Plan was one of them (City of Portland Bureau of Planning and Sustainability 2019). The draft plan proposed to rezone large areas of low-density detached single-family zoning to attached single-family zoning but the final plan was much less ambitious because of neighborhood resistance (City of Portland Bureau of Planning and Sustainability 2019).
Measurement: Housing Developments
I evaluated the development status of each land parcel by comparing their baseline status in 2000 with their status in 2017. I inferred the time of development by the year in which a new structure was built. Some new developments occurred on vacant parcels. Others were infill developments and redevelopments on parcels that already had improvements on them. Developers might subdivide a large parcel or combine a land parcel with neighboring parcels for developments. In this analysis, I considered a land parcel to have experienced development, redevelopment, or infill development if at least one dwelling unit was built on it during the study period.
I identified 62,165 dwelling units that were built in the city of Portland between 2001 and 2017. About two-thirds of them (69.9%) were multifamily homes: 53.5 percent were apartments, 14.4 percent were condominiums, and 2.0 percent were low-density multifamily homes such as multiplexes and townhouses. Single-family homes accounted for only a fifth of them (20.7%). The remaining 9.5 percent were non-traditional homes such as accessory dwelling units, manufacturing homes, retirement facilities, and dormitories.
Over the period from 2001 to 2017, slightly less than a half (48.5%) of the housing units were built in residential zones. Slightly more a half of them (51.3%) were built in commercial, mixed-use, and employment zones, where high-density residential uses (e.g., apartments and condominiums) were permitted. About two-thirds of (65.8%) housing developments in Portland from 2001 to 2017 were infill developments and redevelopments, which occurred on land parcels that already had improvements siting on them. Only a half (51%) of single-family homes and 32.5 percent of multifamily homes were built on vacant land parcels.
Research Design
Zoning and upzoning do not occur randomly. When urban planners make zoning and upzoning decisions, they consider the characteristics of individual land parcels and their neighborhoods. For example, in Los Angeles, “upzoning occurs where there are development opportunities combined with limited political resistance” (Gabbe 2018).
This study applied a quasi-experimental design to evaluate the impacts of zoning and upzoning on housing development. Specifically, I tested three research hypotheses: (1) upzoning sped up housing developments and increased housing supply, (2) vacant parcels in higher density zones were more likely to be developed and thus produced more homes than similar vacant parcels in lower density zones, and (3) underutilized parcels in higher density zones were more likely to be developed and thus produced more homes than similar underutilized parcels in lower density zones. Table 2 provides an overview of the research methods that I used to test each hypothesis.
Research Hypothesis and Method.
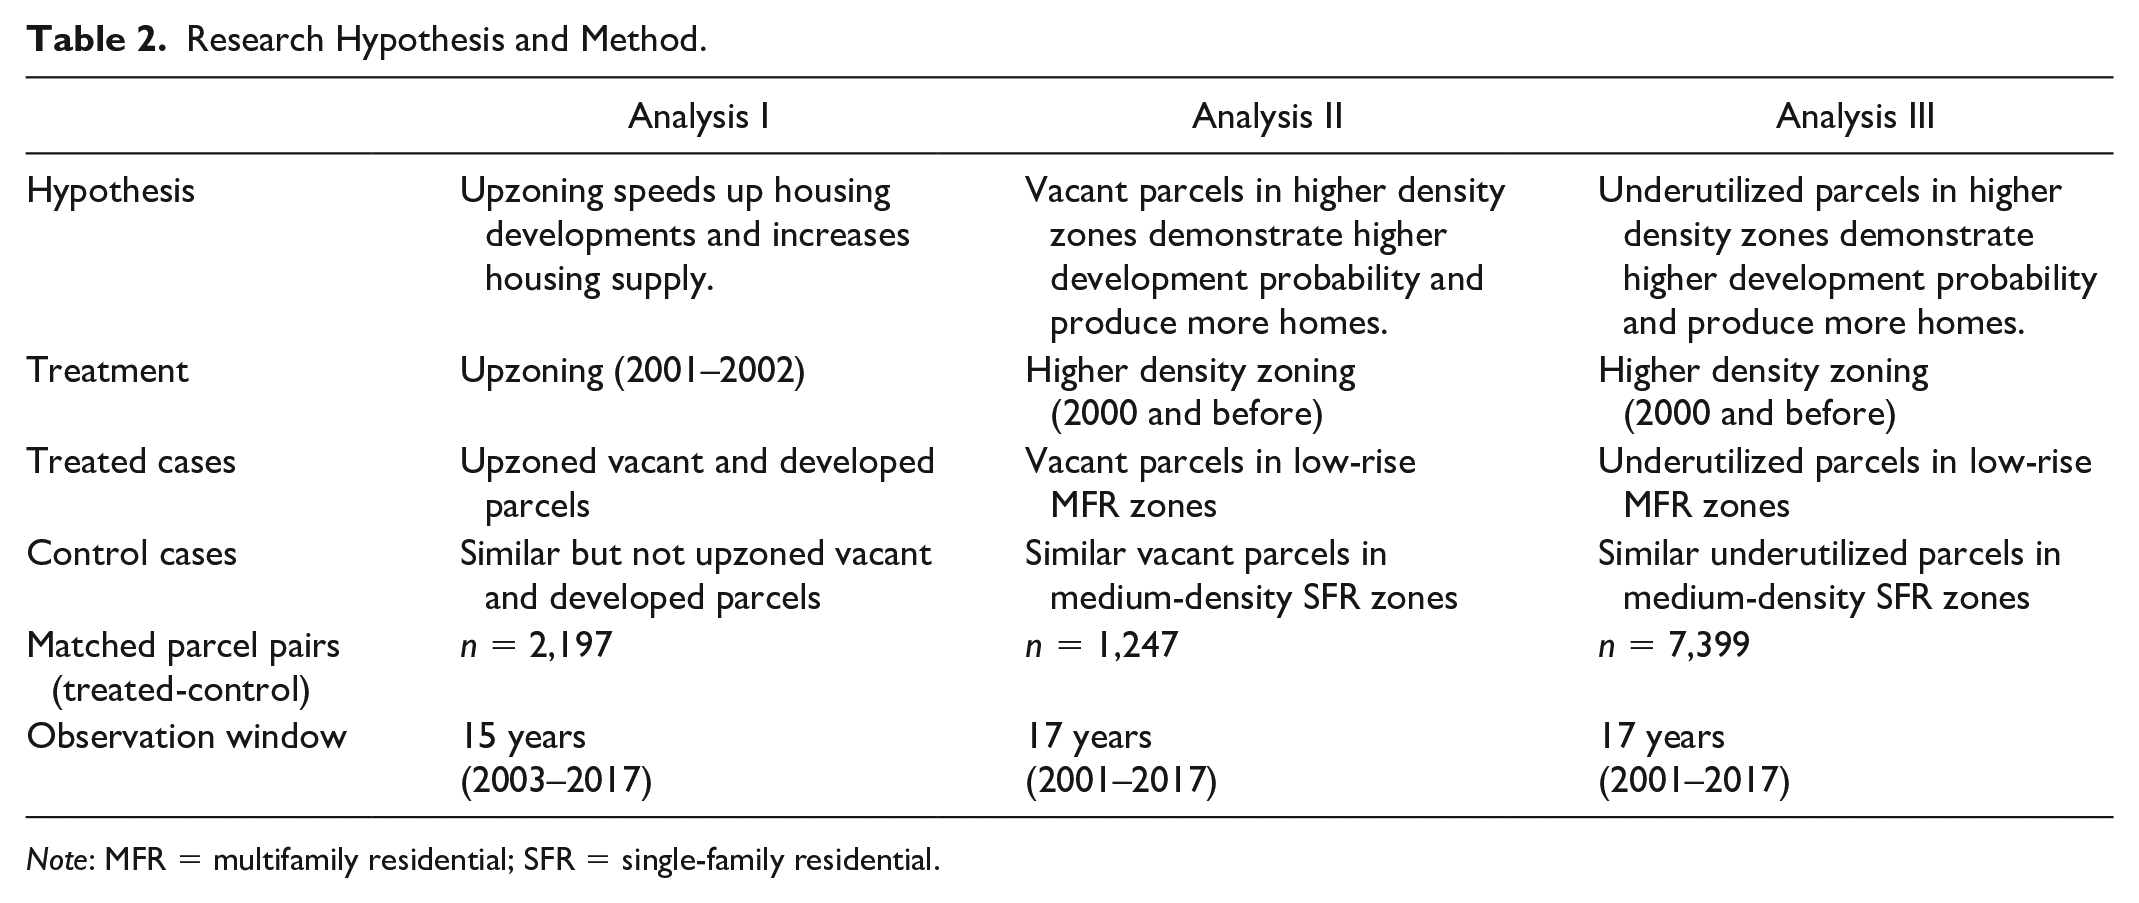
Note: MFR = multifamily residential; SFR = single-family residential.
Quasi-experimental Design: Upzoning
I considered upzoning as a treatment and upzoned parcels as treated parcels, as shown in Figure 1. Control parcels were the parcels that were very similar to upzoned parcels but did not experience upzoning in the study period. The analysis focused on land parcels that were upzoned between 2001 and 2002 rather than all the parcels that were upzoned in the study period. As mentioned earlier, almost a half of upzoning during the study period took place in Southwest Portland between 2001 and 2002. The number of upzoned parcels from 2001 to 2002 was large enough for meaningful statistical analysis. By focusing on land parcels that were upzoned at an early time in the study period, I had a wide time window (fifteen years from 2003 to 2017) to observe land developments after the treatment (upzoning). This is important because housing developments take multiple years to take place.
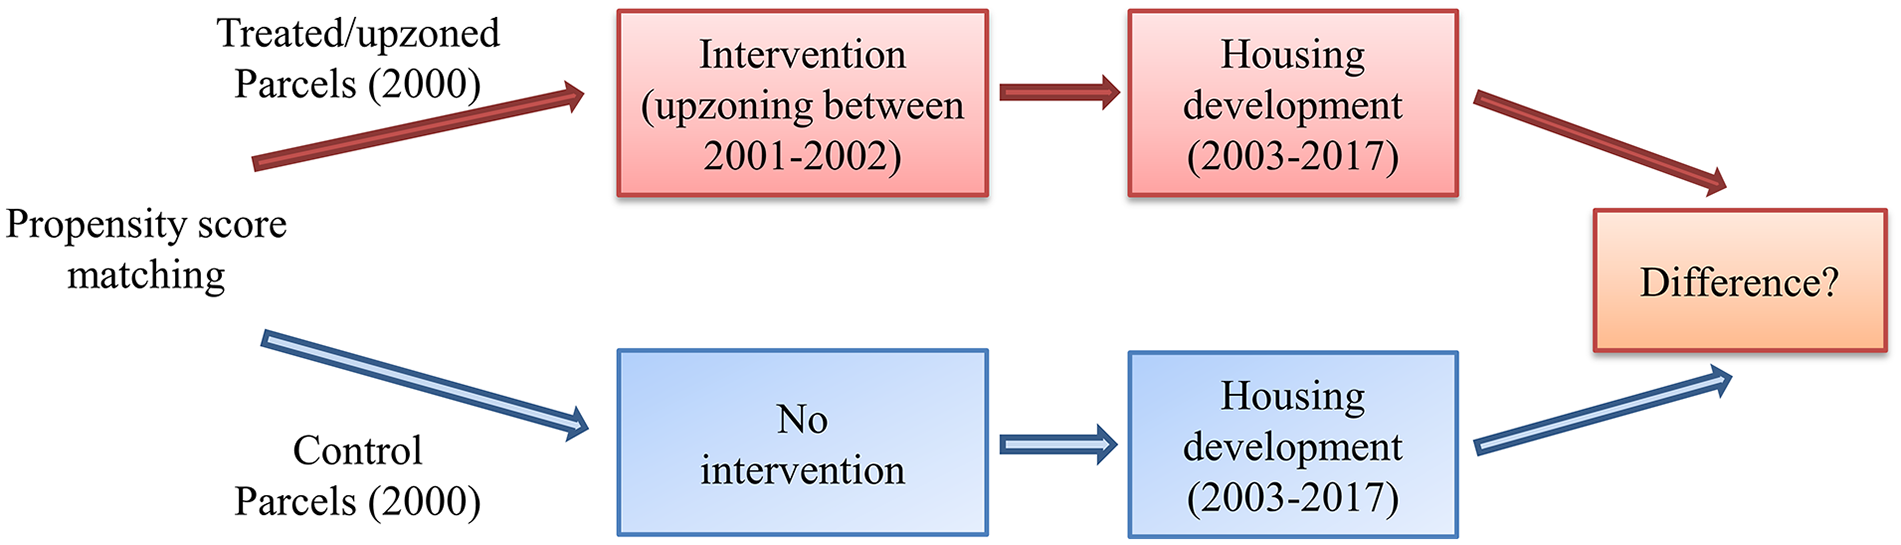
Quasi-experimental design.
I used propensity score matching to identify control parcels and matched them with upzoned parcels. The matching process took three major steps. I first estimated the propensity score through a logistic regression model in which the outcome variable (a dummy variable indicating whether a parcel was upzoned or not) was regressed on observed characteristics of individual land parcels. The propensity score represents the probability that a parcel was upzoned based on its baseline characteristics. I then matched each upzoned parcels with a land parcel that had the same or very similar propensity score. In the third step, I examined whether the matched sets of upzoned and control parcels were well balanced in terms of the baseline variables.
The specific matching method was nearest neighbor within a specified caliper distance. A parcel would not be selected if its propensity score laid outside a specified distance of that of the upzoned parcel. If no untreated parcels had propensity score that laid within the specified caliper distance, the treated parcel would not be matched with any untreated parcel. I followed Austin (2011b) to set the caliper of width equal to 20 percent of the pooled standard deviation of the logit of the propensity score. I conducted the propensity score matching through open-source software R’s “MatchIt” package (Ho et al. 2011).
Prior studies suggested that it was preferable to include variables that affected both treatment selection and the outcome when selecting variables for the estimation of propensity score (Austin 2011a). To estimate propensity score, I used three groups of baseline variables measured in 2000 and one group of variables that represented neighborhood changes during the study period (see the supplemental appendix tables in the supplemental materials for details). The objective was to identify control parcels that were similar to treated parcels in terms of these four groups of variables. The first group of variables represented the zoning code of a parcel in 2000. The second group represented the site attributes of each parcel in 2000 such as parcel size, topology, land use intensity measured as the floor area ratio (FAR), vacancy status, distance to the central business district (CBD), and accessibility to transportation infrastructures (highway, arterial road, and light rail transit). The third group measured the physical and social environments of neighborhoods in 2000, such as land use density, the level of mixed use, household income, poverty rate, racial composition, as well as the characteristics of the housing stocks in neighborhoods such as building age, vacancy rate, housing value, and tenure.
The fourth group of variables represented the changes of neighborhood characteristics between 2000 and 2017. It is worth noting that new developments that took place earlier in the study period were less subject to the influence of neighborhood changes than developments that occurred later. Another issue associated with the inclusion of the neighborhood change variables in the model was that these variables might be endogenous because new developments could lead to neighborhood changes. To understand whether the findings of this study were sensitive to the inclusion of the neighborhood change variables, I ran analyses with and without including neighborhood change variables and compared the results. The comparison suggested that the analyses with the neighborhood change variables yielded similar results as the analyses that excluded these variables. Due to space limitation, I only presented the analyses that included these neighborhood change variables in the following sections. The results of the analyses without these variables were not presented but available upon request.
To evaluate the similarity of treated and control parcels in the matched sample, I tested the statistical significance of the differences between the mean values of their baseline characteristics in 2000 as well as neighborhood changes between 2000 and 2017. Because of the lack of independence between paired treated and control parcels, I used paired t tests for continuous variables and McNemar tests for dichotomous variables. While statistical significance test was frequently used in previous research, it had an obvious caveat: statistical significance is sensitive to sample size. The differences between treated and control subjects are more likely to be statistically significant when the sample size is larger. To overcome this issue, I also calculated standardized difference, which compares the difference in means in units of the pooled standard deviation and is not influenced by sample size (see Austin 2011a for the formulas). Following Austin (2011a) and Normand et al. (2001), I considered a standardized difference (in absolute value) less than 0.1 as a negligible difference.
I compared the developments (the outcome variable) of treated and control parcels in several ways. I calculated their development probabilities. I estimated Kaplan–Meier survival curves for them to visualize the impact of upzoning on development time. I ran stratified log-rank tests to decide whether the difference between the two survival curves (representing development probability) were statistically significant. I also compared the amount of dwelling units that the treated and control parcels produced as well as their development densities.
Quasi-experimental Design: Zoning
Following a similar approach described above, I also examined whether land parcels in higher density zones were more likely to experience development than parcels in medium-density zones. The treatment group included parcels in three low-density MFR zones (R1, R2, and R3) and one high-density single-family zone (R2.5). Hereafter I refer to these four zones (R1, R2, R2.5, and R3) as the low-rise MFR zones. The control group included parcels in two medium-density SFR zones (R5 and R7). Hereafter I refer to them as the medium-density SFR zones. I matched treated parcels in the low-rise MFR zones with similar control parcels in the medium-density SFR zones and compared their development in seventeen years (2001–2017).
The comparison between parcels in the low-rise MFR zones and those in the medium-density SFR zones is complementary to my analysis of upzoning. The number of upzoned parcels between 2001 and 2002 accounted for a very small share (1.4%) of the residential parcels in Portland and they were concentrated in Southwest Portland. They may not be representative for residential parcels in the city. Most upzoning from 2001 to 2002 occurred between three low- and medium-density SFR zones (R20, R10, and R7). However, one major goal of upzoning, as stated in the Oregon House Bill 2001, is to legalize low-rise multifamily homes (multiplexes and townhouses) in single-family neighborhoods. A comparison between parcels in the low-rise MFR zones and parcels in the medium-density SFR zones could help us to understand the potential impacts of this legislation on housing developments.
Analysis I: Upzoning and Housing Developments
Match Upzoned Parcels with Untreated Parcels
Portland upzoned 2,400 land parcels from 2001 to 2002. Most of them were in Southwest Portland after the city adopted the Southwest Community Plan in 2000. Almost all of them (2,390 out of 2,400) were in five residential zones before upzoning: R20, R10, R7, R5, and R2. I dropped ten upzoned parcels (0.4%) that were not originally in these five zones. I also removed thirty-nine upzoned parcels (1.6%) that were re-zoned again, in overlay zones, or in light rail service areas because their small sample size did not allow meaningful statistical analysis. I also dropped eighty parcels (3.3%) with missing variables. The treatment group thus includes the remaining 94.6% of the upzoned parcels (2,271 out of 2,400). I applied the same data cleaning procedure to residential parcels that were not upzoned from 2001 to 2002. I identified 50,527 untreated parcels and they served as a pool from which control parcels were drawn.
Ideally, I would like to estimate two separate models for vacant and developed parcels, respectively. The sample size for vacant upzoned parcels, however, was too small for propensity score estimation. Most of the upzoned parcels in the sample (about 93%) were already developed. I thus ran a pooled model that included both vacant and non-vacant parcels. Fortunately, I had a FAR variable that controlled for the development intensity of each parcel.
I first conducted a pre-treatment comparison between 2,271 upzoned parcels and 50,527 untreated parcels. I then compared 2,197 pairs of upzoned and control parcels. Both comparisons were based on the thirty-three control variables: twenty-four of them represented parcel and neighborhood characteristics in 2000 and nine of them measured neighborhood changes between 2000 and 2017. The results were presented in Supplemental Appendix A in Supplemental Materials.
The pre-treatment comparison suggested that the mean values of twenty-eight out of thirty-three variables were statistically different between the upzoned and non-upzoned parcels. When measured by standardized differences, the two groups were different in twelve out of thirty-three variables. Upzoned parcels were concentrated in two low-density zones (R10 and R20) before upzoning. Parcels were more likely to be upzoned if they were larger, less intensely used, and proximate to the CBD. In general, upzoned parcels were more likely to be in well-off neighborhoods that had higher income, newer housing, higher homeownership, greater housing values, and lower housing vacancy rates. In terms of the built environment, neighborhoods of upzoned parcels had slightly lower density and mixed land use. Over the study period, neighborhoods of upzoned parcels maintained their well-off status. On average, they experienced faster increases of income, homeownership, and property value than neighborhoods of non-upzoned parcels.
The propensity score matching was able to match 96.7 percent (2,197 of 2,271) of upzoned parcels with similar untreated parcels. The post-treatment comparison of the 2,197 pairs of upzoned and control parcels suggested that their differences were not statistically significant in twenty-seven out of thirty-three variables. For the six variables that were significantly different between the two groups, their standardized differences (in absolute value) were all below 0.1 except for the two variables that measured the level of mixed use and its change in the study period.
Evaluate the Impact of Upzoning on Housing Developments
As shown in Table 3, I evaluated the impact of upzoning on housing development based on the matched sample that consisted of 2,197 matched pairs of upzoned and control parcels. In this matched sample, 111 out of 2,197 upzoned parcels experienced development, infill development, or redevelopment in the fifteen years from 2003 to 2017 after upzoning. Only 58 out of 2,197 control parcels experienced development, infill development, or redevelopment in the same fifteen years. The development probability of upzoned parcels in the fifteen years was 5.1 percent, almost two times greater than that of control parcels (2.6%). The McNemar test suggested that the difference of the development probabilities between upzoned and control parcels was statistically significant (p < .01). The overall fifteen-year development probabilities in both the treatment and the control groups (5.1% and 2.6%) were low because most of the parcels in the two groups (93.1% and 93.6%) were already developed before upzoning.
Analysis Results.
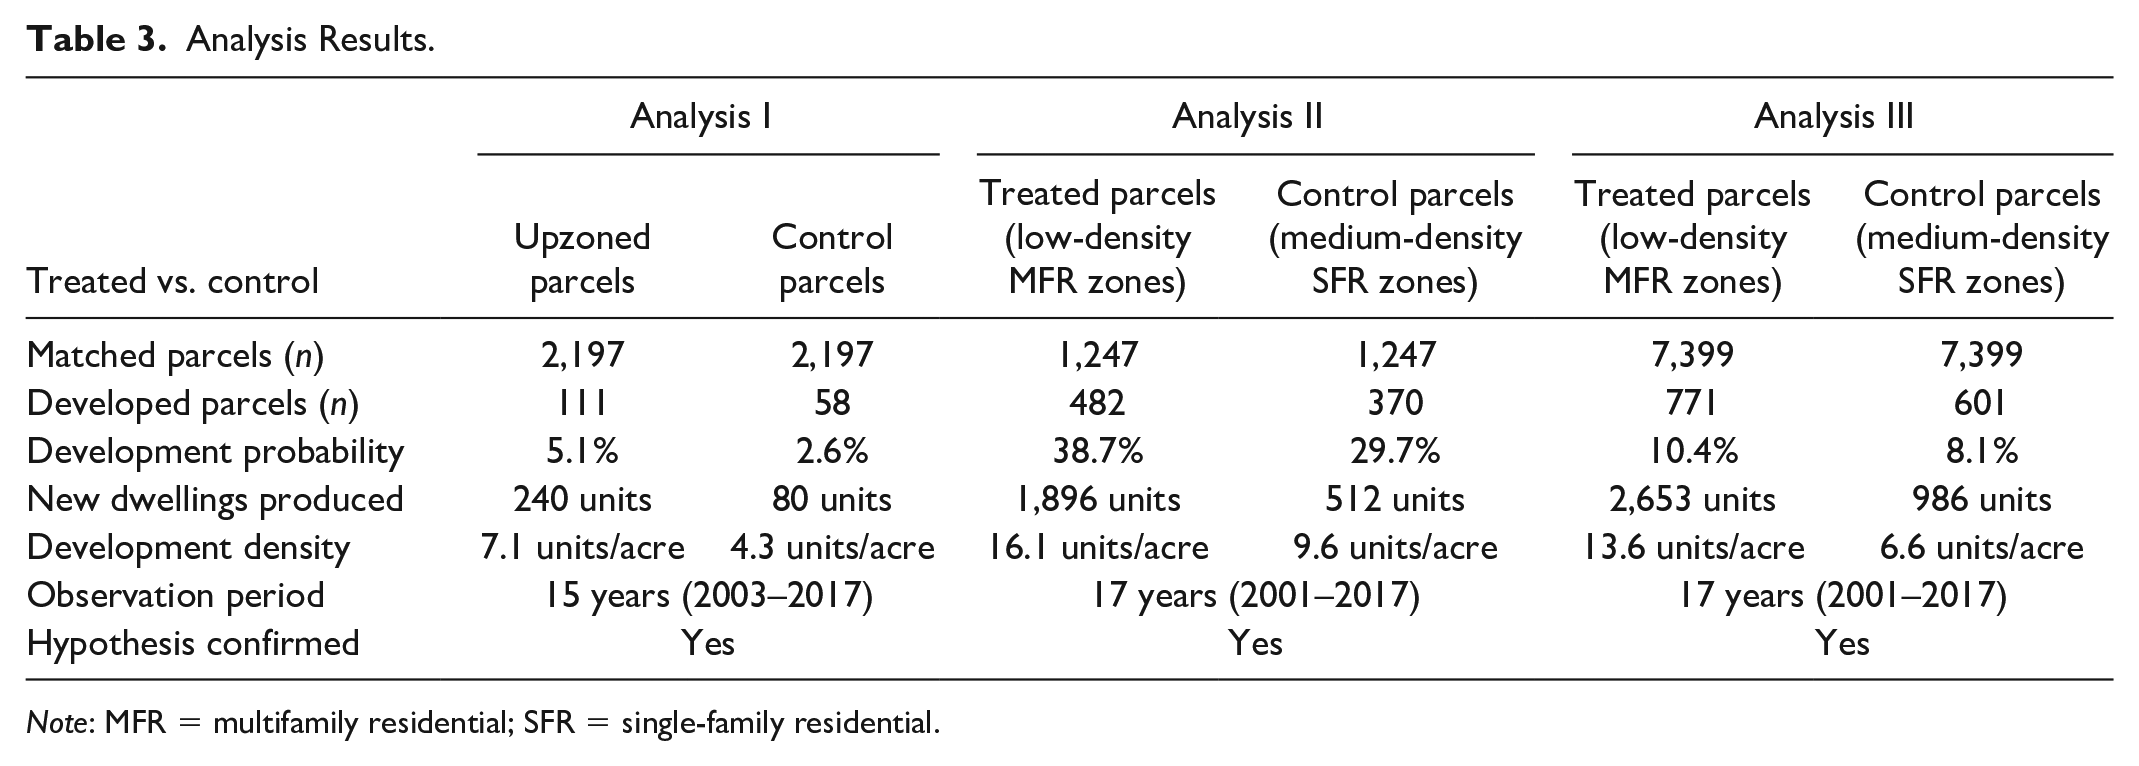
Note: MFR = multifamily residential; SFR = single-family residential.
The top pane of Figure 2 depicts the Kaplan–Meier survival curves in upzoned and control parcels in the matched sample. Note that in Figure 2, the survival probability represents the probability of no land use changes at a time point. The two curves show that upzoned parcels consistently had a greater probability of development from 2003 to 2017. The stratified log-rank test suggests that the difference between the two survival curves is statistically significant (p < .01). The average lag between upzoning and development in the treatment group (weighted by dwelling units) is 7.8 years, about 1-year shorter than the average development lag (8.8 years) in the control group.
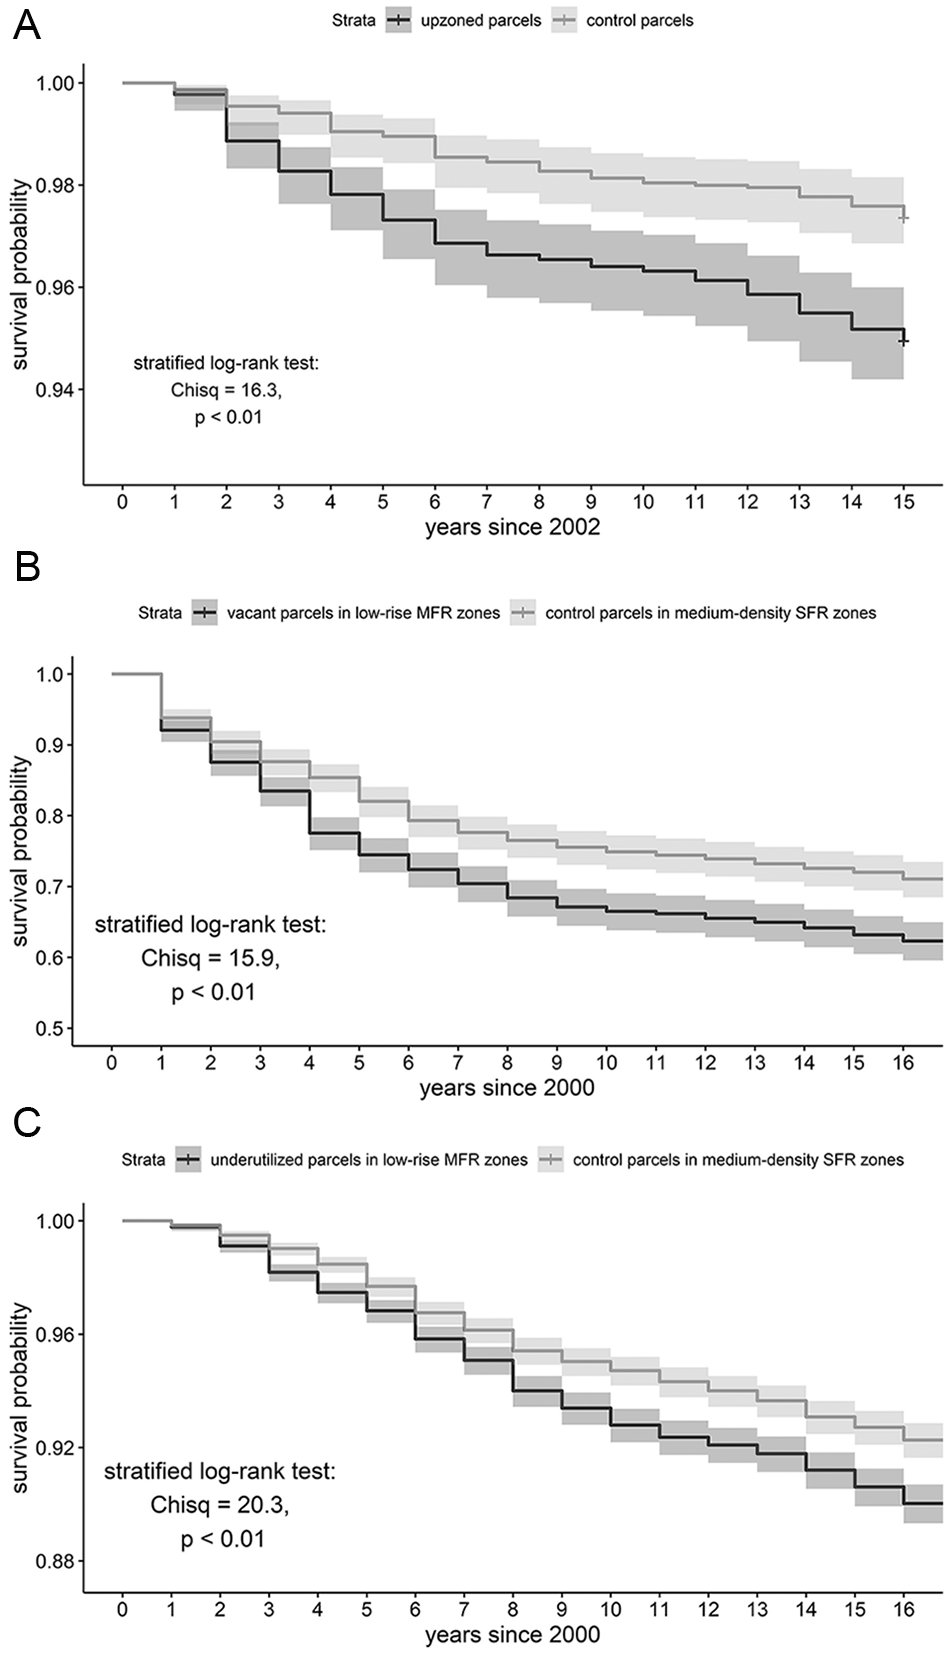
Kaplan–Meier survival curves: (A) Kaplan–Meier curves in upzoned and control parcels, (B) Kaplan–Meier curves in vacant parcels in low-rise MFR and medium-density SFR zones, and (C) Kaplan–Meier curves in underutilized parcels in low-rise MFR and medium-density SFR zones.
Further analysis suggests that the 111 upzoned parcels produced 240 dwelling units on 33.8 acres of land. The density is 7.1 units per acre. The fifty-eight control parcels produced eighty dwelling units on 18.6 acres of land. The density is 4.3 units per acre. These findings suggest that upzoning not only sped up housing developments but also increased housing production at higher densities.
Analysis II: Zoning and Vacant Land Development
I evaluated the impact of zoning on vacant land development by comparing the developments of vacant land parcels in low-rise MFR zones with those in the medium-density SFR zones. I considered vacant land parcels in low-rise MFR zones as treated subjects. I identified control parcels from vacant parcels in medium-density SFR zones via propensity score based on their baseline characteristics in 2000 and neighborhood changes between 2000 and 2017. I then compared the development of parcels in the treated and control groups in the period from 2001 to 2017.
Match Treated Vacant Parcels with Control Vacant Parcels
I identified 1,637 vacant land parcels in the low-rise MFR zones and 4,293 vacant parcels in the medium-density SFR zones in 2000. The propensity score matching was able to match 76.2 percent (1,247 out of 1,637) of vacant parcels in the low-rise MFR zones with similar vacant parcels in the medium-density SFR zones. The pre- and post-treatment comparisons were based on nineteen variables that represented their baseline characteristics in 2000 and nine variables that measured neighborhood changes between 2000 and 2017 (see Supplemental Appendix B in Supplemental Materials for details).
The pre-treatment comparison shows that vacant parcels in the low-rise MFR zones were more likely to be in the density overlay zone, in areas with steeper slopes, proximate to arterial roads, and within light rail service areas, compared with vacant parcels in the medium-density SFR zones. Their neighborhoods tended to have higher density, higher levels of mixed use, more minority population, lower income, lower homeownership, and lower housing values. The comparison of 1,247 pairs of treated and control parcels suggests that they were not significantly different except that vacant parcels in the treatment group were slightly closer to highway ramps than vacant parcels in the control group (0.96 vs. 1.03 miles).
Evaluate the Impact of Zoning on Vacant Land Development
I compared the development of the 1,247 matched pairs of vacant land parcels during the seventeen-year period from 2001 to 2017, as shown in Table 3. In this matched sample, 482 out of 1,247 vacant parcels in the low-rise MFR zones were developed and the seventeen-year development probability was 38.7 percent. The seventeen-year development probability of control vacant parcels in the medium-density SFR zones was 29.7 percent (370 out of 1,247). The McNemar test indicated that the difference of the development probabilities between the two groups was statistically significant (p < .01). The middle pane of Figure 2 depicts the Kaplan–Meier survival curves in vacant parcels in the low-rise MFR and medium-density SFR zones, respectively. The two curves show that vacant parcels in the low-rise MFR zones demonstrated higher development probabilities than control vacant parcels in the medium-density SFR zones in the entire seventeen-year period. The stratified log-rank test confirms that the difference between the two survival curves is statistically significant (p < .01).
The development of 482 vacant parcels in the low-rise MFR zones involved 117.6 acres of land and produced 1,896 dwelling units. The average density is 16.1 units per acre. The development of 370 vacant parcels in the medium-density SFR zones involved 53.6 acres of land and produced 512 dwelling units. The average density is 9.6 units per acre. These findings indicate that vacant parcels in higher density zones were more likely to be developed. They produced a lot more dwelling units than their counterparts in lower density zones because of their higher development probability and greater development density.
Analysis III: Zoning, Infill Development, and Redevelopment
In this section, I evaluated the impact of zoning on land parcels that already had improvements sitting on them at the beginning of the study period. Again, I compared land parcels in the low-rise MFR zones with parcels in the medium-density SFR zones.
All developed parcels are re-developable in the long term. However, the observation window of this study was limited, and it might not be ideal to include all the developed parcels in the analysis. The data suggested that between 2001 and 2017, 90.6 percent of infill development and redevelopment in low-rise MFR zones and medium-density SFR zones occurred on developed parcels with FAR below 0.25, and 88.2 percent of them took place on developed parcels with building ages of fifty or older. The data sample size was large enough to allow me to focus on a subset of data. I thus chose to focus my analysis on land parcels with FARs below 0.25 and building ages of fifty or older (hereafter referred to as underutilized parcels). After removing a small number of observations with missing data and land parcels that were re-zoned after 2000, I had 8,510 underutilized parcels in the low-rise MFR zones and 29,575 underutilized parcels in the medium-density SFR zones for analysis.
Match Treated Underutilized Parcels with Untreated Underutilized Parcels
I was able to use propensity score to match 86.9 percent (7,399 out of 8,510) of underutilized parcels in the low-rise MFR zones with similar underutilized parcels in the medium-density SFR zones. The pre- and post-treatment comparisons were based on twenty-one variables that represented their baseline characteristics in 2000 and nine variables that measured neighborhood changes between 2000 and 2017 (see Supplemental Appendix C in Supplemental Materials for details).
The pre-treatment comparison compared 8,510 underutilized parcels in the low-rise MFR zones with 29,575 underutilized parcels in the medium-density SFR zones. The results of the pre-treatment comparison shows that the two groups of parcels are significantly different in all the control variables except for parcel size. Compared with underutilized parcels in medium-density SFR zones, a greater proportion of underutilized parcels in low-rise MFR zones were in the density overlay zone, proximate to transportation infrastructure (highway, arterial roads, and light rail), and in areas with less steep slopes. The buildings sitting on them were older. Their neighborhoods had higher density, lower income, more minority population, lower housing values, and lower home ownership.
The post-treatment comparison shows that the treatment and control groups were similar except for two site attributes (proximity to arterial roads and highways) and a few neighborhood characteristics. The standardized differences of these variables (in absolute values), however, were all below 0.1 except that treated parcels were slightly closer to highway ramps than control parcels (0.89 vs. 0.93 miles).
Estimate the Impact of Zoning on Infill Development and Redevelopment
I compared the development of 7,399 matched pairs of underutilized parcels in the low-rise MFR and medium-density SFR zones, as shown in Table 3. About 10.4 percent (771 out of 7,399) of underutilized parcels in the low-rise MFR zones and 8.1 percent (601 out of 7,399) of underutilized parcels in the medium-density SFR zones experienced infill development or redevelopment between 2001 and 2017. The difference of the development probabilities was statistical significant (p < .01). The bottom pane of Figure 2 depicts the Kaplan–Meier survival curves in underutilized parcels in the low-rise MFR and medium-density SFR zones, respectively. The two curves show that underutilized parcels in the low-rise MFR zones consistently had slightly greater development probabilities during the study period. The stratified log-rank test confirms that the difference between the two curves is statistically significant (p < .01).
In the matched sample, underutilized parcels in the low-rise MFR zones produced more than two times more dwelling units than those in the medium-density SFR zones (2,653 vs. 986 units) mainly because of their higher development density (13.6 vs. 6.6 units/acre). In summary, compared with their counterparts in lower density zones, underutilized parcels in higher density zones were more likely to experience infill development and redevelopment and the development densities were much higher.
Discussion and Conclusion
This study is one of the few studies that directly evaluated the impacts of upzoning and higher density zoning on housing development in a relatively long time period. The findings of this study shed light on whether and how relaxing restrictive zoning regulations influences housing developments.
Major Findings and Discussions
This study shows that everything else being equal, upzoned parcels were about two times more likely to experience development or redevelopment in the fifteen years after upzoning. Upzoned parcels produced about three times more dwelling units in fifteen years because of their greater development probability and higher development density. The overall development probability of upzoned parcel (5.1%), however, was relatively low in the fifteen-year observation period because the majority of the upzoned parcels were already developed before upzoning.
The analysis also shows that vacant and underutilized parcels in the low-rise MFR zones were associated with significantly greater development probabilities and higher development densities than their counterparts in the medium-density single-family zones. Vacant and underutilized parcels in the low-rise multifamily zones produced about three times more housing than their counterparts in the medium-density single-family zones. In general, this study confirms that upzoning and higher density zoning have the effects of speeding up housing developments and increasing housing supply.
It is important to note some limitations of this study. First, the data of upzoned parcels in this analysis had a relatively small sample size and a limited geographic scope. The analysis involved slightly more than 2,000 upzoned parcels that accounted for only 1.4 percent of residential parcels in the city of Portland. Most of the studied upzoned parcels were in Southwest Portland while the control parcels were drawn from the entire city. Second, most upzoning involved in the analysis occurred between low- and medium-density SFR zones. The findings may not be generalized for upzoning from SFR zones to MFR zones or zoning changes between residential and non-residential zones.
To mitigate these two problems, I adopted a quasi-experimental design to identify control parcels that were very similar to upzoned parcels via propensity score matching. The propensity score matching included more than thirty control variables that measured the baseline characteristics of the studied parcels at the beginning of the study period as well as the changes of their neighborhoods in the study period. The analysis, however, was not able to exhaust all the potential factors that could influence housing development during study period. As a complement to my analysis of upzoning, I compared the developments of vacant and underutilized parcels in the low-rise MFR zones with the developments of similar parcels in the medium-density SFR zones. I chose these two categories of residential zones because a major goal of upzoning in Portland, as stated in the Oregon House Bill 2001, was to legalize low-rise multifamily homes in single-family neighborhoods.
Policy Implications and Future Research
One major policy implication of this study is that upzoning could be an effective policy tool if the goal is to encourage housing construction and to increase housing supply. Because redevelopments tend to be costlier, the effect of upzoning would be much stronger when it is applied to vacant parcels or underutilized parcels. When citywide blanket upzoning is politically difficult, localized upzoning should target vacant and underutilized parcels. The effect of upzoning in built-up areas tends to be weak. I anticipate a moderate impact of upzoning on housing developments in a built-up city such as Portland where less than 10 percent of land is vacant. Geographically, I expect to see a more prominent effect of citywide upzoning in suburban and fringe areas where developers can find more vacant and underutilized land.
This study suggests at least two future research avenues. First, future research needs to evaluate the types of homes that have been built on upzoned parcels. Higher density developments are not necessarily more affordable, depending on the specific types of homes that they offer (Dong 2020). We will gain a better understanding of the impact of upzoning on home affordability with future studies that measure the affordability of homes built on upzoned parcels. Second, future studies should explore the impacts of rezoning between residential to non-residential purposes. In the past two decades, slightly more than a half of Portland’s new housing developments took place in commercial and mixed-use zones where high-density apartments and condominiums were permitted. Simply permitting residential buildings in commercial zones or rezoning commercial zones into mixed-use zones can create a huge potential for multifamily housing development. Another advantage of rezoning commercial zones into mixed-use zones is that rezoning in commercial districts usually faces a lot less neighborhood resistance compared with upzoning in single-family neighborhoods. Therefore, modifying commercial zones to allow mixed-use developments could be another policy option to increase housing supply when large-scale upzoning in single-family neighborhoods is politically difficult.
Supplemental Material
sj-docx-1-jpe-10.1177_0739456X21990728 – Supplemental material for Exploring the Impacts of Zoning and Upzoning on Housing Development: A Quasi-experimental Analysis at the Parcel Level
Supplemental material, sj-docx-1-jpe-10.1177_0739456X21990728 for Exploring the Impacts of Zoning and Upzoning on Housing Development: A Quasi-experimental Analysis at the Parcel Level by Hongwei Dong in Journal of Planning Education and Research
Footnotes
Acknowledgements
The author would like to thank the Gazarian Real Estate Center at the California State University, Fresno, for their research grant. The author is also grateful to the anonymous reviewers for their comments.
Declaration of Conflicting Interests
The author(s) declared no potential conflicts of interest with respect to the research, authorship, and/or publication of this article.
Funding
The author(s) received no financial support for the research, authorship, and/or publication of this article.
Supplemental Material
Supplemental material for this article is available online.
Author Biography
References
Supplementary Material
Please find the following supplemental material available below.
For Open Access articles published under a Creative Commons License, all supplemental material carries the same license as the article it is associated with.
For non-Open Access articles published, all supplemental material carries a non-exclusive license, and permission requests for re-use of supplemental material or any part of supplemental material shall be sent directly to the copyright owner as specified in the copyright notice associated with the article.