
Abstract
This article is concerned with two aspects of how planning practitioners use survey-derived data; how planners integrate the limitations of survey questionnaires into practice, and the prevalence of such data within planning. Using a web survey (n = 201) and interviews (n = 18) of Canadian municipal planners, I find that survey data are heavily relied on, but many planners do not seem to be aware of cognitive biases when designing surveys, and those that are, have little knowledge of how they ought to mitigate them. To develop planners’ understanding of these biases and improve the survey data they collect, quantitative methods courses within planning curricula could respond by expanding beyond statistical analysis to incorporate survey design and “the total survey error approach” of survey methodology.
Introduction
The balance between the skills planners need and those provided within planning curricula has long been discussed within planning literature (Friedmann 1996; Greenlee, Edwards, and Anthony 2015 99). These previous “demand and supply” studies have identified that data collection methods are highly sought skills for planners (Contant and Forkenbrock 1986), and that quantitative methods are widely covered within planning education (Kaufman and Simons 1995). The absorption of survey methods into the broader categories of data collection and quantitative methods has resulted in few studies that examine how planners use this skill specifically. As a result, we know little about the situations in which planners choose or are required to administer survey questionnaires, how often they do so, the survey instruments they adopt, and the degree to which they acknowledge and mitigate biases when using the method. This is important because these unknowns all relate to an established form of “small data” analysis, yet the emergence of new data analytic approaches within urban governance, and particularly Big Data, raises questions about how equipped planners are to use such methods. Without first understanding how planners use small data, it is difficult to evaluate how useful and how well-implemented such new approaches may become.
Within this article, I examine how and how often planning practitioners use survey data, and then evaluate how they integrate some limitations of surveys into practice. This article firstly reviews literature on planning skills, identifying what we know about planners’ usage of survey methods from studies that specifically examine this, and what we can infer from those that have not. I incorporate literature regarding planners’ usage of secondary data sources to highlight how little we know of planners’ usage of self-collected survey data. I then outline the methods followed, and the analysis of planners’ survey data methodological practices. This analysis is based on results from interviews and a survey of Canadian municipal planners. I find that surveys are the dominant data collection tool for Canadian municipal planners, and that web surveys are dominant over other survey instruments. I also find that planners appear to have patchy knowledge of survey limitations, with some such as sampling error being relatively well understood—while cognitive biases, that have been the recent focus of survey methodologists, are poorly understood. Finally, I conclude with a discussion, offering some potential explanations for these findings, and the implications for the planning curriculum.
The Importance of Survey Data Collection in Planning
Planning education has an important role in equipping planning students with the skills required within planning practice. As the contexts and problems faced by planners have evolved over time, there have been concerted efforts to evaluate whether the skills that graduate planners need are also evolving. There now exists a range of supply and demand style studies examining the skills that employers consider most valuable when hiring graduate planners, or those reportedly used most frequently by planners, in contrast with those taught within planning schools. These studies can be dated as far back as the 1970s. Greenlee, Edwards, and Anthony (2015) narrate their development, contending that two branches of these studies are evident: the first being concerned with specific skills and analytical methods; the second expanding this to encompass wider interpersonal skills. Key studies within the former category include Krueckeberg’s (1978) supply and demand study of statistical analysis skills, with expanded follow-ups from Contant and Forkenbrock (1986) and Kaufman and Simons (1995). These studies reveal instances where planning schools have overemphasized skills such as multivariate statistics and advanced analytical methods, while underpreparing students for tasks such as budgeting. Within the second category, Ozawa and Seltzer (1999; Seltzer and Ozawa 2002) examine a wider range of interpersonal skills and find that the highest valued are working well with the general public, working well with colleagues, and being a self-starter, while Guzzetta and Bollens (2003) find written communication and public presentation skills highly valued.
There are a few limitations to these studies. The first is concerned with the analytical methods branch, drawing attention solely to how data are analyzed; it therefore only partially examines planners’ data competencies if how data are collected is not also assessed. The second applies to both branches: such rankings draw attention to a small number of skills at the very top and the very bottom of rankings tables, which leads to these being more closely evaluated over time than those located between these extremes. As a result, relatively highly valued and/or used skills have been overlooked simply because they did not occupy the top three or five spots. The third limitation of these studies is the agglomeration of distinctive skills into aggregate categories, such as “data collection” and “quantitative methods.” These limitations—but particularly the third—have resulted in survey data collection as a distinct and separate skill being overlooked.
The demand for survey methods skills is solid and consistent, at least according to previous literature on planners’ most valued/used skills. Contant and Forkenbrock (1986) found that conducting surveys was undertaken “routinely” or “occasionally” by 72 percent of planning agencies. Kaufman and Simons (1995, 23) found that survey research design was used by over 83 percent of planning practitioners, with survey implementation undertaken by over 53 percent. This resulted in survey research design being one of the most demanded skills of planning practitioners in both 1986 and 1992. In some studies, demand for or usage of survey methods specifically is obscured due to its incorporation within a broader category of original data collection. Schon et al. (1976) ranked planning skills by the percentage of respondents (MIT Urban Studies alumni) who rated them “highly important,” finding that original information gathering through surveys and interviews and so on was selected by 29 percent—almost on par with data analysis at 33 percent. Ability to conduct primary data collection averaged an importance of 3.26 out of 5 (Seltzer and Ozawa 2002, 85), and an examination of the most important skills for planners within a developing country (Iran) by Bahrainy and Manshadi (2017) also found that data collection was one of the most important. Greenlee, Edwards, and Anthony (2015) found that original information gathering was an important skill for entry-level planners, but found that its importance was declining.
Turning to the supply side, our knowledge of the extent to which survey methods specifically are taught is obscured due to its frequent incorporation within quantitative methods—which have been central within planning curricula for a considerable time (Anthony and Forkenbrock 2006; Edwards and Bates 2011). Friedmann (1996, 99) reported that planning programs in the United States considered quantitative methods to be the most important skill for professional planners, contending that survey methods, along with other quantitative methods, “belong in the toolbox of every planner.” In reviewing primarily Canadian planning schools, McIntyre et al. (1997) find that quantitative methods were one of the most frequently covered courses within program core requirements.
In summary, planners have been collecting survey data for a considerable time, with accounts of this within academic studies dating from at least the 1970s, and in the instances where studies have been specific regarding survey methods, it is evident that these skills are highly used and practiced. However, these studies are several decades old and we can therefore only assume that the method remains a practical and valued skill for planners, yet it is wholly unclear what share of contemporary planners’ data collection tasks are facilitated through survey methods. Having identified uncertainties regarding survey methods in both the demand and supply side of planning skills, this article is principally concerned with the former. In this context, the remainder of this article explores how planning practitioners collect survey data, the situations in which they chose or are required to do so, the instruments they use, the biases that they are most aware of when administering surveys, and how they mitigate these.
What We Know of Survey Data Usage in Planning
Planners use survey data in the form of primary or self-collected datasets, and survey datasets from secondary sources—often authoritative demographic datasets in the form of official statistics. The most important of the latter type is the census (Wang and Vom Hofe 2007). MacDonald (2006, 491) contends that using the U.S. Census of Population and Housing is “almost unavoidable for local planners [given that] the decennial census offers the only social and economic information that is spatially detailed and consistent across time and space, and available at minimal cost”. While information within census datasets can often be interpreted as authoritative, statistical, and even “factual” information, it is important to note that this information comes about through the practice of asking human subjects to answer questions within a survey format. MacDonald (2008) narrates the origin and development of the relationship between planning and the census, arguing that census data were originally viewed as an engine of social reform, then as the foundation for science of planning, next as a way to manage social and economic crisis, and finally as a way to justify government decisions. Because census data provide quantified, apparently neutral, evidence, it is difficult to overstate the legitimacy that census data have acquired in contrast to data from other local surveys, which rarely obtain comparable response rates or hold the same level of gravitas (Starr 1987). The authority affixed to census data in fact often results in them being used as a benchmark by which the representativeness of other survey samples is gauged (Lavin 1996).
Aside from census datasets, a range of other secondary survey datasets is used within planning literature. Recent attention given to the links between planning and health has led to the emergence of surveys such as the National Health Interview Survey (NHIS) and the Behavioral Risk Factor Surveillance System (BRFSS) within planning research (Ewing et al. 2003; Fahimi et al. 2008; Li et al. 2012). For planners concerned with transportation issues, surveys such as the National Household Travel Survey (NHTS) or National Travel Survey (NTS) in Canada provide valuable nationwide data on travel behavior at individual and household levels. Equivalent datasets are also available at the subnational level, for states (such as the California Household Travel Survey) or for large cities (such as the Greater Montreal Area Travel Survey). These surveys provide detailed travel data—particularly origin-destination (OD) data—tailored to the geographic area of interest so that trends and challenges within those states and cities can be identified and monitored.
Self-collected survey data are those that have been collected by planners for their own use, and there are few examinations of the extent of such data within planning. One can hypothesize that planners opt to collect their own survey data in instances where their research questions cannot be answered using secondary survey datasets. This could be due to secondary survey datasets simply not asking the right questions, using variables whose definitions do not align with those required, or using research subjects other than those the planner is interested in. Alternatively, there may be instances where secondary survey datasets align with the needs of the project, but these are simply unavailable or too expensive to access at the times they are needed.
Planners’ Data Competencies Under Scrutiny
It is also important to examine studies that have focused on planners’ data competencies. Using a sample of U.S. planners, Jurjevich et al. (2018, 119) quantifies planners’ reliance on secondary survey datasets, in that seven out of ten planners use some form of demographic data once a week, with six out of ten using U.S. Census Bureau demographic data specifically, at least once a week. The most common reasons for using such data are to compare trends over time, compare communities with one another, and to create a community profile (Jurjevich et al. 2018, 121). Reflecting on planners’ understanding and acknowledgment of survey data limitations, Jurjevich et al. (2018, 112) examine planners’ understanding of margin of error (MOE) when working with American Community Survey (ACS) data, finding that “many do not understand statistical uncertainty within ACS data, find it difficult to communicate statistical uncertainty to stakeholders and often avoid reporting MOE values altogether.” This paper examines only one limitation with one secondary dataset, but the findings are nonetheless revealing and lead one to question how widespread such gaps in knowledge or understanding are, whether they extend to further limitations than MOE and whether they extend to applications of other datasets than just the ACS. This article therefore aims to evaluate how and how often planners collect survey data and how they integrate survey limitations into practice.
Survey Methodology and the Total Survey Error Approach
The survey limitations examined in this article corresponded to those discussed in previously reviewed literature on survey methodology, which has recently emerged as an interdisciplinary academic discipline in its own right (Brenner 2017). Social psychology has contributed a great deal to survey methodology studies since the late 1970s in advocating the “total survey error approach” (Weisberg 2005), which shifts the field’s focus from principally mitigating sampling errors to incorporating measurement errors. These include cognitive or response biases such as social desirability—a tendency to overreport socially desirable characteristics and underreport socially undesirable ones (Pedregon et al. 2012); acquiescence—a tendency to agree with statements (Meisenberg and Williams 2008); question order effects—where responses to former questions influence those to subsequent ones (Willits and Saltiel 1995); and response order effects—where the order of standardized, selectable options influences which ones are likely chosen (Krosnick and Alwin 1987), among others. All these cognitive biases are nonrandom, or, in other words, systemic biases, with the potential to introduce measurement error. The degree to which these survey method limitations are acknowledged and mitigated by practicing planners when collecting their own data is unknown. Exploring this is valuable not just because it provides new information on whether or not planners recognize these biases, but more interestingly, it enables us to examine whether there are certain cognitive biases that planners’ survey data are more vulnerable to. Specific vulnerabilities could be due to the nature of topics that planners typically have to survey about, the typical target populations they wish to survey, or the survey instruments they use. We currently know little about any of these, and this study seeks to reduce the unknowns so that a greater understanding of planners’ usage of survey data can emerge. By building on the work of Krueckeberg (1978) and Kaufman and Simons (1995) in their analyses of planning skills demanded, and also the work of Jurjevich et al. (2018) in their analysis of planners’ data competencies, this article examines planners’ knowledge of four cognitive biases specifically: social desirability, acquiescence, question order effects and response order effects.
Methods
I first undertook a survey, and then semi-structured interviews as part of a larger study into the practices of Canadian municipal planners. The data used in this article evaluate how planners use survey data, and how they address methodological limitations and challenges when using survey data for planning and policy purposes.
Survey Instrument
The survey was web-administered, and the sampling strategy sought to recruit a generalizable sample of planners that was not confined to Canadian Institute of Planners (CIP) certification. As such, I gathered publicly available email addresses of municipal planners and transportation planners at major and mid-sized Canadian municipalities with populations of at least one hundred thousand people, which resulted in 1,104 email addresses. The list of these municipalities was derived from Statistics Canada (2016) data, in that Census Metropolitan Areas (CMA) in general have over one hundred thousand people, albeit more than one municipality may be present within a CMA. In total, there were twenty-seven CMAs in Canada in 2016, so the municipalities corresponding to these were searched online to compile publicly available staff directory data, where this was available. Email invitations to all 1,104 identified Canadian municipal planners to participate in the survey were sent out on January 7, 2019, with follow-up reminders sent on January 24 and January 31, 2019, before the survey closed at midnight on February 10, 2019.
The survey took respondents approximately twenty-five minutes to complete and comprised a range of multiple-choice and open-ended questions. Of the three sections within the survey, the first compiled information about respondents’ educational background and planning-related employment and experience, while the second gathered responses about the secondary survey datasets and official statistical datasets that respondents were aware of, used, and trusted and the situations that they are used in. The third section asked respondents about their usage of self-collected survey data, and gathered information regarding survey data collection tasks that respondents undertake, as well as how frequently they do so. Respondents were differentiated within the survey instrument based on their indicated usage of survey data (both secondary and self-collected) using multiple criteria and received different questions accordingly. This was done to prevent longer sections of the survey concerned within survey data collection appearing to planners who had indicated early on that this was irrelevant to them, in an attempt to reduce the risk that they would drop out before completion of the survey.
The survey was tested in a pilot during November 2018, which used a snowball sample of eight planners, to ensure that the many conditions distinguishing different planners within the instrument were working correctly and that respondents were seeing relevant, appropriate questions accordingly. Some questions were changed slightly, added, or removed following the pilot and input from other faculty, and the pilot data are not included in the final survey dataset. The survey resulted in 201 valid responses equaling a response rate of 18 percent. Of these, 67 percent had an accredited planning degree, and 91 percent of these obtained their accredited planning degree at a Canadian university. The average number of years of planning experience was 13.9, and 41 percent of the sample were female, with 59 percent being male. As these were municipal planners recruited through their workplace affiliation, 100 percent of the sample unsurprisingly had public sector experience, but 40 percent also had experience working as planners within the private sector.
Interviews
The interviews were undertaken to explore planners’ knowledge of cognitive biases, as it was not considered that this could be adequately investigated through a survey. The majority of municipal planners who participated in the semi-structured interviews were recruited through the survey instrument, which invited respondents to provide their contact details if they were interested in participating in follow-up interviews. Respondents were only shown the invitation to interview question if they indicated within the survey that they had fifteen or more years of planning-related experience, and that they had experience collecting survey data within a planning context. A total of seventeen planners volunteered their details, and sixteen of these resulted in successful interviews. Two additional planners were recruited by personal referral separately, bringing the total number of interviewees to eighteen. Five interviewees were interviewed twice, bringing the total number of interviews to twenty-three. Around half (eleven) of the interviews were conducted in person, with the remaining twelve conducted over the phone 1 , given the geographic spread of the subjects’ locations across Canada, including Ontario (n = 11), Western Canada (n = 5), and Quebec (n = 2). The interviewees were primarily concentrated in larger metropolitan centers. Three of the interviewees worked within a transport planning specialism within the municipal planning departments, while the remaining fifteen were general urban planners. When asked to select one area that represents the majority of their workload throughout their planning career, the breakdown of interviewees by area of specialism is therefore development review (n = 6), strategic/policy planning (n = 4), transportation (n = 3), heritage and architectural conservation (n = 2), urban design (n = 1), environmental protection (n = 1), and economic appraisal (n = 1).
Interviews lasted between forty and ninety-five minutes. The interview questions were tested in a pilot which ran during July 2018 with three planners. As with the survey, data from the pilot are excluded from the final data. Interviews were semi-structured and consisted of a set of core questions, from which more flexible follow-up questions were asked, to explore specific statements further, while adapting to the varied experiences discussed. I asked planners about (1) experience with secondary survey data, (2) experience with self-collected data, (3) specific projects involving survey data, (4) familiarity with survey limitations (sampling and cognitive biases), and (5) documents and materials that some interviewees wished to share such as surveys, reports summarizing survey analysis. I transcribed, coded, and analyzed the interview data using a two-cycle coding process, which involved a first stage of process coding, using verbs and gerunds to identify procedures, actions, and practices in survey data usage which were repetitive or demonstrated predictable differences. This process was iterative, and benefited from a second cycle of coding using an in vivo approach, which allowed me to maintain terminology and expressions used by the respondents within the process (Srivastava and Hopwood 2009). I also conducted an analysis of written materials that some participants shared (e.g., survey drafts, reports, and meeting minutes) to evaluate how data were used within reports and how drafts of self-collected surveys evolved from the initial to final stages.
Results
Usage of Secondary Survey Data
By first examining the findings of the survey responses, it is evident that Canadian planners are highly reliant on survey data, from both primary and secondary sources. Commencing first with secondary sources, only 5 percent of survey respondents reported that they had never used any of the secondary survey datasets listed. The Canadian decennial census is used by over 90 percent of survey respondents, with 28 percent of respondents using it at least monthly 2 . In all, 70 percent of survey respondents use at least one secondary survey dataset monthly or more often. The top five datasets used are shown below in Figure 1.
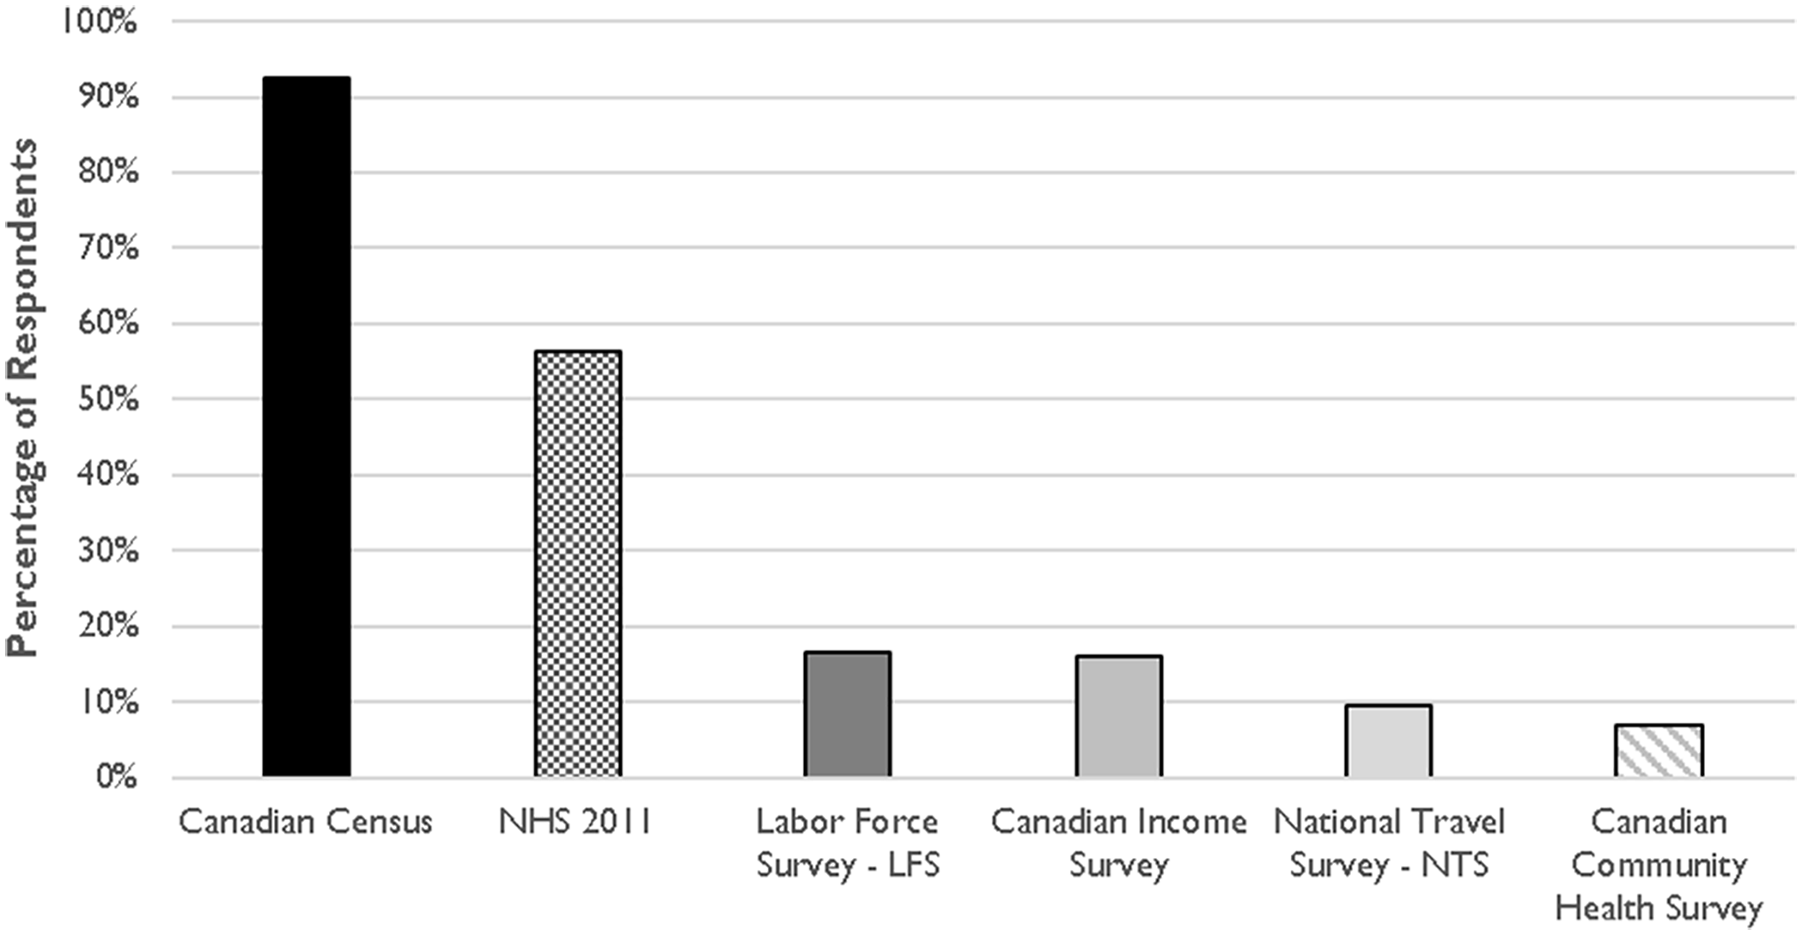
Most commonly used secondary survey datasets.
Frequency of use was determined by direct follow-up questions relating to the datasets that planners had indicated ever using. The options available were that they used this dataset (1) at least daily, (2) at least weekly, (3) at least monthly, (4) at least annually, (5) less often than annually, and (6) not within the last 3 years—which was termed “Used to” within the analysis. There was also an option to indicate that they had previously answered mistakenly and had not in fact used this dataset, which allowed for erroneous responses to be corrected. It is evident that frequency of use is different for various planners and their datasets. While only 1 percent of Canadian Census users use this dataset on a daily basis, 16 percent of NTS users do so.
Given the wider literature narrating planners’ reliance on decennial census data, with little attention directed toward planners’ primary data collection, it could have previously been assumed that planners rely on secondary survey datasets more than their own survey datasets. However, this is not found to be the case. Data from the survey and interviews indicate that while basic demographic information from secondary survey datasets is often helpful, Canadian Municipal planners routinely conduct their own surveys, often needing data that are specific to a project at hand, particularly with respect to the attitudes and beliefs of municipal residents or business owners. The separate distinction this study draws between primary and secondary survey data was paradoxical, in that planners highlighted a relationship between their primary and secondary datasets. The most common example given for using secondary survey data by planners interviewed within this study was using Canadian Census data to attest the representativeness of their self-collected survey data, rather than for citing any statistics from it directly. The usage of these two distinct forms of survey data are linked in this regard, as secondary survey datasets assist the quality checking and scrutiny of self-collected survey data.
Approach to Survey Data Collection
Only 16 percent of planners were found to have never collected any form of survey data. Of the majority that have, Canadian municipal planners collect their own survey data predominantly through web surveys, and over 56 percent of planners had designed a web survey themselves—a far higher proportion than had designed a paper and pencil interview—or PAPI (27%), mail-return survey (28%), or a telephone survey (16%). PAPI is a common survey format where an interviewer administers the survey in person by reading the questions aloud and recording them on paper, rather than a self-administered format, where the respondent fills out the survey themselves. Data collection can often be a resource-intensive process where planners may work with other colleagues and therefore may not have administered all aspects of a survey (from design, to data cleaning to analysis and so on), in its entirety. To identify planners’ specific involvement within surveys, planners within this study were therefore asked if they had ever undertaken a range of survey “tasks” ranging from designing the survey questions/instrument, analyzing the survey data, using the survey data within a report, using the survey data within a model, managing a survey project, assigning a survey data collection task to other colleagues, and hiring an external consultancy to undertake a survey. Those that indicated that they had performed any of the tasks were asked how often they undertook these tasks, with options ranging from (1) at least monthly, (2) at least annually, (3) less often than annually, and (4) not within the last 3 years—which was termed “Used to” within the analysis.
Over 80 percent of planners indicated that they undertook at least one of these tasks at least annually. It is evident from Figure 2 that the top three survey tasks performed by planners undertaking web surveys are designing the survey (55%), managing the survey (44%), and analyzing the survey data (41%). Finding that designing surveys is the most frequently performed task is pertinent to this study because it implies that planners are very much in the driving seat when designing survey questions and therefore makes an exploration of planners’ recognition of cognitive bias all the more relevant. Experience of performing these tasks with web surveys is higher than the other survey instruments. Web survey tasks were not only more likely to have been undertaken, they were also more frequently undertaken than those for other survey instruments, with the majority of planners undertaking web survey tasks at least annually, with a small minority doing so on a monthly basis.
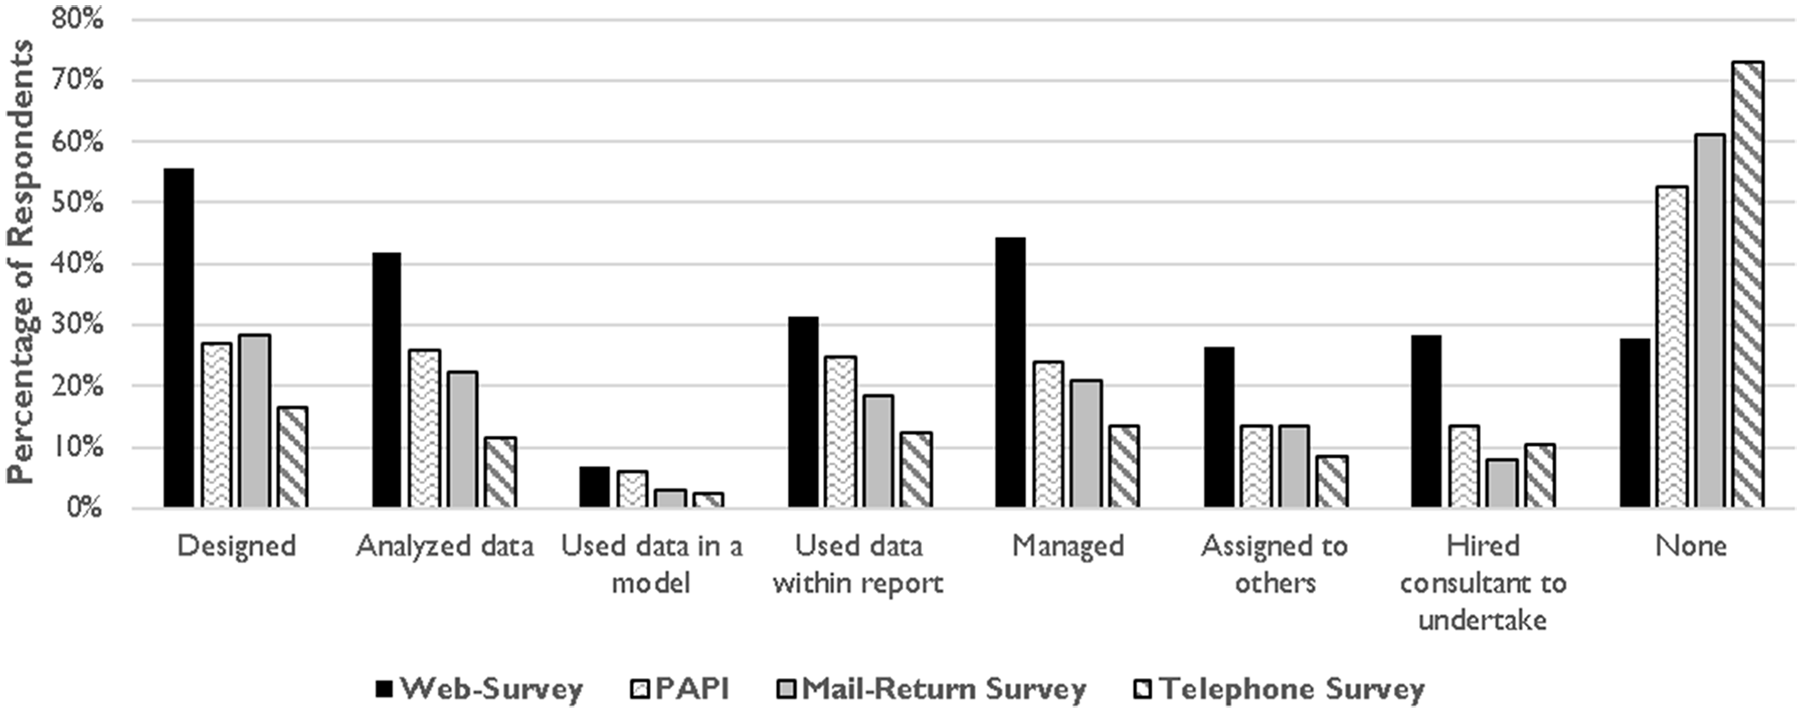
Survey tasks undertaken using various survey instruments.
For respondents that had ever undertaken a mail-return or telephone survey task, the most common frequency was almost always “less often than annually” with “Used to” being the second most commonly selected option for a small number of tasks. Planners have little experience in collecting data with telephone surveys, with 73 percent of respondents reporting that they had never undertaken any of the telephone survey tasks. Of the planners that had, none of them indicated that they did so on a monthly basis, in contrast with web surveys where between 3 and 12 percent of planners did so, depending on the task. This indicates that telephone surveys are becoming less popular over time and are more likely to have been undertaken by more experienced planners a number of years ago. This proposition was examined further using a Student t test of sample means for years of planning experience, comparing those who had indicated undertaking various survey instruments with the overall sample. The results within Table 1 demonstrate that the sample means for planners who have ever undertaken a mail-return or telephone survey task are significantly higher than the overall survey sample, suggesting that planners who have experience with these survey instruments have on average three more years of planning experience than the general sample.
Mean Years of Planning Experience by Usage of Survey Instruments.
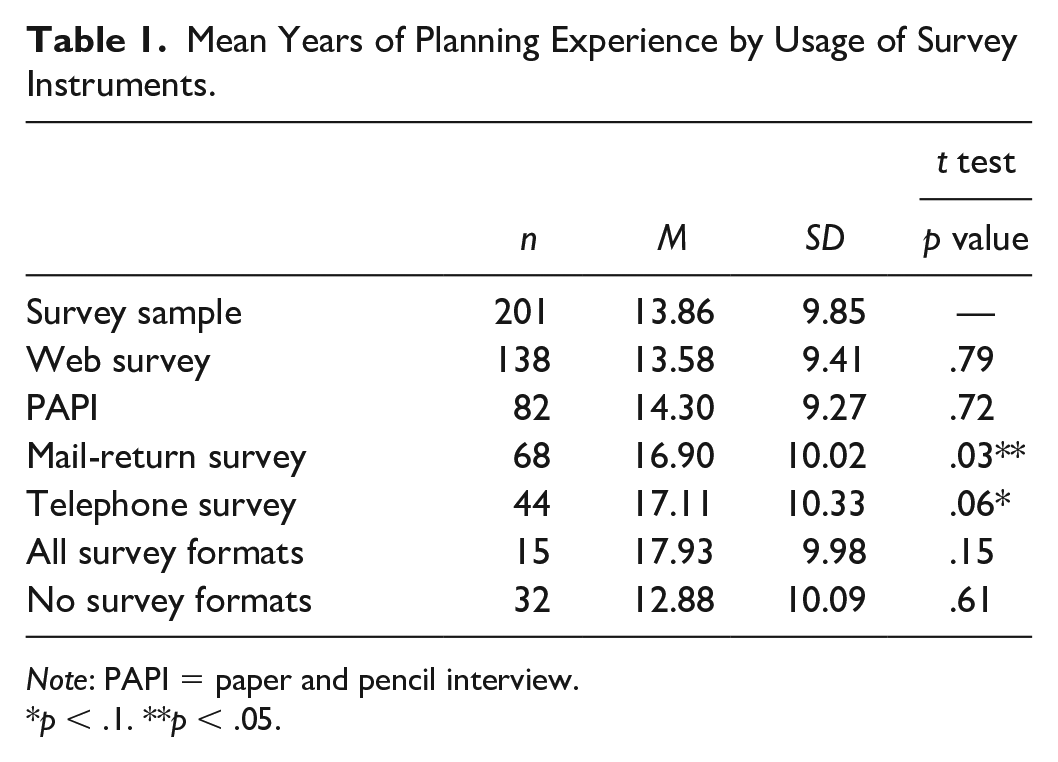
Note: PAPI = paper and pencil interview.
p < .1. **p < .05.
Planners who have ever undertaken a web survey task have slightly less planning experience than the overall survey sample, but not to a statistically significant extent. This could be possibly because more experienced planners who used telephone and mail-return surveys in the past are now using web surveys.
Mitigating Survey Limitations
Explorations of limitations with survey data, challenges faced when collecting survey data, and general procedures to undertake a “good” survey were pursued further within the interviews, so as to gain deeper insights into these issues. In these regards, my interview data reveal that the planners interviewed are chiefly concerned with mitigating sampling error—ensuring that the sample obtained is generally representative of the target population and that the data are therefore defensible when making a case to elected officials. This is well summarized by a selection of quotations below: The most important thing for me is making sure that I can use this data, so if I end up with some weird sample of . . . let’s say all homeowners in the city, I don’t want that because when my report goes to councilors, most of them will probably not look at the descriptives in too much detail, but some will . . . especially those who really don’t want to go ahead with what you’re advising, [they] will go through them and pick the whole report to shreds on the basis of representation, and the data being somehow biased. (Senior planner, City of Guelph, interviewee) It’s an intensive process . . . gathering data. It takes a lot of staff and a lot of time [ . . . ] so it needs to be worth it. The bigger the sample, the better. The more it reflects the demographic information that we have from StatsCan [Statistics Canada] the better. (Senior Planner, City of Ottawa, interviewee) Having a representative sample is crucial. Not so much for a small study at the neighborhood scale [ . . . ] But if it’s a city wide survey, then it should be representative. Our best surveys are our municipal census—which includes everyone within the City of Edmonton—and our Household Travel Survey, which chooses participants randomly based on their address. From a representation perspective, those are the gold standard. (Principal Planner, City of Edmonton, interviewee)
Thus, a good survey is often equated to a representative survey. When discussing the ways to undertake a good survey, my interview sample of planners again defaulted to sampling procedures, such as random samples, using address directories or random digit dialing (RDD). Planners demonstrated an awareness that the survey instrument (web, telephone, mail-return, or PAPI) could influence the representation of the sample. Even for web surveys, planners often were aware of challenges in reaching respondents who are “unconnected” to the Internet. In Canada, these individuals tend to reside in households headed by lower income, less educated, or older Canadians (Middleton and Sorensen 2005).
Planners were aware that a survey was unlikely to be representative of a target population if it was posted on the Internet and promoted exclusively through social media, but could reach more representative samples by sending households a unique link to a web survey. The City of Edmonton Municipal Census is one such case where this approach is used. Puzzlingly though, some planners admitted to having collected web survey data in a manner that contradicted their knowledge on representativeness in that a survey was posted online through an open link where anyone could complete it. This was despite the fact that planners’ target populations when administering surveys were almost always residents meeting spatial criteria, in that they worked or lived in a specific neighborhood or within the municipal boundary. When asked if they used the entire dataset in these circumstances, two planners said that they had used the features of the web survey platform to remove respondents outside the municipal boundary from the sample, but at the neighborhood level, they admitted that the data were not perfect, but they had used the entire dataset. Some planners within the interviews reported that on some occasions, they administered the same survey with multiple modes, to reach key demographics—particularly tenants, millennials, and students. These demographics are challenging to represent within traditional telephone surveys alone, given that they are less likely to have access to landlines, and RDD sampling algorithms have been slow to incorporate cell phones (Blumberg and Luke 2009; Lee et al. 2010).
Planners’ Acknowledgement of Response Biases
Cognitive response biases were less commonly acknowledged by planners and were often only alluded when they had been prompted. As part of this section of the interview, planners were shown examples of survey questions, which were deemed vulnerable to one or more response biases. Planners were not told that the questions were problematic and were given no preamble but told only to envisage asking residents within their municipality to answer this question using a particular survey instrument (web survey, PAPI, telephone-administered, and mail-return). Asking the interviewees to review the survey questions in this way placed a greater emphasis on identifying cognitive bias within primary data collection contexts as opposed to thinking critically about how secondary survey data could be influenced by cognitive bias, and is thus a limitation of this study 3 . Participants were given some time to reflect on the question before being asked to discuss their thoughts, followed up with a direct question regarding whether they would use that question themselves. For those that indicated that they would not use it and did not like the question, they were asked how they would improve it. The questions of interviewees that indicated that they would use them are shown within the Appendix. One-third (n = 6) of the interviewees found no issues with any of the questions and similarly did not acknowledge any wider effects that would make data collected using them problematic. For those that did, some could not articulate what exactly it was that they did not like about the questions (ranging from n = 3 to n = 11 depending on the question), some could identify it only as “leading” (ranging from n = 1 to n = 5 depending on the question), and most did not know how they would improve the questions. One example is a scenario concerned with question order effects, where planners were shown the following questions:
Q1. Compared to other municipalities in this province, my municipality has excellent parks and green spaces.
Strongly agree, agree, do not know, disagree, strongly disagree
Q2. Overall, my municipality does a good job at maintaining parks and green spaces
Strongly agree, agree, do not know, disagree, strongly disagree
The general idea behind this pair of questions is that the first question can induce a carryover effect in the second (Willits and Saltiel 1995). If answered in the order shown, there is tendency that a respondent may be compelled to agree with the second statement if they agreed with the first, as one could argue that their municipality must be doing a good job at maintaining parks and green spaces if they are better than other municipalities in the province. Only two planners thought that this pair of questions was problematic, but only one identified that the order of the questions was the issue in focus as is shown from the quotations below: This is . . . yeah . . . I don’t know. The data from the second question is more useful from a municipality’s perspective, so I would only ask the second one. Looking at it, this might seem far-fetched, but I would be minded to think that the first question might even push someone towards a certain level of agreement in the second. (Project Manager, City of Ottawa, interviewee [emphases added]) I don’t like these questions. The first one would have huge numbers of “don’t knows” because so many people in Toronto have their whole lives within the city, so many people wouldn’t really know about the parks in other municipalities. The second one is difficult too because even though the question says “overall [ . . . ]” I suspect most people answering that would just think of their local park, so the data you get from these wouldn’t be what you think you’re getting (Director, City of Toronto, interviewee).
These quotations reveal that planners do appear to think critically about survey questions, and although in this case, the planner cited in the second quotation did not identify the intended issue of question order effects, their response indicates an awareness of the concept of measurement error, by highlighting potential differences between the surveyor’s and the respondent’s interpretations of the question. In the majority of instances though, planners were not specific about the problems they saw with the questions. The fact that only one planner in this case alluded to question order effects is revealing in and of itself, but the language used in their statement reveals a lack of confidence in their diagnosis of what may be wrong, particularly with the qualifiers emphasized. Even for this planner who felt uncomfortable with the question order, cognitive biases appeared to be less familiar territory than sampling biases, and this was evident in several question-testing scenarios with other planners, dealing with acquiescence bias, social desirability, and response order effects. This lack of familiarity meant that even those who had identified a problem correctly often had little knowledge of how that could be mitigated. For mitigation, it is acknowledged that often such cognitive biases cannot be fully eliminated, but this study seeks to understand what planners’ approaches would be. Some response biases have been shown to be mitigated by implementing specific changes, such as social desirability bias being less prevalent when using self-administered, anonymous survey formats such as web surveys, rather than instruments where an interviewer is present administering the survey, as is the case in telephone or PAPI surveys. For the example above regarding question order effects, the planner who correctly identified the issue said that their way around it would be to just ask the second question, while the other planner who did not like the questions but did not consider the order problematic also advocated dropping the first question and revising the second one to asking residents how they would rate their levels of satisfaction with their local park, so that an overall estimate of how well the city was doing at the sample level could be derived. In this case, both were moderately confident in proposing their course of action, and correct in that only asking one question would mitigate question order effects. Planners who identified social desirability bias were less sure when asked how they would mitigate it, as is evident from the quotations below: I’m not sure how you could account for that . . . You know . . . Maybe . . . No. I think you just have to accept that some people aren’t entirely honest. There’s always that possibility. (Principal Planner, City of Calgary, interviewee) There’s probably a way to word the question to get around this. We have hired survey companies in the past and they’ve advised us on things like question wording and question format. It is really important to get that stuff right, so I’d probably seek that information from them. (Senior planner, City of Ottawa, interviewee) I don’t know to be honest. That’s a good question, maybe you could compare the reported data with observed, you could adjust it by removing the exaggerators . . . But then if you had the observed data, why would you bother doing the survey in the first place . . . Yeah, I’m not sure. (Senior Planner, Ville de Montreal, Interviewee)
Discussion
These findings support prior literature in providing some empirical data regarding planners reported usage of secondary survey datasets and self-collected survey data. Most literature concerned with planners’ usage of secondary survey data centers on the census. In finding that the Canadian Census was the dataset most likely to have been ever used by Canadian municipal planners in that over 90 percent selected it, with a variant of this census being the second most selected dataset, the results seem to concur with the assertions within prior literature regarding the importance of these datasets to planners (MacDonald 2008; Wang and vom Hofe 2007).
Planners also evidently collect survey data on a regular basis with at least 80 percent of respondents indicating that they took part in some survey data collection task at least annually, and only 16 percent indicating that they had never done so. This concurs with previous literature which found that these survey methods are highly valued and used (Contant and Forkenbrock 1986; Kaufman and Simons 1995), but it is not possible to compare directly due to the categories set in defining frequency of use. While Contant and Forkenbrock (1986) used categories such as “occasionally” or “frequently” when measuring the frequency of survey collection tasks, this article by contrast uses defined time periods and examines specific survey tasks rather than “survey data collection” as a whole, in recognition that some respondents may have an input within survey data collection without designing the questions themselves.
The frequency by which survey methods are reportedly used by planners indicates that they ought to be experienced survey data collectors, with knowledge on methodological best practice. The specific tasks within survey data collection that planners most frequently undertake include survey design, which means that planners are heavily involved in setting survey questions, making an analysis of their understanding of cognitive bias more pertinent. In inviting senior planners with experience collecting survey data to interview, I find that these planners do not have a great deal of understanding about cognitive biases and how they can be mitigated. They have knowledge of survey methods in a largely statistical sense, being aware of nonresponse biases and statistical representativeness. This means that planners perceive survey challenges as largely due to some variation of sample error, and their methods to improve surveys focus on mitigating sample error. This is not entirely surprising, given that survey methods are often taught within a larger quantitative methods course, which gives students within planning schools a lot of exposure to such concepts.
As to why planners’ acknowledgments of cognitive bias are largely absent, I suggest two primary reasons. The first is the nature of survey analysis in planning, which principally consists of quantitative analysis: sampling error is well understood by almost all people with basic statistics training, with (in theory at least) a well understood solution. Sampling error is reduced by increasing the sample and is reduced to zero in instances where the sample increases to encompass a census of a target population. This concept is a fundamental principle of statistical analysis. Most planning schools require their students to undertake a quantitative methods course, which encompasses inferential statistics (Edwards and Bates 2011), so it is perhaps not surprising that planners apply basic concepts learned at school to their analyses. By contrast, the developments in survey methodology, such as the total survey error approach, owe much of their existence to the field of social psychology, which as a discipline is less woven into the planning curriculum than statistics. The disciplinary remoteness of these developments, compounded by their relatively recent emergence—with survey methodology only established as a discipline in its own right since the late 1970s (Brenner 2017)—indicates that it may take more time for these developments to be on the radar of planning educators and graduates. As a result, cognitive biases may not yet be widely incorporated into planning education, resulting in planners adhering to somewhat outdated survey methodological practices. This mirrors a similar observation to that made by Jurjevich et al. (2018) in examining why some planners had poor knowledge of margin of error, namely that planners may lack training to interpret these issues, despite the fact that most planning programs require mandatory completion of a quantitative methods course.
Although outside the scope of this study, the poor understanding of cognitive biases calls for an examination of how survey methods are taught within planning curricula, whether quantitative methods courses still incorporate survey methods, and whether this in turn encompasses the total survey error approach, and follows developments within the field of survey methodology since the late 1970s. It is not clear to what extent survey methods are mandatory within such courses. The content such courses are required to cover appears to have increased incrementally over time, leading some planning schools to move toward modular methods courses (Mahayni, Sanchez, and Kelly 1999). Survey methods may still be offered within these modules, but students may self-direct toward others. It is not clear how well such methods components are taught to planning students, although it also may be the case that planners were adequately trained, but have not kept abreast of these skills throughout their career. This would be somewhat surprising, given that over 80 percent of planners within this study undertake some form of survey task (on any instrument) at least annually, giving them regular exposure to survey methods.
The second possibility for planners’ lack of acknowledgment of cognitive biases in survey data is that in an action-oriented setting of planning practice, survey results need to be communicated clearly so that courses of action can be decided and implemented. As such, detailing a catalog of survey limitations obscures what the data tell us and inhibits action from being taken in a policy-oriented “real” world, and even where planners do understand these limitations, it may be intentional to omit their acknowledgment, as is well summarized by Dandekar (2005).
Good information is the significant resource that planners bring to a negotiations table. Facts help persuade, convince, and mobilize the individuals and groups to be impacted in the communities to engage with, and to embrace, proposed interventions. Planners also need facts that will help in communicating with constituencies that hold a multiplicity of views about issues related to both people and place. [ . . . ] Most importantly, planners need facts that can be communicated and amenable to translation by policy makers and elected officials working in highly politicized, often turbulent, and changing environments. (Dandekar 2005, 130)
The importance that planners within this study place on the usability of survey data would tend to support this view, but planners’ responses to the sample survey questions within the interviews tended toward a lack of understanding of cognitive bias, rather than an intentional effort to omit the effects of cognitive bias to make these data more interoperable.
Exceptions of Note: The Transport Planners’ Approach
The three transport planners within my interviews differed from other planners in their approach to data collection in several noteworthy ways. While it is not possible to generalize from this small number, these differences were marked and warrant acknowledgment of what could potentially be a different approach within this subgroup, and this should be explored further. When designing surveys, they tend to draw upon questions (often copying the wording directly) from other official secondary surveys such as the NTS so that data could be directly compared with a larger sample or compared over time. Even for standalone projects with no foreseen follow-up, transport planners are much more likely to collect data in a way that could be used beyond the scope of the project at hand, in that they survey larger spatial areas than required, or ask more questions than were necessarily needed for the study. They are also more resourceful in “digging” for survey data collected from previous projects and “playing around” with it before deciding whether new survey data are really needed. Transport planners also alluded to a greater awareness of cognitive biases. When shown the response bias example questions within the interviews, transport planners more often identified bias than the rest of the sample, and transport planners were consistent in their dislike of statement style questions where respondents are shown a statement and asked their level of agreement, instead preferring a clear question with neutral wording accompanied with numerical Likert scale response options. When discussing challenges faced when designing surveys, all three mentioned the wording of survey questions unprompted, whereas only one nontransport planner did so. Nonetheless, transport planners still lacked certainty regarding how to mitigate cognitive biases within survey data, in line with the rest of the interviewees.
There are a few possible reasons for these findings, three of which are suggested below:
The first is that transport is often a distinct discipline within planning and one could argue that the tasks at hand within this specialism often require a distinct, more quantitative, numerate, methodological approach. The challenge here is that the differences in approach to survey data collection were evident even in situations where transport planners were working on nontransport-related projects, signaling that the motivations for their approach were not likely driven by the project at hand, but rather reflected a methodology that they had learned over the course of their careers, possibly through on-the-job mentoring from senior colleagues.
The second possibility is the development of a transport-focused survey methodology within academic circles, in that papers exploring survey bias and how transport data can be altered with different survey instruments and approaches have become a noticeable side project within transport literature (Beck, Fifer, and Rose 2016; Efthymiou and Antoniou 2012; Fifer, Rose, and Greaves 2014; Kagerbauer, Manz, and Zumkeller 2013; Puello, Olde-Kalter L, and Geurs 2017; Zmud et al. 2013). The degree to which transport planners outside of academia follow these developments is unknown and further work exploring this would be beneficial.
If the emergence of an academic transport-focused survey methodology is a factor in the survey approaches of transport planners outside of academia, one would suspect that they encountered it while they were at university, which leads to a third possible explanation: educational background. In this regard, the three transport planners who were interviewed had mixed academic backgrounds, with one holding a degree in civil engineering, one holding an accredited planning degree, and one holding a degree in social sciences. It is not possible to draw wider conclusions from this about transport planners more generally, but is notable that only one transport planner had an accredited planning degree—which could be a concern for planning educators. If knowledge of survey limitations among planners is somewhat better among a subgroup who are less likely to have an accredited planning degree, this only compounds the need for reviewing planning methods education, as one would hope that those best equipped to undertake planning methods ought to be those trained within the planning discipline.
Conclusion
This study focussed on how planning practitioners collect survey data, how often they do so, and how they integrate the limitations of survey questionnaires into practice. Previous literature has identified or implied that survey methods are valuable and/or highly used skills for planners for a considerable time, yet there has been little work critically examining planners’ usage of this skill. Using a sampling of Canadian municipal planners, I find that the majority of planners regularly (at least monthly) use survey data, and also that a majority have collected survey data, and do so at least annually, with only a small minority (16%) of planners having never done so. I find that planners’ experience with various survey instruments varies, with telephone and mail-return surveys being used less often than they were previously. Web surveys are planners’ preferred survey instrument, despite challenges in acquiring responses from those with poor access and/or low usage of the Internet, and despite often seeking target populations meeting spatial criteria, which are rarely guaranteed using web survey instruments. Despite this relatively high usage of survey methods, I also find that planners within this study had little apparent knowledge of response biases, often only identifying problematic questions as leading, with little understanding of how wider effects could be more problematic in particular survey instruments. If survey methods were used infrequently by a minority of planners, one could reasonably question the relevance of such findings, but many planners evidently spend a great deal of time and resources collecting survey data—the majority doing so on at least an annual basis—while displaying a limited understanding of how to design survey questions.
To conclude with the implications of these findings, the poor knowledge of response biases revealed within the interviews with experienced planners suggests that a review of how survey methods are incorporated within broader methods courses of planning curriculum would be useful. While the reasons for these results are unknown, they suggest that survey methods and questionnaire constructions should be central to planning methods curricula. Either they already are—and the pedagogical techniques are not being adhered to or remembered by practicing planners—or they are not: in either case, this means that a close look at planning methods teaching is in order. Planning curricula within the United States and Canada have evolved largely in sync with one another and encompass similar formats of core and elective material (McIntyre et al. 1997). Nonetheless, further work would be beneficial in identifying whether the problems identified are unique to Canada or are evident also within the United States or further afield. Such work should examine whether survey methods remain a core element of quantitative methods courses or whether they are now more peripheral, in response to planning schools having to fuse greater numbers of quantitative skills within such courses. Further research could also examine the material covered within survey methods courses, and particularly whether they cover response biases, and ways for mitigating these that are appropriate to planning contexts.
Although peripheral to this article, the exposure that planners have to big data and their ability to understand and mitigate the limitations of emerging data are related to this enquiry and should be further explored. Whether or not survey methods and questionnaire construction are currently included in planning curricula, the limited understanding that planners within my interviews seem to have of the challenges and possible biases inherent in small data do not augur well for planners’ use of new and emerging methods, such as big data. These data are often gathered in unclear ways with limited transparency, “cleaned” by processing through black box algorithms, and presented as authoritative (Succi and Coveney 2019): planners need to know how to ask critical questions about these data should they be effective in using them, which for the time being they do not seem equipped to do.
Supplemental Material
sj-docx-1-jpe-10.1177_0739456X211043272 – Supplemental material for Survey Methods: How Planning Practitioners Use Them, and the Implications for Planning Education
Supplemental material, sj-docx-1-jpe-10.1177_0739456X211043272 for Survey Methods: How Planning Practitioners Use Them, and the Implications for Planning Education by Meadhbh Maguire in Journal of Planning Education and Research
Footnotes
Acknowledgements
I would like to acknowledge Professor Richard Shearmur from the McGill School of Urban Planning for his support and insight which was of great assistance to this paper and the wider work it related to within my thesis. Finally, I would like to thank the reviewers who have contributed their time and suggestions to this paper, to which I am very grateful.
Declaration of Conflicting Interests
The author(s) declared no potential conflicts of interest with respect to the research, authorship, and/or publication of this article.
Funding
The author(s) disclosed receipt of the following financial support for the research, authorship, and/or publication of this article: This research received financial support from the Fonds de Recherche du Québec Société et Culture (FRQSC) through award number 275917.
Supplemental Material
Supplemental material for this article is available online.
Notes
Author Biography
References
Supplementary Material
Please find the following supplemental material available below.
For Open Access articles published under a Creative Commons License, all supplemental material carries the same license as the article it is associated with.
For non-Open Access articles published, all supplemental material carries a non-exclusive license, and permission requests for re-use of supplemental material or any part of supplemental material shall be sent directly to the copyright owner as specified in the copyright notice associated with the article.