
Abstract
This article suggests that the domination of the scale of the neighborhood in planning distorts our understanding of urban phenomena and that a multiscalar approach is required. It examines the association of perceived scales with residential satisfaction. The findings suggest that the neighborhood is not the dominant scale with which people perceive and define their residential area, rather they consider smaller than the neighborhood scales. Moreover, we found that the perceived scale is a significant predictor of residential satisfaction. We conclude that scale matters for understanding urban issues, and become even more significant in a time of crisis such as the coronavirus epidemic, and that urban planning should consider and be informed by smaller than the neighborhood scales.
Introduction
Neighborhoods and census tracts have been commonly used as urban scales in planning theory and practice since the appearance of modern planning. Planners and architects have used the neighborhood as a major scale for planning and promoting social projects, such as a sense of community, social integration, and other sociophysical programs. The need “to apportion cities into manageable units and subunits—segmented, patterned, sorted into equal-size circles, squares, or hexagons at regular intervals, nested into hierarchical arrangement, often with mathematical precision” has guided modern planning from its onset (Talen 2018, 36). As a direct result of this dominant planning approach, urban scholars, from Cooley (1909) and the Chicago School sociologists Park, Burgess, and McKenzie ([1925] 1967) to contemporary scholars, comprehend the primary relationships of people and their surroundings as grounded in the neighborhood scale. One of the most famous spatial models of neighborhood planning (Talen 2018) is Perry’s concept of the neighborhood unit (Perry 1924, 1939), which understands the urban neighborhood “as a means to organize space and socialize residents” (Keating & Norman 2000, 111) through a specific scheme of land uses. This fixed-principles model and similar models were widely adopted in the first half of the twentieth century, and the models became prevalent in the United States, the United Kingdom, China, and elsewhere (Carmon and Eizenberg 2015; Kallus and Law-Yone 2000; Talen 2018). However, scholars have argued that the notion of the neighborhood has been only vaguely defined by both theoreticians and practitioners (Kallus and Law-Yone 2000). More specifically, the disconnect between the rationally (and even mathematically) defined construct of the urban neighborhood and the way that it is experienced and understood in practice alludes to hundreds of different definitions that try make sense of the meshing of the physical and the experiential (Talen 2018).
Nevertheless, more contemporary planning approaches, such as new urbanism, neotraditionalism (Bressi 1994; Calthorpe 1993; Christoforidis 1996; Duany and Plater-Zyberk 1991; Nasar 2003; Talen 2000), urban villages and other emerging approaches to sustainable community planning still hold the basic assumption regarding there being a link between spatial planning on the scale of the neighborhood and the various experiences of people, such as a sense of community, place attachment, and satisfaction. New urbanism, for example, assumes that physical planning measures encourage social contacts and a sense of community on the neighborhood scale (Brown and Cropper 2001; Francis et al. 2012; Joongsub and Kaplan 2004; Talen 1999).
This assumed link is being challenged not only by the planning literature but also by literature from related and other disciplines that suggest that scale matters (Boone 2013; Boone et al. 2009; Bowen and Laroe 2006; Boyce, Zwickl, and Ash 2016; Maantay 2002; Romero-Lankao et al. 2014; Tan and Samsudin 2017; Zhang, Lu, and Holt 2011). A claim supported by studies on segregation, spatial quality, environmental inequality, urban hazards, and urban park provision shows that investigating the same topic on different scales yields different results (i.e., Bates 2006; Comber, Brunsdon, and Green 2008; Di Vittorio & Miller 2014; Fowler 2016; Reardon et al. 2008; Tan and Samsudin 2017; Zhang, Lu, and Holt 2011). Thus, this article suggests that the domination of the scale of the neighborhood in urban planning distorts an understanding of urban phenomena and that a multiscalar approach is required (Bates 2006; Bowen and Laroe 2006; Tan and Samsudin 2017).
Bates (2006) argues that the focus of planning and policy on the neighborhood scale often delivers “unexpected results,” since the neighborhood is not the correct unit for understanding consumers’ behavior in the housing market. Thus, planners need to create areas of housing submarkets based on the physical structure of the environment to better configure housing policies. Zhang et al. (2014, 135) also conclude that “scale mismatching can produce adverse results” and that variations in scale may yield different results (Di Vittorio & Miller 2014). Bowen and Laroe (2006) found that the different choices of scale may lead to noticeably conflicting correlations among socioeconomic variables and toxic releases of chemicals. As a result, researchers are debating the definition of scale in spatial studies as well as how to operationalize scale in research (e.g., Marston, Jones, and Woodward 2005; Prytherch 2007).
More recently, a transition toward a multiscalar understanding of urban phenomena has been largely attributed to the contribution of research on human geography (Fowler 2016). The multiscalar approach examines every urban process and outcome in a matrix of different scales rather than at a predetermined point of measurement. Thus, researchers can examine how processes and outcomes vary across scales and can devise an altogether different and more complex understanding of the researched phenomenon (Fowler 2016). A wide range of studies have been conducted to shed light on the role of scale pertaining to different urban topics. Comber, Brunsdon, and Green (2008) examine the accessibility of urban greenspace for different groups on a range of scales, from the level of the city to the smallest scale, at which census data are reported and the “building block from which all other higher-level census geographies are formed” (p. 105). Zhang, Lu, and Holt (2011) compare access to parks in the United States, starting from the scale of the census block aggregated at the census tract, county, state, and national level. The authors find significant differences in accessibility at different scales within districts and between states. Tan and Samsudin (2017) consider the role of scale in evaluating equity by examining park locations in Singapore at three different scales: region (large scale), planning area (intermediate scale), and subzone (small scale). Reardon et al. (2008) define different scales based on radii of 500, 1,000, 2,000, and 4,000 m to examine ethnic segregation in forty metropolitan areas in the United States. The authors argue that the segregation profile is a function of scale by showing different patterns, causes, and consequences of residential segregation on different geographic scales. Fowler (2016) concludes that urban segregation should be examined in very small geographic areas.
Nevertheless, this important development in research toward a more complex understanding of scale still overlooks Montello’s distinction between orders of scale: scales of human perception that can be defined as “the size of a space relative to a person” and “general scales” that can be defined as “the ratio between the dimensions of a representation and those of the thing it represents” (Montello 1993, 313). While scientists have offered subdivisions of the perceived scale, such as large scale–small scale (Ittelson 1978), small–medium–large scales (Gärling and Golledge 1989), and figural–vista–environmental–geographical scales (Montello 1993), the literature is preoccupied with “general scales.” That is, the literature makes use of general scales, such as the city, census tracts, and neighborhoods, that represent the measurable, fixed, and comparable “scientific” scales, among which the neighborhood scale is usually dominant. However, “if residents respond to the environment of their local micro-neighborhood, but the researcher measures the environment of the broader neighborhood (for example, the census tract), such effects may not be detected” (Hipp 2010, 2517). We argue that despite recent efforts to address the issue of scale, the perceived scale is still largely overlooked. The perceived scale is highly important for research to attain complex measurements that are representative of an urban phenomenon, with crucial implications for planning and policy.
Therefore, based on the works of Bronfenbrenner (1992), Gärling and Golledge (1989), Ittelson (1978), and others, we assume that people in their everyday life experience relate to and are informed by different scales. People live on different scales depending on their life context, and these scales in turn affect their perception of their environment. Thus, every planning study that aims to understand the perceived environment will be scale-affected twice: by the scale of the investigation, as has been mentioned in research, and by the scale that the people who are studied perceive as their environment. We argue that the scale of the residential area perceived by the residents is crucial for understanding urban processes, outcomes, and experiences.
This article examines satisfaction by differentiating between the perceived scales of residents. The following sections present a brief review of the literature on residential satisfaction in relation to the scale of examination, the research methodology, the findings of the empirical work, and a discussion of the findings and conclusions that include important takeaway messages for urban planning practice and research.
Research Hypotheses: Perceived Scale and Residential Satisfaction
To illuminate the role of the perceived scale, this study investigates residential satisfaction and its association with scale. Residential satisfaction is a significant topic in urban studies, geography, and planning (e.g., Austin, Furr, and Spine 2002; Baba and Austin 1989; Cao and Wang 2016; Dassopoulos and Monnat 2011; Huang and Du 2015; Oh 2003; Parkes, Kearns, and Atkinson 2002; Wang and Wang 2015). Satisfaction on the neighborhood scale is affected by a variety of social, demographic, environmental, and psychological variables. Scholars suggest that satisfaction is associated with safety, neighborhood stability, and community attachment, order, privacy, and community spirit and that it is a predictor of housing and life satisfaction (i.e., Basolo and Strong 2002; Day 2000; Fried 1984; Hur and Bollinger 2014; Kweon et al. 2010; Li, Zhu, and Li 2012; Oh 2003; Sirgy and Cornwell 2002).
Physical factors, such as neighborhood maintenance and housing quality, land use, greenery, density, neighborhood type, and landscape and aesthetic appreciation contribute to neighborhood satisfaction. However, no conclusive results have been found regarding the relationship between neighborhood crowding, building/population density, and neighborhood satisfaction (see Bonaiuto et al. 1999; Bonaiuto, Bonnes, and Continisio 2004; Bonnes, Bonaiuto, and Ercolani 1991; Cao 2016; De Vos, Van Acker, and Witlox 2016; Kearney 2006; Potter and Cantarero 2006). In addition, neighborhood attractiveness (e.g., design quality) and various indicators of compactness and connectivity are significantly associated with neighborhood satisfaction (e.g., Bothwell, Gindroz, and Lang 1998; Hur, Nasar, and Chun 2010; Kweon et al. 2010; Lee et al. 2008; Lovejoy, Handy, and Mokhtarian 2010). Furthermore, factors such as perceptions of risk and safety, relationships with neighbors, and community organizations are associated with neighborhood satisfaction, whereas demographic factors, such as gender and income, are occasionally associated with satisfaction (e.g., Amérigo and Aragones 1997; Francescato 2002; Hur and Bollinger 2014; Hur and Morrow-Jones 2008; Hur and Nasar 2014; Jansen 2014; Joongsub & Kaplan 2004; Lalli 1992; Li, Wenning, and Morrow-Jones 2013; Lovejoy, Handy, and Mokhtarian 2010; Parkes, Kearns and Atkinson 2002; Sirgy and Cornwell 2002).
However, despite the crucial role of scale in comprehending how people evaluate their environments, there is a considerable lack of attention to different scales in the study of residential satisfaction as well as a lack of current studies on the role of perceived scale in shaping satisfaction. Indeed, a critical review of the literature reveals that the terms “neighborhood satisfaction” and “residential satisfaction” have both been used in reference to the neighborhood as the research unit and thus have become interchangeable. The literature uses the terms neighborhood satisfaction, residential satisfaction, and housing satisfaction somewhat interchangeably, making it difficult to infer their hierarchy, and many times these terms are folded into one (Cao and Wang 2016; Wang and Wang 2015). Some studies distinguish among the terms by associating residential satisfaction with research concerning housing quality and housing environment and neighborhood satisfaction with research emphasizing the physical and social environment on the neighborhood scale. However, most of the research on satisfaction with the residential area has the inherent assumption that the scale of the “neighborhood” is the dominant research unit and simply focuses on the neighborhood scale, perceiving the neighborhood as a fixed and coherent unit of reference. An exception is Hipp’s (2010) study, which presents an effort to overcome the bias of scale in comprehending influential factors of neighborhood satisfaction. Hipp aggregates dimensions such as race and ethnicity, socioeconomic characteristics, and residential conditions at two levels: the local microlevel of the neighborhood and the census-tract level, and examines how they interact with neighborhood satisfaction. While Hipp finds that sociodemographic variables at the microlevel influence neighborhood satisfaction more than those at the broader level, he does not consider on what scale residents perceive their residential environment and how this perception interacts with their level of satisfaction. This article adds this dimension to the discussion on residential satisfaction.
Hypotheses
Thus, in this article, we contend that residential satisfaction should be further examined and better understood by overcoming the general fixation of the research on the scale of the neighborhood. Moreover, in cases where researchers distinguish between the neighborhood scale and other scales, they still make use of general scales of representations (such as scales of a census tract or a district). The scale on which individuals perceive and relate to their living environment is not a factor of the analysis. Thus, based on the valuable literature on spatial scale and satisfaction, we propose four different hypotheses, each capturing different aspects of the phenomenon:
The neighborhood is not the dominant scale people consider when they define their residential area.
Residential satisfaction is associated with the perceived scale.
Perceived scale is a predictor of residential satisfaction.
Different scales reveal different predictors of residential satisfaction.
In other words, different determinants or variables will explain satisfaction on different scales, and a scale smaller than the neighborhood will provide a different understanding of urban residential satisfaction. In this article, we examine these hypotheses by investigating satisfaction across the medium-sized city of Beer Sheva in Israel (see Figure 1).
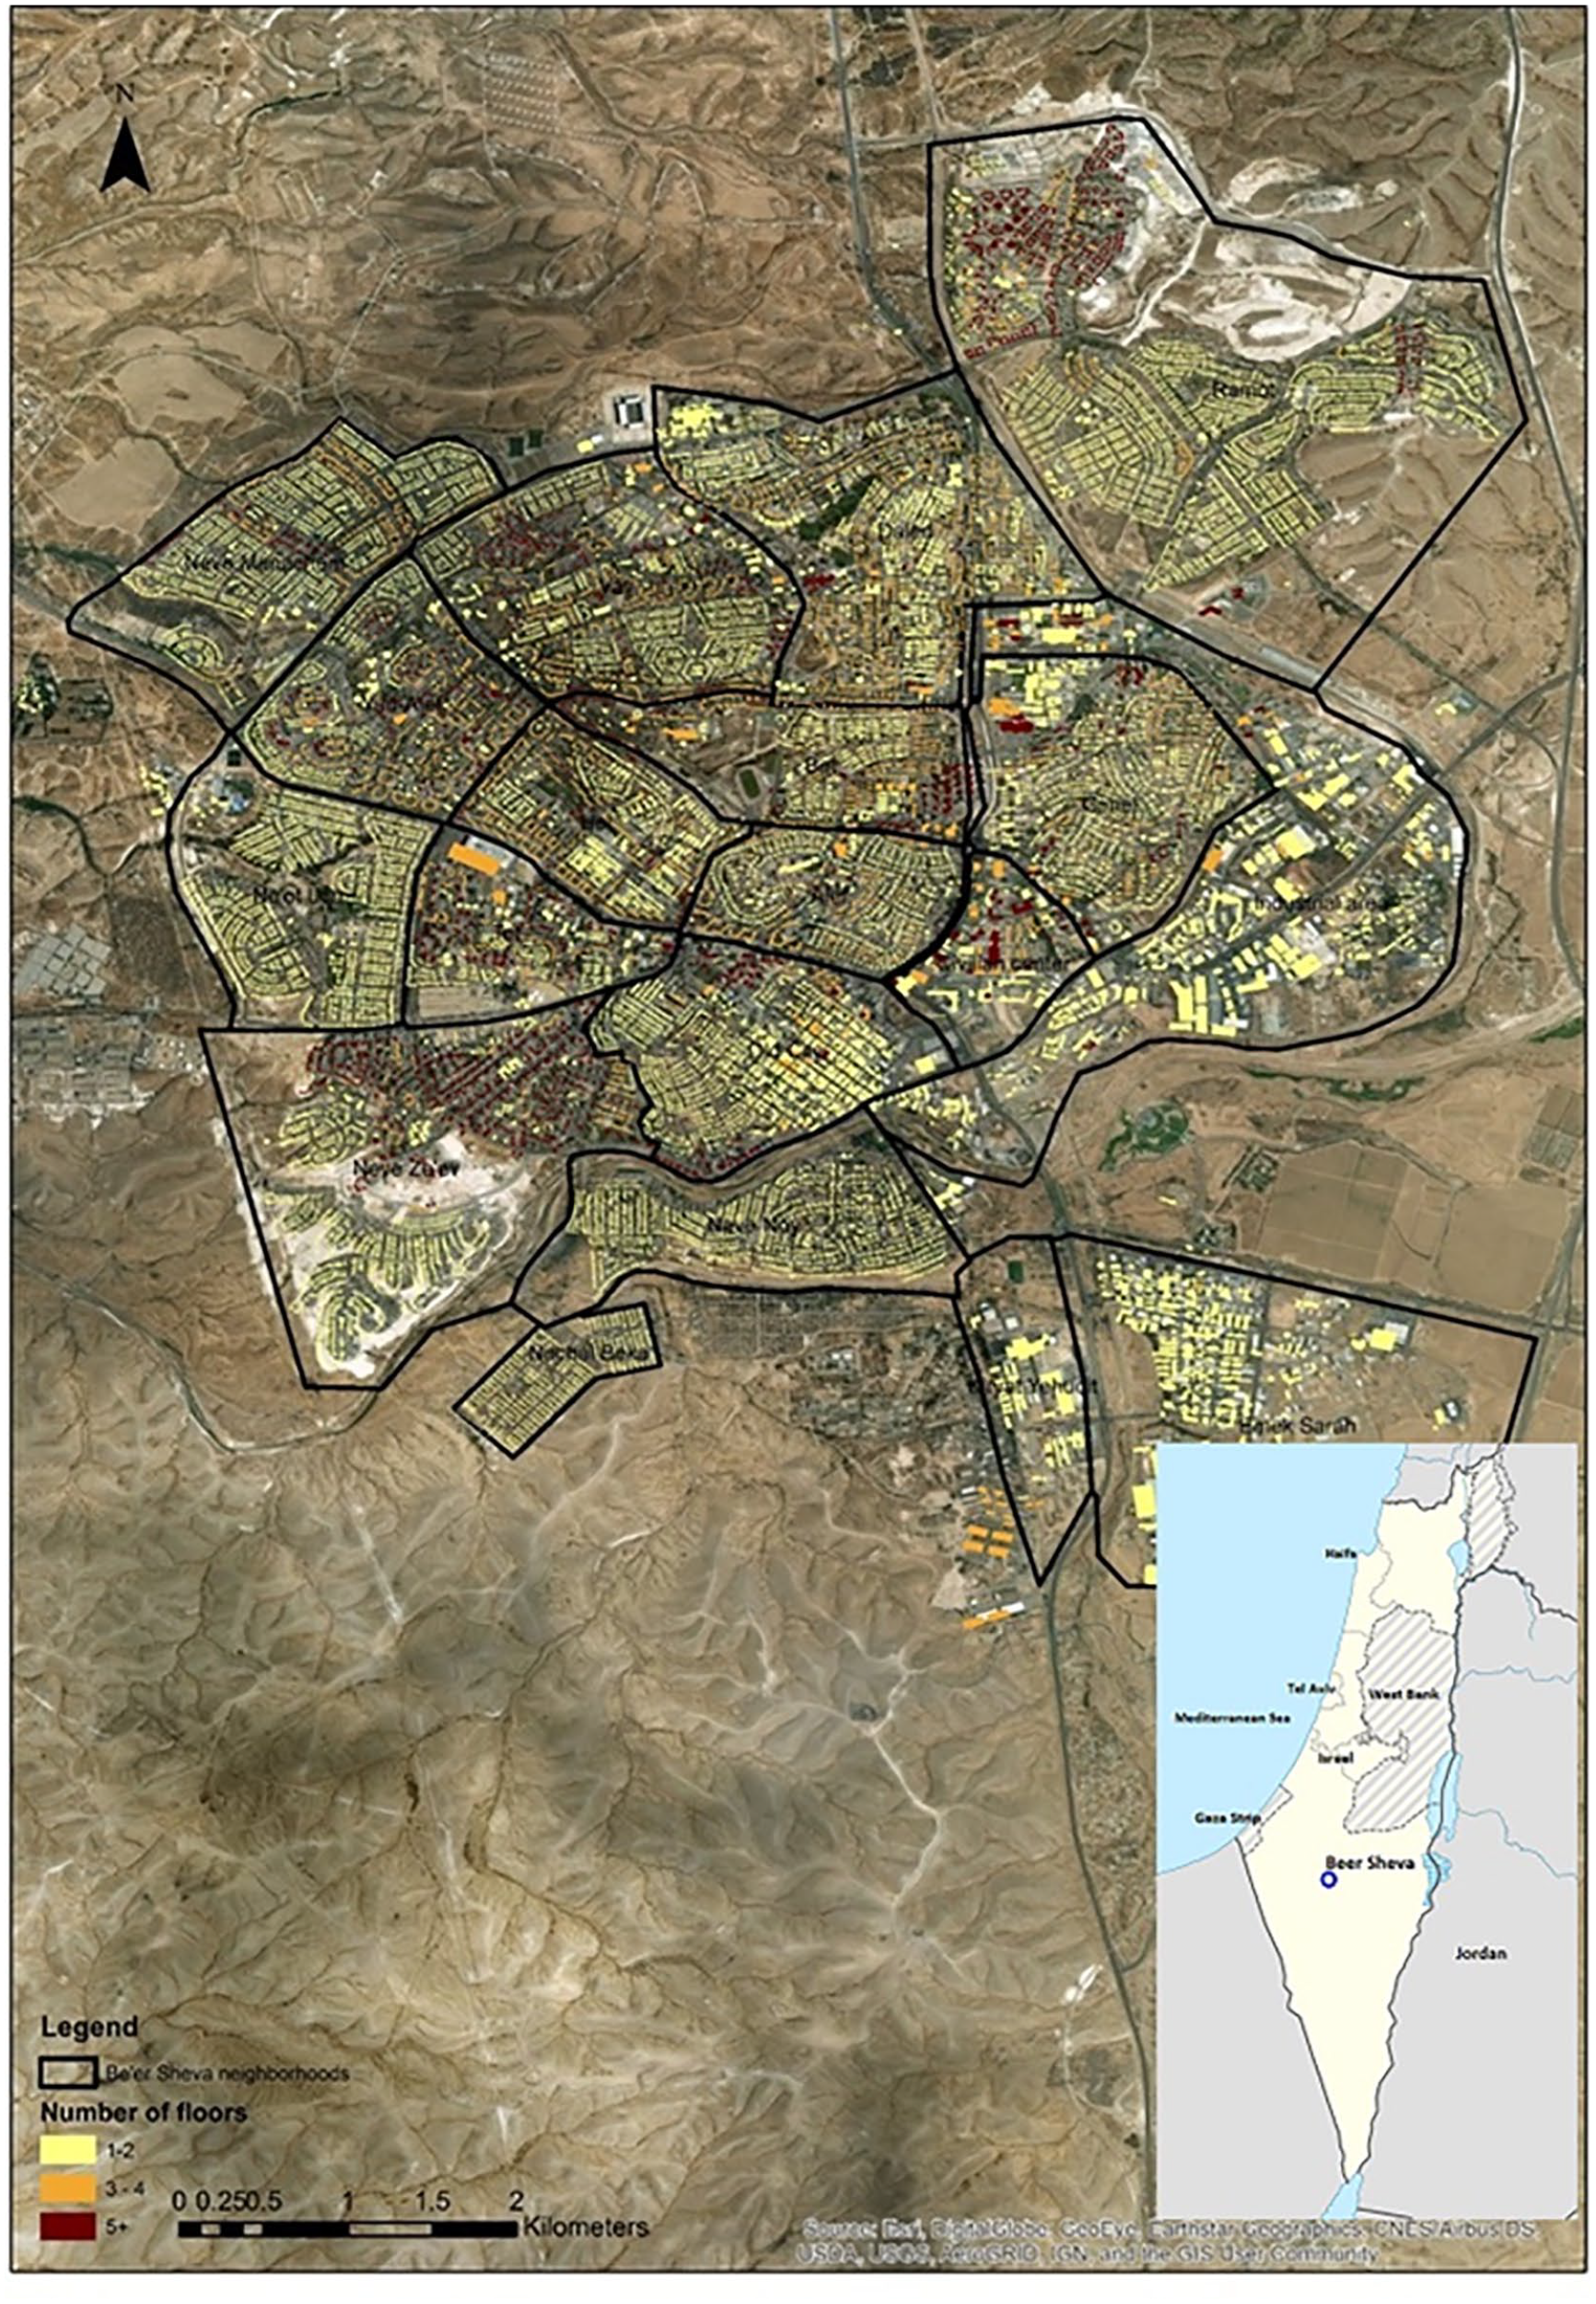
The distribution of Beer Sheva’s neighborhoods and types of buildings by number of floors.
Methods
Research Setting
The city of Beer Sheva, Israel, was selected as our case study because of its spatial characteristics. Since the establishment of Israel in 1948, the city has been planned and built around the idea of neighborhoods (Alfasi and Portugali 2004; Yiftachel, Goldhaber, and Nuriel 2009). Beer Sheva was selected as a case study because of its neighborhood-based structure, which provides us with a great opportunity to determine how much the neighborhood scale still dominates in the city (Jabareen and Zilberman 2017). The Beer Sheva population is approximately 209,000 (Israel Central Bureau of Statistics 2017), of which approximately 90 percent are Jews and the rest are Arabs. Figure 1 shows the city boundaries, its neighborhood borders as assigned by the local government, and the type of housing by number of floors.
Sampling, Participants, and Procedure
The participants were residents of Beer Sheva above the age of seventeen. Data collection was based on a questionnaire, which was administered among 361 participants derived from a simple random sampling of different clusters of the population in the city. A cluster sampling technique divided the population into clusters based on three criteria: (a) the socioeconomic status of the neighborhoods according to the three levels of high, medium, and low; (b) housing type, that is, detached houses, apartment buildings with three or four stories, apartment buildings with five or six stories, or apartment buildings with more than six stories; and (c) the demographic attributes of the neighborhoods according to ethnicity and religion. This process yielded thirty-six clusters that covered the entire city and its population. Then, a sample of twelve clusters was selected from the thirty-six clusters. The survey was obtained from 361 residents from the twelve sampled clusters. Within each cluster, a random sampling of thirty participants (with only one of the clusters obtaining thirty-one completed questionnaires) was conducted. We used the geographic information system (GIS) system of the Beer Sheva Municipality to build this sample. In each cluster, a random residential building was selected as a starting point. Then, members of every fifth consecutive occupied household in each cluster were interviewed. The personal interview took place at the respondent’s home (Jabareen and Zilberman 2017).
The mean age of respondents was 44.8 years (SD = 18.4), and females were slightly underrepresented (44%). The average household size was 3.1 persons (SD = 1.8) in our sample, while the average household size in the city was approximately 3.2 persons, according to the Central Burau of Statistics in Israel (Israel Central Bureau of Statistics 2017). The participants resided in their neighborhoods for an average of 16.2 years (SD = 15.8). Approximately 60 percent owned their own residences, and 44 percent of the households had at least two or more dependent children.
Procedure
The survey was based on personal interviews, at which point Hebrew questionnaires were administered. The personal interviews were conducted in the participants’ homes by twelve trained interviewers (six male and six female). One adult member (older than 17) was interviewed in each selected household. There were no incentives given to the participants. They were told that this survey involves academic research on people’s attitudes regarding housing and sense of community issues.
Measures
The administered questionnaire consisted of self-reported measures based on a 5-point Likert scale, where 1 = very dissatisfied and 5 = highly satisfied. The measures included residential satisfaction, safety, trust, religiosity, and attitudes toward physical typologies: compactness, walkability design, and density. General trust and general satisfaction were measured by asking the following questions: “In general, how much do you trust your neighbors in your residential area?” (1 = very little, 5 = very much) and “In general, how satisfied you are with your residential area?” (1 = very dissatisfied, 5 = very satisfied). Satisfaction with various physical attributes was aggregated into indexes. For example, the Design index aggregated participants’ satisfaction with (a) open green spaces, (b) the architectural design and aesthetics of the buildings, (c) trees positioned along streets, (d) street furniture, (e) street lighting, and (f) sidewalk widths. The final design index, which includes six variables with high internal reliability (Cronbach’s α = .83), was calculated on a 5-point Likert index (1 = low level of satisfaction, 5 = high level of satisfaction).
In addition, perceived scale was measured with the following: “How do you define your residential area: (1) a few buildings close to my home, (2) a few streets around my home, and (3) the neighborhood.” Based on this, we constructed the scale variable as follows: (a) Scale 1: the intimate scale, which is “a few buildings close to my home”; (b) Scale 2: the intermediate scale, which is “a few streets around my home”; and (c) Scale 3: the neighborhood scale. Furthermore, the questionnaire included socioeconomic and demographic measures.
Results
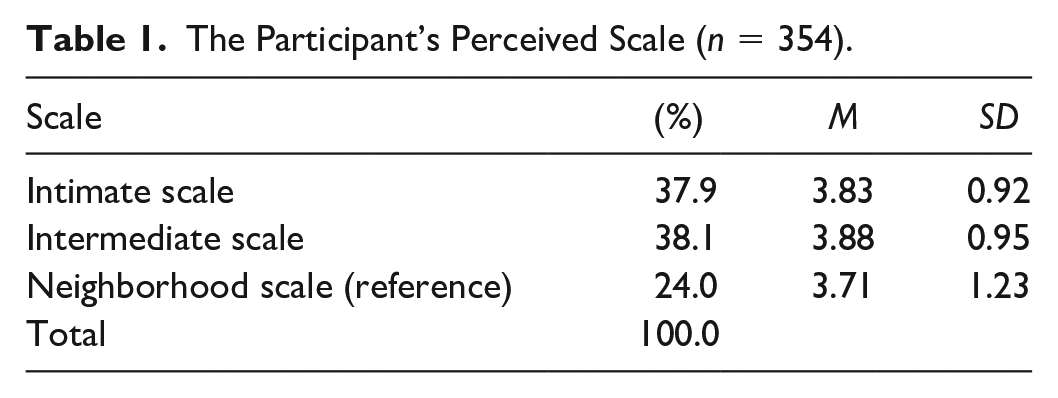
The results reinforce the hypothesis that the neighborhood scale is not the dominant scale as perceived by the participants. Table 1 shows that slightly less than two-thirds of the participants considered their residential area not a “neighborhood” but a smaller-scale area, and slightly more than one-third of the participants considered the “neighborhood” their scale of reference. Of the total participants, only a quarter perceived their residential area as the neighborhood. Approximately 38 percent perceived their residential area as being on the intimate scale, which includes “few close buildings” and “my specific street of residence.” Another 38 percent of the total sample perceived their area on the intermediate scale, which includes a “few close streets.” Thus, the majority of the sample did not perceive the neighborhood scale as their scale of reference.
The Participant’s Perceived Scale (n = 354).
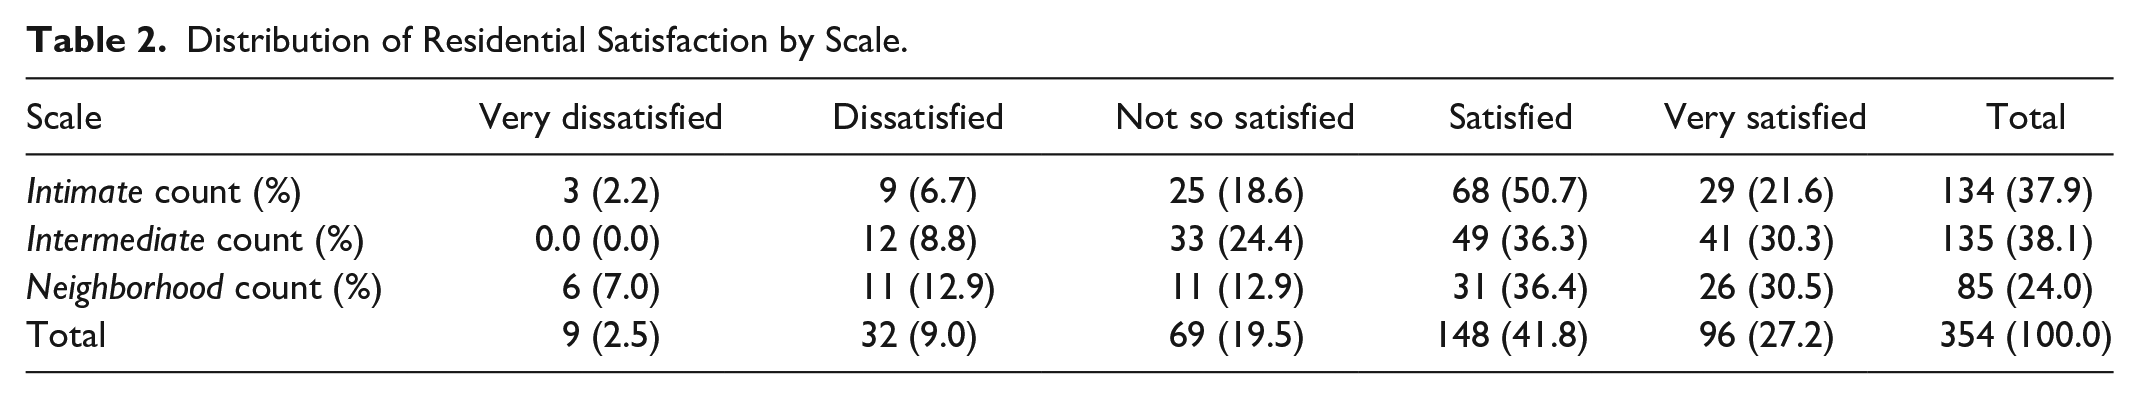
A chi-square test was performed, and a significant association between scale and residential satisfaction was found, χ² (8, N = 354) = 22.66, p < .003. Table 2 presents the distribution of residential satisfaction by scale. It was found that different scales significantly reveal different residential satisfaction.
Distribution of Residential Satisfaction by Scale.
A stepwise multiple linear regression analysis to predict residential satisfaction revealed a significant regression model, F (9, 234) = 20.56, p < .000, with an R2 of .44 (for regression, see: Batson and Monnat 2015; Ciorici and Dantzler 2019). As Table 3 shows, eight variables significantly predict residential satisfaction for the entire sample. The scale variable was entered into the regression as a dummy variable with the neighborhood as a reference variable (Scale 1: intimate, Scale 2: intermediate). According to the regression model, eight independent variables explain 44.1 percent of the variations in residential satisfaction. Safety and design variables are the strongest predictors, safety explains 23.4 percent of the variation, whereas design explains approximately 8.7 percent. Trust, density, public transportation, compactness, and apartments in buildings together explain approximately 10 percent of residential satisfaction (the incremental R2 accounts for the difference between the R2 from a regression using all n variables and the R2 using n − 1 variables, excluding the variable for which the R2 was calculated). Finally, scale is a significant predictor of residential satisfaction, explaining approximately 2 percent.
Linear Stepwise Regression for Predicting Residential Satisfaction (n = 354).
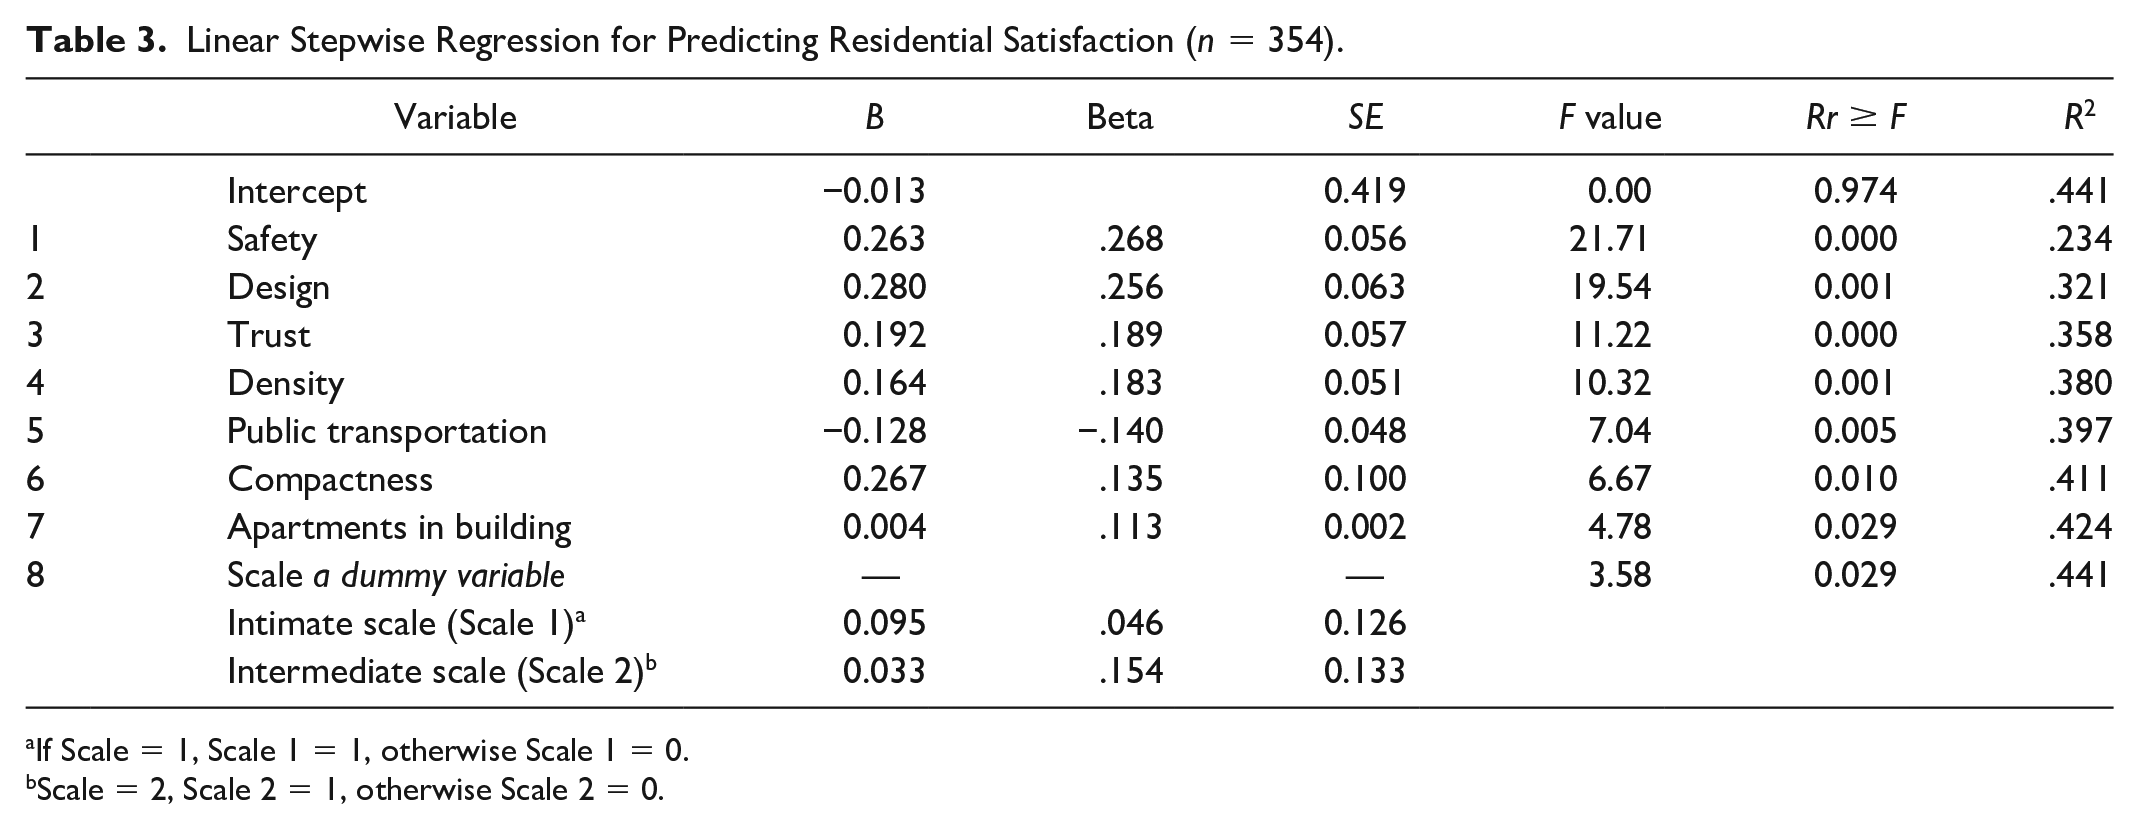
If Scale = 1, Scale 1 = 1, otherwise Scale 1 = 0.
Scale = 2, Scale 2 = 1, otherwise Scale 2 = 0.
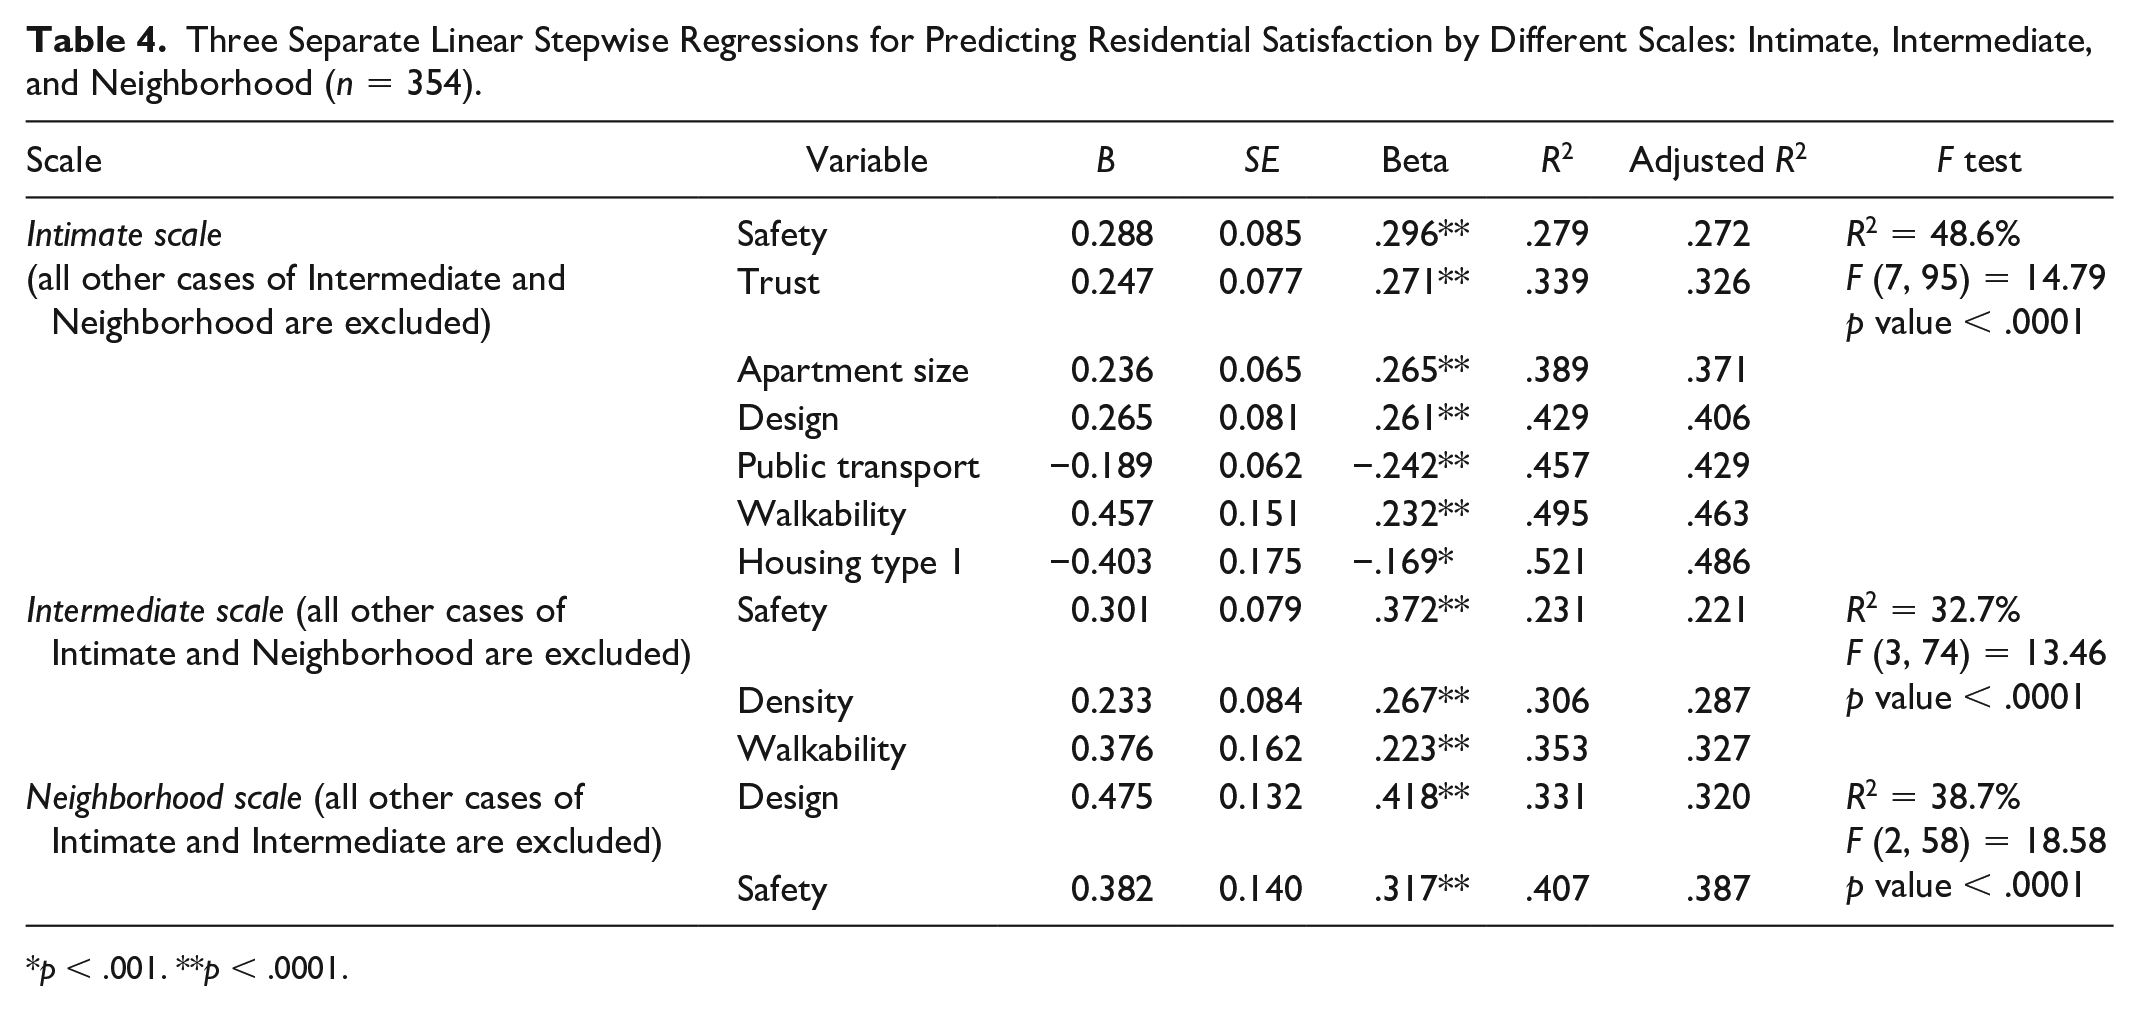
We conducted three separate stepwise multiple regressions for each scale alone. The analysis revealed different significant predictors for each scale, as Table 4 shows. On the intimate scale, seven significant predictors explained 48.6 percent of the variation. On the intermediate scale, three variables significantly predicted residential satisfaction—safety, density, and walkability. These variables together explained 32.7 percent of the residential satisfaction variation. On the neighborhood scale, the variables of design and safety were significant predictors, and they explained 38.7 percent of the residential satisfaction variation. Interestingly, only safety was a significant predictor on all the scales.
Three Separate Linear Stepwise Regressions for Predicting Residential Satisfaction by Different Scales: Intimate, Intermediate, and Neighborhood (n = 354).
p < .001. **p < .0001.
Discussion
Following previous spatial studies, which suggest that scale matters, this study shows that scale—the perceived scope of people’s residential environment—matters in residential satisfaction. This study supported four hypotheses on scale and residential satisfaction. It was found that the neighborhood is not the dominant scale that people consider when they define their residential area. Furthermore, perceived scale is associated with residential satisfaction, and different scales reveal different predictors of residential satisfaction.
The first hypothesis undermines the common assumption of the neighborhood scale as the dominant scale of reference, as most people do not consider the neighborhood to be the scale for defining their residential area. Some decades ago, Jane Jacobs (1961) suggested that people’s perceptions of the neighborhood have drastically changed. Furthermore, while the concept of the neighborhood is highly debated among both urban scholars and practitioners, this study shows another inconsistency regarding the common way in which researchers and practitioners conceive of the neighborhood compared to how the people perceive and define their residential area. In this context, we argue that the concept of the neighborhood is emerging as an empty grand signifier. At the same time, it appears that people are relating to smaller scales of reference (i.e., the intermediate and intimate scales) when defining their residential area. Consequently, these findings are crucial in light of the contemporary context in which planners still plan neighborhoods and in which many new neighborhoods are larger than ever before, both horizontally and vertically (Harris 2015), as densification is adopted as a planning principle in many national and local master plans, offering additional dimensions of scale to consider.
This study confirmed the hypotheses that residential satisfaction and scale are significantly associated. Furthermore, it confirmed that perceived scale is a significant predictor of residential satisfaction, and that different scales reveal different significant predictors of residential satisfaction. As a significant variable in the model, scale is an important component explaining 2 percent of the variation alongside the other physical and social predictors (e.g., design, safety, and trust). This indicates that perceived scale as an independent variable is correlated with residential satisfaction, providing a partial explanation to the variability in the overall model of residential satisfaction. Furthermore, perceived scale has also an important contribution as a valuable unit of analysis that unravels a new understanding of what comprises and constitutes residential satisfaction. As people perceive their living environment on different scales; therefore, their perception of different environmental attributes and their effects on the environment are also scale dependent (see Bronfenbrenner 1992; Gärling and Golledge 1989; Ittelson 1978 and others).
More specifically, our findings help in construing a more complex understanding of residential satisfaction. Studies of residential satisfaction usually analyze the entire sample, assuming that variations in the level of satisfaction and predictors refer to the neighborhood scale. Few studies compare the predictors of residential satisfaction with scale: instead, the studies still rely on pregiven scales, such as the census tract, rather than on perceived scales. Our multiple perceived-scale analysis yielded eight significant predictors of residential satisfaction. However, the contribution of each predictor to explaining the variation in residential satisfaction is different. Moreover, each scale has a different composition of predictors. For people who perceive their residential area as their neighborhood, residential satisfaction is explained mostly by design (responsible for 32% of the variation), an important but somewhat external indicator, and by safety, which explains only 6.7 percent of the variation. However, as we move toward scales smaller than the neighborhood, design becomes less important, explaining less than 3 percent of the variation on the intimate scale, and statistically insignificant on the intermediate scale. In contrast, safety explains the majority of the variations in residential satisfaction on the intermediate scale (22% of the 33% that the model explains) and intimate scales (27% of the 48.6% that the model explains). Residential satisfaction on the intimate scale is also explained by trust (5.4%), a perceptual variable of how trustworthy the people perceive their neighbors to be. Five more predictors on the intimate scale together explain 16 percent of the variation in residential satisfaction, each explaining approximately 2 to 3 percent of the variation. On the intermediate scale, density is the second predictor (after safety), explaining 5.6 percent of the variance, and walkability explains the remaining 4 percent of the variance. Interestingly, the dominant predictors of residential satisfaction on the smaller-than-the-neighborhood scales are more socially related perceptions of safety and, to some extent, perception of trust (only on the intimate scale). In contrast, on the neighborhood scale, the strongest predictor is the physically related perception of design.
Distinguishing between the socially related and physically related predictors, it is possible to suggest that since for most people (76%, see Table 1) the scale of reference is smaller than the neighborhood, socially related predictors, namely, safety and trust, are the most dominant in explaining the variance in residential satisfaction. Therefore, an important focus for city planning is to realize how the spatial attributes of the residential area may facilitate social experiences of the environment, most notably, sense of safety and trust among residents.
It has also been suggested that over time (i.e., length of residency), people’s identification with their surroundings narrows the scale (Proshansky, Fabian, and Kaminoff 1983). In that study, scale was used as an independent variable to explain the emotional attachment to one’s residential area. Our research suggests that poorer people, on one hand, and apartment owners (defined as people who live in relatively spacious buildings and homes with fewer apartments and fewer floors in the building), on the other hand, tend to define their residential area on the neighborhood scale. While our analysis does not explain why different people perceive their residential area on a different scale, our findings may be supported by studies that show the dependency of low-income residents on neighborhood-wide social networks and ties, on one hand (Ciorici and Dantzler 2019; Hur and Nasar 2014; Jansen 2014), and the effect of low density and dispersed urban fabric (usually accompanied by other planning principles, such as single land use and car-oriented design) on the sense of community, on the other hand (Hur, Nasar, and Chun 2010; Talen 1999). This finding may indicate lower levels of identification with the surrounding environment for these groups. However, further research is needed to explain the relations between the variables and the reasons why people with a smaller perceived scale, for instance, are more sensitive to issues of security and trust. More generally, further research is needed to examine how the perception of scale is constructed and developed and how it mediates various spatial perceptions. That is, research should posit scale as a dependent factor to understand variations in perceptions, and the research should use scale more correctly to investigate other urban phenomena.
Moreover, complementary research is needed to further understand the most important factors in urban life, namely, security, safety, trust, and design, and how these factors interact with the perception of scale and in general their role in shaping the urban experience (Jabareen, Eizenberg, and Hirsh 2019; Jabareen, Eizenberg, and Zilberman 2017; Jabareen and Carmon 2010). Such an understanding can help direct planning and policy by emphasizing different efforts on different scales. Therefore, a multiscalar approach to quantitative measures of urban phenomena should be further developed to incorporate not only multiple general scales but also indicators of the perceived scales. In this way, the complexity achieved by this approach (Fowler 2016) would be enhanced by an additional significant layer that underlies all sociospatial phenomena.
Conclusions
This research challenges the dominant use of the neighborhood scale in planning research and practice by introducing multiple scales—intimate, intermediate, and neighborhood—as these are perceived by residents rather than plans, practitioners, or dividing factors (e.g., poverty areas). Moreover, these perceived scales were integrated into the analysis of residential satisfaction. Research has used the terms “neighborhood satisfaction,” “residential satisfaction,” and “housing satisfaction” interchangeably or has distinguished between the components that structure each of these. However, we argue that the important distinction is that neighborhood satisfaction is a scale-blind urban concept and that residential satisfaction may (and should) be calibrated by general scales as well as by perceived scales.
The lack of attention to scale in general and to perceived scale in particular may lead to misconceptions about urban phenomena and emerging changes in contemporary cities. Attention to scale is becoming increasingly more pertinent since contemporary urban planning is shifting toward larger scale urban development and redevelopment (Gualini and Majoor 2007; Swyngedouw, Moulaert, and Rodriguez 2002), which is larger than the actual scale on which people perceive their residential areas. Thus, the gap between the scale used in planning practice and the scale of experience is doomed to grow.
Building on Jacobs and Malpas’s (2013, 283) assertion that “for most people, inhabitation involves a relation to certain fixed spaces and—the home, whatever its particular form, continues to be an important focus for the articulation of human life and feeling,” we emphasize the importance of inquiring into the urban phenomenon more closely and from the perspective of people’s everyday life experience rather than from the conceptual or practical frames and patterns of theoreticians and professionals. Thus, we suggest that the scale that people perceive should be an additional but crucial analytical element in planning research and practice. The answer to the question where people would like to reside and what makes for a good place, which thinkers and practitioners from various fields are concerned with, also lies on the smaller-than-the-neighborhood scale.
Takeaway Messages for Planners
Scale matters for understanding urban and planning issues in general and residential satisfaction in particular.
The domination of census tracts and neighborhoods as units of analysis and planning stems from indisputable practical reasons: relatively consistent data collection and data availability and an easily replicable framework. However, these formal and efficient units often disavow differentiations and variances among residents as well as connections and overlaps of actual spaces.
Planning education and planning practice should grapple with and rescale planners’ attention to smaller-than-the-neighborhood scale, especially when aggregating, describing, and analyzing information derived from residents.
The intimate perceived scale is proposed here as a planning strategy that fosters a more nuanced understanding of the social, spatial, environmental, and economic problems and potentials of a residential setting. The perceived intimate scale is specifically important for neighborhood regeneration projects and place-making efforts. These are commonly performed on a smaller-than-the-neighborhood scale and could benefit tremendously from understanding the different sociospatial fabrics of a neighborhood, which are often not confined to the boundaries of the neighborhood or other technically acceptable units. The dominant perceived scale of an area, we argue, should serve as the initial frame of reference for planning research and practice. Available data on different general scales, for example, blocks, aggregated blocks, and census tracts, should inform planning on this perceived scale.
Limitation of the Study
Since this article is based on a single case study, it has limitations in terms of generalization and should be supported by further research on other cities. Nevertheless, this case study was chosen with a structured selection process to be suitable for generalization (Elman, Gerring, and Mahoney 2016). Mainly, the study was selected to represent a modern city characterized by a neighborhood-oriented planning approach (i.e., neighborhood units of approximately 5,000 residents). It will be very interesting to examine the relations between the perceived scale with its dominant predictors in other cities of different culture but with a relatively safe and secured everyday life (i.e., low crime levels, nonsegregated neighborhood etc.) like Beer Sheva.
Footnotes
Declaration of Conflicting Interests
The author(s) declared no potential conflicts of interest with respect to the research, authorship, and/or publication of this article.
Funding
The author(s) disclosed receipt of the following financial support for the research, authorship, and/or publication of this article: This research is supported by the Israel Science Foundation, Grant no# 2204/19.