
Abstract
This paper proposes non-linear asymmetric gap–satisfaction models to assess the influence of the gap between aspirations and perceived residential attributes on residential satisfaction. Two variants of the residential gap are specified based on the difference and ratio between aspiration and reality. Besides the influence of residential gap, the interactions with social-demographics are incorporated in three specifications of gap–satisfaction relationship. Using empirical data collected from eight renovated historical blocks in two Chinese cities, the relative performances of the proposed gap models are compared with truncated linear symmetric gap models and traditional linear (absolute) difference models for housing, living environmental and neighbourhood attributes. The estimation results indicate that overall the non-linear asymmetric gap models outperform the linear gap models. The model fit for housing and living environmental attributes are very good. Satisfaction for housing attributes is predicted best with non-linear asymmetric gap ratio models, while the environmental attributes are best represented by non-linear asymmetric difference models. In case of the neighbourhood dimension, non-linear asymmetric gap ratio models show the best performance, while these models yield a good fit only for two attributes. The interaction effect of social-demographics is found to vary between residential attributes.
Introduction
Gap theory has played a pertinent role in the study of residential satisfaction. According to this theory, residential satisfaction is a function of the gap between perceived (or experienced) and aspired situation. Higher residential satisfaction is assumed associated with a smaller gap (Galster, 1987). Over the years, various similar concepts with different operationalisations have been proposed and used. They share the notion that residential gap is defined as a function of the discrepancy between aspiration and reality. While gap theory has been mainly used to analyse residential satisfaction (e.g. Tang, 2012), other similar concepts have been found in applications of both residential satisfaction and residential mobility. For instance, stress (the gap between accumulated needs and current needs) has been found to significantly influence the probability of moving house (Phipps and Carter, 1984). The larger stress, the more likely an individual moves. Discrepancy, mismatch, disequilibrium and housing deficit are other similar or related concepts. Although these concepts are similar and in principle can be used interchangeably, considering that readers may associate stress with a psychological disposition, the term ‘gap’ is preferred and used in this paper.
Although gap or stress theory have been discussed widely, some of these studies lack the measurement of aspirations and/or the perceived environment and as such cannot be viewed as studies that truly operationalised the concept of residential gap. Some researchers tried to include the notion of stress by making operational decisions regarding the objective variables (Clark and Coulter, 2015; Coulter, 2013; Coulter et al., 2012; Lu, 1999). For example, Clark (1992) developed an index of room stress by making assumptions as opposed to measuring the needs or aspirations of households. Particularly, the stress is calculated in terms of the number of actual rooms divided by the number of required rooms assigned to family members.
In most studies that measure aspirations, gap has typically been operationalised as the difference between aspiration and experience (Brummell, 1979; Phipps, 1989; Tang, 2012). Moreover, a linear relationship between gap and satisfaction is often assumed, which implies that the marginal effect of a positive discrepancy between aspiration and experience is the same as the effect of an equivalent negative discrepancy. However, such linear operationalisations may be very inadequate in explaining the relationship between satisfaction and gap. Pointing at the principle of diminishing marginal utility, Galster (1987) argued that the marginal effect of a gap on residential satisfaction is monotonically decreasing with a decreasing gap. It means that the assumption of a linear relationship between residential satisfaction and gap would not be the best specification. In addition, some studies assumed symmetry around the point of a zero gap. However, asymmetry around the point of a zero gap may be more realistic considering that the marginal effects on satisfaction are likely to vary for situations that aspiration is lower and higher than reality.
Thus, in this paper, we formally introduce a framework for operational decisions of residential gap theory, and discuss some alternative options. We systematically compare the empirical performance of the alternative specifications with existing gap models, using the data of residential satisfaction, collected from eight historical blocks in two Chinese cities. Considering that social-demographic attributes may influence residential satisfaction, their interaction with residential gap is incorporated in the model specifications. The main contribution of this study to the literature on residential satisfaction, therefore, is to provide a more proper representation of the relationship between residential gap and satisfaction.
The remainder of this paper is structured as follows: first, the general model formulation underlying the relationships between aspiration, reality, gap and residential satisfaction in the existing literature will be summarised. Second, the relevant literature about gap models, gap theory and other similar concepts will be further discussed. After the discussion of the linear symmetric gap ratio models, the proposed models will be presented. Then, the data collection and sampling approach will be explained, followed by the interpretation of results and analyses. Finally, the paper will be concluded in combination with some discussions.
Problem statement
Consider a residential environment j, which in this study is assumed to consist of a house, the physical neighbourhood environment and neighbourhood bonding. The current environment can be characterised in terms of a bundle of attributes
Let

Assume individuals derive a certain degree of satisfaction for each attribute k, in environment j, denoted as

Taking equation (1) into equation (2), we have

Thus, this formulation of satisfaction as a function of the gap between aspirations and experienced reality requires two operational decisions: the concept of gap as reflected in
Literature review
The conceptual framework introduced in the previous section sets the stage to position previous research. Particularly, the two functions
Besides the formulation using difference, the ratio between reality and aspiration has also been used to represent the gap concept. The studies using ratio formulations often do not represent the ratio of the perceived physical and aspired physical attributes of the same house and/or neighbourhood. For instance, Campbell et al. (1976) used ratios to measure the gap between aspiration and reality, in which reality was measured regarding the current house and neighbourhood while aspiration was measured regarding other aspired houses and neighbourhoods.
Reality in previous literature has been measured as objective or subjective. Most studies have used subjective measurement, which means reality regarding all residential attributes is based on residents' interpretation (perception) of their living environment rather than the physical measurements.
As for the second operational decision, function
However, the linear shape of the dominant satisfaction model has not escaped criticism. Galster (1987) stated that the relationship between satisfaction and aspiration should be curvilinear. He argued for a non-linear model because satisfaction is bounded by a certain maximum level but not by a minimum level. A reality far away from aspiration may result in a very low satisfaction, while reality approximating aspiration will lead to a stable maximum satisfaction. Furthermore, and in our opinion more convincing, he pointed at the law of diminishing marginal utility, and argued that increments in residential satisfaction become increasingly smaller as the gap decreases. Once satisfaction exceeds a certain point, the satisfaction will remain stable and not continue to increase. Therefore, it is reasonable that a non-linear function may be more convincible to capture the relationship. Unfortunately, studies using non-linear functions to analyse the impact of gap on residential satisfaction are very limited (e.g. Galster, 1987).
This non-linear relationship is assumed in studies of residential mobility in which a logistic function was used to analyse choice probabilities (e.g. Hanushek and Quigley, 1978; Phipps, 1984, 1989; Coulter, 2013; Coulter et al., 2012). The gap function itself was linear and the non-linearity stems from the logistic mapping of satisfaction into choice probabilities.
Jiang et al. (2017) suggested a linear ratio gap–satisfaction model. Residential gap is represented in terms of the following equation

The equation indicates that when perceived reality (
Similar to the majority of studies on residential satisfaction, the relationship between gap and residential satisfaction was assumed to be linear as follows

Although this model has some interesting features, the assumption of the constant marginal effects of deviations from the aspiration level on satisfaction may not be valid. Generally, the perceived reality which is higher or lower than aspiration may lead to different marginal changes in residential satisfaction. Therefore, the linear nature of the gap-satisfaction model is potentially rigorous and needs flexibility, although this limitation applies to all linear specifications of
Second, the relationship between gap and satisfaction is assumed to be symmetric. Therefore, increment in satisfaction is invariant for the same deviations from aspirations because the same positive and negative difference results in the same change of satisfaction. This may be a strong assumption because residents could have different sensitivities to outperformance and to underperformance of aspiration.
Third, the truncation may not be an elegant way to deal with extreme cases. The index becomes truncated when reality exceeds two times the aspiration. Potentially, respondents may indicate a high difference between aspiration and perceived reality. In that case, the index will become smaller than zero, losing its property of being an index, so the value was truncated at zero. However, although this situation may happen in a few cases particularly with attributes having a high range, as the difference between aspiration and reality increases, residential satisfaction may continue to decrease or slowly approach stable rather than suddenly become stable from a certain point as assumed in this linear gap ratio model. The specification of a continuous shape for the gap–satisfaction model without truncation requires more exploration.
For the gap–satisfaction relationship (
Model formulation
Considering that individuals may not necessarily have full and perfect information about the environment, in this study, reality is measured as the perceived reality. We consider two specifications of

The second operational decision concerns the specification of relative difference. Gap is defined as the ratio of the difference between aspiration (
This specification assumes that the same difference between aspiration and perceived reality has a smaller effect if aspiration is high.
Three specifications of
To model these three patterns specifically, in this paper, we consider three specifications of the gap–satisfaction relationship, including exponential, inverse exponential and logistic formulations. The difference between these formulations is related to the sensitivity to the change of gap. The exponential formulation reflects three requirements. Firstly, we assume that the marginal satisfaction is a monotonically increasing function with the decrease of gap until the optimal point. Secondly, the satisfaction should asymptotically approximate the minimum of the satisfaction scale with increasing residential gap when reality is substantially different from aspiration. Thirdly, by capturing the connotation that the marginal decrease in satisfaction when the perceived reality outperforms aspiration may not be same as that when the perceived reality underperforms aspiration by the same amount, the functional relationship should be asymmetric. Thus, the following exponential functional form is suggested

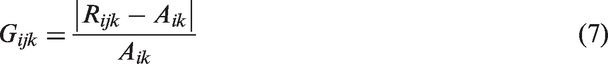
Here, the absolute difference between two parameters,
Figure 1 represents the relationships between residential satisfaction and gap based on difference and ratio measurements for all the three specifications. For the first specification, it can be seen that, for both measurements, when α equals 0.5, satisfaction increases or decreases at the same amount no matter aspiration is higher or lower than reality. When α is between 0 and 0.5, the increment in satisfaction is higher for the situation that aspiration exceeds reality. In contrast, when α is higher than 0.5, the increment is smaller. In extreme cases where α equals 0 or 1, satisfaction becomes constant for the situation that aspiration is lower than reality or reality is lower than aspiration, respectively.
Difference and ratio forms of three gap-satisfaction models while fixing certain parameters.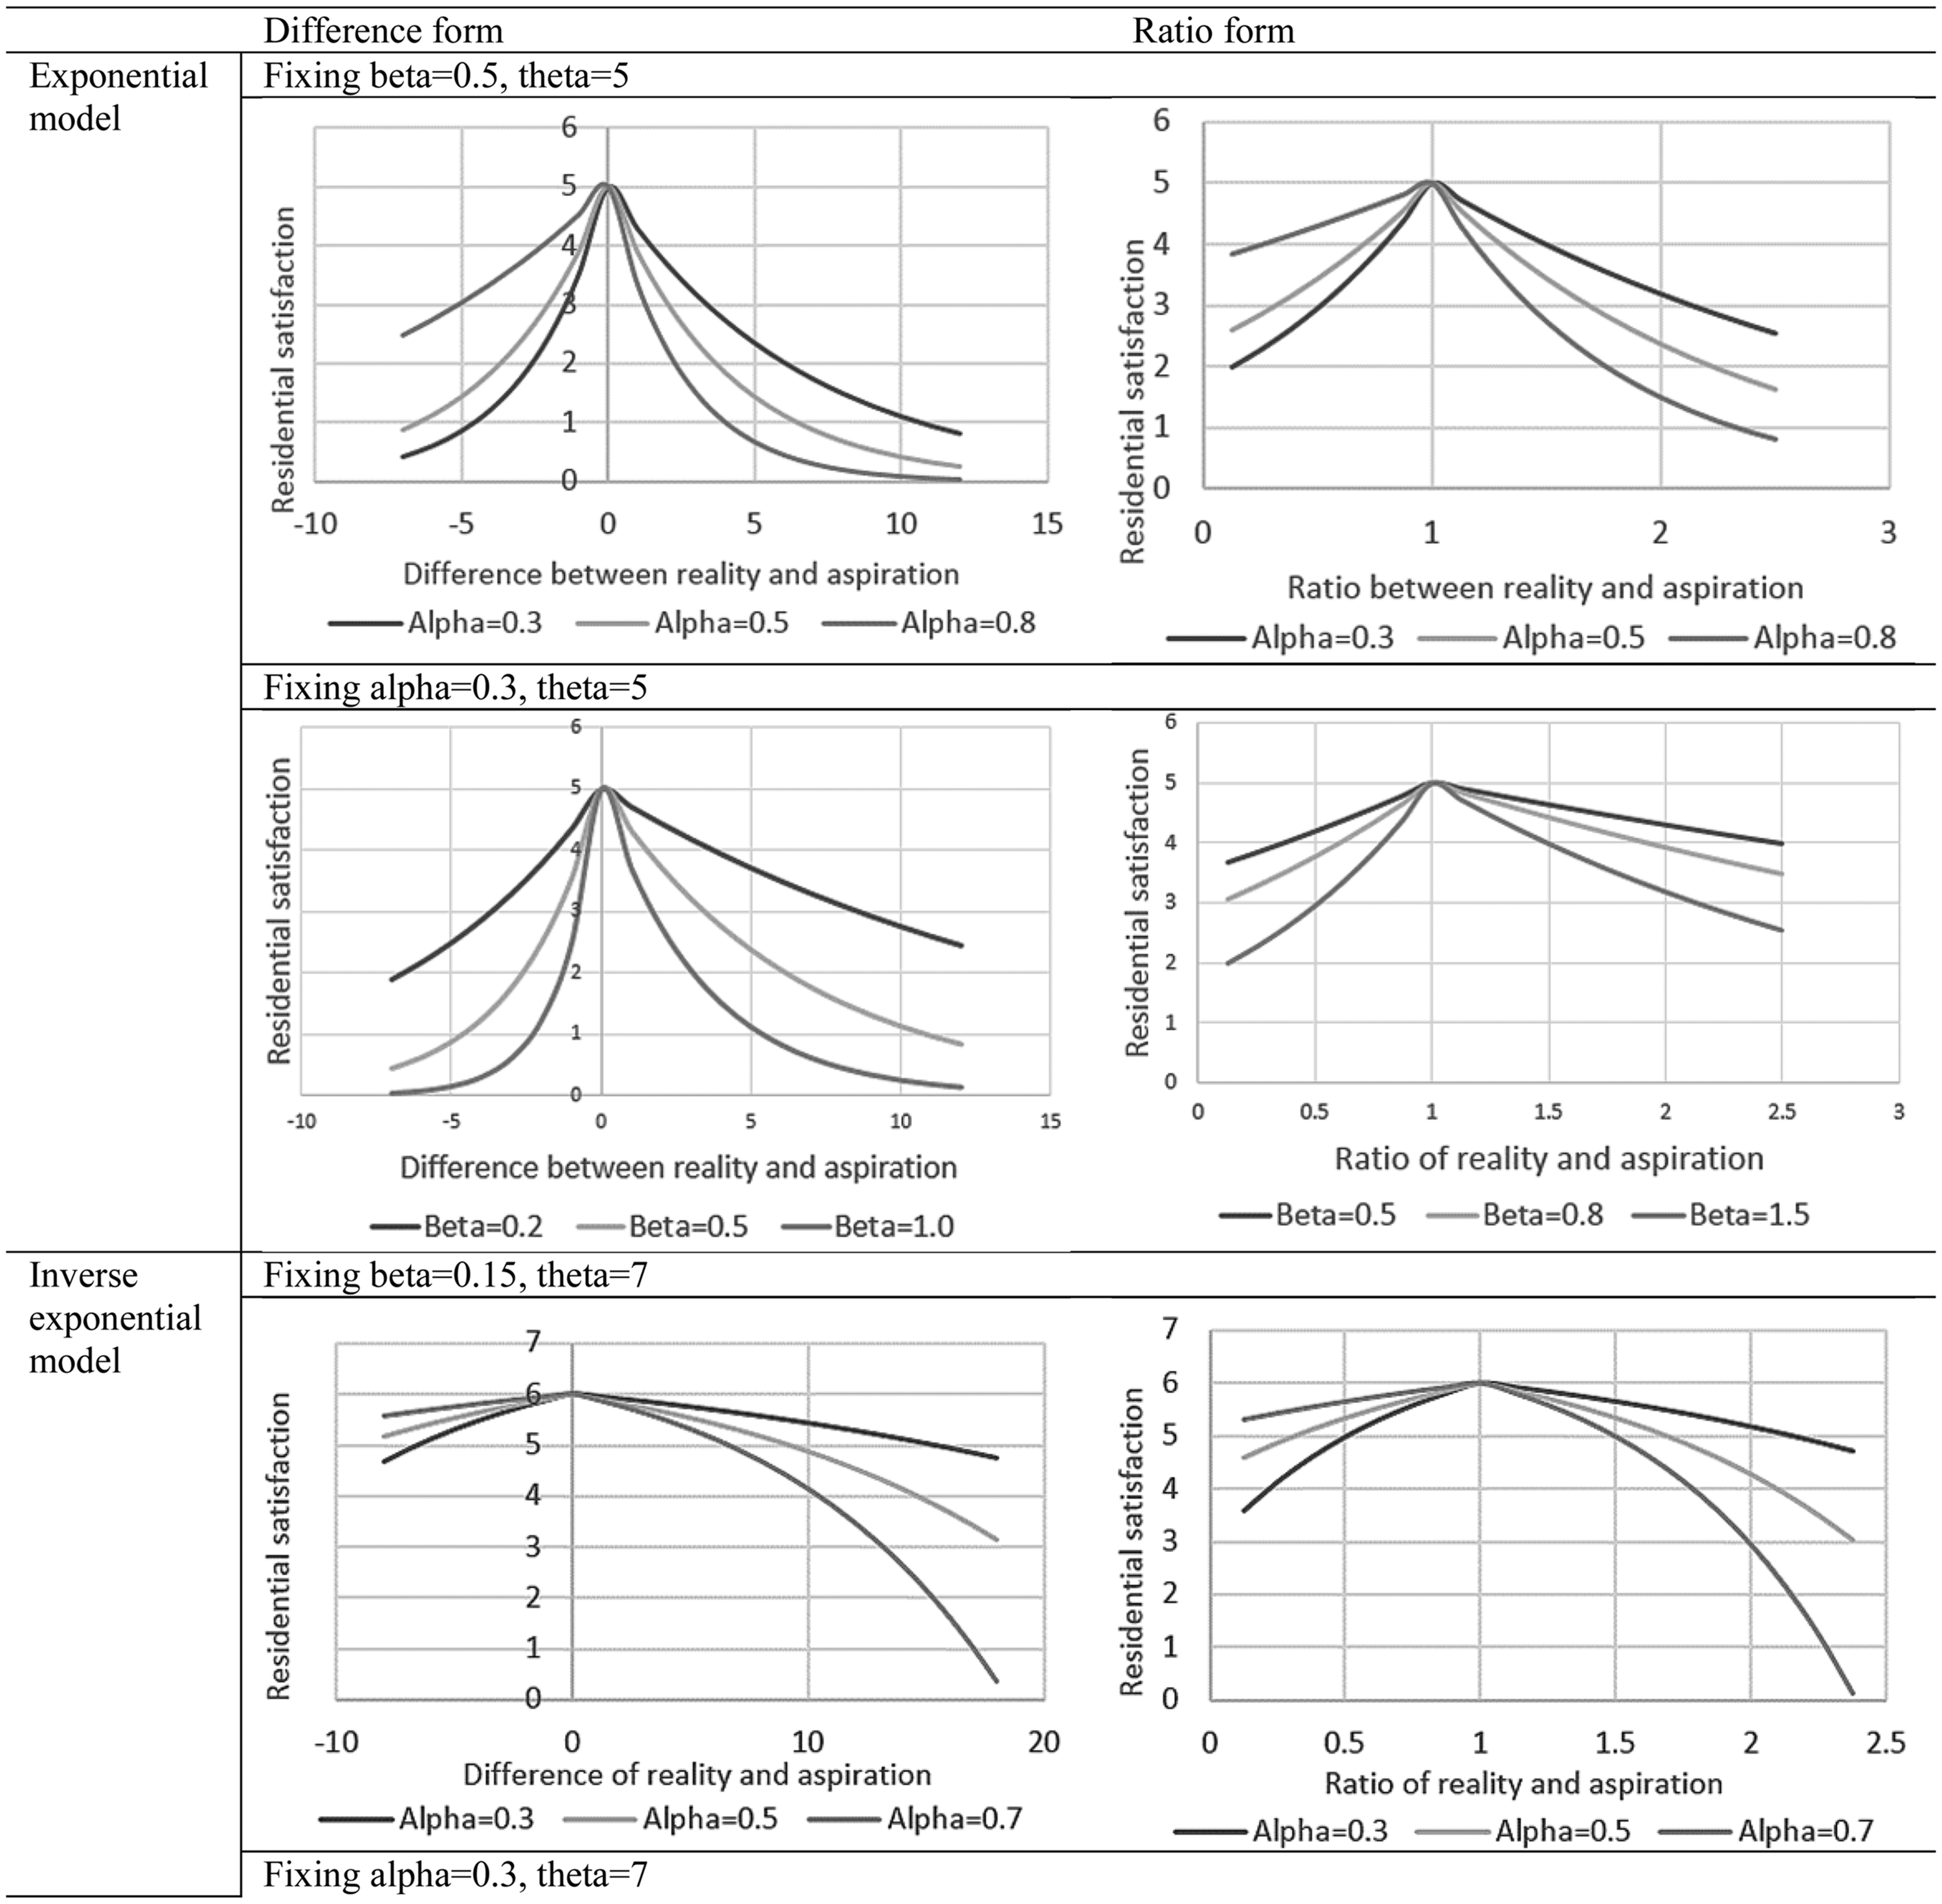
Residential satisfaction (
θ defines the maximum satisfaction which occurs when the gap is zero. In the case that
The second specification of

Other parameters in the second specification have similar characteristics to the parameters in the first specification (Figure 1).
The third specification of

The logistic function assumes that the marginal effect of the satisfaction decreases with the decreasing gap until the optimal point. Then, beyond the inflection point of the curve, the marginal effect again becomes increasingly smaller and ultimately approximates zero as the gap increases (Figure 1).
Besides the common parameters, the logistic specification uses parameter γ to define the scale of the function for both the difference and ratio measurements (Figure 1). When γ increases, the shape of the function becomes wider, which means that for the same amount of change in the gap index approaching the optimal point, the unit increment in satisfaction decreases and individuals become less sensitive about the change in the gap around the optimal point.
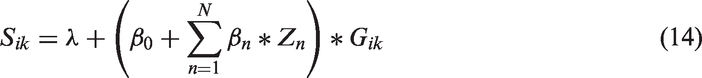
To incorporate the interaction effects of social-demographic attributes and residential gap, the β can be made a linear function of social-demographics. Thus, equations (8) to (10) become


For the purpose of comparison, the β in equation (5) is replaced with a linear form of social-demographic variables, so equation (5) becomes
Data collection
Study area
To compare the performance of the different models, data collected from eight renovated historical blocks in Chongqing and Shanghai, China were used. Chongqing is located in the western part of China, while Shanghai is located in the eastern part. Both cities are representative of first-tier Chinese cities, i.e. mega-cities exhibiting strong political and economic influence on other Chinese cities. Both cities have a yearly GDP over 1000 billion and a high GDP growth of more than 7% per year. Both cities have a long history with many remaining historical areas. Considering the ratio of existing historical areas in each city, eight historical blocks, three from Chongqing and five from Shanghai, were randomly selected for the data collection.
Selected residential attributes
The attributes influencing residential satisfaction were classified into three dimensions: house, living environment and neighbourhood. Housing attributes and attributes of neighbourhoods have been found most influential in the formation of residential satisfaction (e.g. Addo, 2016; Azimi and Esmaeilzadeh, 2017; He and Yang, 2011; Grigolon et al., 2014). The environmental dimension combines different aspects of relative location or accessibility and the provision of services in the neighbourhood. All questions related to frequency, except for the attribute of meeting neighbours, is measured on an annual basis.
Measurement scale
For each attribute, respondents were asked to indicate their perception, aspiration and satisfaction. The perception is considered as a measurement of perceived reality (
Sampling
The data were collected between April and June in 2015. A spatially stratified random sampling method was used to select the respondents. Fifty respondents were randomly selected from each historical block. A total of 400 questionnaires were distributed, and finally 384 valid questionnaires were completed with the help of local authorities, which implies a response rate of 96%. Considering that residents living in these blocks have relatively low levels of education and a higher age, the survey was conducted on a face-to-face basis. A team of trained interviewers introduced the general purpose of the survey, asked the questions, provided further explanation if needed and then recorded the answers.
Sample characteristics
The descriptive statistics of the data are as follows: the percentage of female respondents is slightly higher than male (48.7%). Seven per cent of the respondents are younger than 30, while 49.2% of the respondents are between 30 and 60. Respondents older than 60 account for 43.8%, which reflects that the relatively old people live in the historical blocks; 12.2% of the residents live alone while 87.8% lives with other relatives. Majority of the respondents (79.7%) have a high school education degree or a lower one; 69.8% of the respondents have lived there for more than 20 years and 89.1% of them have the hukou (Note: Chinese household registration system) (Dang et al., 2017) of the city where they live. Thus, most residents indicate that they have a good neighbourhood bonding. Some (56.8%) of the families rent a house, while the others own houses or share the property rights with government. Most of the households' income (52.4%) is lower than 5000 Yuan per month (around 714 Euros), while the households with an income over 20,000 Yuan (around 2857 Euros) represent only 2.9%. Considering gender, age, household income and tenure are generally identified as significant attributes influencing residential satisfaction, they are included in this analysis. Among them, gender, household income and tenure are effect coded as binary variables. Household income consists of monthly income which is higher than 5000 Yuan or not. Tenure consists of renting a house or not. Based on the existing residential literature (e.g. Huang et al., 2014; Li, 2003; Wang and Wang, 2016), age is divided into three categories: younger than 30, between 30 and 59 and older than 60.
Results
As discussed before, the difference and ratio forms of the exponential, inverse exponential and logistic gap models will be compared to examine their different performance. In particular, non-linear, asymmetric and non-truncated features are comparatively examined between the previous gap–satisfaction models and all the models proposed in this paper considering social-demographics. Here, the previous gap–satisfaction models include the linear gap ratio model (equations (4) and (14)) and the traditional linear gap difference model that consists of linear difference and linear absolute difference models from the literature.
Results of R-squared and adjusted R-squared after adding the social-demographics.
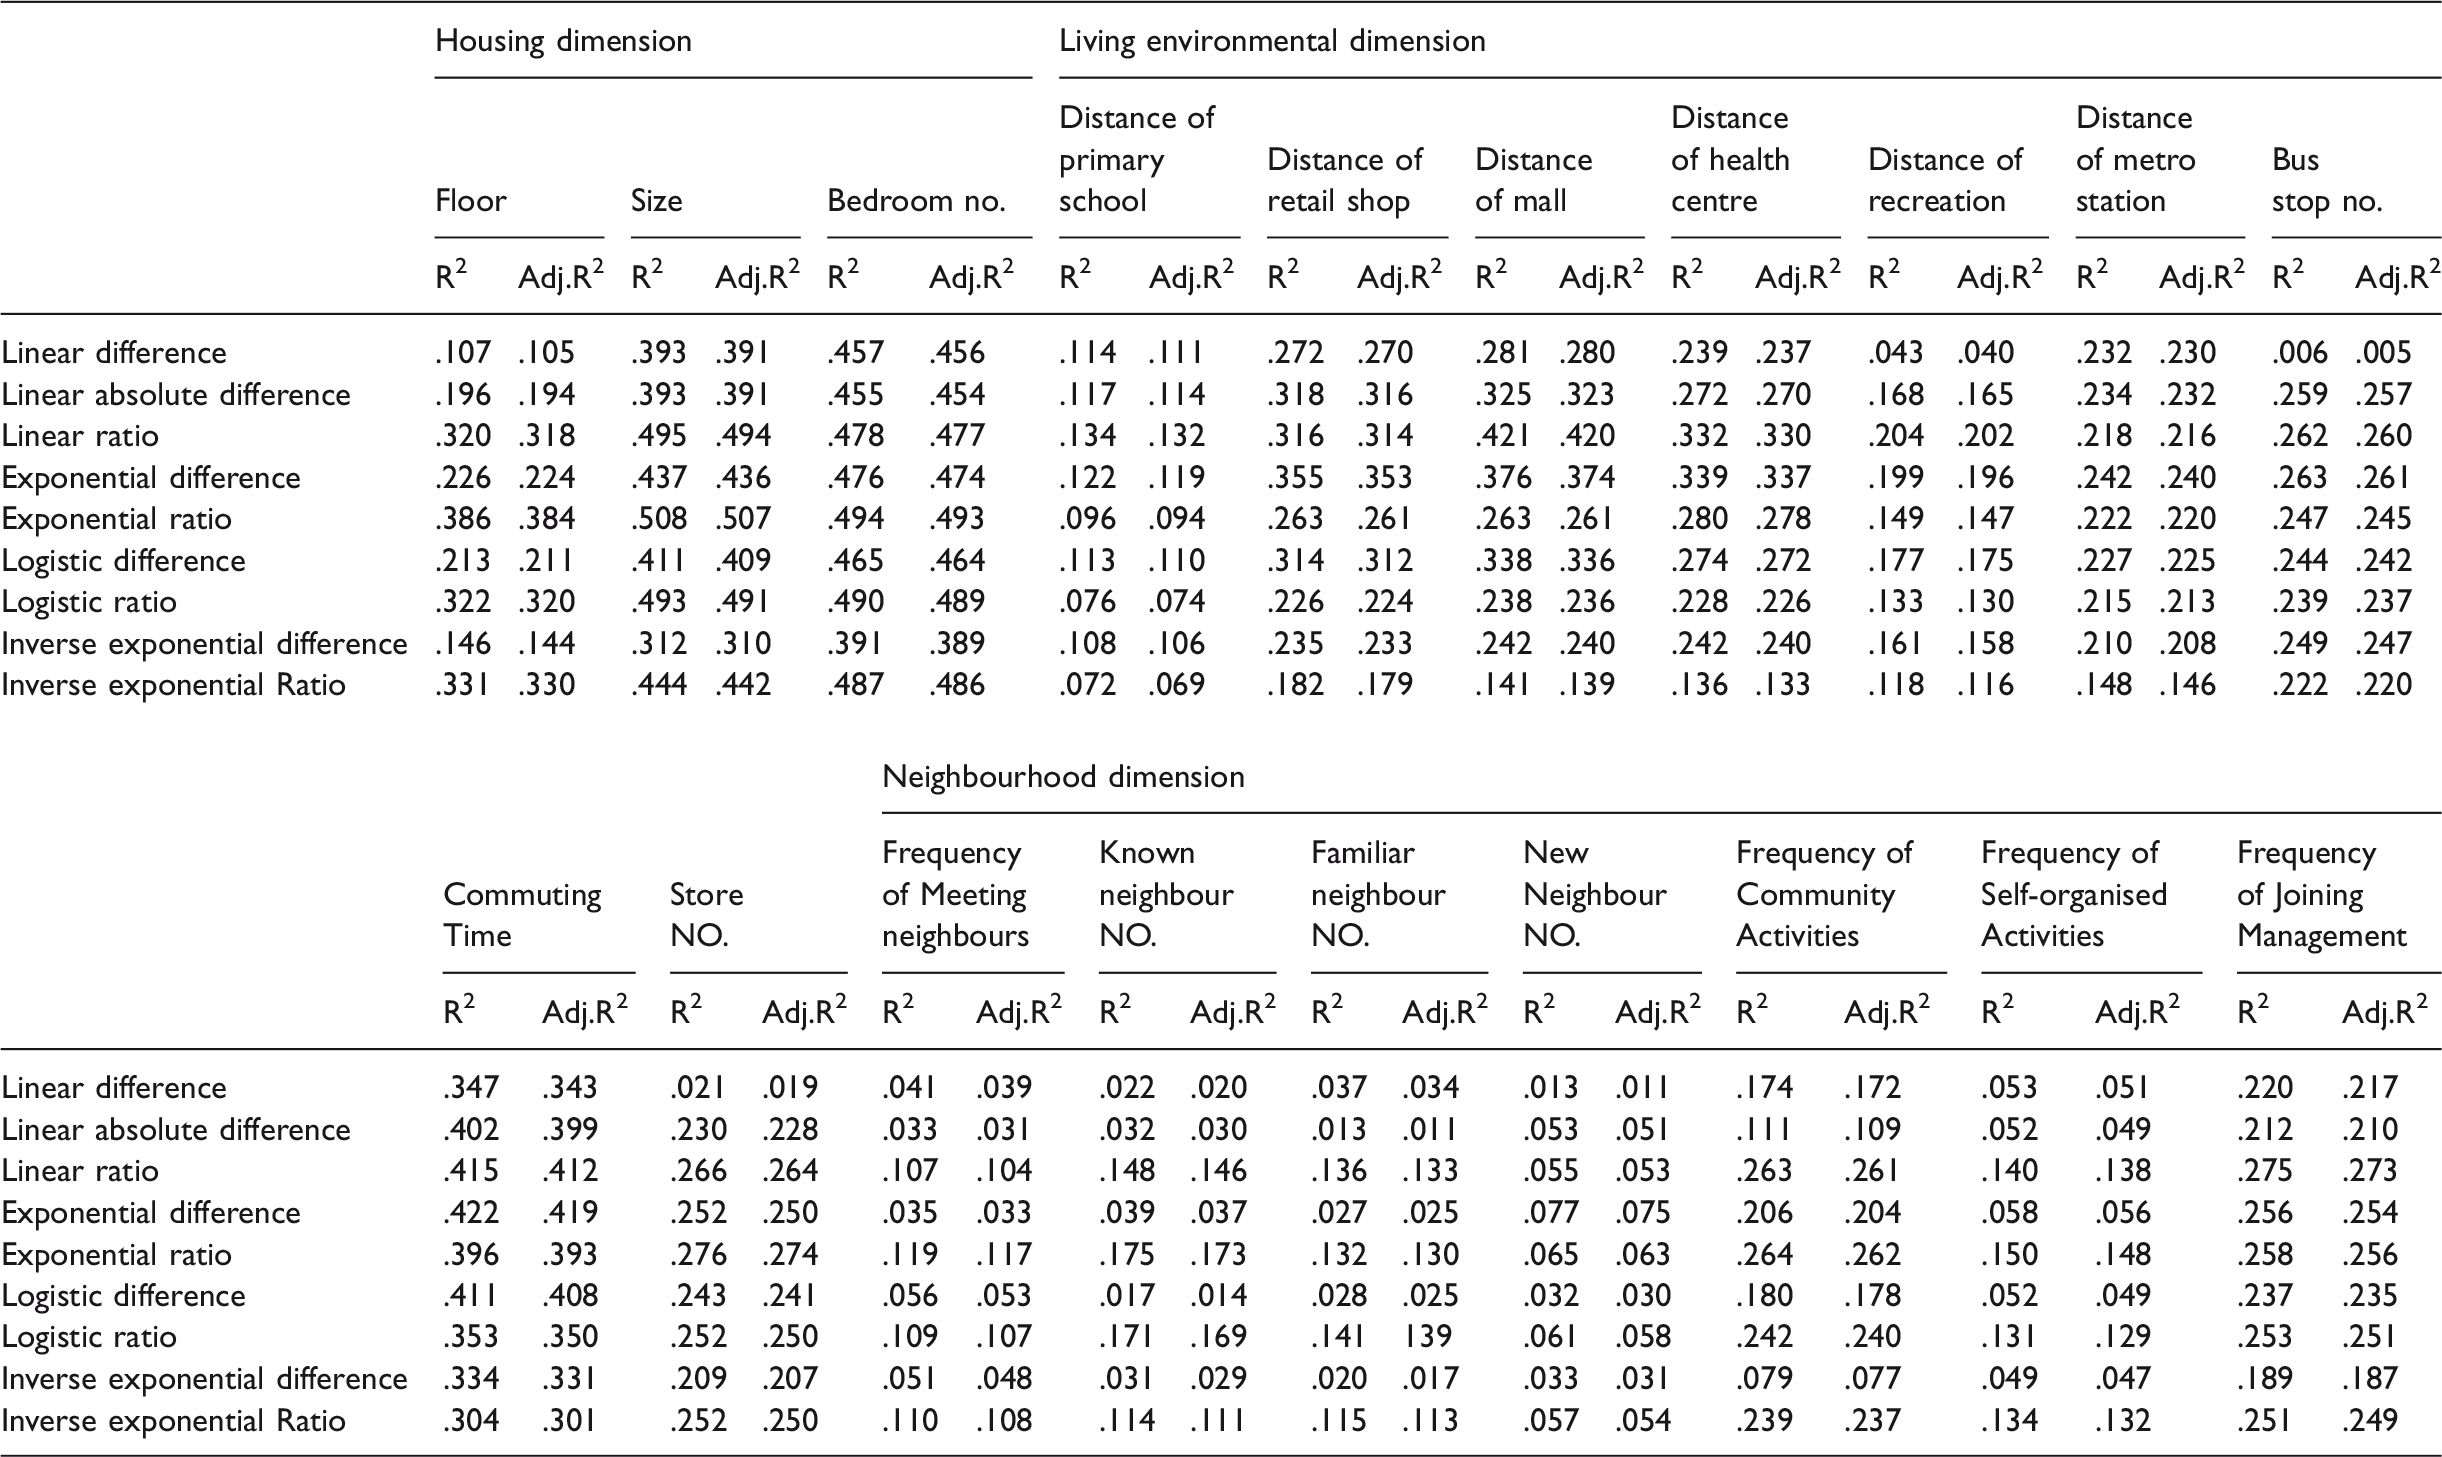
For the living environmental dimension, except for the model of distance to primary school, all models achieve a reasonable fit (R2>0.240). The exponential difference gap model has the best performance for most attributes except for the number of stores where the best performance is observed from the exponential ratio model. Only the models of distance to primary school, distance to shopping mall and distance to recreational facilities achieve their best fit with the linear ratio gap model, although the model fit for the first model is relatively low. These results indicate that, for most environmental attributes, the relationship between residential satisfaction and gap is non-linear and asymmetric and residents in historical blocks are sensitive about the change in gap when reality is close to aspiration for environmental attributes.
The goodness-of-fit for most models in the neighbourhood dimension is less than 0.2. Only the models for attributes, frequency of community activities and frequency of joining community management, have a reasonable model fit (R2 > 0.256) and they are best described with the non-linear asymmetric exponential ratio model. The satisfaction with the number of familiar neighbours associated with the neighbourhood dimension is best predicted by the logistic gap ratio model, which indicates that residents are less sensitive to changes in gap around the reference point for the neighbourhood attribute.
The coefficients of the best model for each attribute and relevant graph are summarised in Figure 2. The estimated parameters of Results of parameters and graphs after adding social-demographics.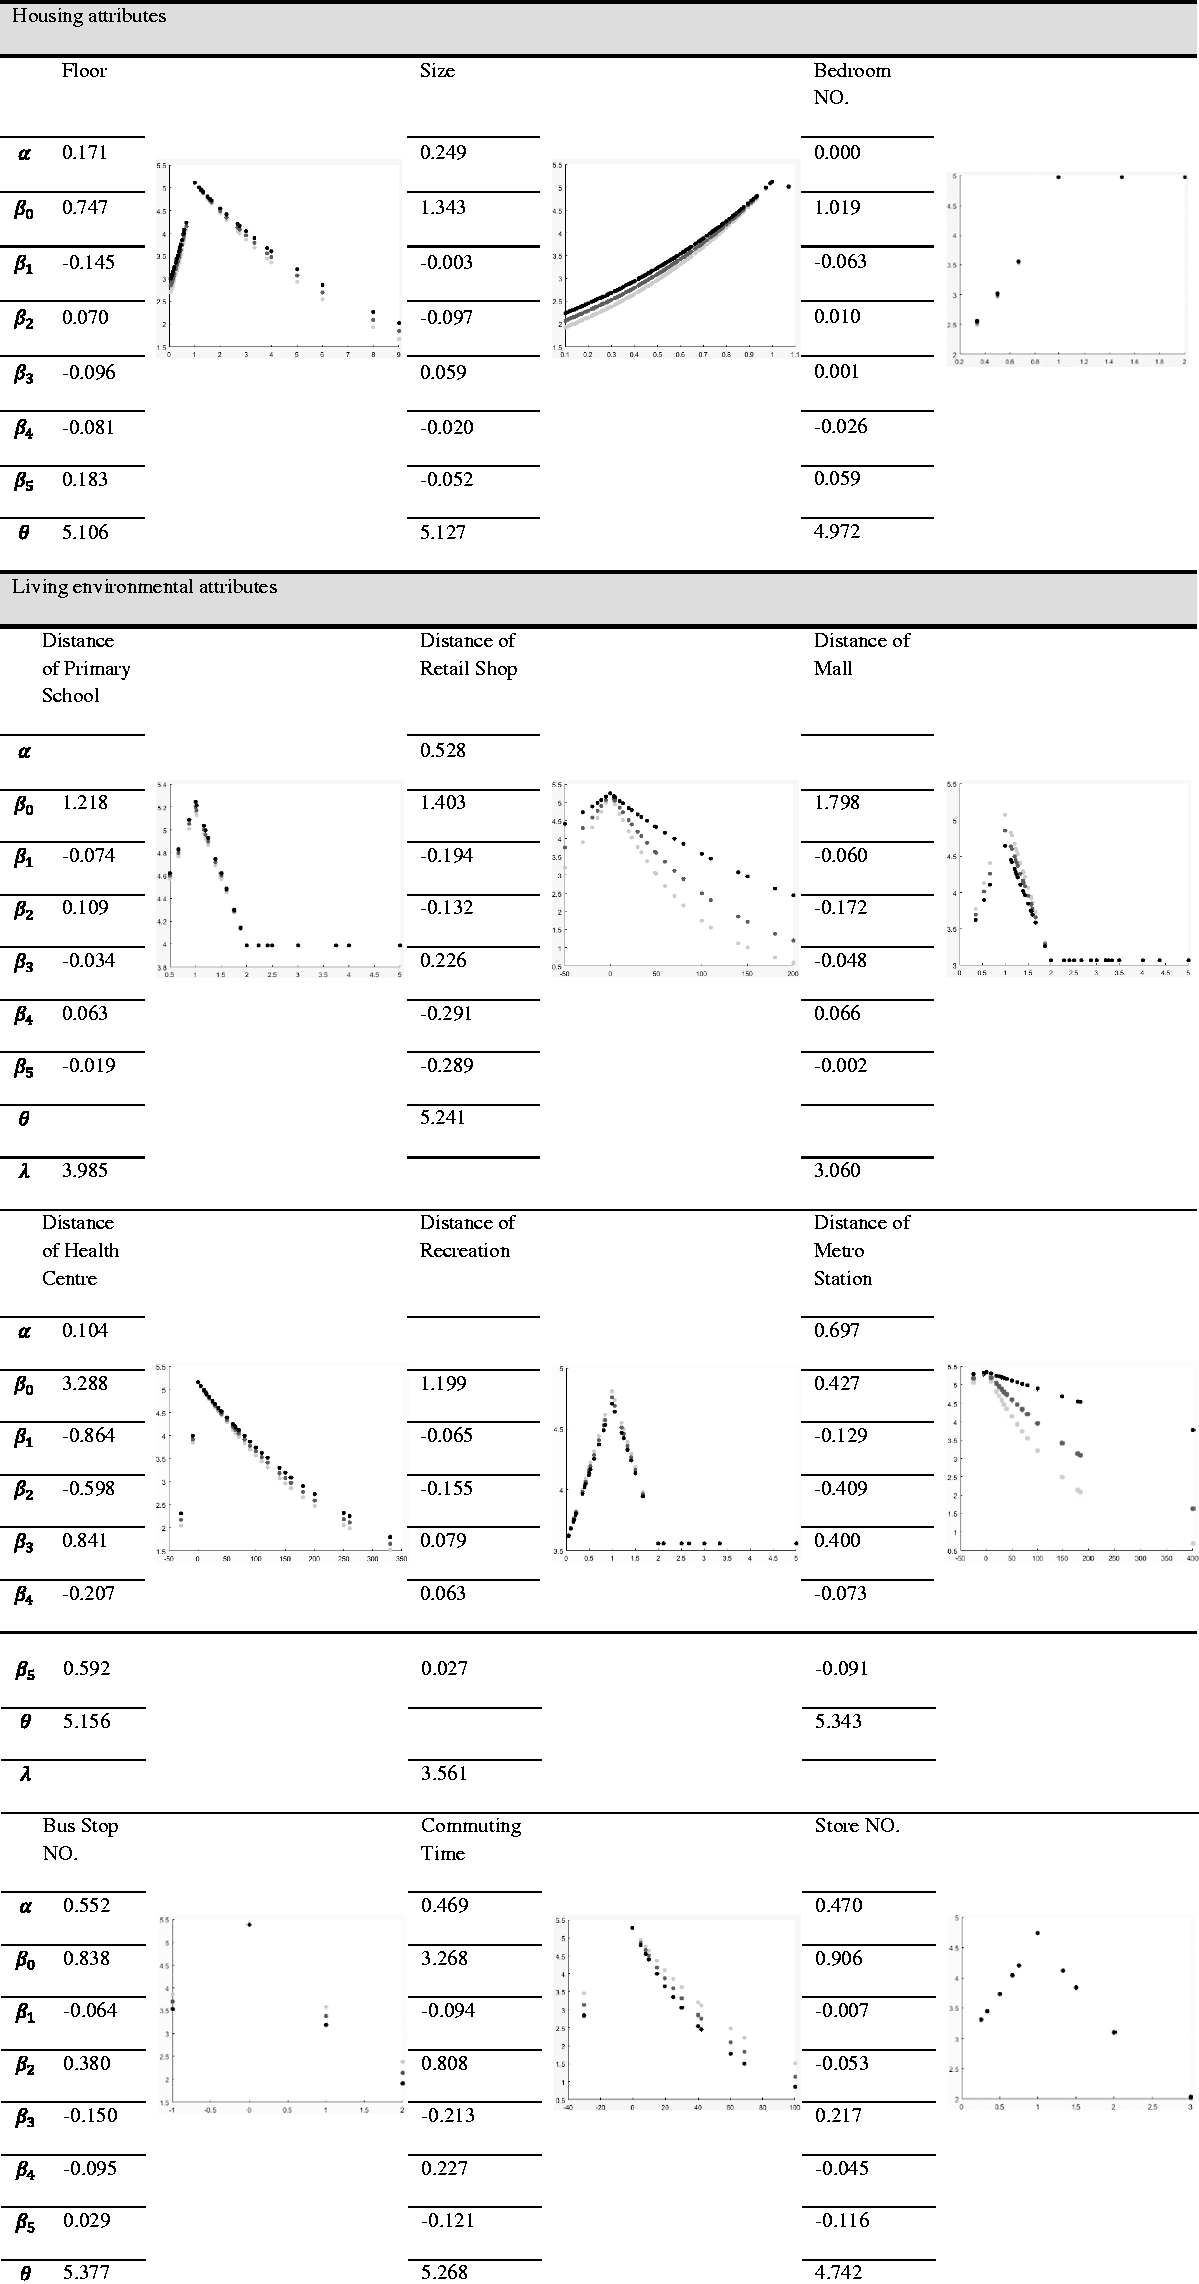
For housing attributes, different attributes indicate different combinations of parameters. Specifically, an alpha lower than 0.5 for the located floor of the house indicates a faster increase in residential satisfaction for the same amount of change in gap when reality is lower than aspiration. It means that residents are less sensitive to underperformance than outperformance of aspiration, which confirms our assumption. The attribute ‘size of the house’ also has an alpha lower than 0.5. But compared with other attributes, the graph of this attribute mainly contains the situation that reality is lower than aspiration. The attribute ‘number of bedrooms’ has an alpha equals to zero. The estimated maximum satisfaction for all housing attributes is around 5.
As for environmental attributes, the attributes ‘distance to retail shops’, ‘distance to metro station’ and ‘number of bus stops within 1000 metres’ are the environmental attributes with an alpha higher than 0.5, which means that the change in satisfaction is larger when the perceived distance is longer than the aspiration compared to the situation that the perceived distance is shorter than the aspired distance. The graph shows residents’ satisfaction might remain constant from the situation that reality exceeds two times aspiration for distance to shopping mall and recreational facilities. The attributes ‘distance to retail shops’ and ‘distance to metro station’ both indicate a very low predicted satisfaction level (around score 1) when the current distance is much longer than the aspiration, but both are predicted to have a high satisfaction level (theta is around score 5.3) when aspiration meets reality. Although the estimated highest and lowest satisfaction levels vary between different attributes, environmental dimension tends to display higher estimated maximum satisfaction than other two dimensions.
For neighbourhood attributes, only the models for frequency of community activities and frequency of management participation have a reasonable model fit. The former attribute has an alpha lower than 0.5, while the latter has an alpha higher than 0.5. Both models lead to a similar prediction of the highest and lowest satisfaction level. The graph of frequency of joining management does not contain the situation that reality exceeds aspiration and only a limited number of residents had the highest satisfaction level, which probably means residents expect to get more involved in community management.
Summarised results of social-demographic attributes.
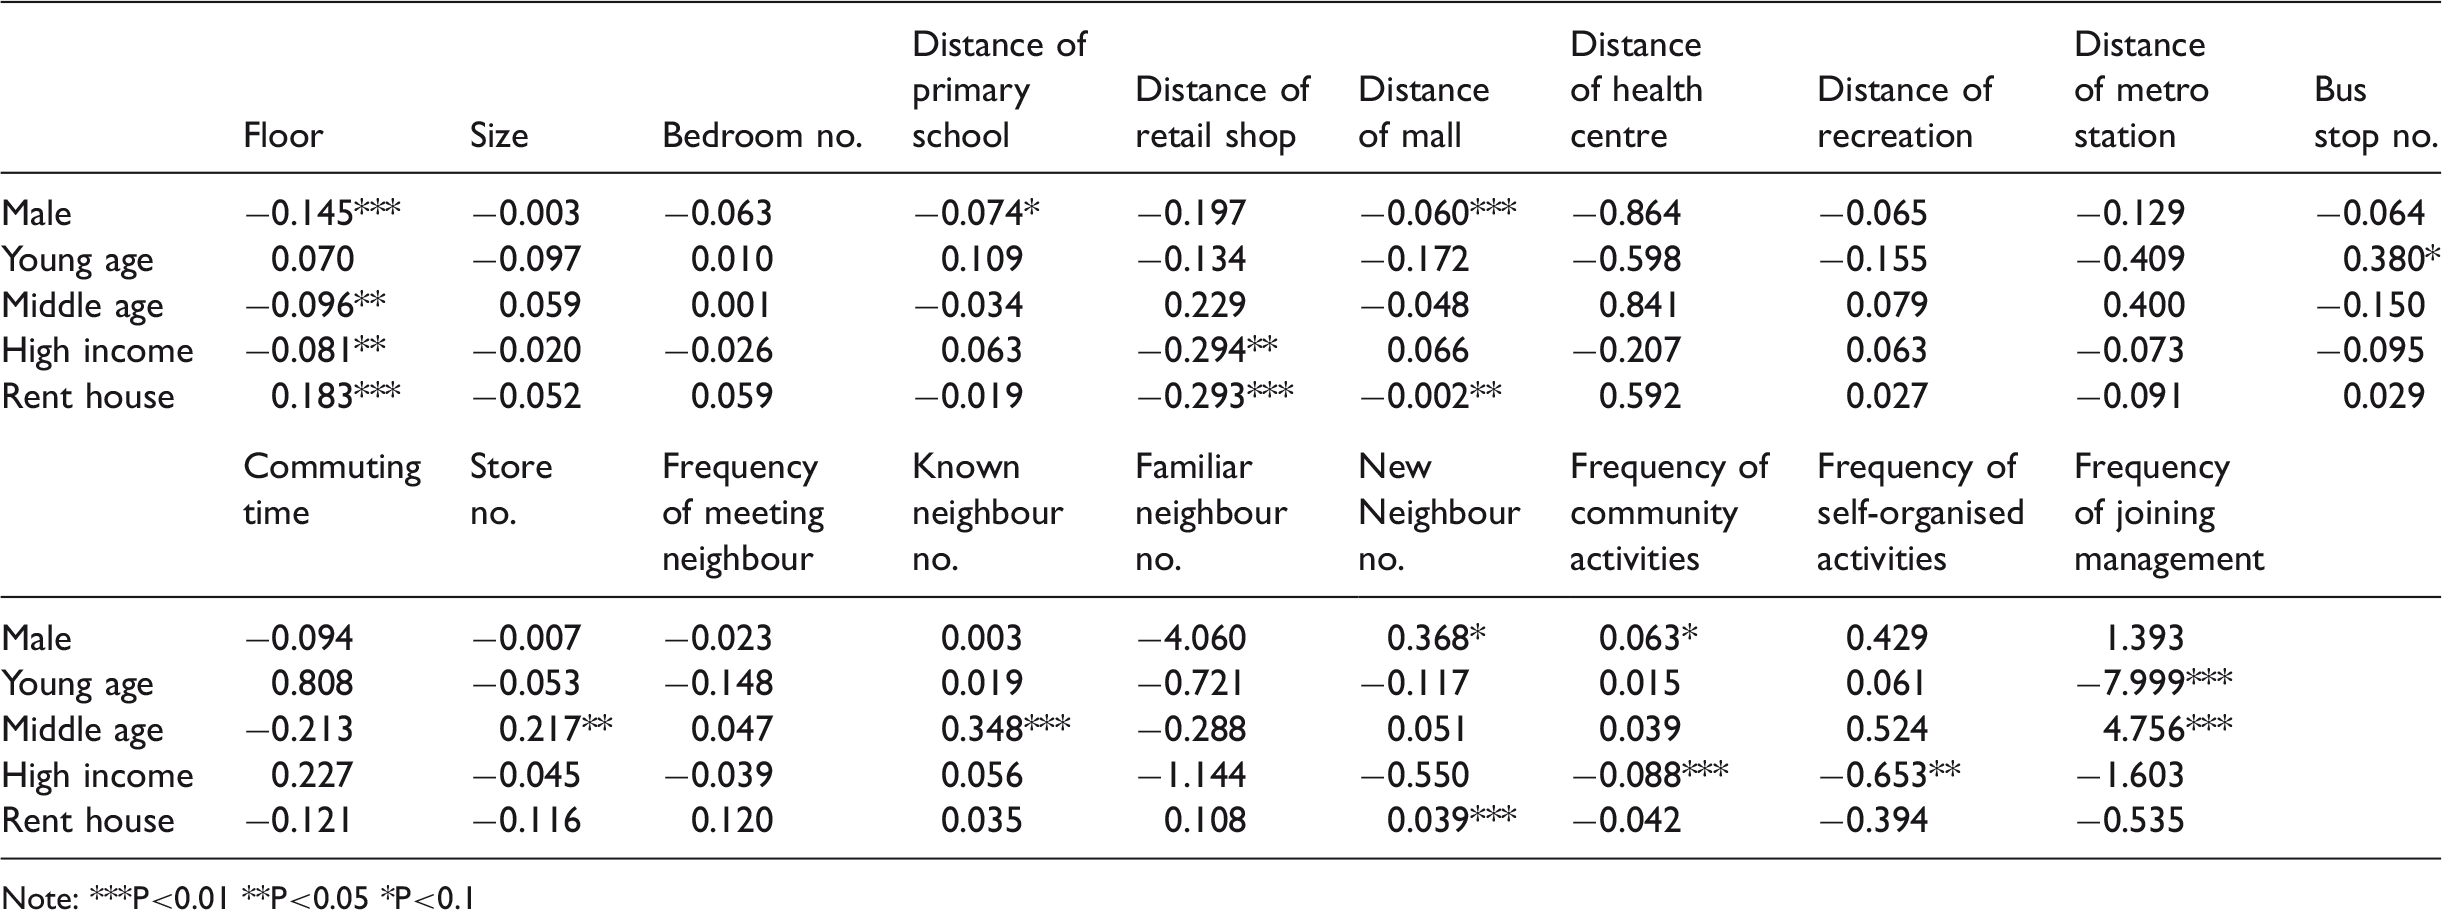
Note: ***P<0.01 **P<0.05 *P<0.1
In terms of the neighbourhood dimension, middle-aged residents are more sensitive to a change in gap index for the number of known neighbours compared with other age categories. Similarly, males and house renters show a higher sensitivity to a change of gap index for the number of new neighbours. In contrast, inhabitants with a high household income tend to be less sensitive about a change in gap for different types of neighbourhood activities. The older residents have a higher sensitivity to a change in gap index for the frequency of joining community management compared with the young.
Conclusions and discussion
Gap theory has a long history in the studies of residential satisfaction. Residential gap has been defined as the mismatch between aspiration and the current perceived situation. The vast majority of prior studies have operationalised gap as the function of difference between aspiration and perceived reality and have assumed that satisfaction is a linear function of the gap. This study is based on the contention that these operationalisations may be too rigorous. Rather, it seems plausible that residential satisfaction is a non-linear function of residential gap in the sense that the marginal effect of the gap may change along the degree of discrepancy between aspiration and reality. This argument is in line with Galster (1987). Furthermore, we argue that the mapping function of gap on satisfaction may be asymmetric for the situations that aspiration exceeds or below reality. The reason could be that residents have different sensitivities to outperformance and underperformance of aspiration. Then, we argue that the relationship between residential gap and satisfaction should be continuous rather than truncated. Finally, we argue that the gap between aspiration and reality may also depend on the aspiration level besides the generally used difference formulation. The same discrepancy will be perceived higher if the aspiration is already low. To capture this property, a gap ratio specification is suggested.
To account for these ideas, several non-linear, asymmetric and non-truncated gap–satisfaction models based on the difference and ratio formulations are specified. The various model specifications are compared in terms of their goodness of fit, using data on residential satisfaction collected from historical blocks in two Chinese cities. To examine the influence of social-demographic variables, the interaction between social-demographics and residential gap were included in all model specifications. The relationship between aspiration, gap and residential satisfaction is found to be best represented by different gap–satisfaction models for different dimensional attributes. Non-linear relationships are found between most attributes of residential gap and satisfaction rather than the linear relationship assumed in previous literature. For housing attributes, exponential ratio models best represent their gap–satisfaction relationships, while exponential difference models best represent the gap-satisfaction relationship for environmental attributes. As for the neighbourhood attributes, only two gap models indicate a good model fit and both relationships are best described by exponential ratio models. The relatively low model fit in the neighbourhood dimension might be because residential satisfaction in renovated historical blocks is not significantly influenced by neighbourhood attributes as residents have very good neighbourhood bonding in these blocks so that they do not have higher aspirations than the current situation. Overall, the results of the empirical estimations indicate that generally the non-linear, asymmetric gap models without truncation outperform the traditional linear gap model and the previous linear symmetric gap model with truncation.
The exponential function is found to better describe the gap–satisfaction relationship for renovated historical blocks compared with inverse exponential and logistic functions. The logistic gap ratio model can best describe the gap–satisfaction relationship only for the attribute of number of familiar neighbours. None of the inverse exponential models or logistic difference models show a high performance. These findings mean that residents living in renovated historical blocks are sensitive about the change in gap around the optimal point for most residential attributes. Residents are indifferent about the change of satisfaction when the gap is large enough for all attributes. The linear ratio model can only present the attribute of distance to shopping mall and recreation with a good model fit.
Different combinations of parameters are examined for the influence of residential gap on satisfaction. Results show that the alpha for most residential attributes is lower than 0.5, which means the increment of satisfaction is lower for aspiration below reality than that for aspiration exceeding reality. It also indicates that residents are less sensitive to the underperformance than to the outperformance of aspiration. Larger theta is mainly observed for accessibility attributes in the environmental dimension, which is reasonable in that higher estimated satisfaction might be manifested for accessibilities as the historical blocks are located in the city centre and have very good access to the public transportation. The logistic gap models indicate a small gamma, which means the sensitivities of residents around the optimal point is not very low.
Among all attributes from the three dimensions, only two contains the situation that aspiration exceeds reality. The attributes of house size and frequency of joining management are expressed by a limited number of residents for the situation of a higher reality than aspiration. This is reasonable because most residents may be unsatisfied with their house size as houses in historical blocks are generally smaller compared with other urban areas. This result indicates that inhabitants incline to attend more community management activities in those blocks. Therefore, the larger house size and more community management participations may need to be considered by the local authorities to improve the residential satisfaction in future renovations of historical blocks. The improvement should also consider the various sensitivity to the change of gap index for individuals with different socio-demographical backgrounds, for instance, the elderly or the renters.
This paper sheds lights to the non-linear asymmetric relationship between residential satisfaction and the gap of aspiration and reality considering the effects of social-demographics. Several types of non-linear asymmetric relationships are found and the sensitivity around the optimal point is identified for the historical areas. As only housing, environmental and neighbourhood dimensions were included in this paper, future studies may investigate additional dimensions, such as economic attributes. Moreover, this non-linear relationship can be examined in other urban areas to test its validity.
Footnotes
Declaration of conflicting interests
The author(s) declared no potential conflicts of interest with respect to the research, authorship, and/or publication of this article.
Funding
The author(s) received no financial support for the research, authorship, and/or publication of this article.