
Abstract
Hydrogen cyanide is often the most toxicologically significant component in fire effluents from nitrogen-containing materials. Unlike the other major asphyxiant, carbon monoxide, sensors for continuous hydrogen cyanide quantification, at and above dangerous concentrations, are not commercially available. This article investigates the analysis of fire effluent captured in bubbler solutions, by colorimetric quantification of hydrogen cyanide using chloramine-T/isonicotinic acid. The bubbler samples were mixed with colorimetric reagents to give a blue dye in response to cyanide ions. A novel reaction scheme accounting for the formation of the blue dye from cyanide ions is presented. Dilute, standard cyanide solutions were found to be stable after storage for up to 1 year. Alkaline bubbler solutions, through which the fire effluent has passed, showed consistent cyanide concentrations, for samples stored between 5°C and 21°C, for up to 31 days after sampling. The effect of other common ions likely to be present in fire effluent solution samples (CO32−, SO32−, SO42−, NO2− and NO3−) was investigated for their potential interference. The most significant interference was sulphite which reduced the apparent cyanide concentration by 13% at 10 mg L−1SO32− concentration.
Introduction
Exposure to combustion products from fires in modern residential structures results in multiple hazards. Besides heat and visual obscuration by smoke, the toxic effect of fire smoke leads to incapacitation, due to respiratory tract and eye irritation, followed by asphyxiation as the major cause of death and injury.1–4 The main asphyxiants in fire effluent are carbon monoxide (CO) and hydrogen cyanide (HCN). CO binds to the active site in haemoglobin preventing oxygen transport by red blood cells. HCN stops the body’s cells from utilising oxygen, by binding to the trivalent iron atom of cytochrome oxidase, the reducing component of mitochondrial electron transport, resulting in histotoxic hypoxia.5,6 The resulting oxygen deprivation stimulates respiration leading to hyperventilation, increasing the uptake of HCN. This leads to rapid incapacitation.7–10 This pattern of incapacitation, leading to loss of consciousness, followed by further toxic gas inhalation, is the normal sequence of events leading to fire fatalities. It is, therefore, very important to predict HCN emissions from unwanted fires.
In common with CO, HCN is formed near the base of the flame during combustion of nitrogen-containing materials,11–13 but is then decomposed in a well-ventilated flame, partly to molecular nitrogen. 14 However, it persists in under-ventilated flames or in the presence of gas phase inhibitors (such as halogenated or organophosphorus flame retardants). 15 It has been detected following burning of fibres, 16 polymers,17,18 building insulation foams 19 and flexible polyurethane foams.20,21 Due to its high toxicity, and the prevalence of large amounts of nitrogen-containing materials in modern enclosed environments, it is necessary to quantify HCN released from fires robustly, to ensure life safety.
During fire tests, HCN can be collected by bubbling fire effluent through an aqueous sodium hydroxide (NaOH) solution (0.1 mol L−1) trapping HCN as cyanide (CN–) ions. 22
Methods for the determination of cyanide ions in solution have generally been designed for use in the analysis of soil, water, food, and biological fluids.23–26 Fire effluent analysis is somewhat different, in that higher HCN concentrations are often encountered, and they occur in a complex mixture of water, organic vapours, and soot particles.
ISO 19701 27 includes the description of methods for quantification of HCN: high performance ion chromatography (HPIC), and two methods that utilise colourimetry (chloramine-T/pyrazolone, and picric acid–based analysis). HPIC normally requires a specialised instrument dedicated to HCN analysis with a special column and amperometric detector. The columns are sensitive to particulates in fire effluent solutions, so extra care in sample preparation is needed to avoid blocking the active sites on the column; 28 filtration is essential. Picric acid has a similar structure to trinitrotoluene (TNT). When dry, picric acid is liable to explode spontaneously, so ensuring safe storage presents problems. ISO 19702 29 describes the use of Fourier transform infrared spectroscopy (FTIR) for gas phase quantification of HCN. Though FTIR is a powerful gas analysis technique, data from complex gas mixtures contain overlapping peaks and require detailed interpretation with the risk of increased variability in quantification. In particular, water overlaps one of the main absorption bands and is difficult to subtract quantitatively from the spectrum. Recently, a robust and versatile portable tunable diode laser–based measurement system for measuring high concentrations of HCN in a time-resolved manner, from two locations simultaneously, has been reported for application in the fire environment. 30 However, this is currently at the stage of a completed PhD project. This leaves colorimetric quantification with chloramine-T/pyrazolone as an attractive method.
The use of pyridine and pyrazolone reagents for the quantification of cyanide has been reported in literature without a detailed explanation of the chemistry.31–33 A definitive summary of the sequence of the chloramine-T/isonicotinic acid/pyrazolone colour development reaction is outlined in Scheme 1, based on literature reports.34,35 The sequence starts with cyanide (a), collected in the bubbler, being oxidised by chloramine-T (b). The resulting cyanogen chloride (c) reacts with isonicotinic acid (d) to form 4-carboxy-1-cyano-pyridinium chloride (e) which undergoes a Zincke reaction.36,37 The resulting glutacondialdehyde (f) condenses with two molar equivalents 1-phenyl-3-methyl-5-pyrazolone (g) to form a blue polymethine dye (h) that can be quantitatively analysed at λ = 638 nm.32,38 The key benefits of the method are the selectivity (few other compounds produce such a blue colour) and the sensitivity (concentrations as low as 1 ppm are readily quantified).
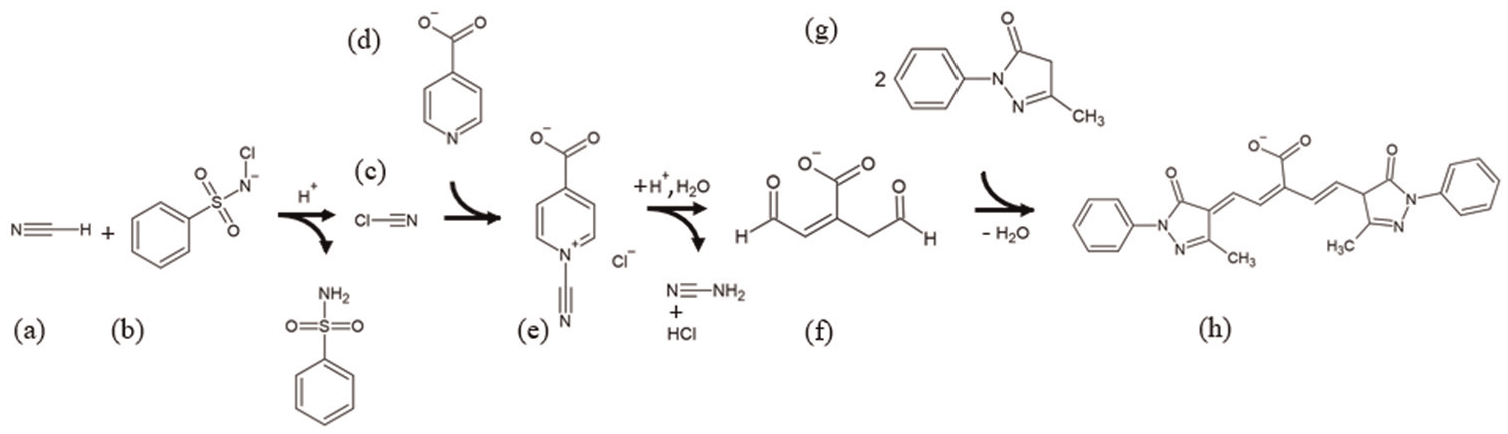
(a) Hydrogen cyanide. (b) Chloramine-T. (c) Cyanogen chloride. (d) Isonicotinic acid. (e) 4-carboxy-1-cyano-pyridinium chloride. (f) Glutacondialdehyde. (g) 1-phenyl-3-methyl-5-pyrazolone. (h) Polymethine dye product (blue). Reaction buffered to pH = 7.2.
ISO 19701 provides a brief outline of the method, specifying various procedures which must be followed, including the lifetime of standard solutions, the time interval between sampling and analysis, and the stability of the blue dye produced. These requirements have been investigated experimentally in this work.
This study presents an optimised method for analysis of fire gas samples, collected using 0.1 M NaOH as an absorbing solution and subsequent spectrophotometric quantification of cyanide. Even though colorimetric quantification of cyanide with chloramine-T/pyrazolone is considered a promising method due to its simplicity, low toxicity, and availability of visible region spectrophotometers in many analytical laboratories, no systematic investigation on method repeatability and robustness has been reported.
An investigation of potential interferences on the cyanide quantification (from carbonate, sulphite, sulphate, nitrite, nitrate) is also presented. This includes demonstration of the specificity of the chloramine-T/pyrazolone reaction to cyanide. The work further reports storage stability and repeatability data and investigates the time/temperature dependence of the blue dye formation reaction to provide the correct analytical window for robust quantification of HCN in fire effluent.
Material and methods
Sample preparation
Cyanide standard solutions
A 500 mg L−1 stock cyanide solution as CN– was prepared (0.3225 g KCN, Sigma Aldrich 97%, made up to 250 mL with 0.1 M NaOH)). Five standard cyanide solutions were prepared: 0.3 mg L−1, 0.8 mg L−1, 2.0 mg L−1, 5.0 mg L−1 and 8.0 mg L−1 by dilution of an intermediate cyanide solution of 20 mg L−1 (10 mL of stock cyanide solution made up to 250 mL with 0.1 mol L−1 NaOH). All samples were stored in a refrigerator at 5°C until further testing.
Cross-sensitivity solutions
All cross-sensitivity solutions contained 2.0 mg L−1 cyanide and one of five potentially interfering ions. To simulate fire gases containing CO2, SO2, SO3, NO, and NO2, respectively, sodium salts of
Fire effluent solution
HCN was generated by burning pellets of polyamide 6.6 in the steady state tube furnace (ISO/TS 19700) 39 under controlled conditions, representing under-ventilated flaming at 650°C. These conditions have been reported to produce HCN and other products of incomplete combustion in high yield. 15 A proportion of diluted fire effluent was bubbled through a train of 250 mL Drechsel bottles (with perforated glass bulb to maximise absorption, but avoid blockage by soot), containing 150 mL of 0.1 mol L−1 NaOH at an effluent sampling volume rate of 1 L min−1 (flow verified using a PFM71-F01F flow sensor, SMC, Japan) for 3–5 min, and the total volume of sampled effluent was recorded. After immediate testing, approximately 4 h after sampling, aliquots of the bubbler solution were transferred into two airtight polypropylene bottles and stored at 5°C and 21°C, respectively, and kept for further testing after 31 days.
Reagent preparation
The following reagents were prepared:
Colorimetric quantification of HCN with ultraviolet-visible spectroscopy
To a test tube, the following were added sequentially: 1.00 mL of cyanide test sample (cyanide standard solution or bubbler solution), 9.00 mL distilled water, 4.50 mL phosphate buffer, 2.00 mL
Absorbance (λ = 638 nm), in 10 and 40 mm cuvettes of five standard cyanide solutions (0.3, 0.8, 2.0, 5.0 and 8.0 mg L−1), was determined regularly during the storage period of 1 year. Within the first 10 min of all tests, the colour was observed to shift from red, to purple, to blue. Absorbance versus time for an 8.0 mg L−1 cyanide standard was collected on five separate occasions at two wavelengths corresponding to the red and blue colours (543 and 638 nm, using 10 mm cuvette) for 90 min in total. Temperature dependence was tested by reacting an 8.0 mg L−1 cyanide standard with reagents, water, and buffer (taken from water baths at 18°C, 21°C and 35°C). The absorbance was followed at 543 and 638 nm for 90 min.
Results
Repeatability
Table 1 lists average absorbance, absolute, and relative (%) standard deviations (SD) from repeatability tests in two different cuvettes (10 and 40 mm) on the same UV-visible spectrophotometers for the five stored standard cyanide solutions, determined over a period of 1 year. The data show that there was no increase in standard deviation over this period. They also show low relative SD (<5%) for all standard cyanide solutions, except 0.3 mg L−1 measured in a 10 mm cuvette (9%). However, changing to a 40 mm cuvette reduces the relative SD below 4%.
Repeatability test over 12 months (reaction temperature 21°C)
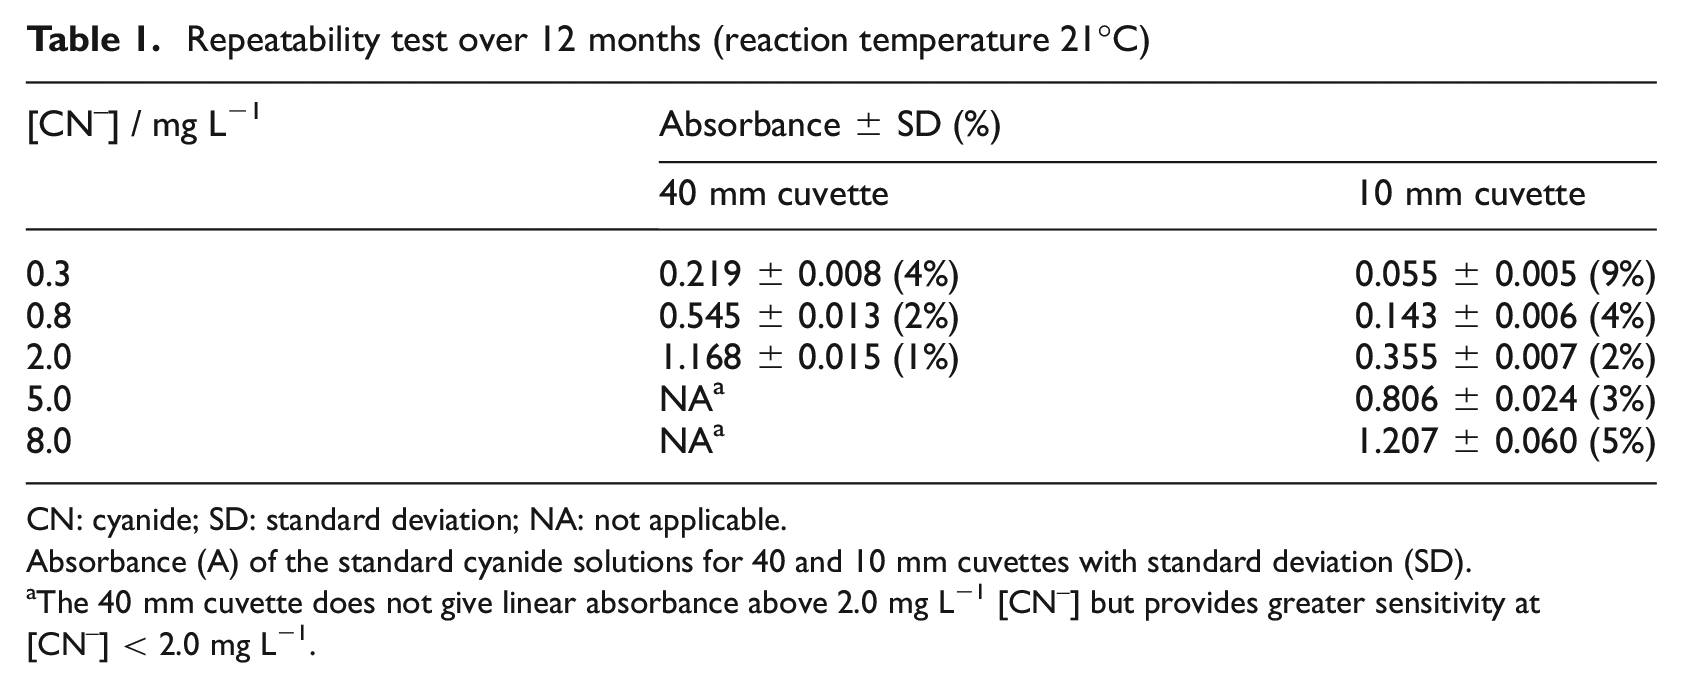
CN: cyanide; SD: standard deviation; NA: not applicable.
Absorbance (A) of the standard cyanide solutions for 40 and 10 mm cuvettes with standard deviation (SD).
The 40 mm cuvette does not give linear absorbance above 2.0 mg L−1 [CN–] but provides greater sensitivity at [CN–] < 2.0 mg L−1.
Figure 1 shows the resulting colour for cyanide standards of different [CN–] concentrations (28 min after addition of
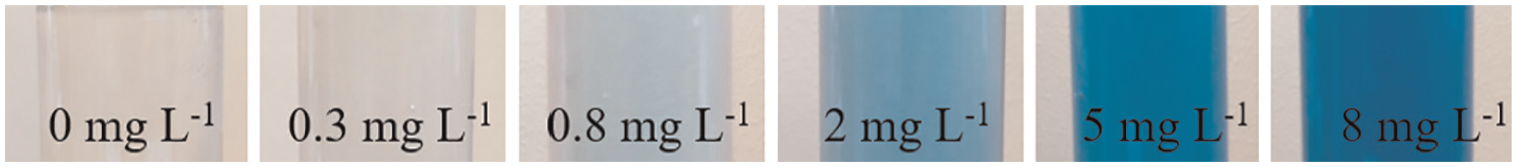
Photographs of test tubes showing the colour appearance developed 28 min (reaction temperature 21°C) after addition of
Figure 2 shows the linearity of the absorbance of the polymethine dye product as a function of cyanide concentration over the range 0.3–8 mg L−1, using the repeatability data presented in Table 1.
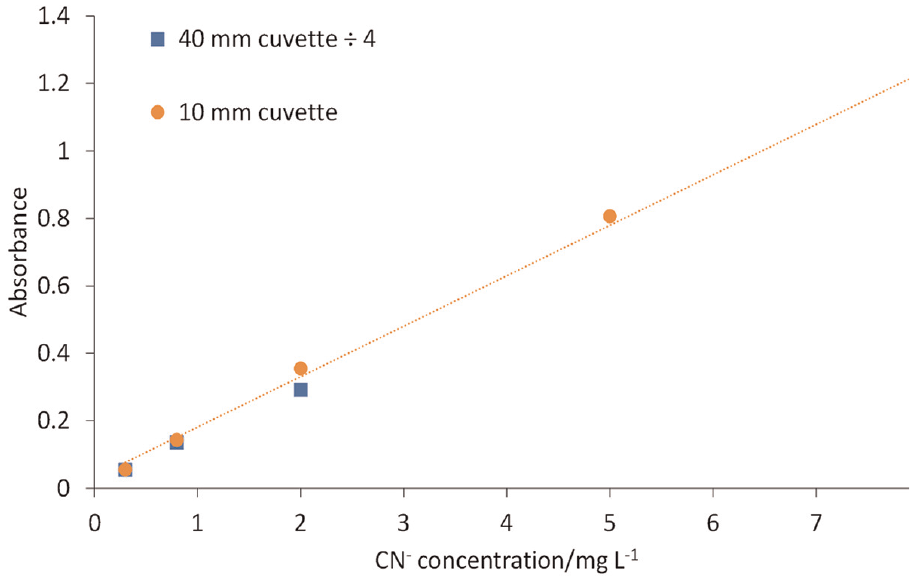
Variation of absorbance with CN– concentration.
Time/temperature dependence of colorimetric reaction
Figure 3 depicts the fraction of maximum absorbance as function of time for three reaction temperatures (18°C, 21°C (5 repeats) and 35°C) of a 8.0 mg L−1 standard cyanide solution measured at two wavelengths (543 and 638 nm) expressed as a fraction of maximum value.
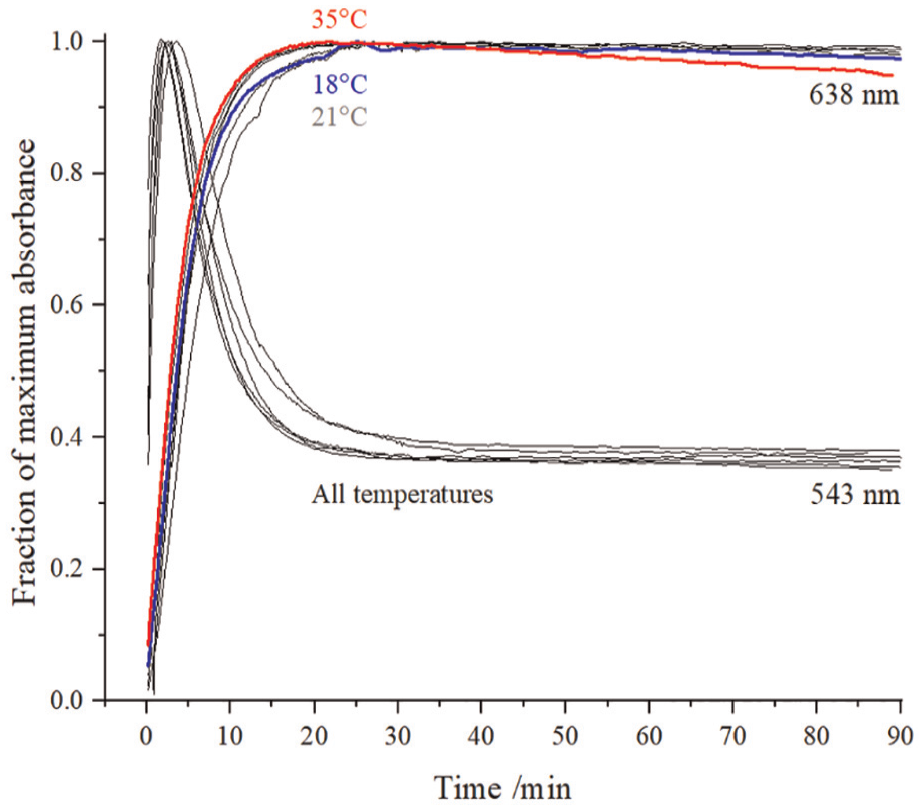
Temperature dependence of colorimetric reaction plotted as absorbance at 543 and 638 nm versus time after addition of
Regardless of the reagent temperature, Figure 3 shows that the initial red colour, developed after addition of
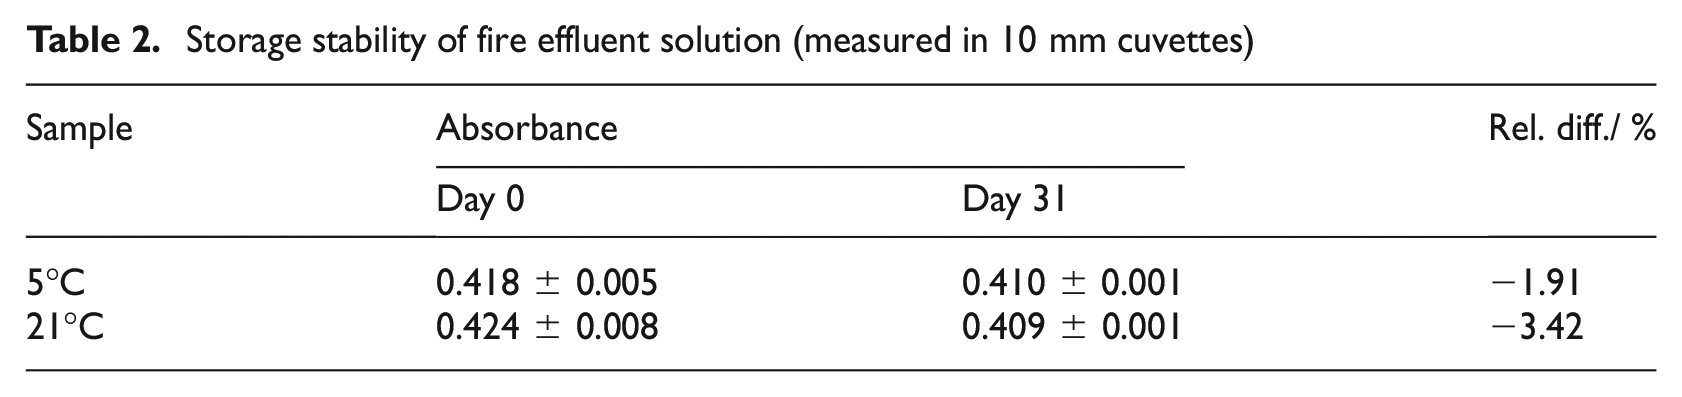
Storage stability of fire effluent solution
Table 2 shows absorbance measurements 30 min after addition of
Storage stability of fire effluent solution (measured in 10 mm cuvettes)
Cross-sensitivity
Figure 4 summarises the effects of analysing a 2.0 mg L−1 cyanide solution when
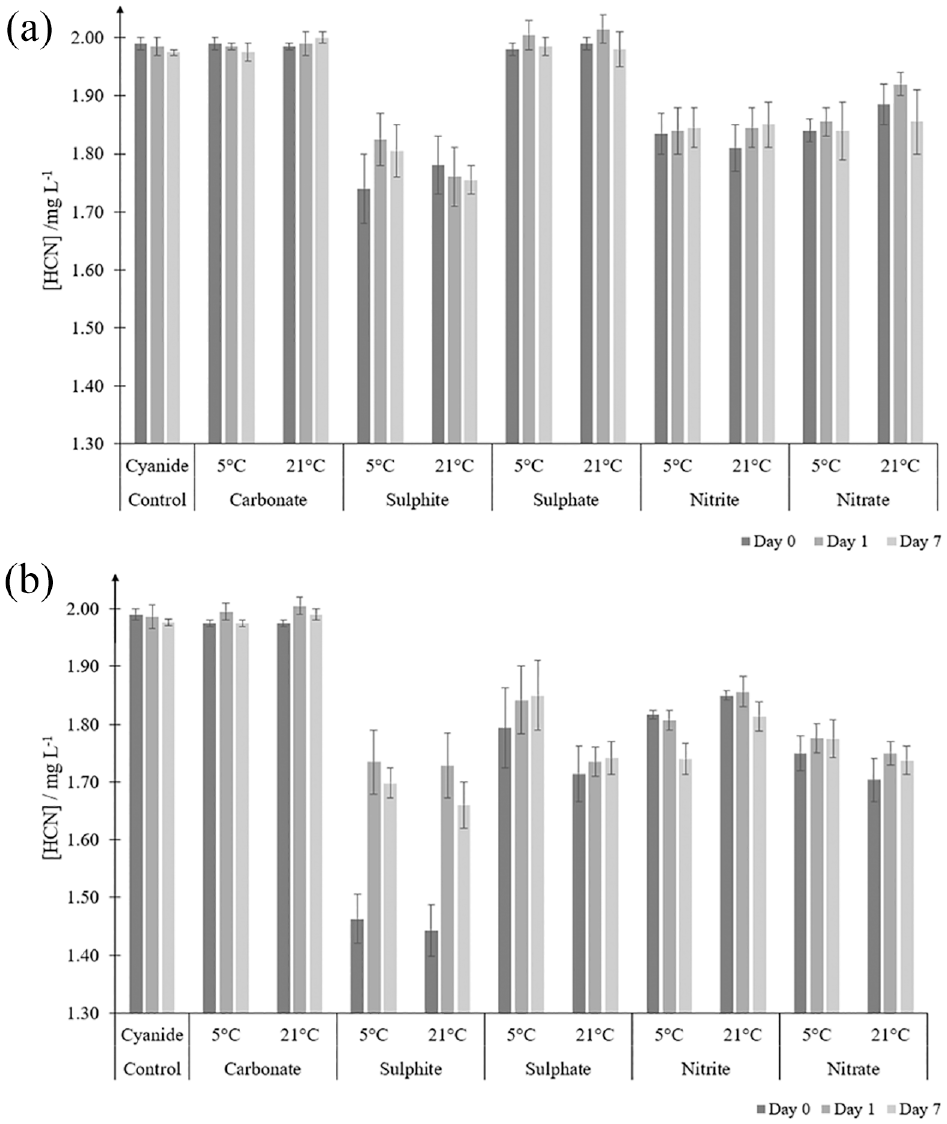
Cross-sensitivity tests on a 2.0 mg L−1 cyanide concentration. Potentially interfering ion concentrations of 1 mg L−1 (a) and 10 mg L−1 (b) after 0, 1 and 7 days for samples stored at 5°C and 21°C, respectively. Note that the Y axis has been expanded to emphasise the small difference in the results.
Discussion
Analytical window for the colour development reaction
The progress of the colorimetric cyanide detection reaction was monitored as a function of time at different reagent temperatures. The ISO 19701 standard specifies a 10 min window (from 25 to 35 min), for taking absorbent measurements. The data in Figure 3 indicate that over the range of ambient temperatures, a stable blue colour is formed within 20 min and remains stable until at least 90 min after addition of
Within the chosen analytical window, Table 1 summarises the repeatability of quantifying standard cyanide solutions. For cyanide concentrations above 2 mg L−1, uncertainty is around 3% if a 10 mm cuvette is used. For concentrations less than 2 mg L−1, a 40 mm cuvette will result in similar uncertainty (below 4%). Hence, below 2 mg L−1, a 40 mm cuvette is preferable, but in practice both cuvettes are used during data collection. Furthermore, it has been shown in ‘Repeatability’ section that standard cyanide solutions are stable after storage in a refrigerator over a period of 1 year. This is in contrast to the requirements to prepare fresh standards daily in ISO 19701 27 and elsewhere. 41 From the results in Figures 2 and 3 and Table 1, the colour development in Figure 1 appears to be a reliable indicator of cyanide concentration. Consequently, the 70 min analytical window allows for batch analysis of samples.
HCN sampling conditions
Collecting HCN from samples of fire atmosphere by trapping in an absorbing solution is a critical part of its quantification and must suit the fire experiment and material under test. By bubbling fire atmospheres through an alkaline solution, HCN, a weak acid (pKa = 9.31), 42 is trapped in its anionic form. 22 ISO 19701 states that the effluent shall be drawn through a fritted bubbler tube containing 20 mL 0.01 mol L−1 NaOH solution at a flow rate of 0.4 L min−1 for 4–5 min. 27 While these conditions will trap HCN, the small volume of low concentration NaOH may be neutralised by the much greater volume of CO2 or other acidic gases present in the effluent. For the optimised method described here, the effluent is bubbled into a Drechsel bottle containing 150 mL of 0.1 mol L−1 NaOH at 1 L min−1 over 3–5 min. Furthermore, the bubbler tube head is perforated to reduce the bubble size but avoids the potential blocking by soot particles of a fritted (sintered glass) head. The rationale for using the more concentrated alkaline solution is best explained using an example. Under the conditions described above, using 20 mL of 0.01 mol L−1 of NaOH, the absorbing solution contains 0.0002 mol OH–. Sampling effluent containing 100 ppm HCN for 5 min at 0.4 L min−1 results in 2 L of effluent being sampled into solution, thus containing 0.0002 L HCN in total. Since 1 mol occupies 24 L, the sampled solution contains 8.33 × 10⁻⁶ mol HCN and therefore uses 0.02% of the available NaOH. However, if the sampled 5 L fire effluent also contained 5% CO2, this results in 0.25 L CO2, or approximately 0.01 mol, which would neutralise all the OH– ions in the bubbler. (In aqueous solution, CO2 exists in equilibrium with carbonic acid (H2CO3) for which pKa1 = 6.37 and pKa2 = 10.32. As the first pKa is significantly lower than that of HCN, dissociation of carbonic acid would reprotonate the HCN, allowing trapped CN– to escape from the bubbler solution, or neutralise the alkalinity so the slightly soluble HCN gas was not trapped.) Therefore, using 0.1 mol L−1 NaOH ensures sufficient alkalinity for trapping HCN gas and allows greater effluent volumes to be collected, minimising dead volumes in tubes and so on. Hence, to ensure that HCN is not lost, a higher NaOH concentration should be used. ISO 19701 specifies that a second bubbler should be placed in series to ensure that any carry-over can be quantified.
Another potential advantage of using the 0.1 mol L−1 NaOH bubbler solution is that its greater alkalinity will stabilise the CN– in solution, helping to increase the stability of the solution and increase safe sample storage times. The difference in storage stability between the ISO 19701 specified 0.01 mol L−1 NaOH and 0.1 mol L−1 NaOH was not investigated directly in the current work.
Fire effluent storage stability
Once HCN has been captured, ISO 19701 stipulates that quantification should be carried out on the same day, as the fire effluent solution is unstable over time. Table 2 shows minor (less than 2%) absorbance reductions for more alkaline 0.1 mol L−1 NaOH fire effluent bubbler solutions tested immediately and stored for 31 days at both 5°C or 21°C. The absorbance reduction (less than 3.5%) is considered negligible when converted to HCN concentration in fire atmosphere. For example, at a concentration of 190 ppm of HCN, the fire atmosphere is predicted to lead to incapacitation of 50% of the exposed population within 5 min, according to ISO 13571. 43 In addition, Figure 4 shows that the measured apparent concentration of cyanide is independent of storage temperatures (5°C, 21°C) and storage over 0–7 days. Hence, fire effluent solutions collected in 0.1 mol L−1 NaOH are considered stable, even when not cooled, reducing concerns of sample losses, for example, when transporting samples from external testing locations or when samples cannot be immediately refrigerated prior to analysis.
Interferences from other fire gas ions
A review of literature showed that different interferences can change the apparent HCN concentration. Cyanide could be partially oxidised to cyanate in the presence of oxidants such as SO2, O2, NO, or NO2 in alkaline solution.42,44 The resultant cyanate may slowly decompose to form carbonate ions (negative interference). 45 However, Table 2 shows that fire effluent solutions have high storage stability, so cyanate formation appears negligibly small and does not affect cyanide quantification, as reported elsewhere. 32
Reports in the literature show that cyanide reacts with polysulphide SxS2– (with formation of thiocyanate, SCN–), elemental sulphur S8 (second order ring opening reaction resulting in formation of thiocyanate) and thiosulphate
Early interference studies from Epstein showed no interferences from carbonates, borates, chlorides, ammonium/sodium salts, cyanate, oxalate, ferri/ferrocyanides and sulphates. Furthermore, it was reported that reducing agents (i.e. nitrite and sulphite in this work) are likely to be oxidised by the excess of chloramine-T. 32 Cyanide analysis of cigarette smoke has been reported to show no interference from other gases present. 50
However, in this work cross-sensitivity mainly arises from the presence of sulphite (1 mg L−1, Figure 4(a)). At 10 mg L−1, the losses increase to 26%–28% when tested immediately but decreased to 13% after 24 h (Figure 4(b)). Even though sulphite ions are reported to react with cyanogen chloride,51,52 no satisfactory explanation for this observation has been found. Materials that may be of concern due to their sulphur content could include rubbers, coal, and phenolic foams/resins.
Interference from CO2 in fire gas could acidify the absorbing solution sufficiently to prevent trapping of HCN. The combination of optimised sampling conditions and the data in Figure 4 indicate that, apart from the effect on trapping by the absorbing solution, carbonate (and bicarbonate) has negligible effect on the analysis.
Well-ventilated fire conditions, where high concentrations of NOx are formed, generally produce low HCN concentrations.53,54 Figure 4 shows losses in cyanide quantification range from about 7% at 1 mg L−1 to about 13% at 10 mg L−1, possibly due to oxidation of cyanide. 55 Hence, interferences from NOx products could result in 7%–13% underestimation of HCN in the least toxic, well-ventilated fire condition, but in situations where HCN levels are at their highest (during under-ventilated flaming), the NOx is unlikely to be present in high concentrations.
ISO 19701 states that small negative interferences arise from nitriles, oxides of nitrogen, and sulphide. This work suggests that interferences from
Conclusions
An optimised colorimetric quantification method for HCN in fire effluent, based on chloramine-T/isonicotinic acid, has been demonstrated to be a robust analytical method. In contrast to the outline description and rigid requirements specified in ISO 19701, the optimised method is more effective at trapping HCN, and more flexibility is permitted in the analysis, without affecting the results. It is possible that the higher alkalinity of the bubbler solution also improves the stability of the cyanide solutions. It has been shown that fire effluent solutions can be stored for up to 31 days at 21°C before analysis. Time/temperature dependence of the colour reaction was shown to give constant absorbance from 20 to 90 min after addition of reagents in the temperature range 18°C–35°C which allows for efficient testing of multiple samples in a sequence. The repeatability is within 4% if absorbance is measured on a UV-visible spectrophotometer with appropriate cuvette (10 or 40 mm, the latter preferred for quantifying 2 mg L−1 cyanide or less).
Small interferences (around −12%) from commonly expected, dissolved fire gases were found, always reducing the apparent cyanide concentration. Cross sensitivity was investigated by adding 10 mg L−1 of
The work demonstrates the enhanced stability and repeatability of the analysis. An optimised method for quantification of HCN in fire effluent has been reported. The method is robust for fire effluent sample transport and storage, and offers quick, repeatable batch analysis in an analytical laboratory.
Footnotes
Acknowledgements
The authors would like to thank Katarina Handlovicova for help in the laboratory, and Dr. Malthe Hansen-Bruhn for discussions on reaction schemes.
Author contributions
Iben Hansen-Bruhn: Formal analysis, Investigation, Methodology, Validation, Visualisation, Writing–Review & Editing. Sean T McKenna: Conceptualisation, Formal analysis, Investigation, Methodology, Writing–Original Draft. T Richard Hull: Conceptualisation, Funding, Resources, Project administration, Supervision, Writing–Review & Editing.
Declaration of conflicting interests
The author(s) declared no potential conflicts of interest with respect to the research, authorship, and/or publication of this article.
Funding
The author(s) disclosed receipt of the following financial support for the research, authorship, and/or publication of this article: This work is partly funded by Innovation Fund Denmark under File No 9065-00233B.