
Abstract
Fire suppression systems in cargo compartments are a certification requirement for commercial aircraft safety. Halon production was banned and usage ends in 2040 according to Montreal Protocol for environmental reasons. This necessitates an alternative environmentally friendly agent. Quantitative analysis of nitrogen as agent established suitability of the suppression system. The Minimum Performance Standards specifies the qualification procedure of an agent through four scenarios – bulk load; containerised load; surface burning; and aerosol can explosion. Empirical sources from Airbus, independent computational fluid dynamics studies and small-scale cup-burner tests indicate suitability of nitrogen specific to aircraft cargo fire suppression. The nitrogen delivery system and the experimental apparatus are presented. Extensive commissioning tests verified instrumentation reliability. All the four scenarios were conducted at Cranfield University, in a replica of a wide-body aircraft cargo compartment. In a reduced oxygen environment (11%) obtained with nitrogen discharge, the aerosol can explosion tests were performed without any evidence of explosion or pressure increase beyond the expected baseline value. The surface burning scenario was completed successfully and passed the Minimum Performance Standard criteria. The maximum average temperature was found to be 220°C (limit – 293°C). All the scenarios passed the Minimum Performance Standard criteria for indicating successful prevention of Class B fire re-ignition. Similarly, the containerised and bulk-load scenarios obtained results that passed the Minimum Performance Standard criteria for successfully maintaining continued fire suppression for a specified period of time. The maximum average temperature in containerised-load fire scenario was found to be 210°C (limit – 343°C) and in bulk-load scenario was 255°C (limit – 377°C). Additional qualification criteria and system design are presented in this article according to the Minimum Performance Standard format. This work can be extended to introduce standard testing for safety critical systems, such as engine bay and lithium-ion fires.
Keywords
Introduction
Fire suppression and explosion prevention is a flying certification requirement for passenger aircraft as per European Union Aviation Safety Agency (EASA) commission regulation (EU No 2015/640 and 2012/965) and Federal Aviation Administration (FAA) cargo compartment fire suppression (AC 25.795-5). Given the closely packed electrical systems and the nature of materials carried in Class C cargo compartments, which is inaccessible to the crew, it poses a high risk of fire on board. Class C cargo compartments are typically found in passenger and cargo aircraft, with some exceptions found in military aircraft. The focus of this study is particularly towards the cargo compartment of a wide-body passenger aircraft. Such occurrence in mid-air imposes ever larger risk to passengers. Fire on-board can cause fatal disasters as evacuation becomes impossible. The fire triangle describes methods of fire suppression and extinction (Figure 1). This article focuses on fire detection and corresponding agent delivery for specified heat release rate of fire through oxygen starvation. The heat release rate calculation influences the fire design principle incorporated in simulations.2,3 The fire suppression mechanism would include identification of critical locations of fire risk, frequency of occurrence, fire growth time, estimation of detection and corresponding agent delivery time and how the system deals with the event upon completing the suppression process. 1 The representation of design fire is carried out in modelling four phases of fire – (a) linear in time in the incipient stage, (b) time squared in the growth stage, (c) steady with time in the full fire development phase and (d) exponential growth in the decay phase. A risk model was developed which studied the effects of fire suppression for passenger ships. 4 Such a risk model was extended to develop concepts and identify the challenges in aircraft fire suppression such as altitude effects, location of fire source, type of fire and so on in a previous paper. 2 Although the requirements are vastly different, the general methodology for fire suppression used in this article vastly remains the same, through oxygen depletion.
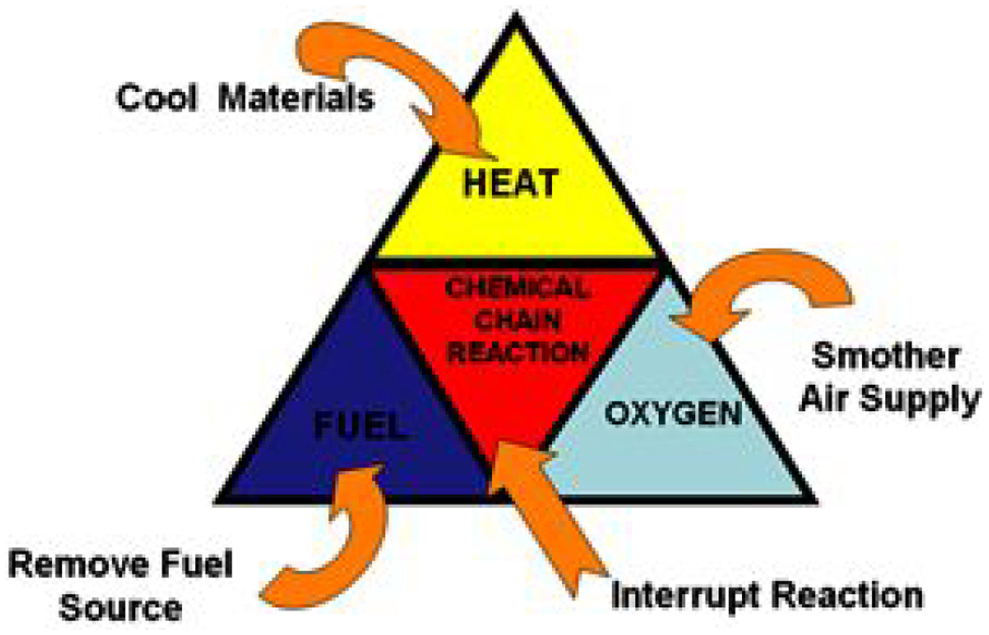
Fire triangle. 1
Conventionally, halon-based agents have been used for fire suppression due to their favourable properties in suppressing fire, namely electrically non-conductive, dissipates rapidly without residue and relatively safe to use. Production of halon agents was discontinued in accordance with the agreements of Montreal Protocol (MOP) as these agents are detrimental to the environment. 5 Halon is being phased out, and the deadline for usage has been set to 2040 for fixed fire suppression systems in new aircraft cargo compartments. 6 This means that existing halon delivery systems for cargo holds in aircraft will also need to be retrofitted by 2040 to suit the requirements of a replacement agent. The FAA has formulated a set of guidelines under the Minimum Performance Standards (MPS) for such systems. Several alternatives to halon are currently being investigated by airframe manufacturers. Boeing is currently testing trifluoroiodomethane (CF3I) in their MPS test facility. 7 Other options and alternatives are also being evaluated for the safety performance in fire suppression such as bromo-trifluoro-propene (BTP), 8 HFC-125, 8 FM-200 8 and so on. Further information can be found in a detailed report published by FAA in ‘Options to Use of Halons for Aircraft Fire Suppression Systems’. 5
Nitrogen was used as the fire suppression agent for the experiments presented in this article. The Halon Replacement Working Group has placed guidelines for replacement agents in FAA Code of Federal Regulations (CFR) documents.9–12 The replacement agents must have low ozone depletion potential (ODP), low toxicity, residue-free, easy to clean up, low global warming potential (GWP), low risk of use (relative to halon 1301 systems) and so on. 5 Any agent being considered is required to undergo rigorous testing in accordance with the MPS guidelines, which includes four fire scenarios – bulk-load fire test, containerised-load fire test, surface burning test and aerosol can explosion test as mentioned earlier. 13 The relative acceptance criteria are listed in Table 1.
MPS acceptance criteria. 13
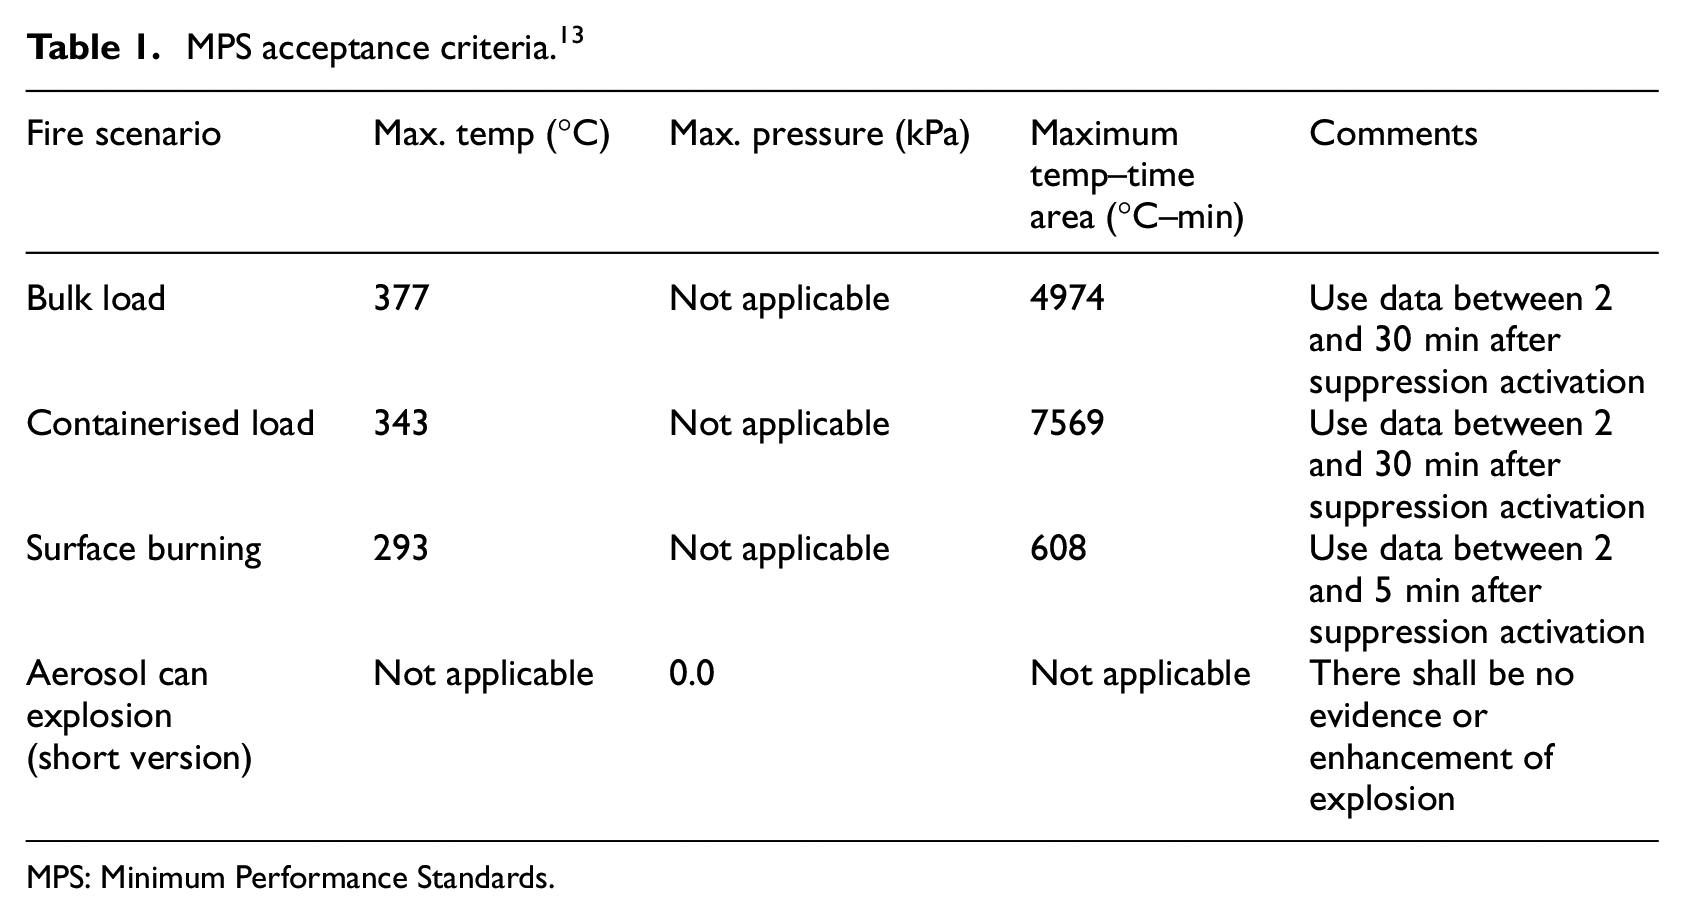
MPS: Minimum Performance Standards.
Background
Given the importance of aircraft safety and pressure on complying with environmental regulations, suitable halon replacements have been under consideration for a long time. Extensive research and testing efforts have been made by air frame and suppression agent manufacturers. The ‘Options Report’ lists all commercialised total flooding agents. 5 A number of agents that fulfil the general requirements have been investigated in this report. In 1998, FAA published test results related to cargo compartment fire protection in large transport aircraft 14 using a working draft of the MPS. The halocarbon agent HFC-125 was comparable to halon 1301 in terms of performance and agent decomposition levels. Tests also indicated that the ‘Aerosol Can’ test was the most challenging test to simulate in a repeatable and controllable manner. In 2004, Reinhardt presented data from simulated aerosol can explosion tests in a relatively small (11 m3) enclosure using BTP and HFC-125. 8 The results indicated that when designed below inert concentrations, these agents enhanced the explosion instead of mitigating it. This is in stark contrast to halon 1301, which showed the capability to reduce the pressure pulse even when below the inerting concentration. Thus, these agents were considered unsuitable for replacing halon. A collection of other agents have also been shown in Table 2, where it can be seen that water mist and nitrogen mixture has also passed all the MPS criteria. However, the benefits of the fire suppression are outweighed by the additional storage and weight penalties of water. This extra weight of water must be carried at all times as an insurance against fire accidents that are so rare in aircraft. It also adds to other problems such as freezing of water in the feed system and generation of mist due to low temperature and pressure at high altitudes. Hence, nitrogen was considered in this study as it can be compressed to occupy low volume, making it easier for storage, usage and handling.
MPS tests for different agents. 15
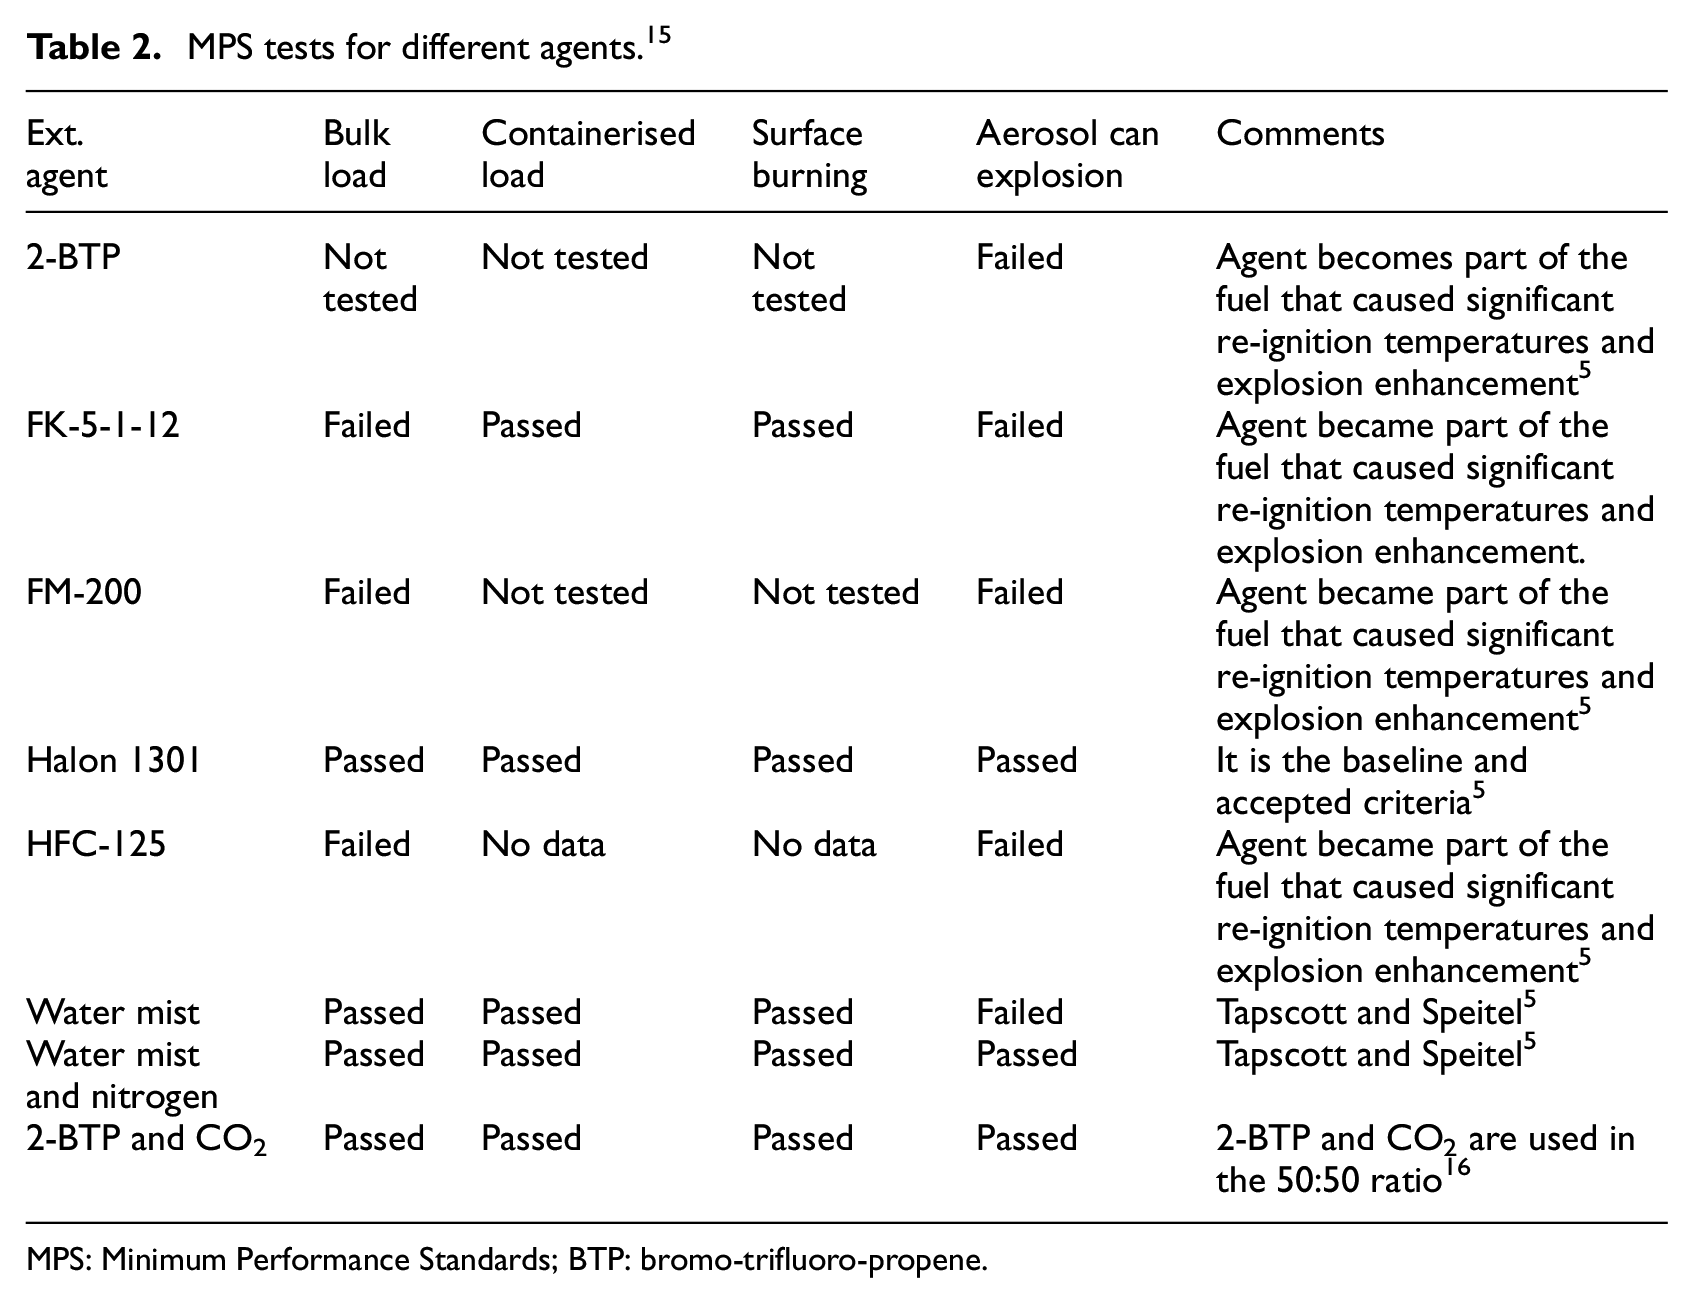
MPS: Minimum Performance Standards; BTP: bromo-trifluoro-propene.
An important aspect to note here is that the cargo hold fire suppression system is not required to extinguish a fire in its entirety. The system is intended to suppress any fire until it can be completely extinguished by ground personnel following a safe landing. Common halocarbon agents are highly effective and meet the FAA MPS specified temperature requirements. They are easy to integrate and show acceptable levels of toxicity. It is highly desirable to find alternatives with performance characteristics similar to halocarbons. Many agents, such as carbon-dioxide, water mist and inergen (blend of nitrogen, carbon-dioxide and argon), 5 are being investigated for operating compliance (Table 2). Several alternative agents are listed in the ‘Chemical Options Report’ developed by FAA. 17 Following the guidelines provided, nitrogen agent was chosen by the consortium for study in this project, due to its desirable properties and compliance in operation. Nitrogen shows good compliance to the desired characteristics 3 (see Table 3)
Nitrogen compliance matrix. 3
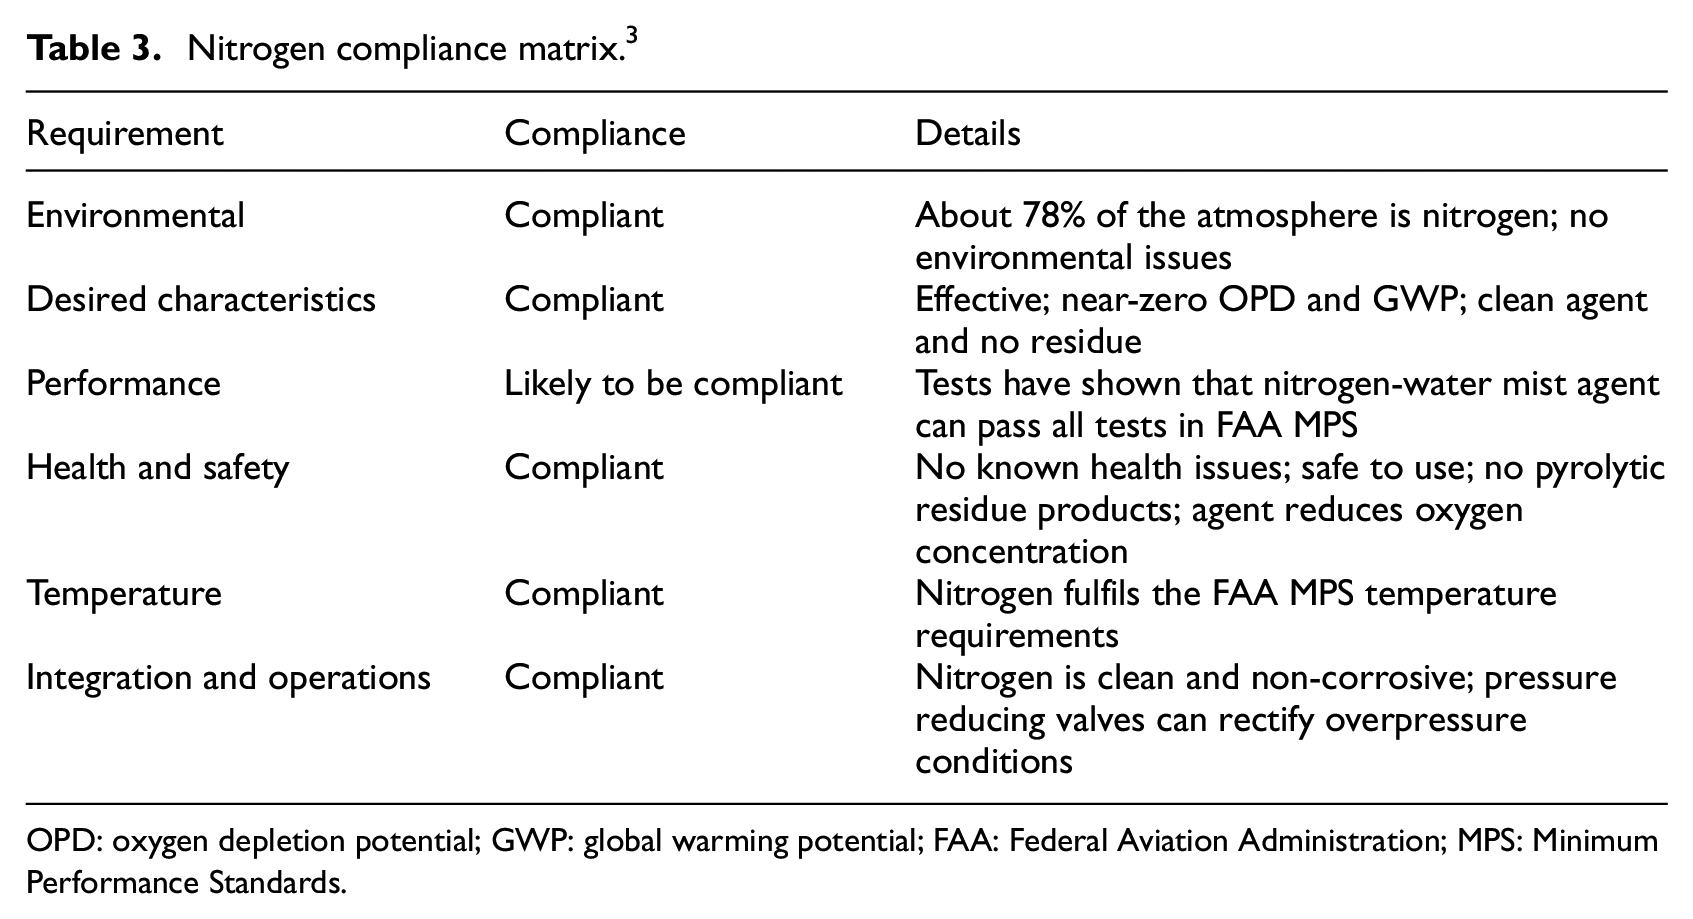
OPD: oxygen depletion potential; GWP: global warming potential; FAA: Federal Aviation Administration; MPS: Minimum Performance Standards.
In 2007, Reinhardt also presented explosion test results to investigate the synergic effects of mixing halon 1301 and nitrogen. 18 The results were classified as ‘Antagonism’– less efficiency as predicted from individual effects of the pure agents.
In 2013, Linteris and colleagues 19 realised that the FAA ‘aerosol can’ test was too complicated to examine in simulations to validate models against the experimental data. In 2014, Gatsonides and Chattaway 20 presented new laboratory-scale equipment providing better possibilities to investigate the suppression mechanisms. Some further results were presented based on burning velocity measurements and simulations for understanding the performance of agents. 21
More recently, Boeing conducted a new campaign of halon 1301 and CF3I MPS tests. Results indicated that surface burning tests with this agent passed the MPS criteria with 5.3% volume concentration of CF3I and the aerosol explosion test passed with 3.2% concentration. 7
Computational fluid dynamics (CFD) and cup-burner tests conducted to estimate the design concentration of nitrogen for successful fire suppression was found to be between 35% and 39% depending on the size of the enclosure. 3 This study was used as a baseline for estimating the amount of nitrogen required for the experiment with an enclosure volume of 57 m3.
According to FAA’s MPS document, 13 the fire suppression system must be activated 60 s after any one of the thermocouples equals or exceeds a temperature reading of 93.3°C for bulk-load, containerised-load and surface burning tests. The aerosol test simulator must be activated 2 min after system activation. All the tests must be repeated 5 times. Additional system acceptance criteria were presented in Table 1.
Apparatus
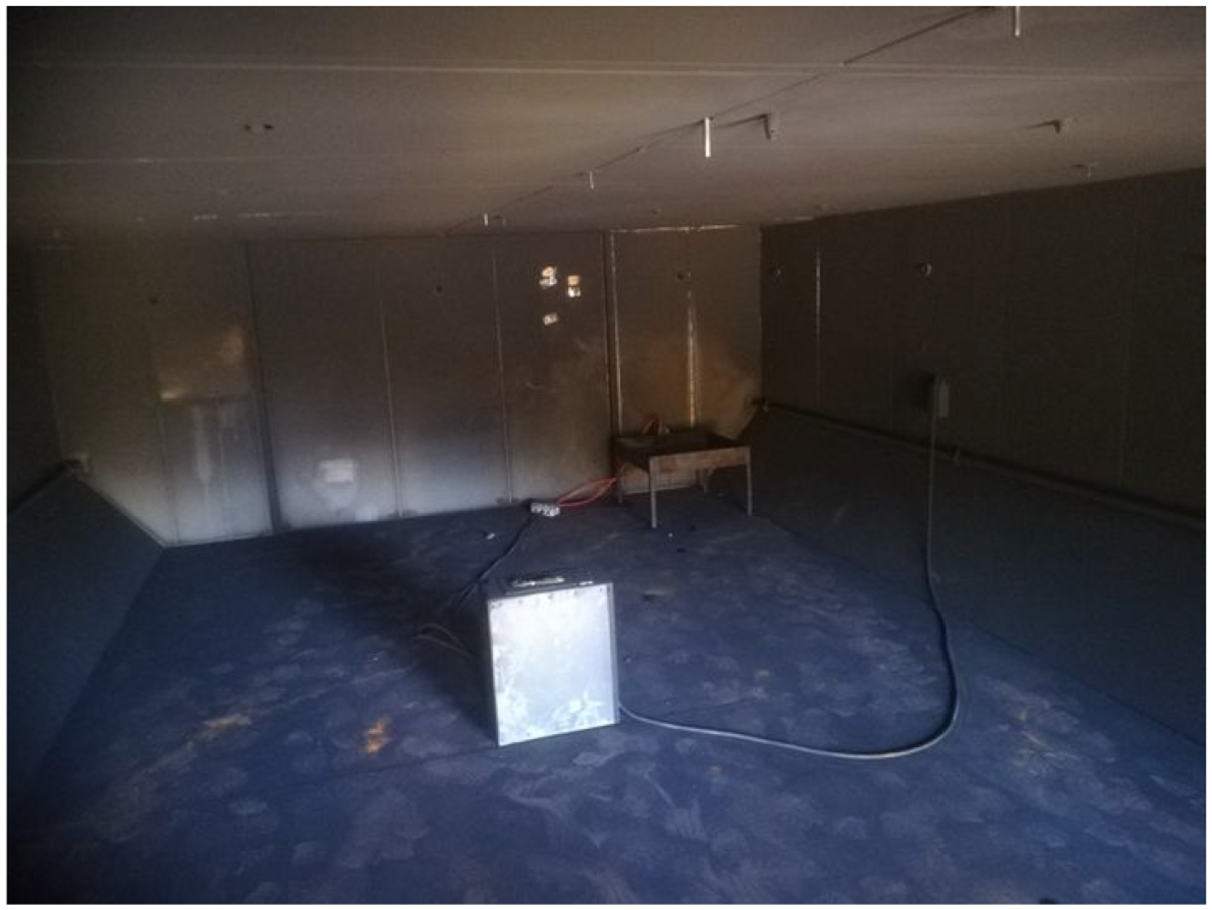
For the purpose of the experiment, the front cargo compartment of a wide-body aircraft was constructed in accordance with the dimensions specified in the MPS 13 having an internal volume of 56.6 m3. The internal configuration replicates a cargo bay (Figure 2).
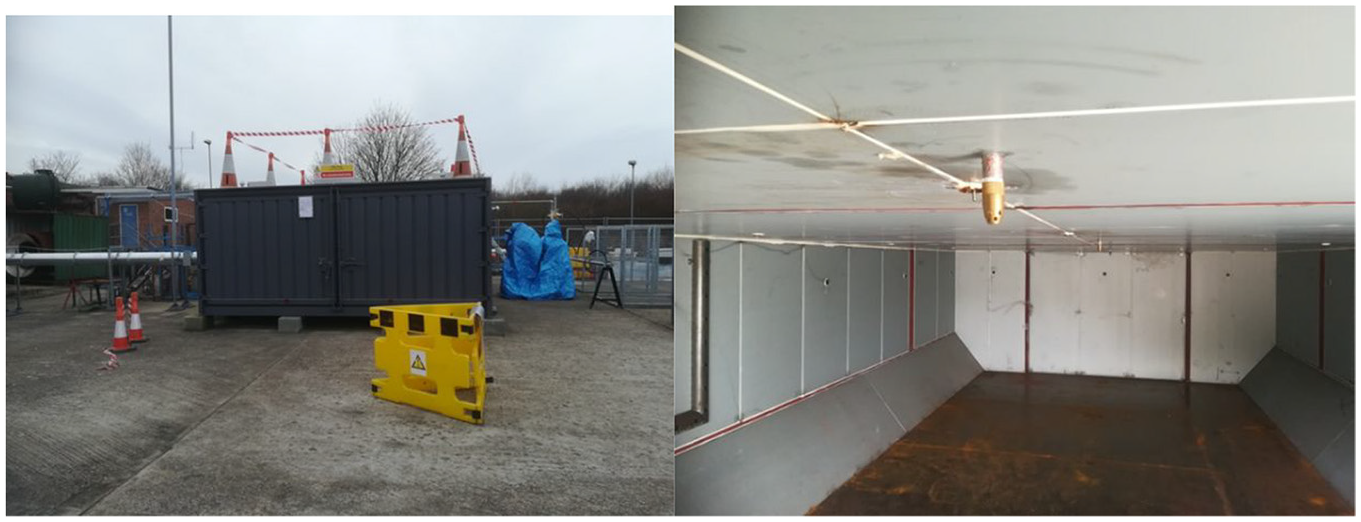
Cargo hull simulator.
Agent storage and delivery system
Compressed nitrogen was stored in five cylinders, each of 9.8-m3 volume with a pressure of 230 bar. The agent was regulated to 40 bar upon system activation and was guided through a variable diameter piping arrangement to three discharge nozzles. The nozzles were located along the centerline of the simulator at a 2500-mm pitch (Figure 3). Variable diameter piping was applied to compensate for significant pressure loss after the first nozzle discharge, so that the pressure which eventually reached the final nozzle was sufficient to obtain the required spray cone. Six-hole commercial spray nozzles were used (P/N NF35150), with an adjustable flow rate and a maximum value of 33 kg/min. The ceiling mounting allowed for a 360° spray cone coverage with a radius of 7 m (Figure 4).
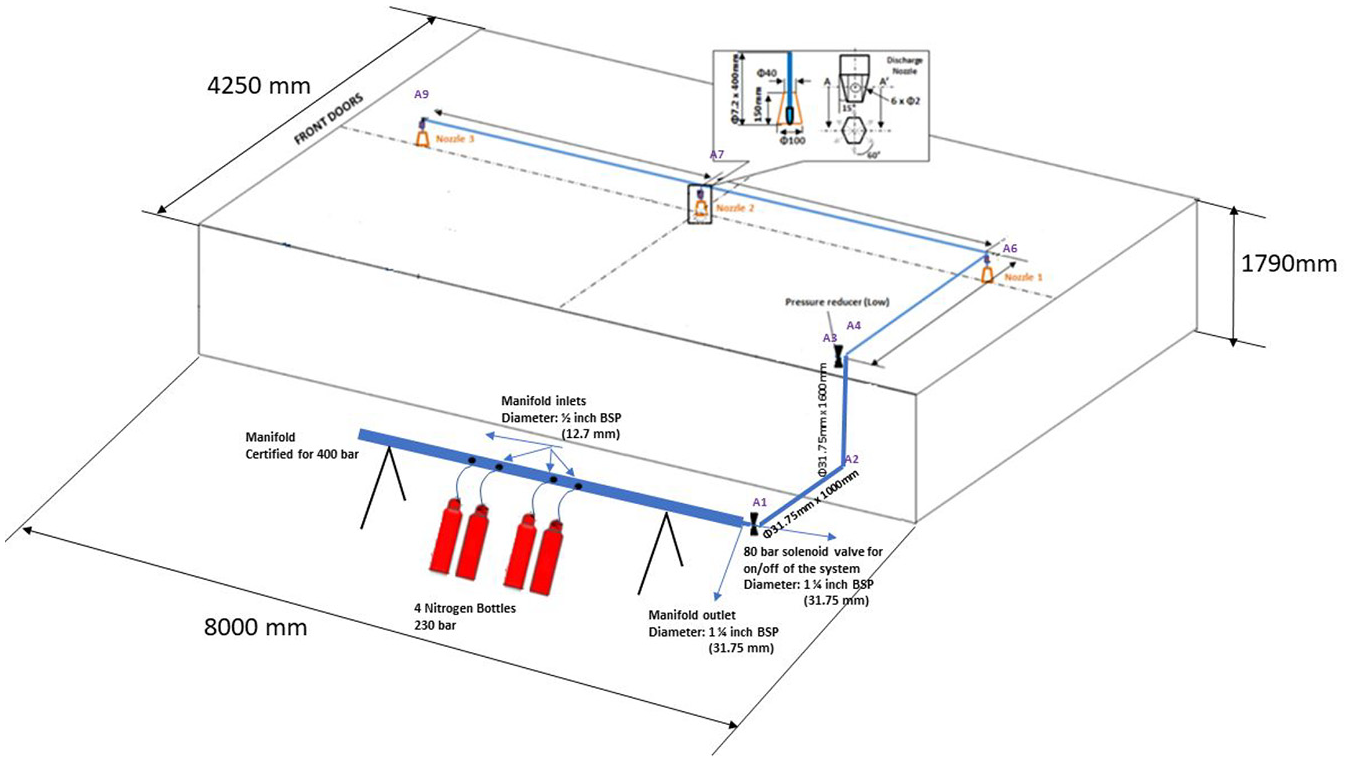
Nitrogen discharge system layout.
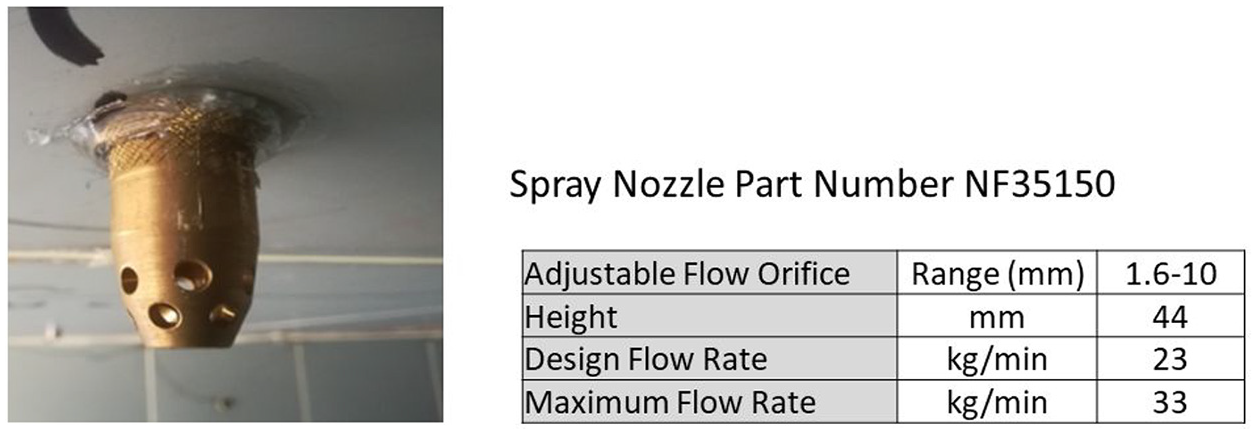
Nitrogen discharge nozzles.
Cargo door leakage simulator
Representative simulation of air leakage through the cargo door was set up as required by MPS. The leakage simulator design involved a ‘U’-shaped duct, perforated with 38 equally pitched holes of 12.7-mm diameter (Figure 5). The typical value of the leakage flow rate was estimated to be 23.2 L/s which was obtained through a variable speed fan and high accuracy measurement of the flow.
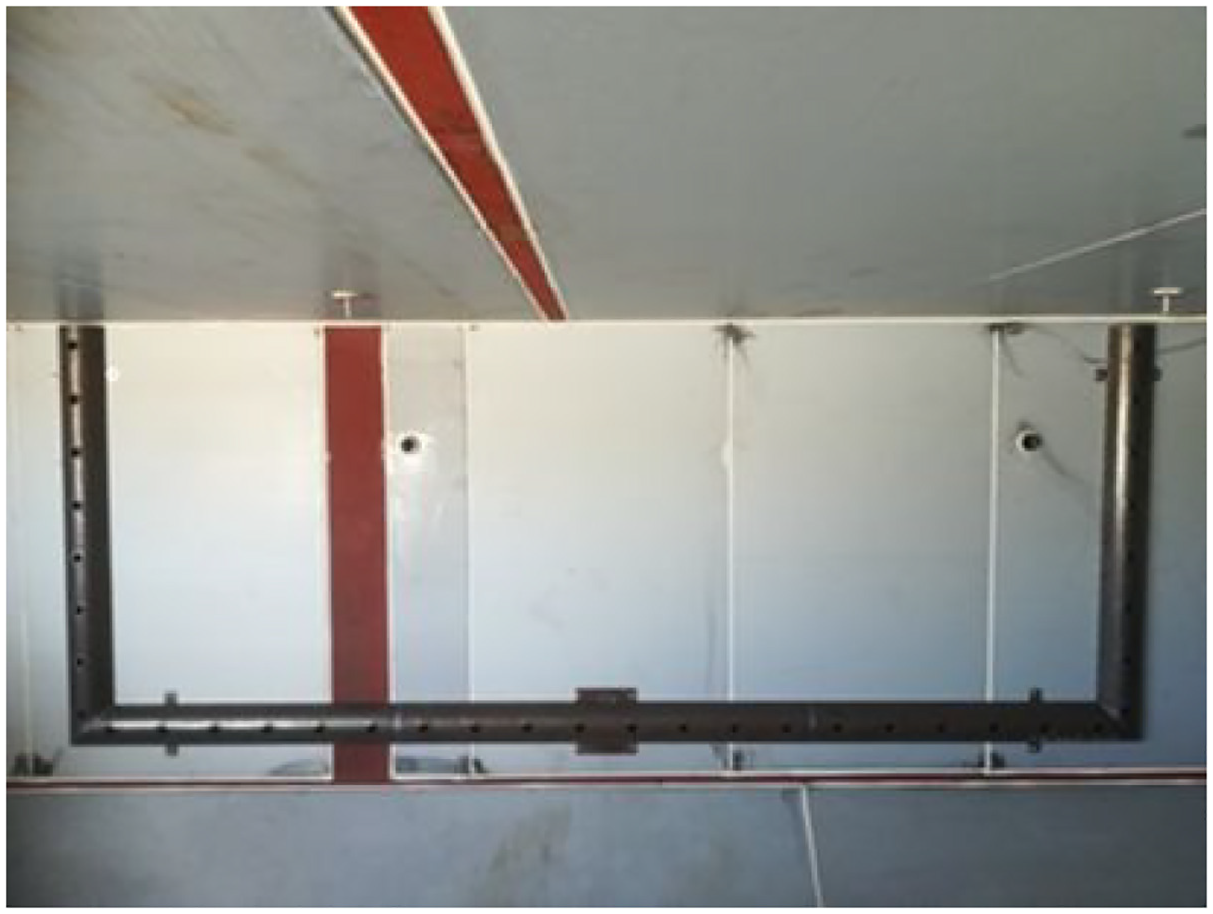
Leakage simulator.
Ventilation system
A ventilation system was installed to simulate the injection of pressurised air into the cargo compartment in a realistic situation. Since the experiment was conducted at sea level conditions, the ventilation tubes provided ambient air to compensate for the amount of air extracted by the leakage simulator and prevented the fire from oxygen starvation at the start of the experiment. The system comprised 2 pipes with 27-mm internal diameter, which ran along the both sides of the simulator (Figure 6). Each pipe accommodated 9 circular ports of 12.7-mm diameter equally distributed along the pipe, with an external manual flow regulation valve.
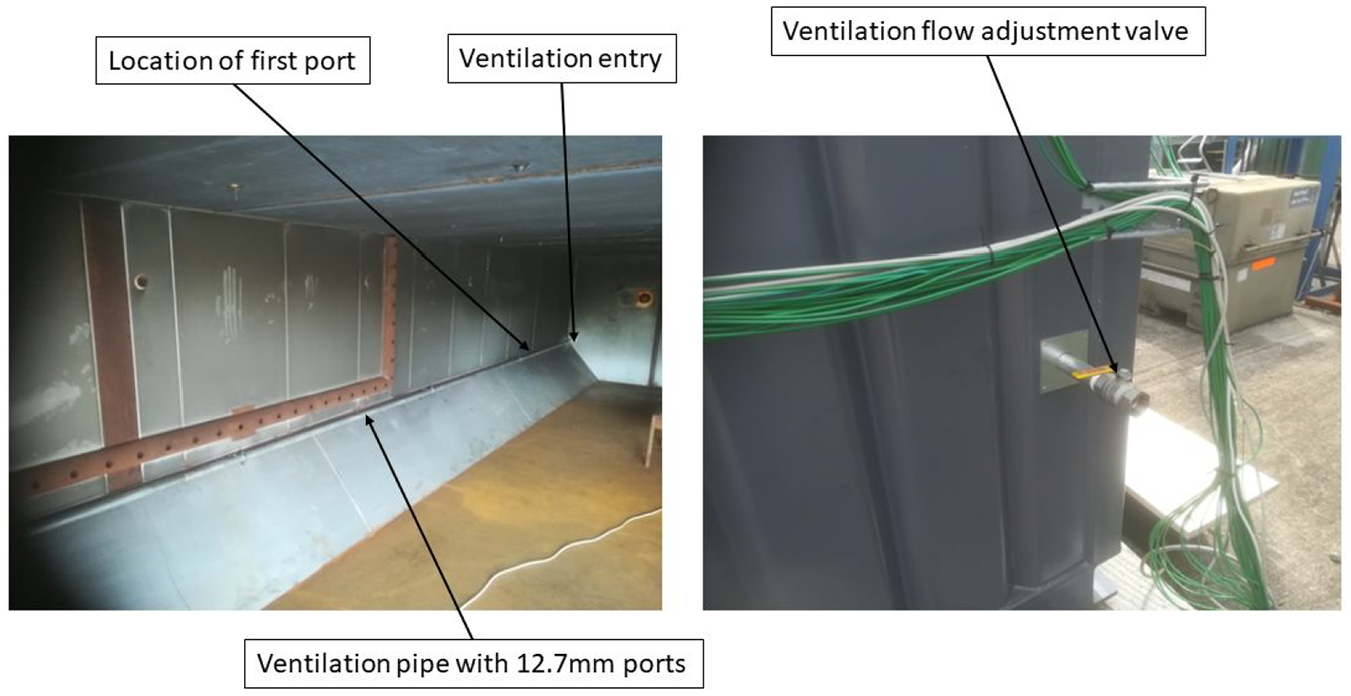
Ventilation system.
Instrumentation
A total of 33 ‘K-type’ thermocouples were installed throughout the container, as shown in Figure 7. They were placed 50 mm clear from the walls and the ceiling. The pitch between them was set to 1500 mm. The thermocouples were sheathed for protection from the harsh environment during the tests. The probe diameter was 6 mm and the length was 150 mm. With an immersion of 50 mm, they have an immersion-diameter ratio of 8.33 times, ensuring accuracy of temperature measurement between 1% and 0.01%. 22 The data acquisition system comprises four NI9213 DAQ cards, which indicate a maximum temperature measurement error around 2.5°C when measured temperature is 100°C for the system configuration applied. The crucial value for the experiment was 93.2°C when the countdown for the nitrogen system discharge commenced. However, as it can be from the measurements during the surface burning test, the temperature increase rate prior to the triggering value exceeded 6°C/s; hence, even a worst-case measurement error scenario of 2.5°C would have only affected the triggering moment by approximately 0.4 s, which is of negligible impact on the suppression process.
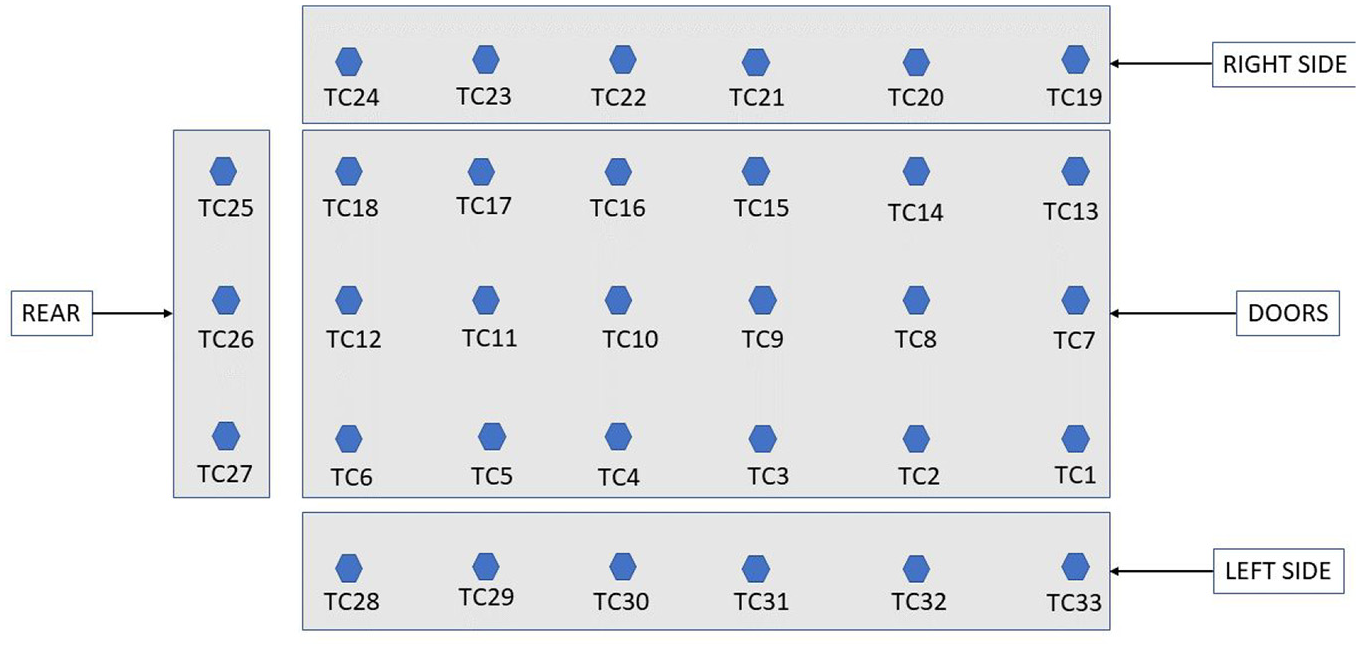
Thermocouple positions (top view).
Internal pressure of the cargo compartment was monitored and recorded at a rate of 3000 samples/s with the use of a sensitive piezoelectric pressure transducer (Kulite XCQ93), capable of sampling up to a rate of 175 kHz. The uncertainty of this measurement was calculated to be 103.4 Pa (0.015 psi).
Three Mitchell Instruments XZR200 Oxygen analysers were installed to measure and record the oxygen concentration inside the demonstrator. They are capable of withstanding temperatures up to 400°C, and they were located at the central transverse plane of the demonstrator at 5 cm below the ceiling, 60.9 cm below the ceiling and 20 cm above the floor, as required by the MPS. 13 With an accuracy of 0.55% for full scale (25% concentration is full scale value), the total error of the oxygen concentration was calculated to be 0.1375%.
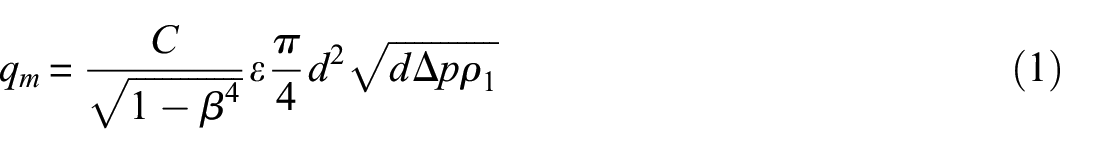
The flow rate for the door leakage simulator was measured by installing a custom-designed orifice plate in the flow path between the simulator and the fan. The flow rate measurement was achieved by recording the drop of static pressure across the orifice plate (Figure 8) using equation (1)
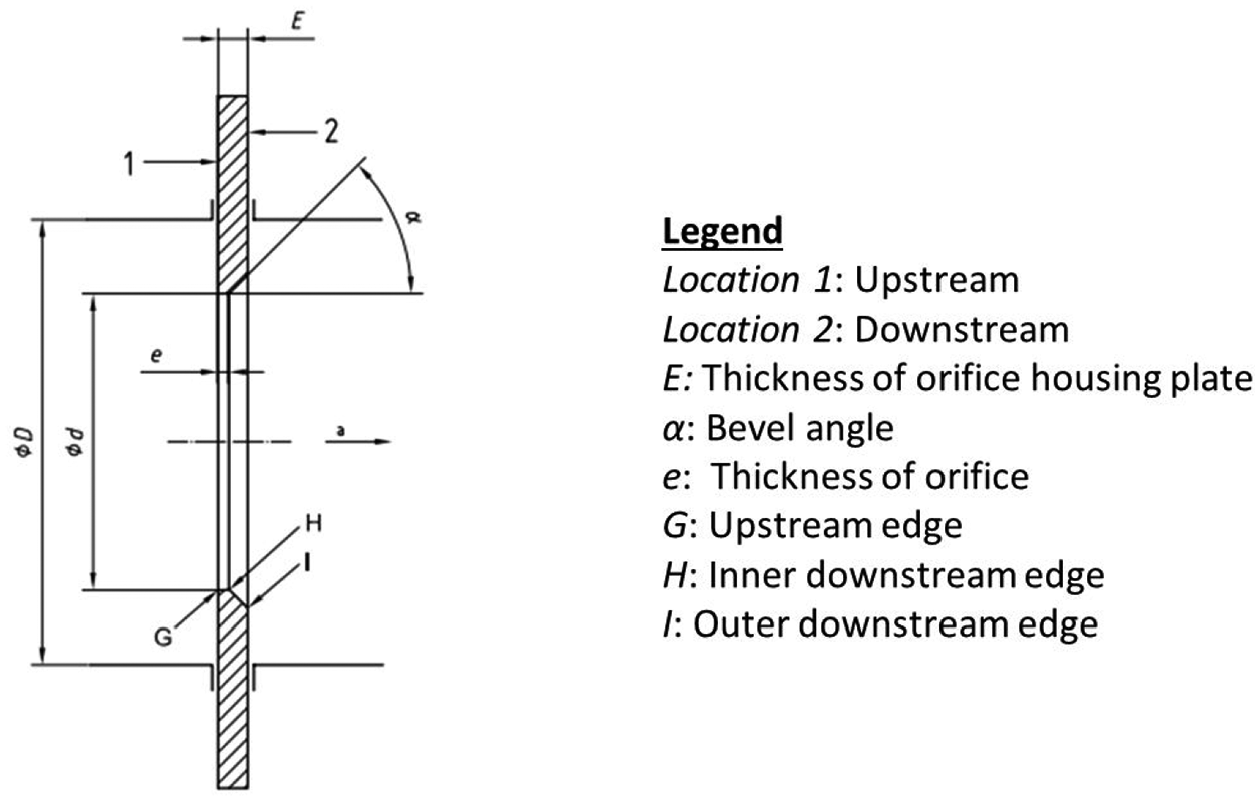
Orifice plate layout.
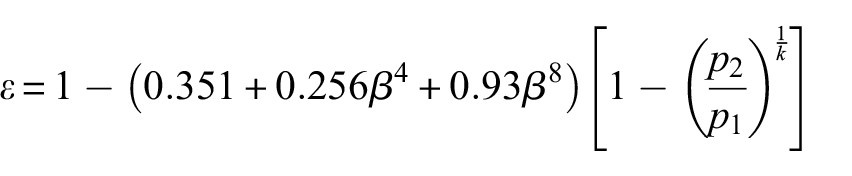
The discharge coefficient is derived as a function of β, Reynolds number and the location of the pressure tappings relative to the pipe diameter. 23 The expansion factor ε is derived from equation (2)
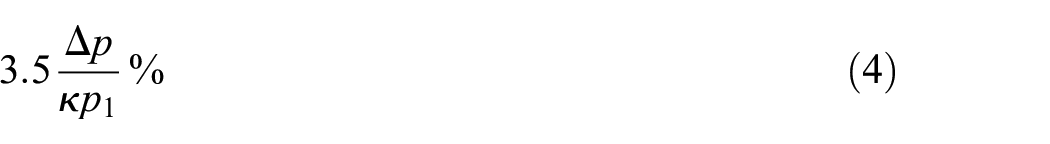
For the pressure drop measurement, two Omega PXM409 pressure sensors were used, with an accuracy of 0.08% of full scale output, which corresponded to 28 Pa. The overall flow rate measurement uncertainty was calculated by taking into account the uncertainties for parameters C and ε, as defined by the relevant standard 23 and listed in equations (3) and (4) respectively

The total error propagation in flow rate measurement is given by equation (5)
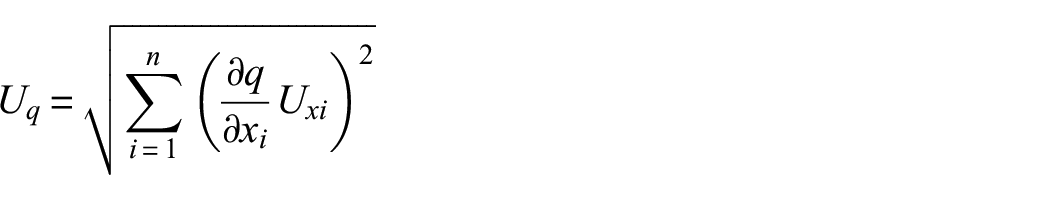
There were four elements of uncertainty in equation (5). These are the elements in equation (3), equation (4), differential pressure measurement and density measurement. By substituting them in equation (5), the overall uncertainty of flow rate measurement was calculated to be 0.7%. This corresponds to an error of 23.3 ± 0.16 L/s for the leakage simulator flow rate measurement.
MPS experiments
All the four MPS test scenarios are presented herein. The surface burning test was conducted to verify the efficacy of compressed nitrogen against re-ignition of Class B fires. Aerosol can explosion scenario was conducted to ascertain that the alternative agent can sufficiently prevent hydrocarbon explosion of heated aerosol containers in the luggage, in the case of a cargo compartment fire. For the containerised-load and bulk-load fire scenarios, it was agreed by the project consortium only the short version (30 min) of the experiments was sufficient for the purposes of this project.
Surface burning fire scenario
This scenario was conducted with a steel constructed pan with a support to stand that was 305 mm above the cargo compartment floor, which was the stated MPS requirement for a gaseous suppression medium less dense than air. The specified dimensions were 609 × 609 × 102 mm (Figure 9), and the pan was located at a disadvantageous position away from any spray nozzle. In the current apparatus, it was located at a far corner of the cargo compartment (Figure 9). The pan contained 1.9 L of Jet A fuel, 9.5 L of water for protection against the fire and 0.385 L of gasoline to increase the chance of ignition. The mixture was ignited remotely by powering oil igniters that generated a high voltage electric arc, 64 mm above the mixture surface.
Surface burning pan location.
The scope of this study was to challenge the efficiency of compressed nitrogen against prevention of re-ignition of Class B fires in the cargo compartment. Five test runs were conducted to confirm repeatability and reliability along with a baseline case which proved the test would have failed if suppression had not been applied. The tests were run in accordance with Table 1.
The data that were evaluated against the MPS criteria were those recorded between 2 and 5 min after suppression commenced. Nitrogen was discharged until all three oxygen analysers indicated oxygen concentration of 11% per volume.
Aerosol can explosion simulation scenario
For the aerosol explosion simulation test, an appropriate pressure vessel was manufactured out of Schedule 80 steel pipe in accordance with the guidelines of MPS. 13 The vessel has ports for filling, and the mixture was released from the bottom after a rotary actuator opened the port in a very rapid movement. To generate the aerosol mist, a mixture of 20% liquid propane (0.090 kg), 60% ethanol (0.270 kg) and 20% water (0.090 kg) by mass was supplied into the vessel. The ignition electrodes were placed 3 ft away from the mist exit, 0.25 inches apart and were charged with 10,000 V during the ignition. The components and the arrangement are shown in Figure 10.
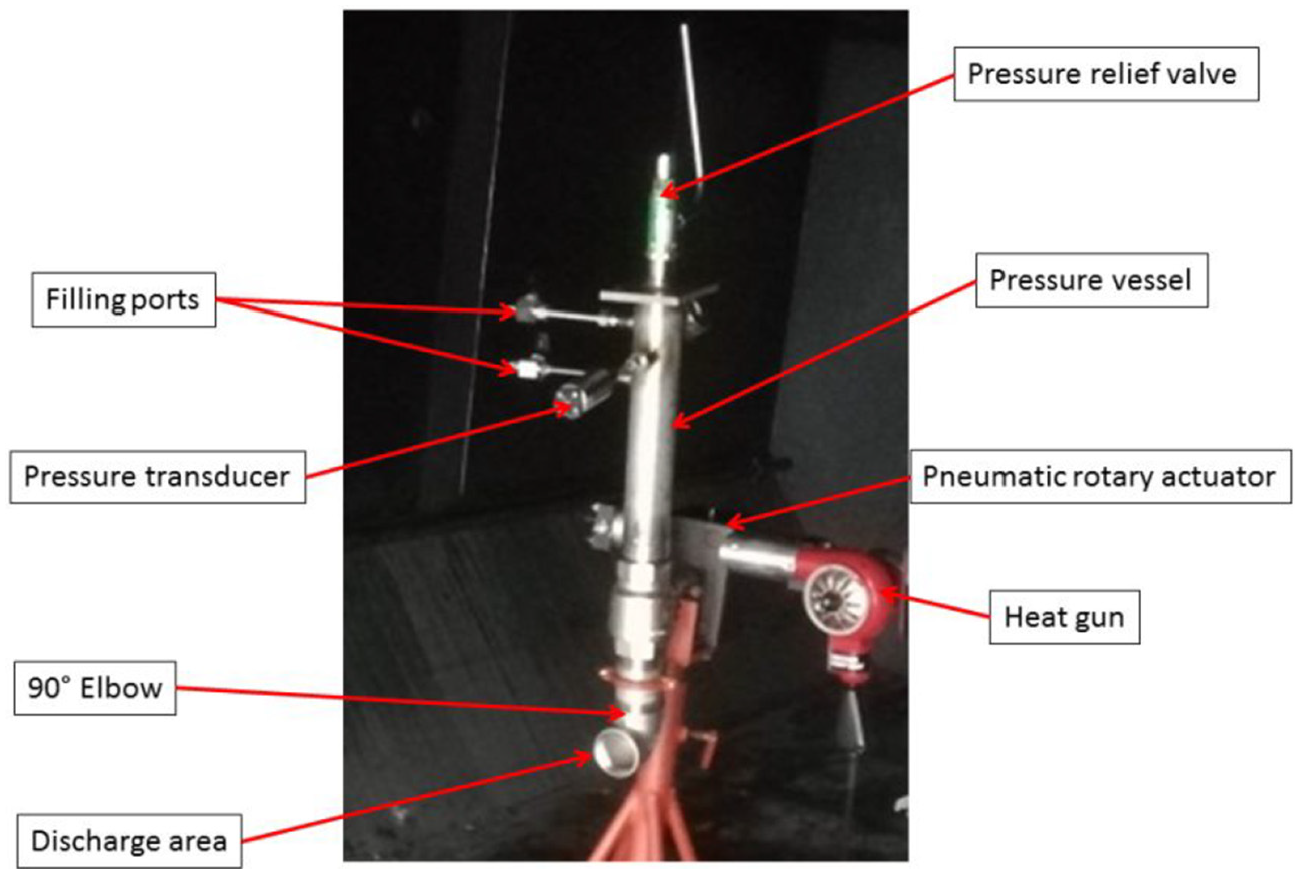
Aerosol can explosion simulator.
The nitrogen was discharged to reduce oxygen concentration to 12% by volume. Two minutes after the concentration was stabilised, the mist was released onto the igniting electrodes, as required by MPS. 13 Prior to the mist discharge, a heat gun was used on the vessel, so that internal pressure of the vessel increased to 1.65 MPa (240 psi). According to MPS, the opening of the vessel ball valve by the rotary actuator was to be completed within 0.1 s. To ascertain this, a dedicated testing apparatus was configured to verify the required pressure supply to actuator in order for the opening process to be kept within the 0.1-s time frame. The transition time from closed to open position was measured to be 0.067 s, which was noticeably lower than the required value according to the MPS.
The experiment required the electrodes to be in the same plane with the gas analyser probe and 45.7 cm to the side. This was not feasible with the current configuration, due to different locations of the O2 sensors that were used. Electrodes were positioned near the side wall of the cargo compartment to obtain the necessary proximity to the O2 sensor. Another issue was the proximity of the arrangement to the side wall. If the electrodes were placed 45 cm away from the O2 sensor, the flow of the discharged mist could have been reflected from the wall, altering the results of the test. Hence, the electrodes and vessel were situated 90 cm away from the O2 sensor. The high sampling pressure transducer was also in the same plane, between the side wall and the electrodes, 5 cm below the ceiling. The functionality of the aerosol simulator was verified by replicating the test sequence in ambient conditions. The explosion was obvious and was recorded on camera (Figure 11).
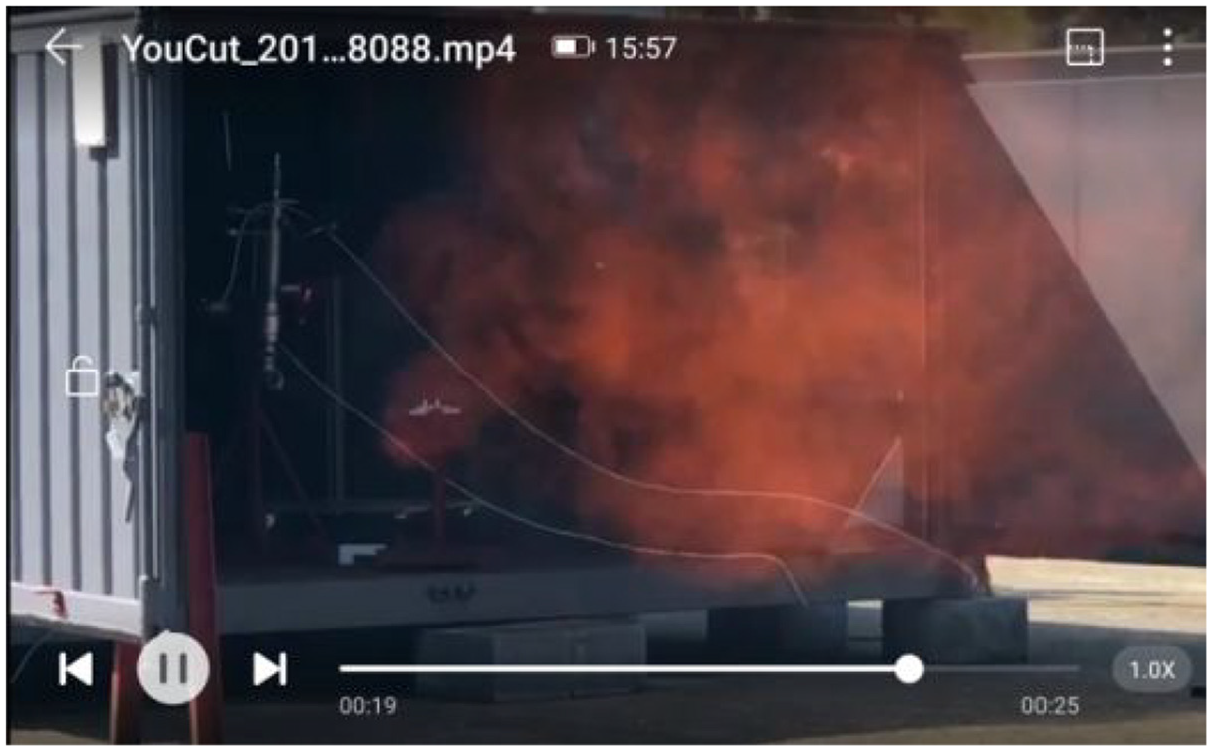
Aerosol can simulator explosion test.
Before proceeding with the actual test runs, an additional baseline run was conducted to observe the pressure rise inside the cargo compartment simulator during the high pressure mist release. Nitrogen was discharged to reduce O2 concentration down to 12%, but the electrodes were not ignited. The recorded pressure rise was around 2.5 mbar.
In the tests, nitrogen was discharged to reduce oxygen concentration down to 12% per volume. Two minutes after the oxygen level was stabilised, the vessel pressure was adjusted back to 1.65 MPa (240 psi) by operating the heat gun. The ignition was switched on and the mist was discharged. The process was recorded on camera. All actions of control and monitoring were conducted remotely. The scope of this test scenario was to observe efficacy of nitrogen in prevention of hydrocarbon explosions. This was proven with no visual evidence of explosion and no further increase in compartment internal pressure.
Containerised-load fire scenario
This scenario required the use of three LD3 containers placed inside the cargo compartment simulator. The LD3 containers were placed inside the cargo compartment as per the MPS guidelines. 13 One of the containers was loaded with 33 cardboard boxes filled with 1.1 kg of shredded paper. The container was practically against the walls of the compartment. The open side was covered by a transparent polycarbonate sheet according to the MPS. 14 One empty container was placed in front of the loaded one and another one was placed adjacently to the left (Figure 12). Five test runs were conducted with suppression and one unsuppressed.
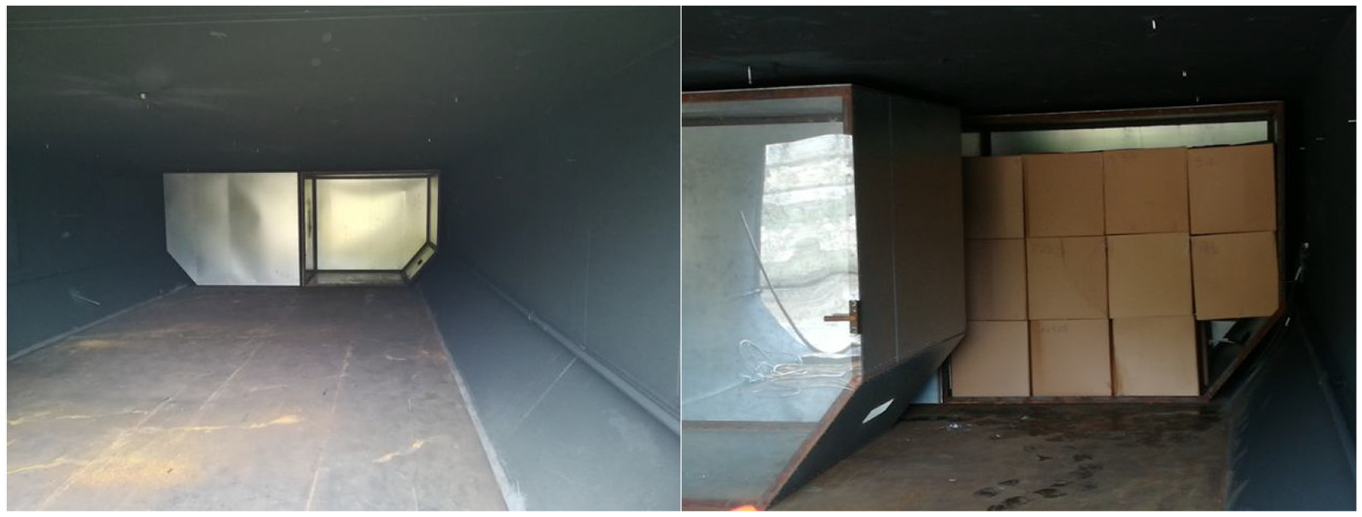
Containerised-load test arrangement.
The igniter box was placed in the middle of the lower row nearest to the compartment wall. Nichrome wire was used and wrapped around a paper towel folded, according to the MPS instructions. 14 The igniter box had perforations in the back to allow for sufficient air supply for the fire to start. Ceiling thermocouple TC18 was located almost above the igniter box in this scenario (Figure 13). The leakage simulator and ventilation system were maintained as per previous scenarios. The discharge of nitrogen was triggered 1 min after any ceiling temperature reached 93.2°C, and the evaluation period of the test commenced 2 min after suppression, until 30 min after suppression.
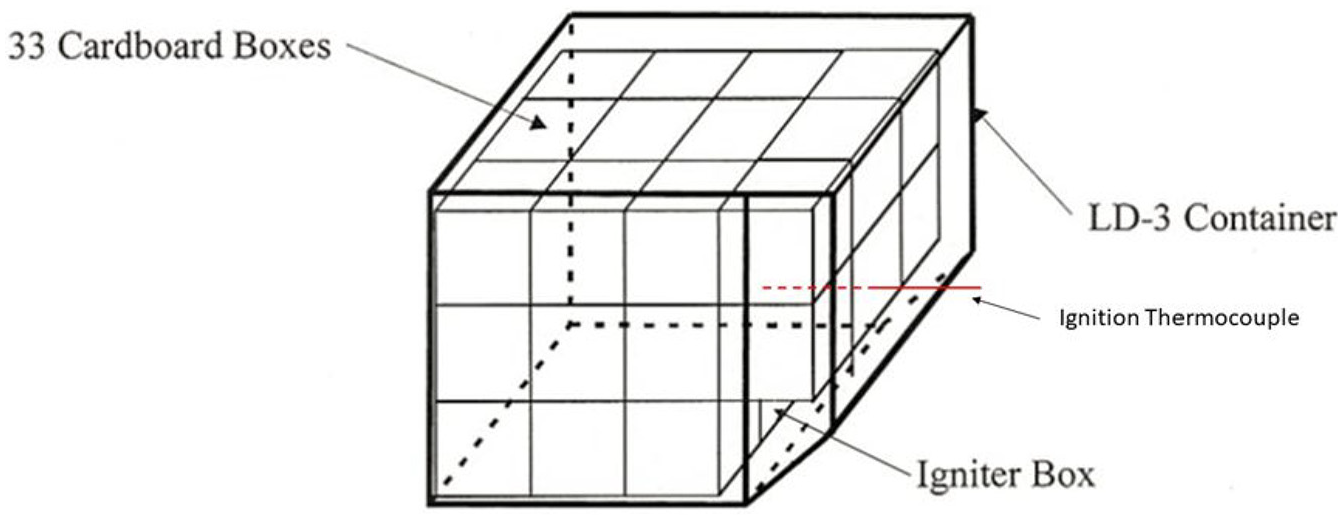
Cardboard box arrangement in the LD3 container. 13
Bulk-load fire scenario
For these series of tests, 178 boxes are stacked in 2 layers (Figure 14) inside the container, occupying 30% of the cargo compartment volume (56.6 m3), as specified in the MPS.13
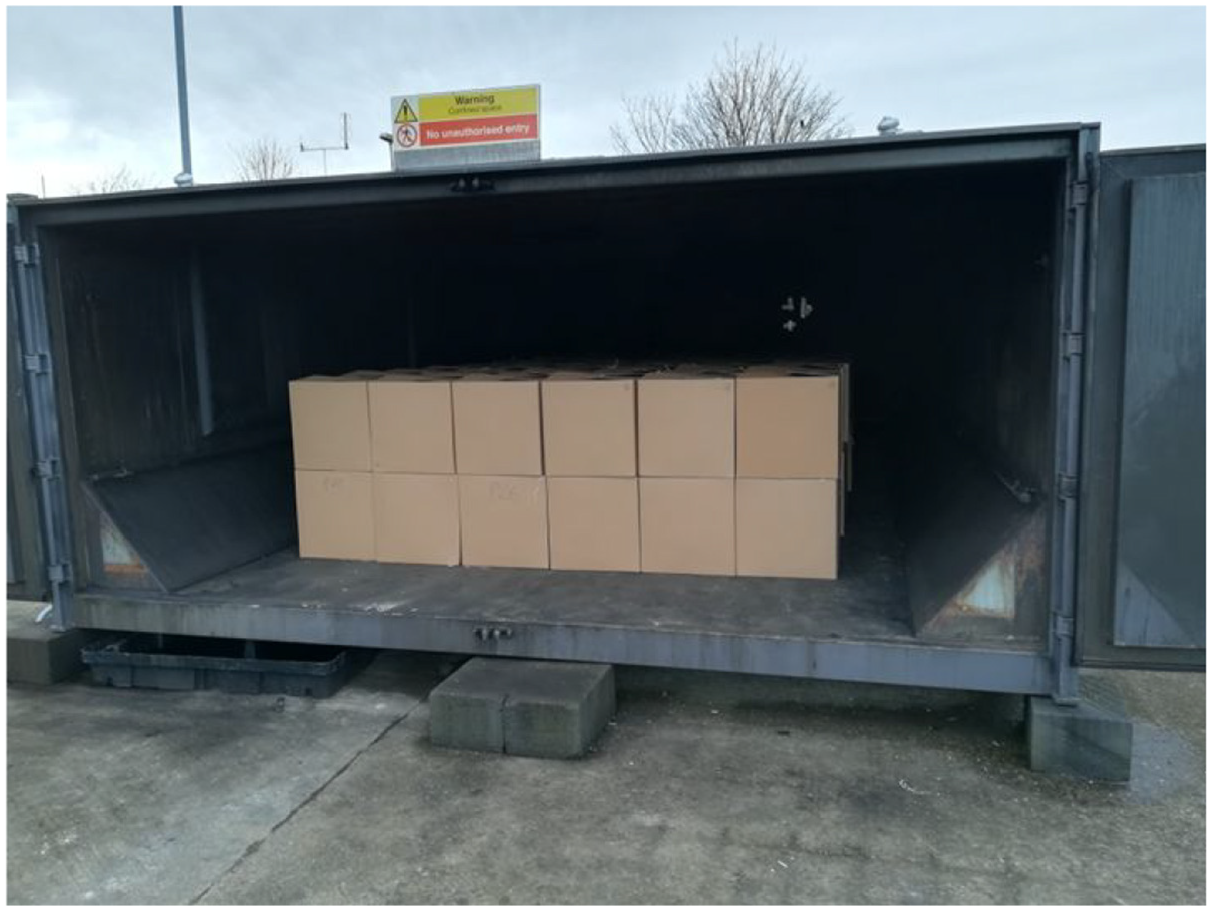
Bulk-load test arrangement.
The igniter box was placed in the fourth row from the forward wall, in the lower layer (Figure 15). Nichrome wire was used and wrapped around a folded paper towel, in accordance with the MPS instructions. 13 Ceiling thermocouple TC17 was located above the igniter box in this scenario. The leakage simulator and ventilation system were maintained as per previous scenarios. The discharge of nitrogen was triggered 1 min after any ceiling temperature reached 93.2°C, and the evaluation period of the test commenced 2 min after suppression, until 30 min after suppression.
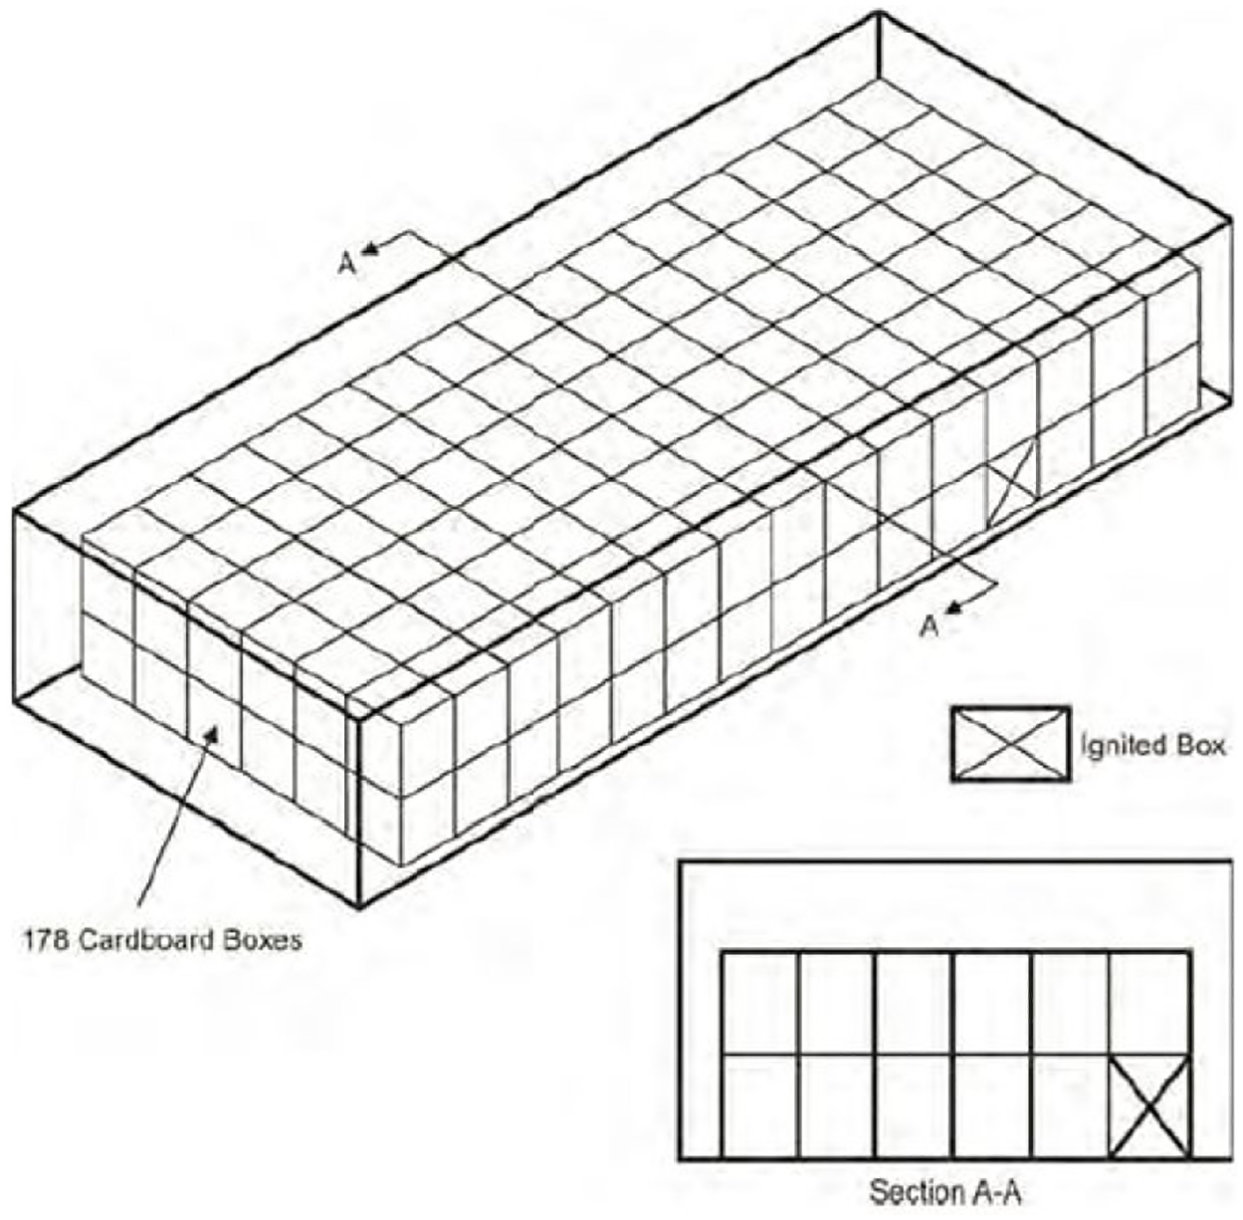
Cardboard positioning and ignition box. 13
Discussion of results
The results for the four scenarios are presented below. It should be noted that five suppressed tests were conducted for each scenario with an additional unsuppressed baseline test. All unsuppressed tests failed the MPS criteria, proving the efficacy of compressed nitrogen as a suppression agent for the current cargo compartment configuration
Surface burning fire scenario
The tests have individually passed the MPS criteria, apart from Run 6 which was conducted as a baseline case without suppression. The temperature profiles showed a rapid increase of temperature right after the ignition, which continued to increase until the nitrogen was discharged (Figure 16). Each line in the plot depicts the output of every single thermocouple during the test. Initially, the plots were constant lines parallel to the x axis. Upon ignition of the fire, changes can be observed in the presented graph. The thermocouples closer to the test pan showed a rapid increase in temperature. The highest value was recorded on thermocouple TC18 as it was located directly above the burning mixture. Point t(sup) denotes the start of the suppression process, where nitrogen was discharged. Within seconds, the temperature started to reduce. The point t(rec) denotes the point after which the evaluation of the data commenced and continued for three further minutes. The peak temperature for the evaluation was recorded along with the area enclosed under the temperature curves for each thermocouple (time/temperature integrals). The temperature profiles were highly consistent for all five test runs.
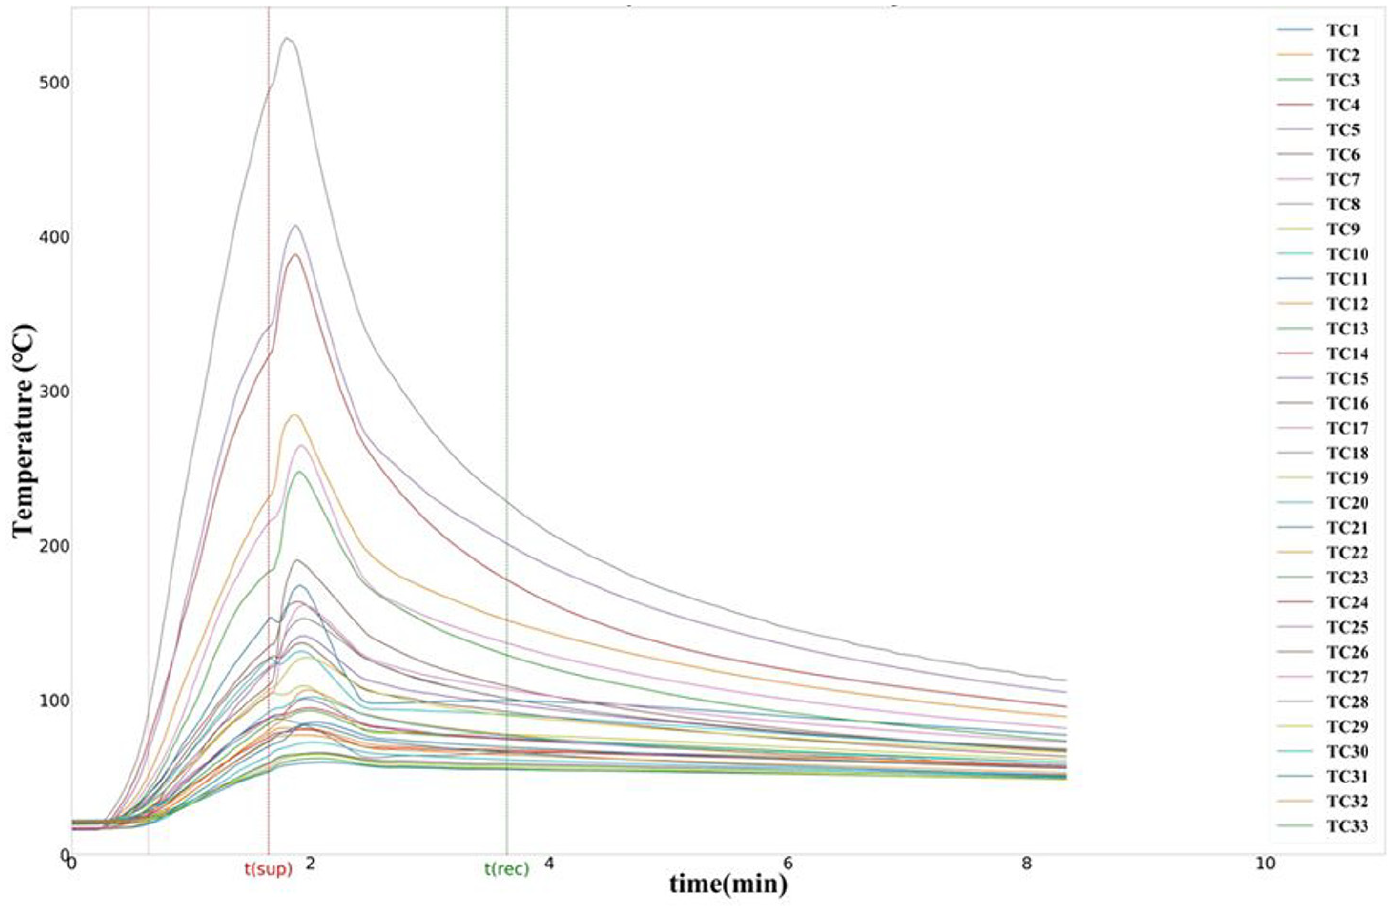
Temperature–time graph for surface burning test.
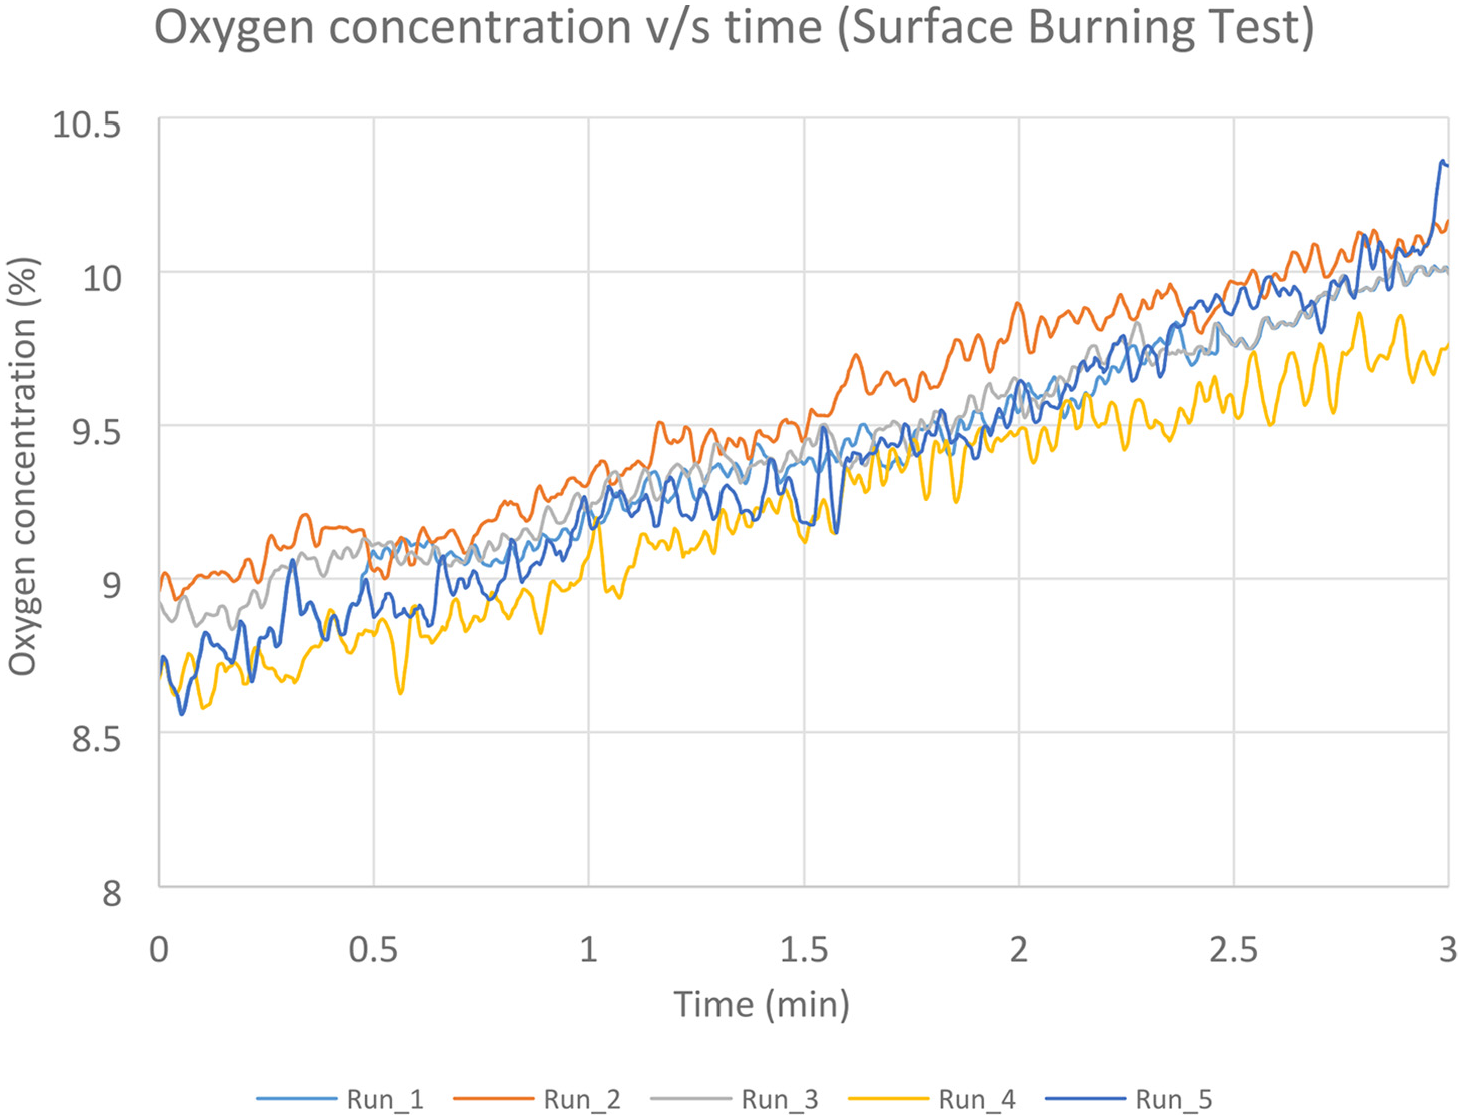
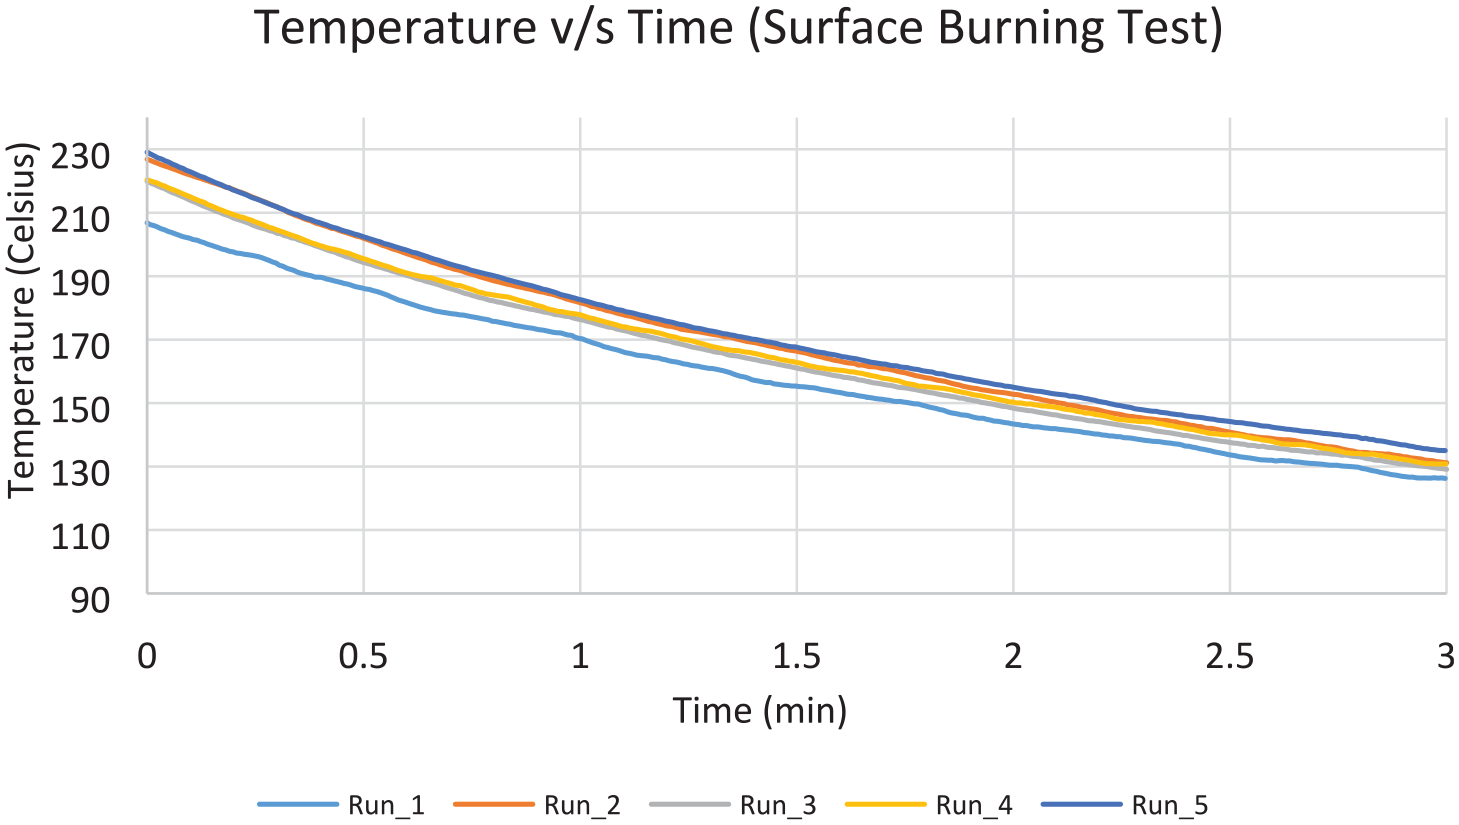
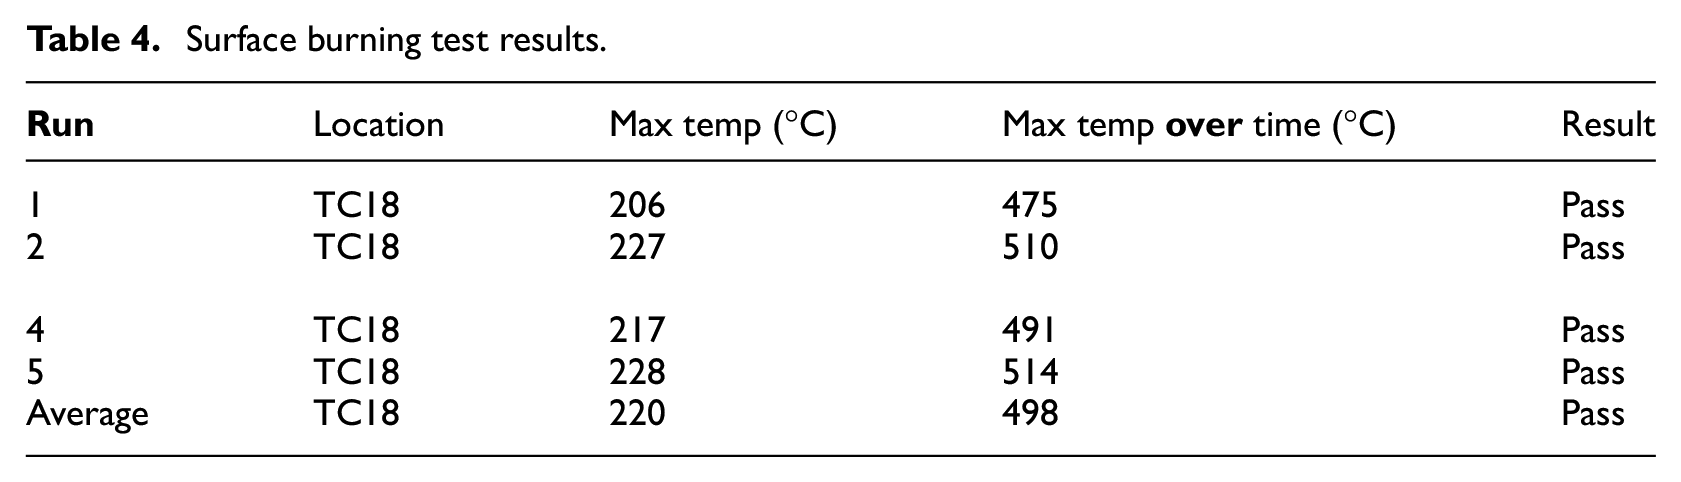
All five suppressed test runs have reached similar values of peak temperatures, and consequently, the temperature–time area was of the same magnitude in all the runs. Figure 17 shows the temperatures decrease from 2 min after suppression until 5 min after suppression (evaluation period). Figure 18 shows the oxygen volume replenishment during the same period. The temperature plots present the highest temperature recorded for each one of the runs. In this test scenario, the highest temperatures were recorded by thermocouple TC18 (Figure 7), which was located directly above the fire source. The temperature decrease for all the runs had approximately the same rate and the peak values did not exceed the MPS limit for each individual test. The average values were found to be 219°C and 498°C–min, respectively. Hence the average peak value satisfied the MPS pass criterion, along with the average time–temperature value. The results for the surface burning test runs are summarised in Table 4. Note that the time = 0 when the evaluation time commences for all the runs below.
Temperature–time graph for surface burning test.
Oxygen concentration values for surface burning test, measured 0.6 m below the ceiling.
Surface burning test results.
Aerosol can explosion simulation scenario
There was no evidence of explosion captured on camera. This can be seen in the frame-by-frame images captured during the mist discharge (Figure 19). The electrode spark remained unaffected by the flow after the discharge. The recorded pressure rise varied from 0.51 to 2.55 mbar, values that match the baseline pressure rise value. Pressure measurements from all runs are shown in Figure 20. Hence, there is no overpressure relevant to the reference value of the pressure rise that has been established in the baseline run.
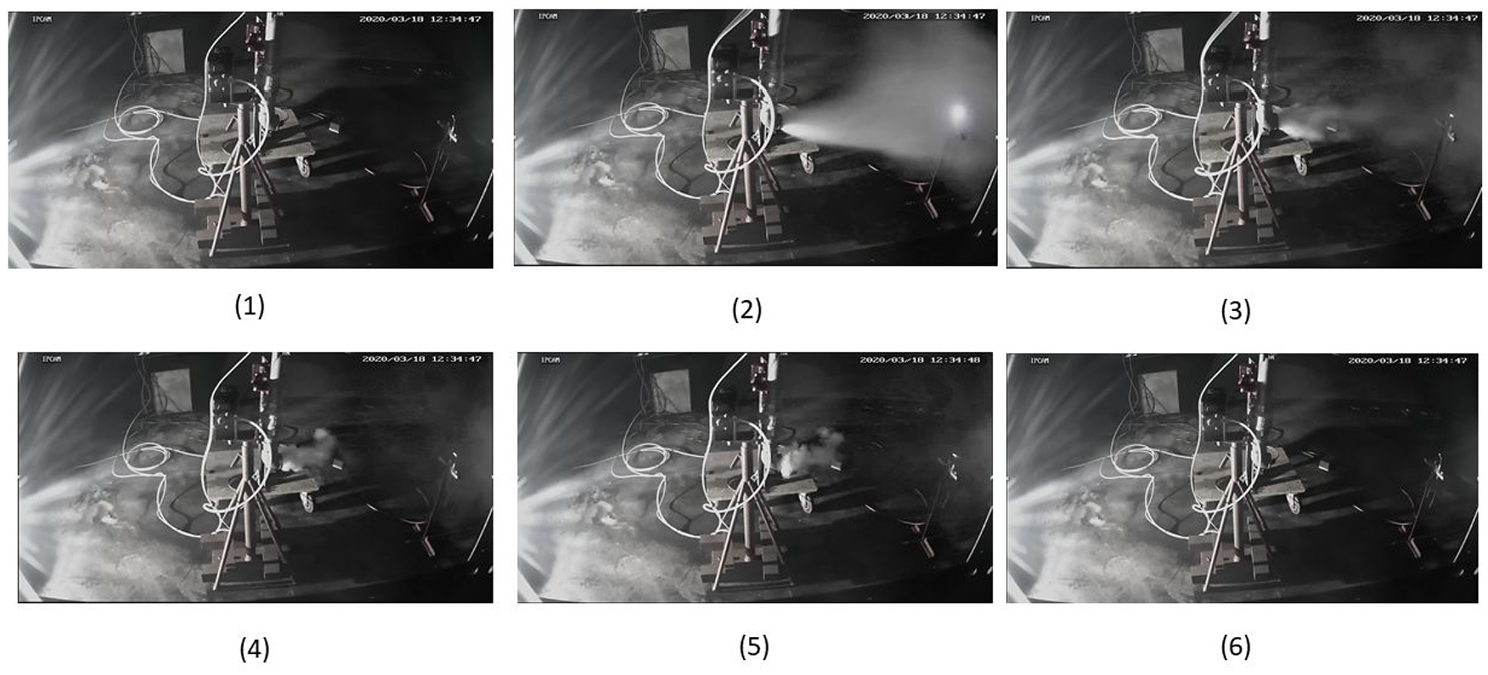
Frame-by-frame images of aerosol explosion simulation test.
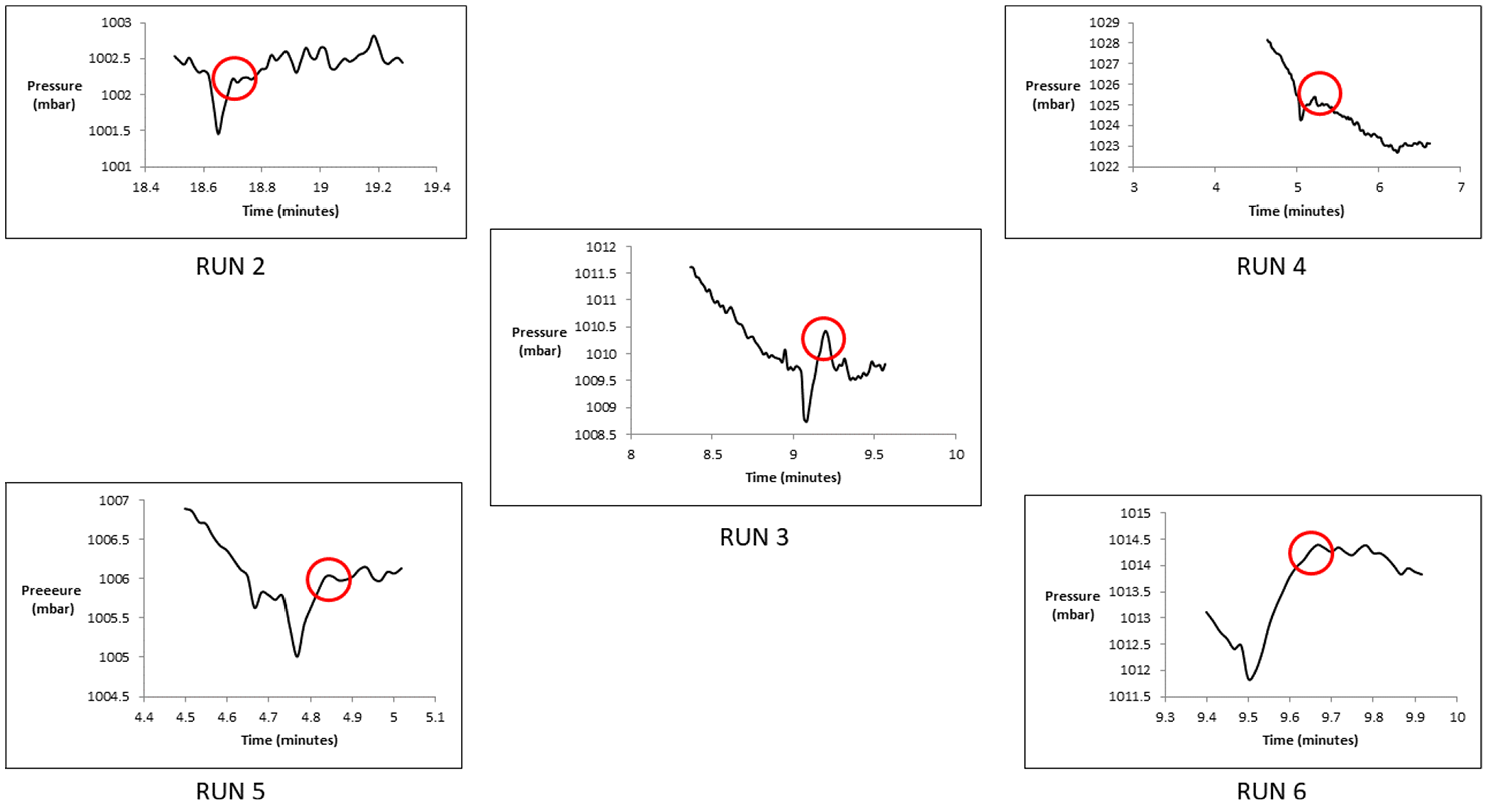
Pressure graph for aerosol can explosion test.
The aerosol explosion tests that were conducted with CF3I by Boeing have also passed the MPS criteria with a pressure peak of 1.2 mbar, which was of the same magnitude of the values detected for the tests described in this article 7
Containerised-load fire scenario
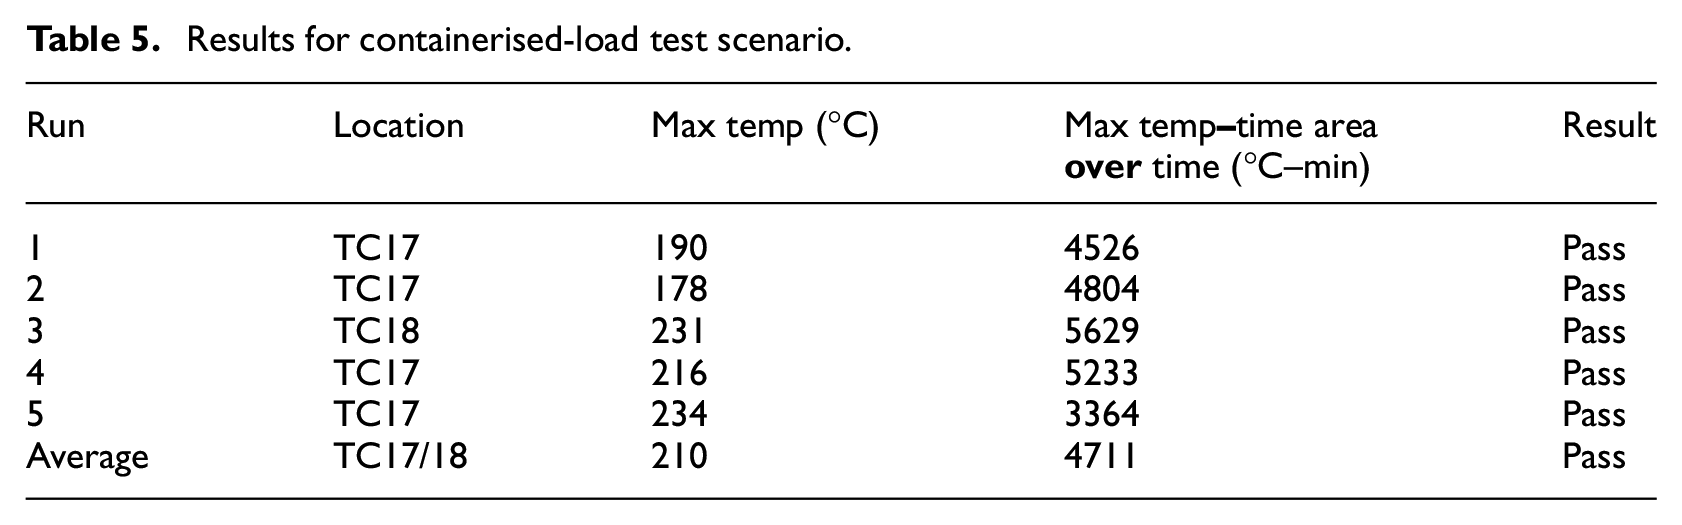
Five suppressed test runs were conducted, along with one baseline run as a baseline. Figure 21 shows the value of the highest observed temperature measurement in each one of the 5 test runs, for the time period 2 min after suppression, until 28 min after suppression. It is noticeable that there is no consistent pattern of temperature profiles, as observed in the surface burning scenario. This is due to random propagation of the fire when new boxes lit up. A slight recovery of the oxygen concentration is shown for the same period of time (Figure 22). The average values were found to be 210°C and 4711°C–min, respectively, hence passed the criteria of the MPS (Table 5).
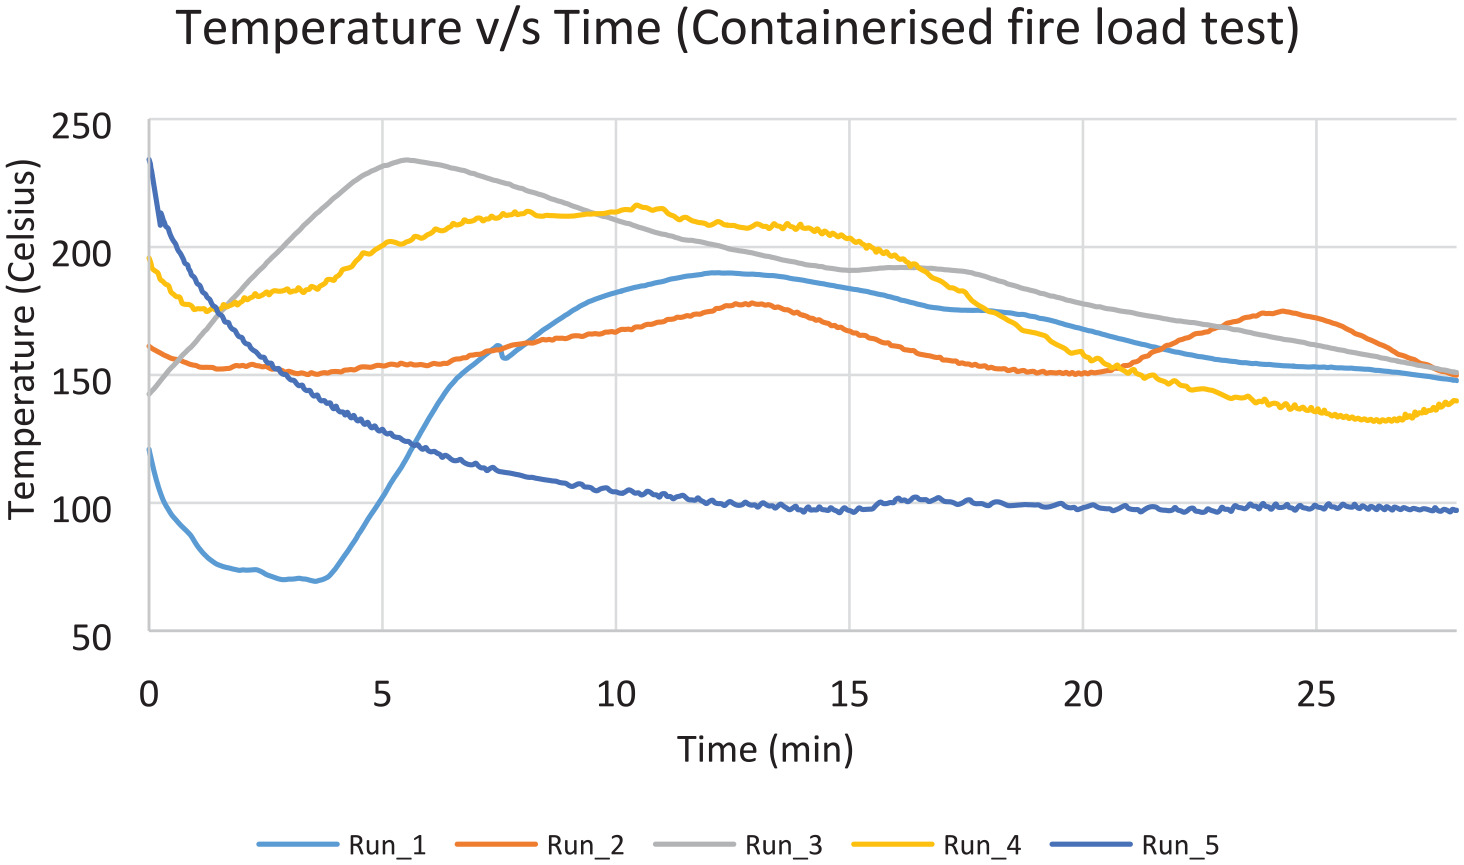
Temperature–time graph for containerised-load test.
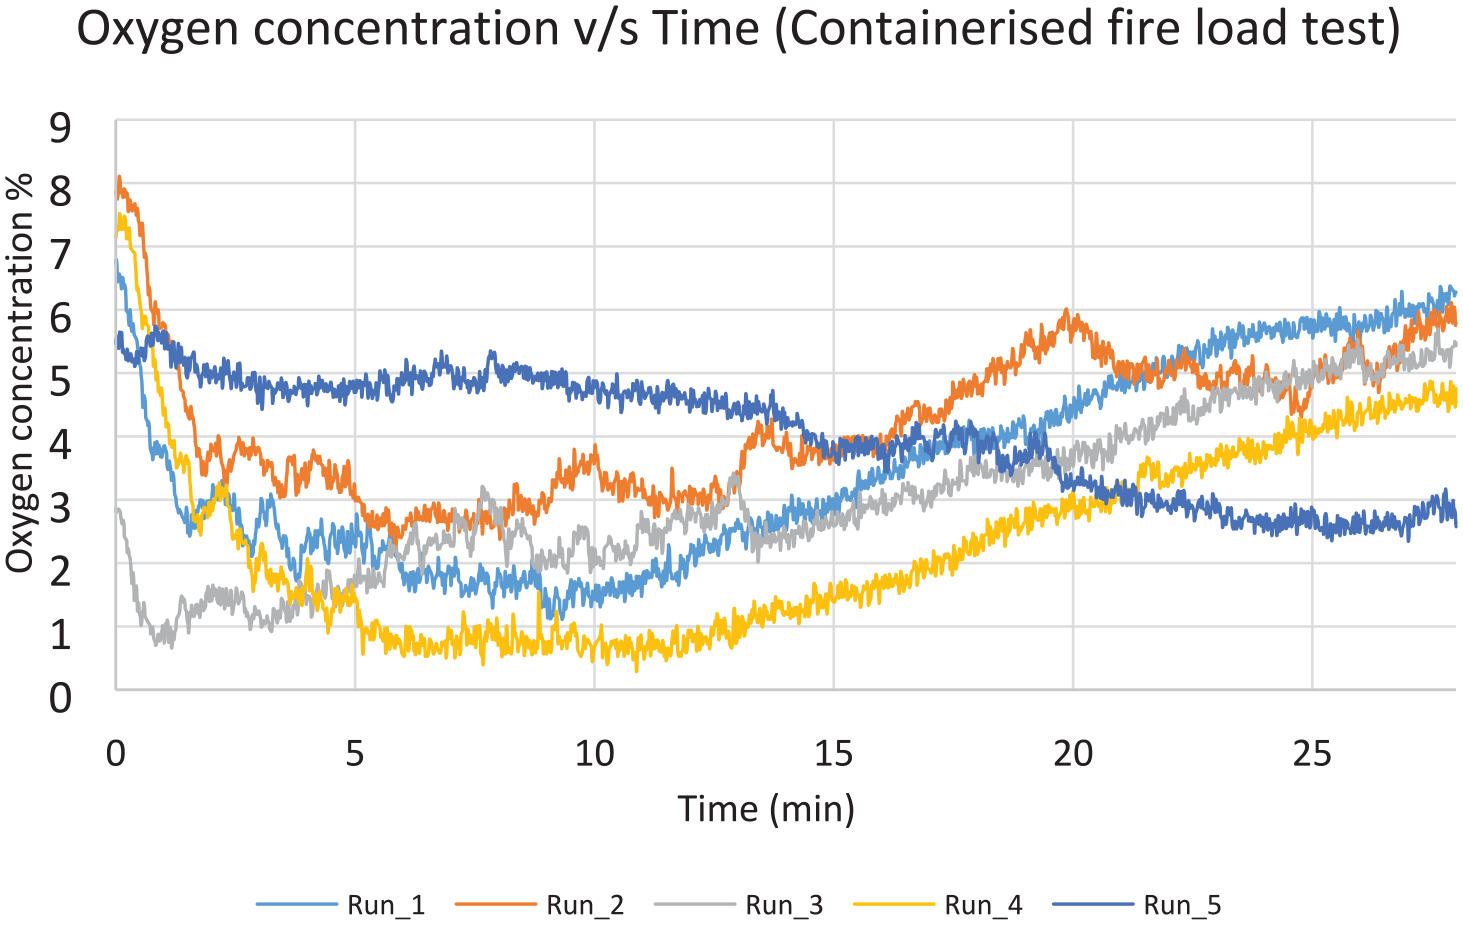
Oxygen concentration values for containerised-load test, measured 0.6 m below the ceiling.
Results for containerised-load test scenario.
Bulk-load fire scenario
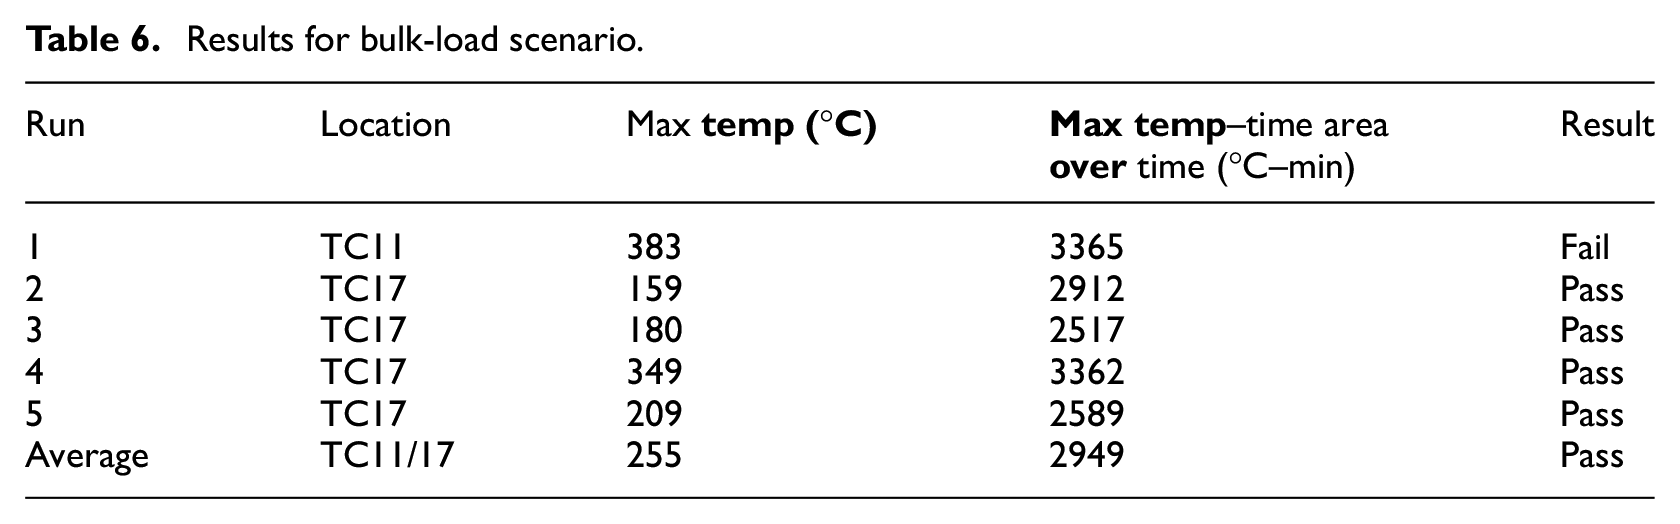
Five suppressed test runs were conducted also for this scenario, along with one unsuppressed run as a baseline. Figure 23 shows the value of the highest observed temperature measurement in each one of the 5 test runs, for the time period 2 min after suppression, until 28 min after suppression. There is no consistent pattern of temperature profiles, and it can be seen that there are more violent peaks compared with the containerised-load tests. As before, boxes lit up randomly, but due to the larger number of boxes, the fire propagated faster. The first run has failed the peak temperature criterion, probably due to the effect of a sudden very strong gust that lasted for several seconds, providing rapid air supply through the ventilation pipes. A slight recovering trend of the oxygen concentration is also noticed for the same period of time (Figure 24). There are noticeable drops though during the evaluation period, which coincide with the moments of fire resurgence. The average values were found to be 255°C and 2949°C–min, respectively, hence passed the criteria of the MPS (Table 6).
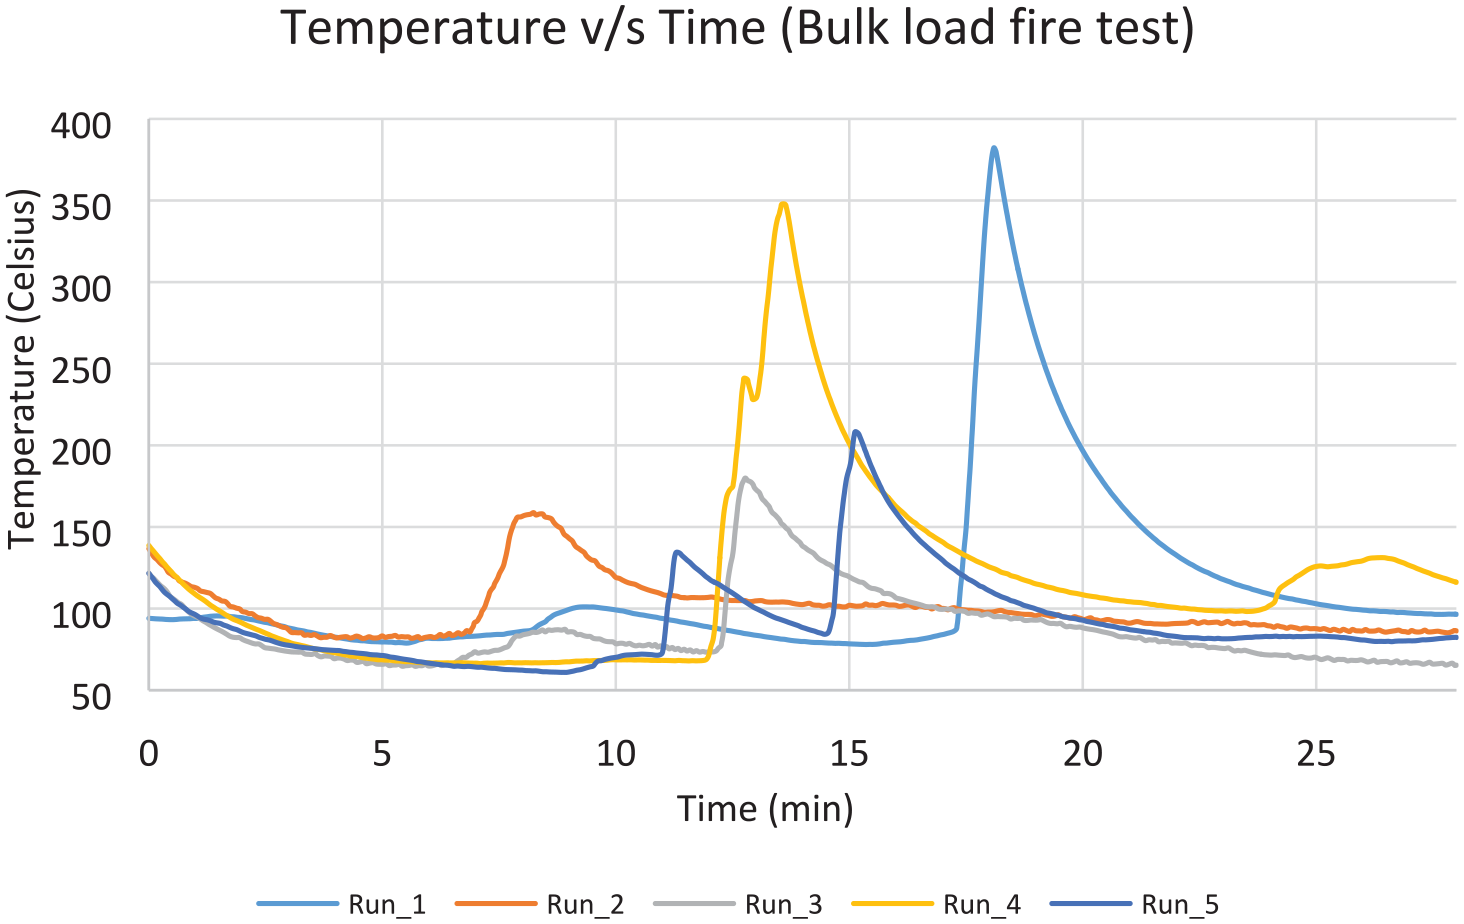
Temperature–time graph for bulk-load test.
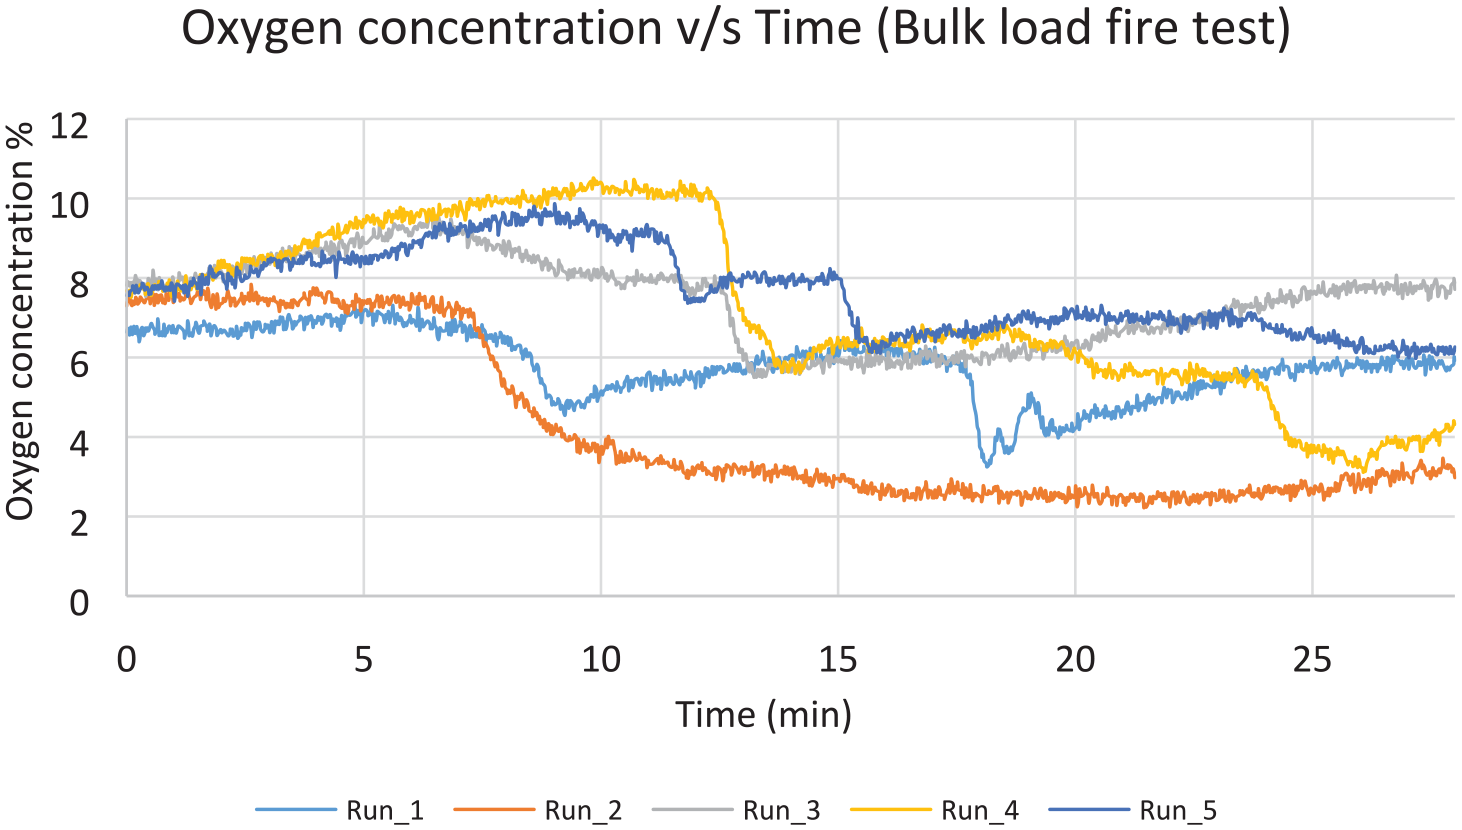
Oxygen concentration values for bulk-load test, measured 0.6 m below the ceiling.
Results for bulk-load scenario.
Conclusion
Addressing cargo compartment fires of an aircraft is a critical aspect of safety on board. This work has been conducted under the Clean Sky 2 framework, and the aim was to investigate performance of compressed nitrogen as an alternative fire suppression agent to halon 1301 and prove the reliability of the proposed system in terms of fire suppression efficiency. Halon 1301 is very efficient but contributes to adverse environmental effects. The Halon Replacement Working Group has placed guidelines for replacement agents, which should have characteristics of low oxygen depletion potential (OPD), low toxicity, residue-free, easy to clean up, low GWP and low risk of use (relative to halon 1301 systems).
Compressed nitrogen was subjected to all the four MPS test scenarios – the surface burning and the aerosol can explosion scenarios. A wide-body aircraft cargo compartment was specifically designed, manufactured and equipped with a wide array of sensors and automation features. The tests were completed without any integrity or safety issues.
Repeatability of the results was ensured by conducting five identically configured runs for each case. High accuracy of measurements was ensured with appropriate selection of sensors and suitable design of the door leakage simulator flow rate measurement system.
The surface burning test evaluation parameters were observed to be within the pass range according to the MPS. A consistent pattern of temperature profile was observed for all test runs. The average peak temperature of the five test runs and average temperature over time fell within the acceptance values, as set by the MPS (220°C and 498°C/min, respectively).
The aerosol can explosion simulation tests showed no signs of explosion, and the pressure increase during the mist discharged was observed to be between 0.51 and 2.5 mbar, which was the same magnitude also recorded at the baseline run without ignition.
For the containerised scenario, the average values were found to be 210°C and 4711°C–min, respectively, hence passed the criteria of the MPS. A more random pattern of the temperature profile was observed, which however did not affect the overall result.
Similarly, the bulk-load scenario tests passed both MPS criteria, despite one of the tests failing the peak temperature. The average values were found to be 255°C and 2949°C–min, respectively. It can be observed that the decrease in oxygen concentration correlates to the rise in temperature. This is evidence for the fact that when oxygen becomes available to a deep seated fire such as this one, the fire would consume the available oxygen, thus increasing the temperature.
Moreover, CFD simulations2,3 have been conducted at Cranfield, and validation of these against experimental results will offer a numeric tool capable of accurate prediction of various agent behaviours and optimise the experimental test design for future test cases. In addition, future progress in engine bay fire suppression is taking roots and could soon see implementation of nitrogen in place of halon for this application.
The halon replacement investigation is supervised by the Halon Replacement Working Group, who are co-ordinating the test procedures and working to standardise the active MPS tests worldwide. Cranfield University is working closely with the Group providing results and observations that will support the MPS revision, which is also one of the tasks in progress. As a lithium battery fire scenario will probably be included in the revised MPS document, there will soon be a requirement for a new test campaign investigating the suitability of nitrogen or other alternative agents in cargo compartment fire suppression.
Footnotes
Appendix
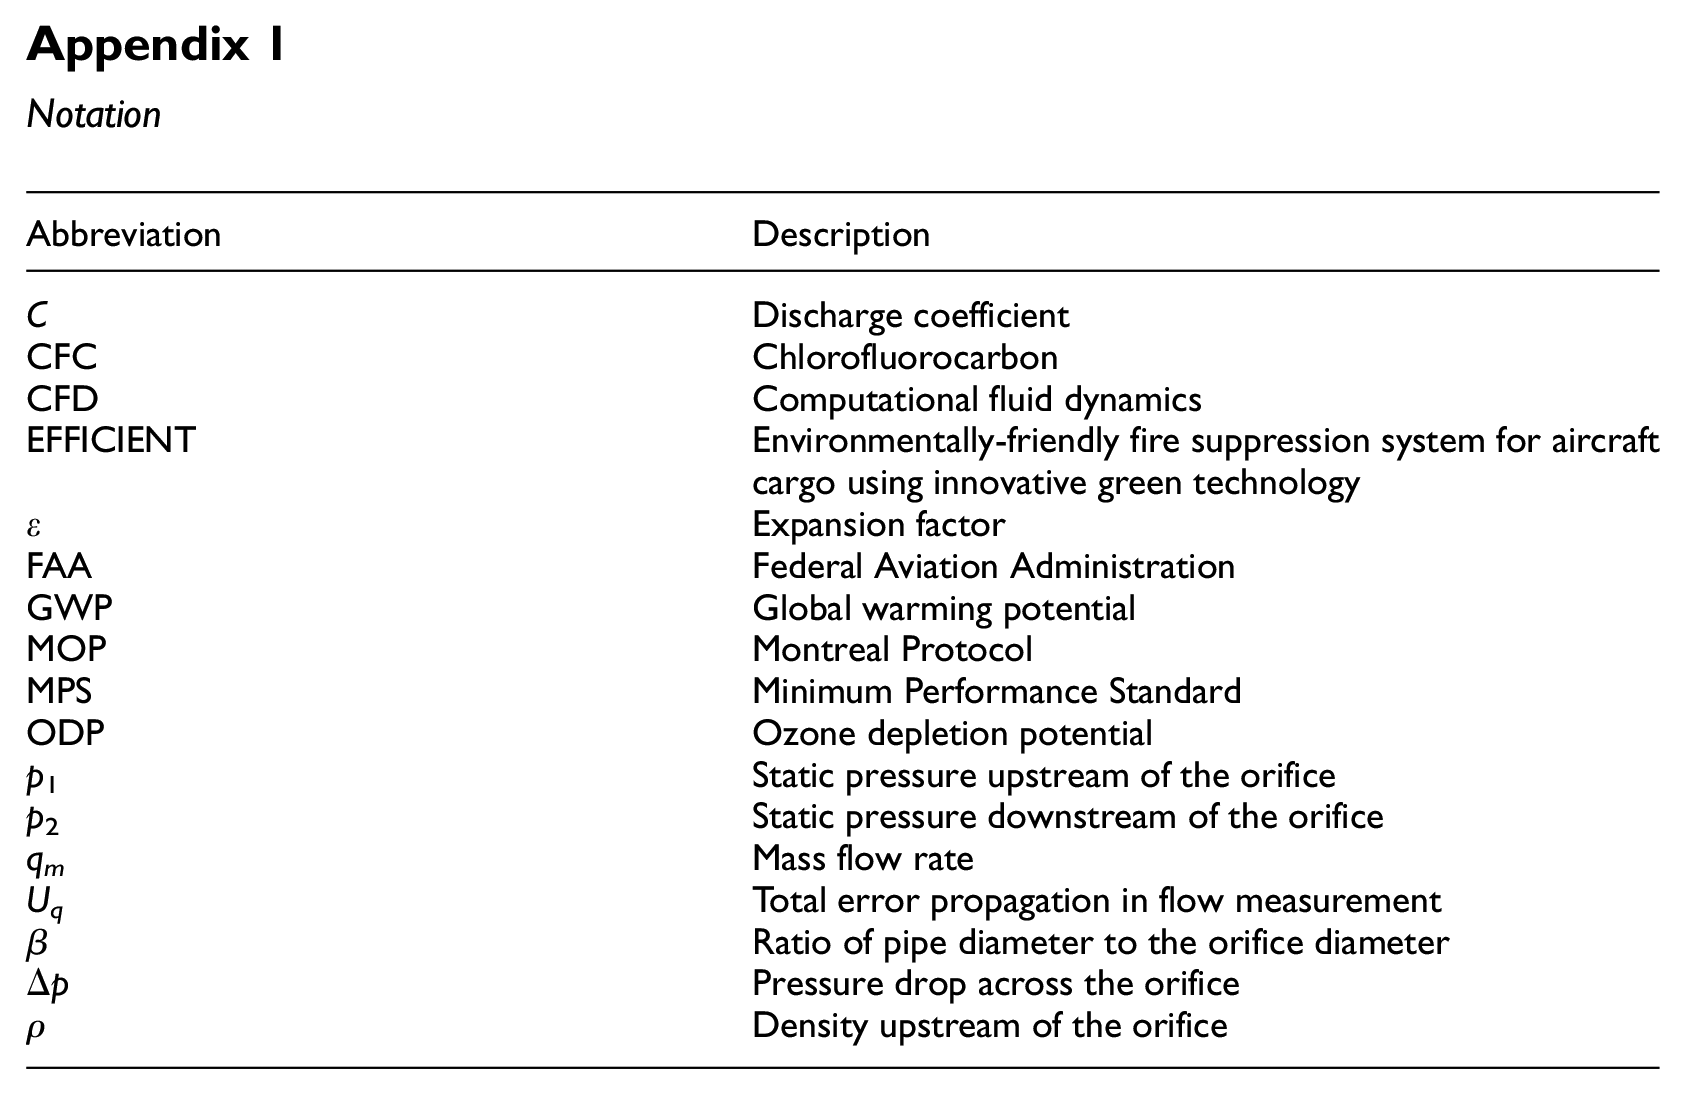
Notation
| Abbreviation | Description |
|---|---|
| C | Discharge coefficient |
| CFC | Chlorofluorocarbon |
| CFD | Computational fluid dynamics |
| EFFICIENT | Environmentally-friendly fire suppression system for aircraft cargo using innovative green technology |
| ε | Expansion factor |
| FAA | Federal Aviation Administration |
| GWP | Global warming potential |
| MOP | Montreal Protocol |
| MPS | Minimum Performance Standard |
| ODP | Ozone depletion potential |
| p 1 | Static pressure upstream of the orifice |
| p 2 | Static pressure downstream of the orifice |
| qm | Mass flow rate |
| Uq | Total error propagation in flow measurement |
| β | Ratio of pipe diameter to the orifice diameter |
| Δp | Pressure drop across the orifice |
| ρ | Density upstream of the orifice |
Acknowledgements
We would like to extend our sincerest acknowledgement towards the topic leader, Airbus, for providing us this opportunity and sharing relevant data towards this publication.
Declaration of conflicting interests
The author(s) declared no potential conflicts of interest with respect to the research, authorship and/or publication of this article.
Funding
The author(s) disclosed receipt of the following financial support for the research, authorship and/or publication of this article: This work was supported and funded by Horizon 2020/Clean Sky JU towards Grant Agreement No: 685482 ‘Environmentally-Friendly Fire Suppression System for Aircraft Cargo using Innovative Green Technology’ (EFFICIENT) project.