
Abstract
Fire on board an aircraft cargo compartment can lead to catastrophic consequences. Therefore, fire safety is one of the most important considerations during aircraft design and certification. Conventionally, Halon-based agents were used for fire suppression in such cases. However, an international agreement under the Montreal Protocol of 1994 banned further production of Halon and several other halocarbons considered harmful to the environment. There is therefore a requirement for new suppression agents, along with suitable system design and certification. This article aims to describe the creation of a mechanism to validate a preliminary design for fire suppression systems using Computational Fluid Dynamics and provide further guidance for fire suppression experiments in aircraft cargo compartments. Investigations were performed for the surface burning fire, one of the fire testing scenarios specified in the Minimum Performance Standard, using the numerical code Fire Dynamics Simulator. This study investigated the use and performance of nitrogen, a potential replacement for Halon 1301, as an environmentally friendly agent for cargo fire suppression. Benchmark fires using the pyrolysis model and fire design model were built for the surface-burning fire scenario. Compared with experiment results, the two Computational Fluid Dynamics models captured the suppression process with high accuracy and displayed similar temperature and gas concentration profiles. Fire consequences in response to system uncertainties were studied using fire curves with various fire growth rates. The results suggested that using nitrogen as a fire suppression agent could achieve a lower post-suppression temperature compared to a Halon 1301-based system. It can therefore be considered as a potential candidate for aircraft cargo fire suppression. Such work will feed directly into system safety assessments during the early design stages, where analyses must precede testing. Future work proposed for the application of this model can be extended to other fire scenarios such as buildings, shipping, and surface transport vehicles.
Keywords
Introduction
Aircraft fire suppression system and its requirement
Currently, when an in-flight fire is detected in an aircraft cargo compartment, Halon 1301 fire suppression agent is quickly discharged from the suppression system to achieve its required suppression concentration. Halon 1301 is one of the most effective fire extinguishing agents and requires only 5% of volume concentration to extinguish the fire. However, because the emission of Halon can cause significant damage to the ozone layer, its production was banned in 1994, in accordance with the Montreal Protocol international agreement. 1 Table 1 shows potential fire suppression agents. Nitrogen has been identified to have the best potential to replace Halon for the aircraft cargo compartment fire suppression systems. The main reason is that nitrogen exhibits near-zero Ozone Depletion Potential 1 (ODP) and Global Warming Potential 2 (GWP). Table 1 shows the ODP, GWP, and atmospheric lifetimes 3 for various fire suppression agents. Apart from these advantages of using nitrogen, the gas is also easy to integrate into new systems, showing acceptable levels of toxicology, and is abundantly available.
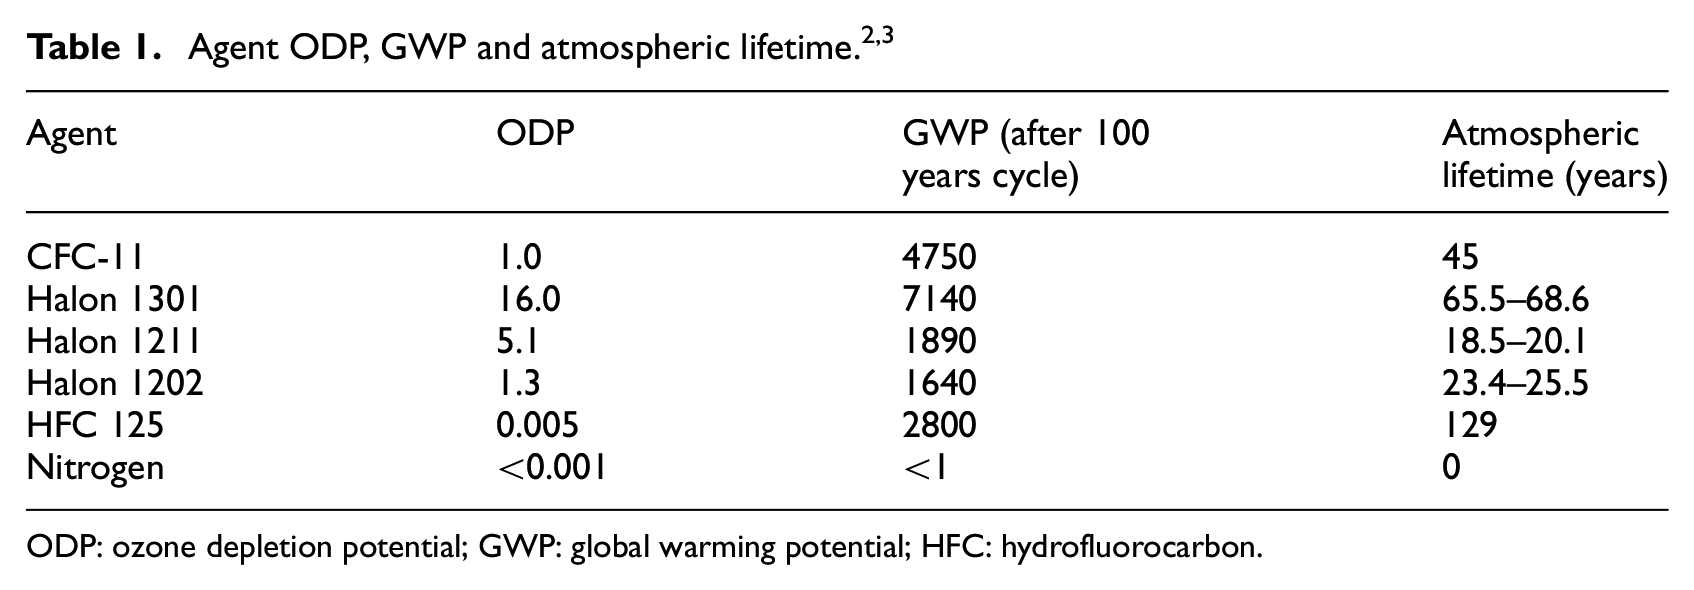
ODP: ozone depletion potential; GWP: global warming potential; HFC: hydrofluorocarbon.
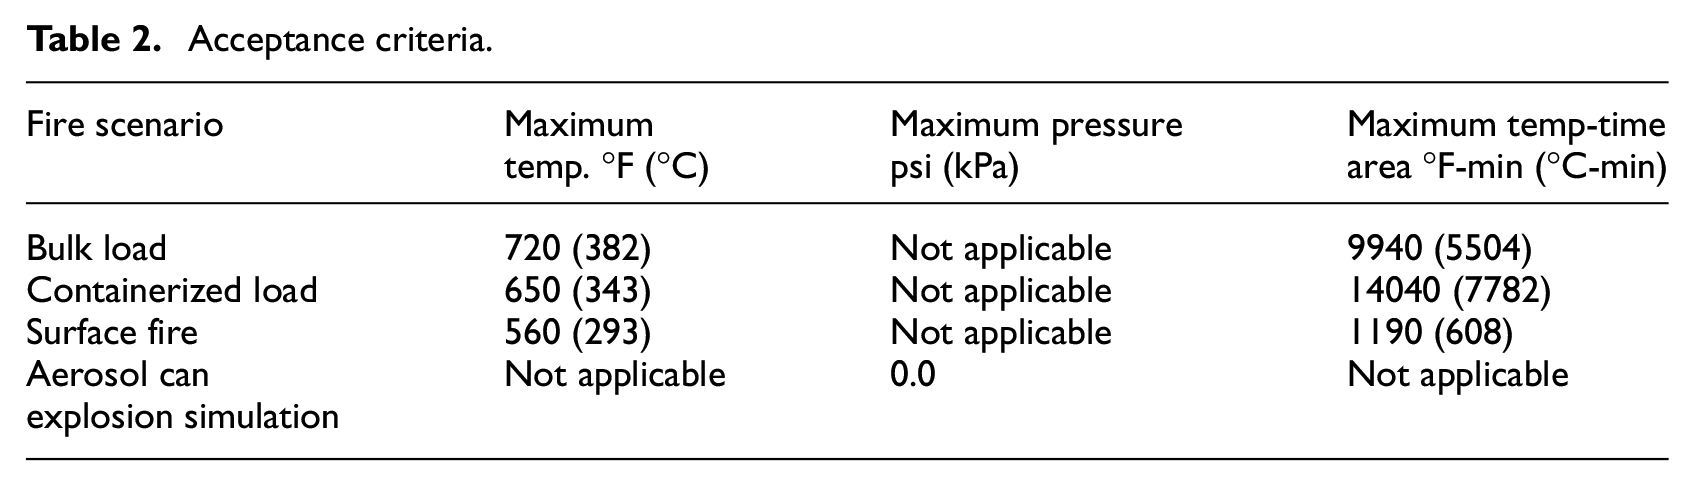
Any candidate agent selected for fire suppression and associated suppression system design must be subjected to the Minimum Performance Standard (MPS). 4 This is a testing procedure developed by the International Systems Fire Protection Working Group. A series of tests are required by MPS to demonstrate the effectiveness of the new agent in providing the same level of safety as of a Halon 1301 system. It has to be tested for bulk-load fire scenario, containerized-load fire scenario, surface-burning fire scenario, and aerosol can explosion simulation scenario. Acceptance criteria described in Table 2 were established based on the performance of Halon 1301 suppression system, obtained from baseline tests conducted by the United States Federal Aviation Administration (FAA). Five tests are required for each fire scenario. For the surface-burning fire scenario to pass the MPS, the average of the five test peak temperatures should not exceed 293°C, starting 2 min after the activation of suppression system until the end of the test. In addition, the average of the five test areas under the time–temperature curve should not exceed 608°C-min. The time–temperature area is computed for the 3 min interval from 2 to 5 min after the activation of the suppression system. 4 These critical values for the rest MPS fire scenarios were presented in Table 2. For aerosol can explosion test, no overpressure or any evidence of explosion shall be noticed during the test. Once the data for the new system are collected and analysed, these criteria may be used for comparison purposes to determine whether they are safe for use.
Acceptance criteria.
Previous studies
MPS requires an expensive experimental setup and follows an elaborate process. Instigation was therefore made into alternative methods that are cost-effective, efficient, safe and reliable. Lower cost preliminary studies could thus be performed prior to the conduct of an actual MPS. Numerical modelling methods were considered in this research, as they are time and cost-effective. The objective was not to replace the actual MPS tests with numerical methods, but to be well informed before the agent/system is subjected to MPS. The main benefits of using numerical methods in fire modelling are as follows:
(a) Ability to foresee the performance of the suppression system and the risk during the fire. Optimization could be undertaken accordingly to improve the system performance.
(b) Lowering the cost of design, especially when the design and experimental process may consist of several unknowns.
(c) Any experiment involving a large-scale fire is risky. Numerical simulation helps in understanding the mechanism without subjecting one to such risks.
(d) There is minimal pollution associated with numerical simulation.
Simulation of fire suppression in a large enclosure is challenging for Fire Safety Engineering (FSE). The complexity originates from the fire phenomenon itself, which is stochastic in nature and embraces nearly all of the effects of subsonic chemically reacting flow. 2 Therefore, the underlying mechanisms such as combustion, fluid dynamics, turbulence and heat transfer need to be considered in the mathematical models. Some physical and chemical aspects are not yet been fully understood or represented, which brings uncertainties and unknowns in the modelling process. The interaction between fire and suppressant further complicates the process by requiring a model for fire extinguishing prediction. For that purpose, the combustion chemistry combined with thermodynamics and fluid dynamics needs to be understood in detail. 3
In earlier studies, to avoid computationally expensive models, the process of designing or validating the efficiency of a fire suppression system focused mostly on modelling fire suppression agent injection mechanisms. The extinguishing criterion is formulated as an empirical concentration level of suppression agent from the experiments or an acknowledged oxygen level. Rapid increases in computational power and the development of experimental techniques have facilitated highly complex Computational Fluid Dynamic (CFD) modelling for fire suppression applications. 5
Most of the simulations and tests have been carried out using water mist as the suppression agent. Water mist sprinkler systems are widely used in the civil engineering due to their environmental friendly nature, low cost, and high effectiveness characteristics. 6 It is considered an alternative for halocarbon-based suppression systems. The main difficulty of modelling a water mist system is the multiphase flow phenomenon simulation and predicting heat feedback. The current CFD modelling strategy of water-spray fire suppression is summarized by Cong and Liao. 5 Notice that the water mist system did not pass the aerosol can explosion test in the previous experiments. Another alternative for ozone-depleting substances, hydrofluorocarbon (HFC), has also been examined in engine nacelles 7 and Military ground vehicles. 8 HFC is a more effective agent than water mist and other inert gas–based agents and requires less agent concentration, although its toxicological and environmental effects are still under discussion. 9 In the modelling process, it is suggested that the evaporation rate of fuel is one of the most significant uncertainties and makes extinguishing hard to predict. 7 Numerical instability has also been addressed due to the rapid evaporation of liquid agents. 8 Inert gases, such as nitrogen and argon, can extinguish fires by diluting the air and reducing the oxygen concentration in the enclosure. Nitrogen is environment-friendly that has little impact on atmospheric life and ozone layer. 9 Hewson et al. 10 have modelled the fire suppression process when a fire is stabilized behind a rearward-facing step using nitrogen and other agents. Chemical kinetics is predicted using a collection of perfectly stirred reactors (PSR). This study modelled local flame extinction phenomena based on the ratio of flow mixing time scale and chemical time scale, when exposed to an inert gas environment. Several studies have also focused on the same phenomena to study the flame extinction criteria. 11 Senecal 11 studied the extinguishing concentrations and critical temperature for six inert gases and compared them with the current standard. A small-scale simulation was carried out by Dinesh et al. 12 to obtain the nitrogen inert concentration for heptane fire. Results matched well with the data from cup burner tests. Hu et al. 13 explored the relationship of extinguishing concentration of inert gas with discharge rate and ventilation rate. It suggested that the required concentration is affected by the fire environment. The advantages of using nitrogen as the suppression agent are straightforward, and many small-scale experiments and simulations have been carried out. However, little information is available on large-scale tests in the public domain. This is due to the following:
(a) An inert gas suppression system is not the best choice compared to a water-mist system for most civil applications, since the latter has higher extinguishing efficiency and is cheaper to obtain and store for land-based fire suppression.
(b) Unlike Halon, which stops the fire by chemically disrupting combustion, inert gas extinguishes the fire by reducing the oxygen content of air. It therefore requires significantly higher suppression concentrations compared to halocarbon or HFC-based systems. Longer extinguishment times are therefore expected.
Therefore, assessment and certification are required for the design of nitrogen-based fire suppression systems using current codes and standards. The purpose of this article is to describe the exploration of the suppression performance of nitrogen system in the surface-burning fire scenario specified in MPS. Since full-scale burning tests are expensive to run, numerical simulation can be a way of producing preliminary designs and providing confidence to subsequent experiments. The Fire Dynamics Simulator 6.7.1 (FDS) is used as the CFD tool for the modelling. The software predicts flame extinguishment by considering the cell temperature and oxygen concentration. 14 The concept of ‘fire design’ is introduced to assess system reliability, where the existence of uncertainties could potentially affect fire growth. Fire design is a performance-based solution to deal with system randomness and can be an effective way to avoid expensive detailed chemical kinetic modelling by applying an empirical fire growth function. Different fire growth curves were studied and compared for the surface-burning fire scenario. In addition, a benchmark fire using a pyrolysis model was performed and validated using experimental results.
MPS experimental procedure
Five experiment runs of MPS surface burning fire scenario were carried out to test the fire suppression performance of nitrogen. The cargo compartment layout for the experiment specified by MPS is shown in Figure 1. It was a box-shaped geometry with internal dimensions 8.11 m × 4.16 m × 1.67 m. It represented a forward cargo compartment of a wide-body aircraft. 4 A U-shaped duct placed on the sidewall was used as a forced ventilation system to simulate the air leakage from the enclosure. The forced ventilation was driven by a variable speed fan to allow a constant leakage rate of 23.3 L/s throughout the tests. In addition, two long pipes with an internal diameter of 27 mm and the same length of the compartment were installed on the side walls. Each pipe was perforated to include nine holes (diameter was 12.7 mm) located at an equal pitch of 800 mm. 5 Temperature measurements were taken on the ceiling and sidewalls. Ceiling thermocouples were evenly spaced along the ceiling at 1.52 m intervals, and sidewall thermocouples were 0.3 m below ceiling level. All thermocouples are Type K chromel/alumel thermocouples with the measurement accuracy of ±1°C. In MPS, gas concentrations were measured along the centre vertical line of the compartment. However, due to the restriction of the length of gas analysers, only the ceiling sensor was located where MPS requires (0.05 m below ceiling level). The other two sensors had the same vertical positions as MPS, but shifted to the left wall side horizontally in the experiment (Figure 2(a) and (b)). The XZR-B2C2 type oxygen sensors were used for the measuring, and the accuracy was ±0.55% of the reading. The compartment internal pressure was monitored and recorded at a rate of 3000 samples/s using a sensitive piezoelectric pressure transducer (Kulite XCQ93, with an accuracy of ±0.1%), capable of sampling up to a rate of 175 kHz. The pressure transducer was located at the same plane of oxygen sensors, 70 cm away from the nearest sidewall and 5 cm below ceiling level. A top plane view showing the instrumentations in the experiment is given in Figure 2(a).

Cargo compartment layout and instrumentation locations.
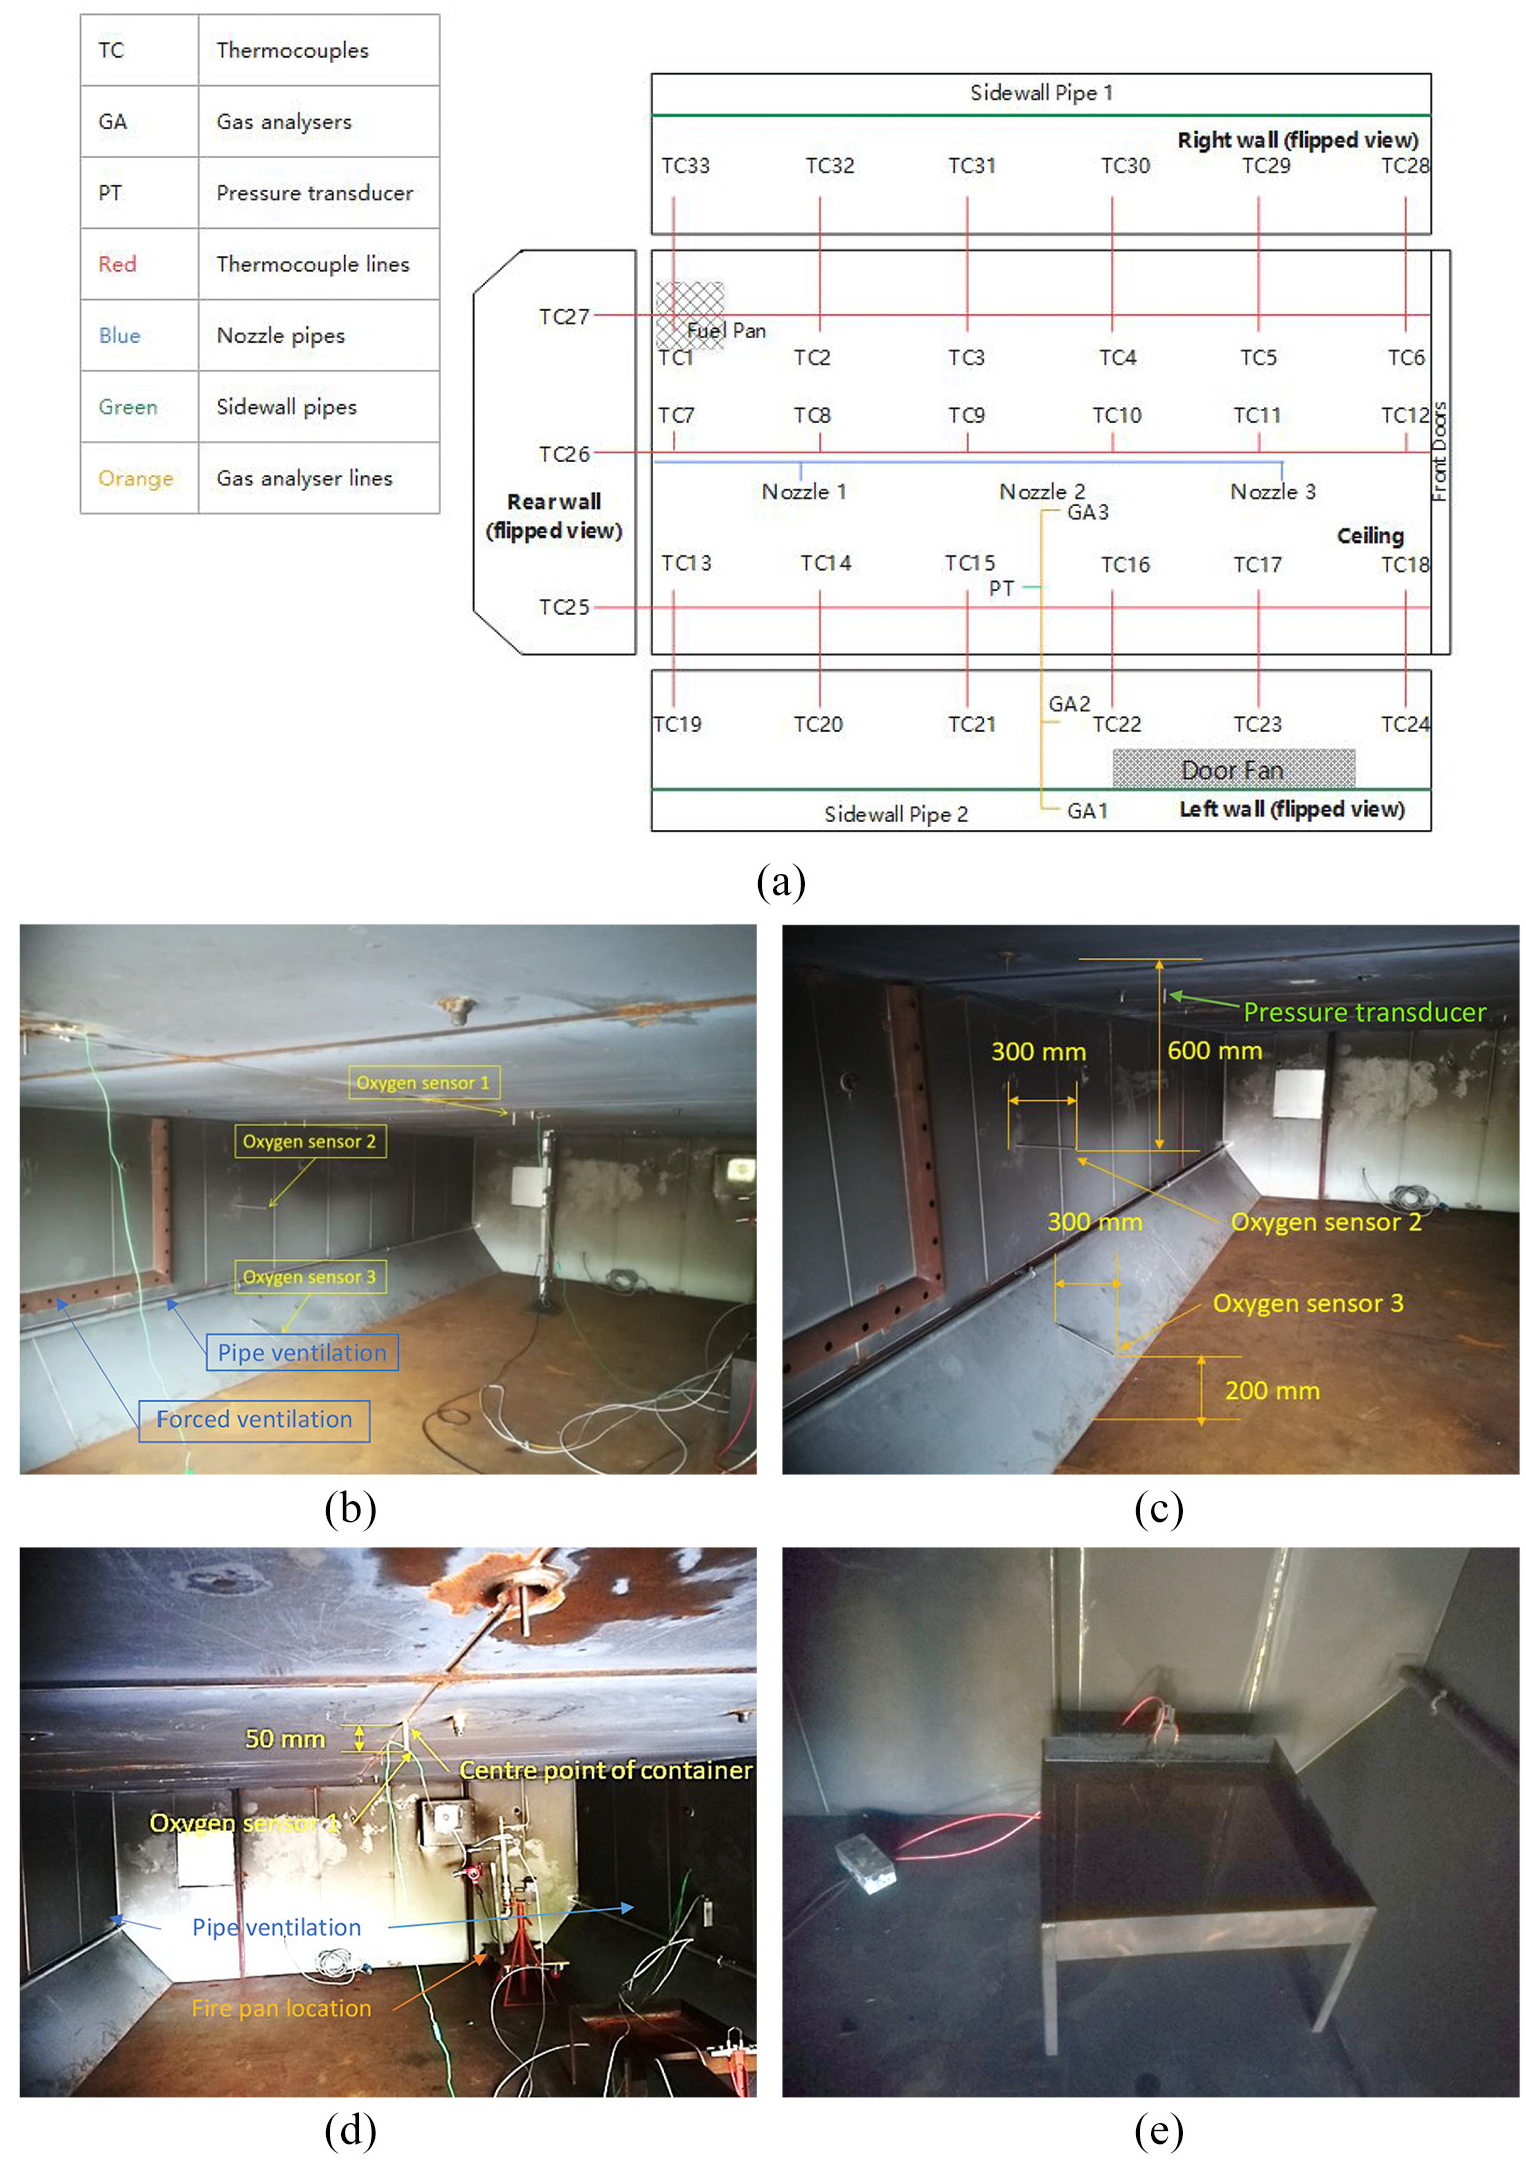
Surface-burning experiment set-up: (a) instrumentation arrangement, (b) gas analysers, (c) gas analyser locations (bottom two), (d) gas analyser locations (top one) and pan arrangement and (e) ignition configuration.
For the surface-burning fire scenario, the fuel pan was made of steel and had the dimensions of 60.9 cm × 60.9 cm × 10.2 cm. According to MPS, the fuel pan should be located 30.5 cm above the floor since the density of nitrogen is slightly lesser than air (Figure 2(c) and (d)). Horizontally, it was placed directly below the corner thermocouple (TC 1 in Figure 1, TC 16 in simulations). The thermocouple was 0.25 m from the back wall and 0.56 m from the nearest sidewall; 1.9 L of Jet-A fuel were used for the experiment, and a thin layer of gasoline was added on the top to help the ignition; 9.5 L of water were placed at the bottom of the pan to keep the pan cool and minimize warping. 4 The fire was ignited by a direct current (DC) arc igniter placed above the surface of fuel (Figure 2(d)).
Three nitrogen discharge nozzles were installed at 1.35, 4.05 and 6.75 m along the compartment centre line. Each nozzle had six circular orifices, and the mass flow rate was adjusted with the installation of appropriate orifices diameters internally in the discharge nozzles (7, 10 and 10 mm, respectively). Successful suppression by total flooding relied on injecting sufficient quantity of inert gas to all possible locations. In the preliminary design, the extinguishing concentration of nitrogen was approximately 34%. A safety factor of 1.35
15
was applied to the design concentration of nitrogen which is 46%. The volume of nitrogen

where
CFD setup
The study presented in this article used the FDS fire modelling software. It modelled the surface-burning fire and its suppression process. FDS has been used widely in fire engineering to study low-speed (Ma < 0.3), thermally driven flow. 14
Geometry and grid
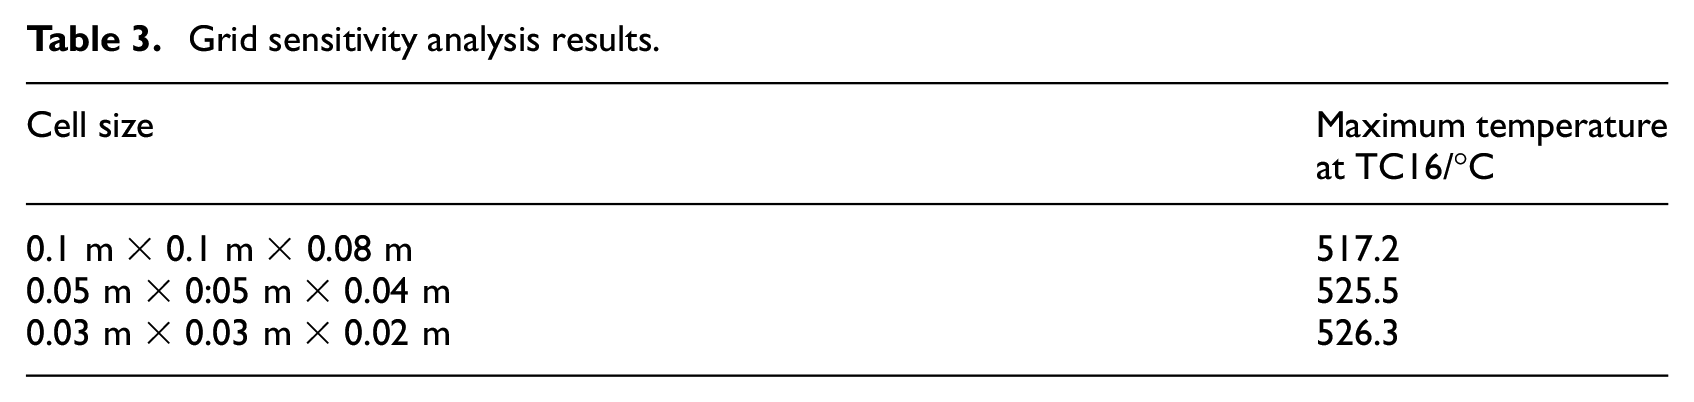
The CFD geometry was constructed in FDS, representing the experimental layout and is shown in Figure 3. Several mesh sizes were employed to test the sensitivity of grid solutions on the maximum temperature (Table 3), and a grid size of 0.05 m × 0.05 m × 0.04 m was chosen for the computational domain, with the total number of cells of 571,536. The characteristic fire diameter,
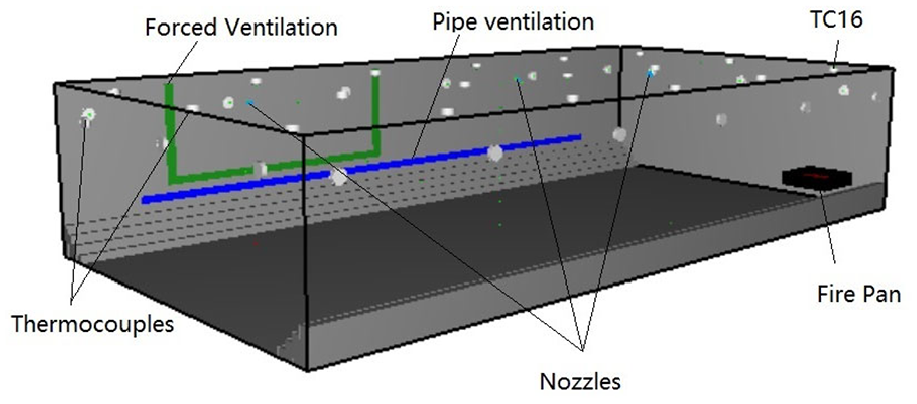
CFD geometry of cargo compartment.
Grid sensitivity analysis results.
The location of thermocouples and pressure sensors were placed in the same locations as MPS shown in Figure 1. Simulation started as the ignition begins. The suppression system was activated after 1 min, when any of the ceiling thermocouples detected gas temperature above 93.3°C.
Initial and boundary conditions
Ventilations
In the CFD setting, two zones (cargo and ambient) were separated by the cargo wall so that gas could travel through the ventilation system. Two ventilations were used to match the experimental set-up: forced ventilation – modelled as an outlet boundary condition with a fixed flow rate (23.3 L/s), and pipe ventilation, treated as the wall leakage using the leakage model in FDS. The leakage area was 0.00115 m2. The pipe flow rates were calculated based on the pressure difference between the two zones and the area of ventilation leakage.
Nozzle configurations
Nozzles in the simulation were represented by three gas generating particles, which injected nitrogen agent downwards at a rate of 0.222 kg/s individually. The designed nitrogen flow forms a conical shape after being discharged from nozzles. However, because FDS does not support this boundary condition for gas inlets, a downwards nitrogen flow was assumed in the simulation, and a method called ‘velocity patch’ in FDS was used to initialize the flow direction. Despite the high discharge speed in the experiment (around 300 m/s at nozzle outlets), the velocity of simulated nitrogen jets was initialized to 17.78 m/s because (a) FDS is optimized for low-speed flow and (b) nitrogen jets disperse quickly, and the velocity dropped below 20 m/s within the distance of 10 cm downstream. The discharge time of 47 s was chosen for the simulated fires to match the average experimental discharge duration.
Wall material properties
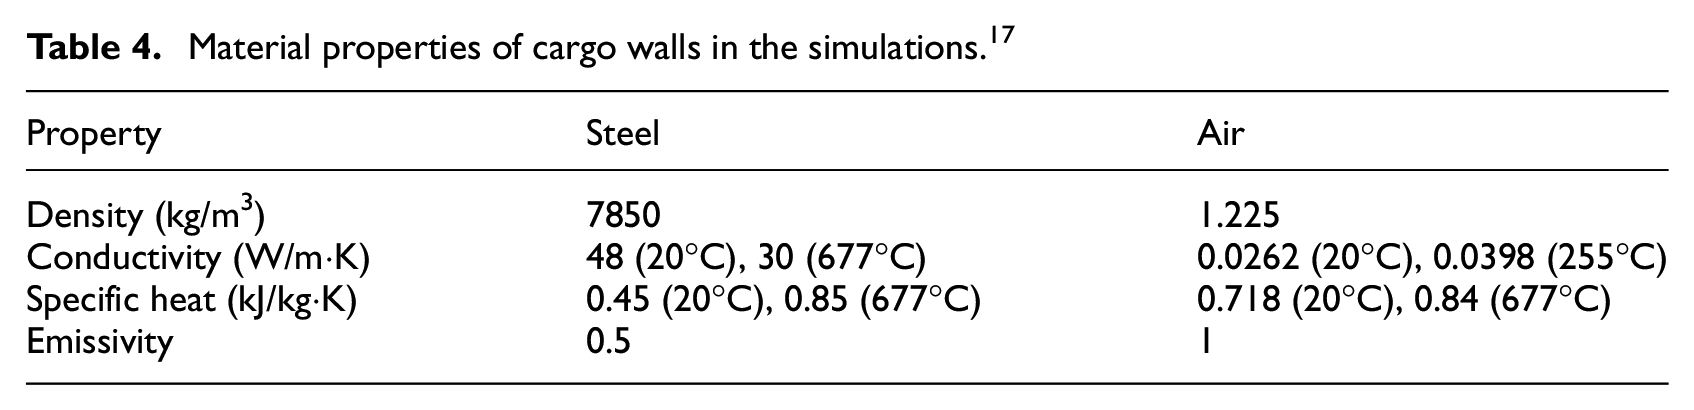
To account for the heat transfer through the wall, the cargo wall used in the simulation was formed of double-layer standard steel. It consists of two layers of 4-mm-thick A242 steel plate with a 100-mm air gap. The material properties of A242 steel, along with air properties used for the double-layered cargo wall, are listed in Table 4. The fuel pan was made of a single layer of steel with a thickness of 0.3 cm.
Material properties of cargo walls in the simulations. 17
Fuel properties
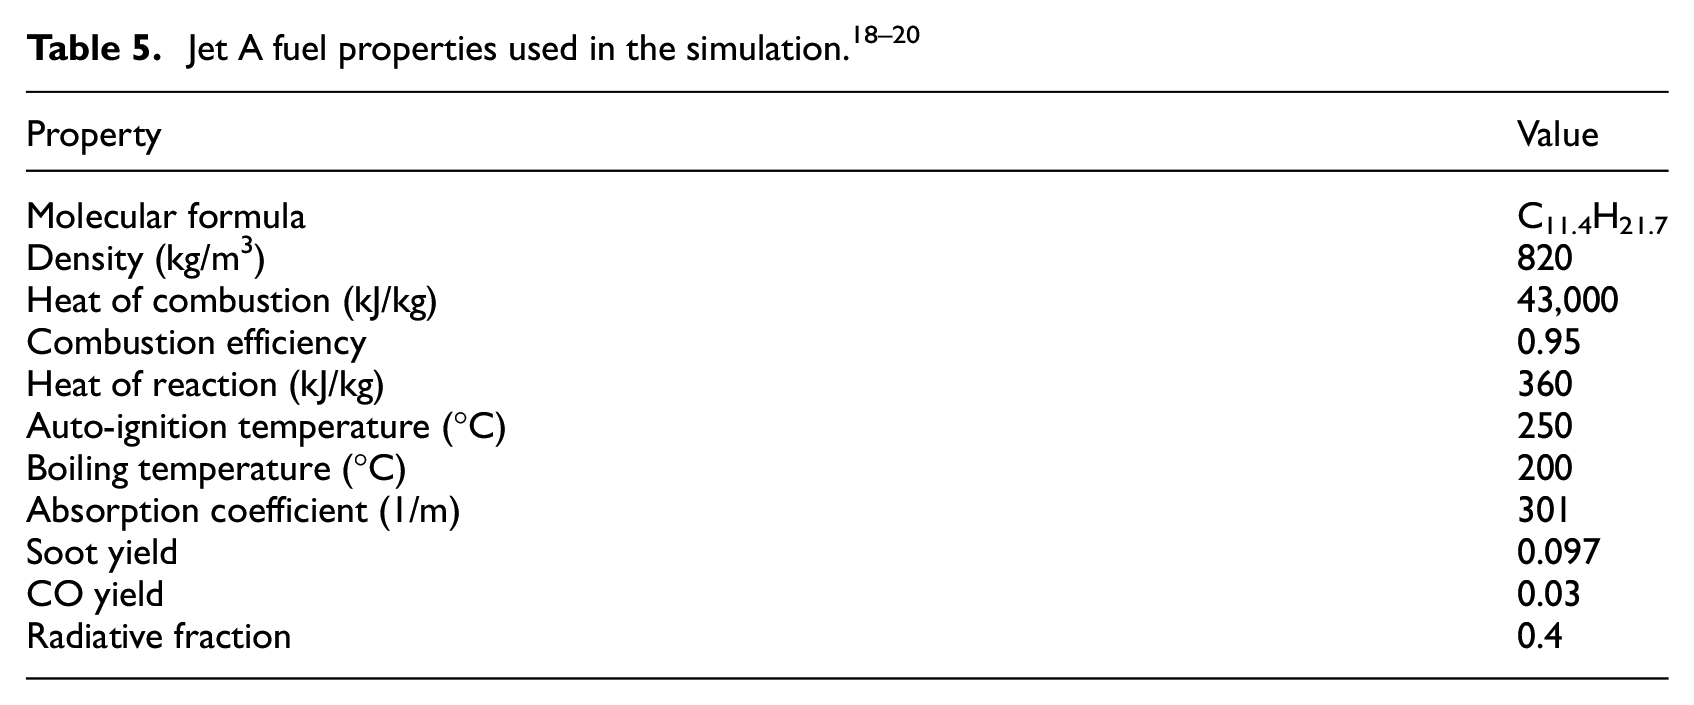
In this study, only Jet A fuel fire was modelled, while the piloted ignition of gasoline was not considered. Jet A fuel is a mixture of various hydrocarbons. However, since the gas phase combustion was simplified as a single-step reaction in the simulations, the average molecular formula of Jet A fuel was used. Properties of Jet A are listed in Table 5.
Extinction models
There are two options available in FDS to predict flame extinction. Both options predict the local extinction based on the concept of Critical Flame Temperature (CFT), 21 below which combustion is not allowed to proceed.
Extinction model 1
The first extinction model is dependent upon the empirical observation of limiting oxygen mass fraction

where
Extinction model 2
The second extinction model incorporates an enthalpy balance calculation based upon fractions of both fuel and oxygen in the cell. For extinction to occur, the potential energy released from the reaction fails to raise the cell temperature above the CFT. The inequality can be formulated as 22
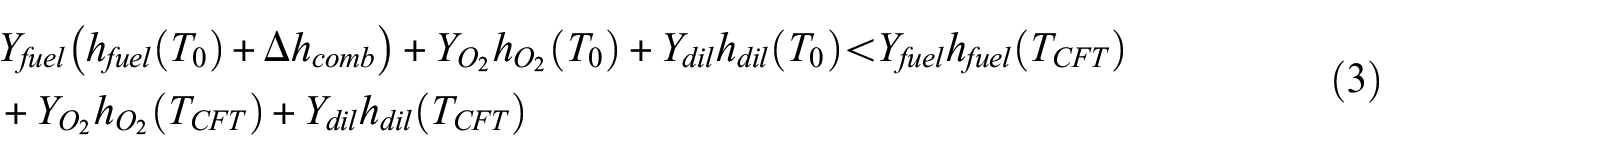
where

where
The second extinction model is recommended for the case with the characteristic grid size smaller than 1 cm. Because all cells in the simulation were larger than 1 cm in the current study, the first extinction model was therefore applied.
Turbulence and reaction models
In FDS, turbulence is modelled using Large Eddy Simulations (LES) with the Deardorff model by default. A single-step, mixing-controlled chemical reaction model was used for combustion in the simulation. Details of key boundary conditions and models are summarized in Table 6.
Key boundary conditions and models used in simulations.
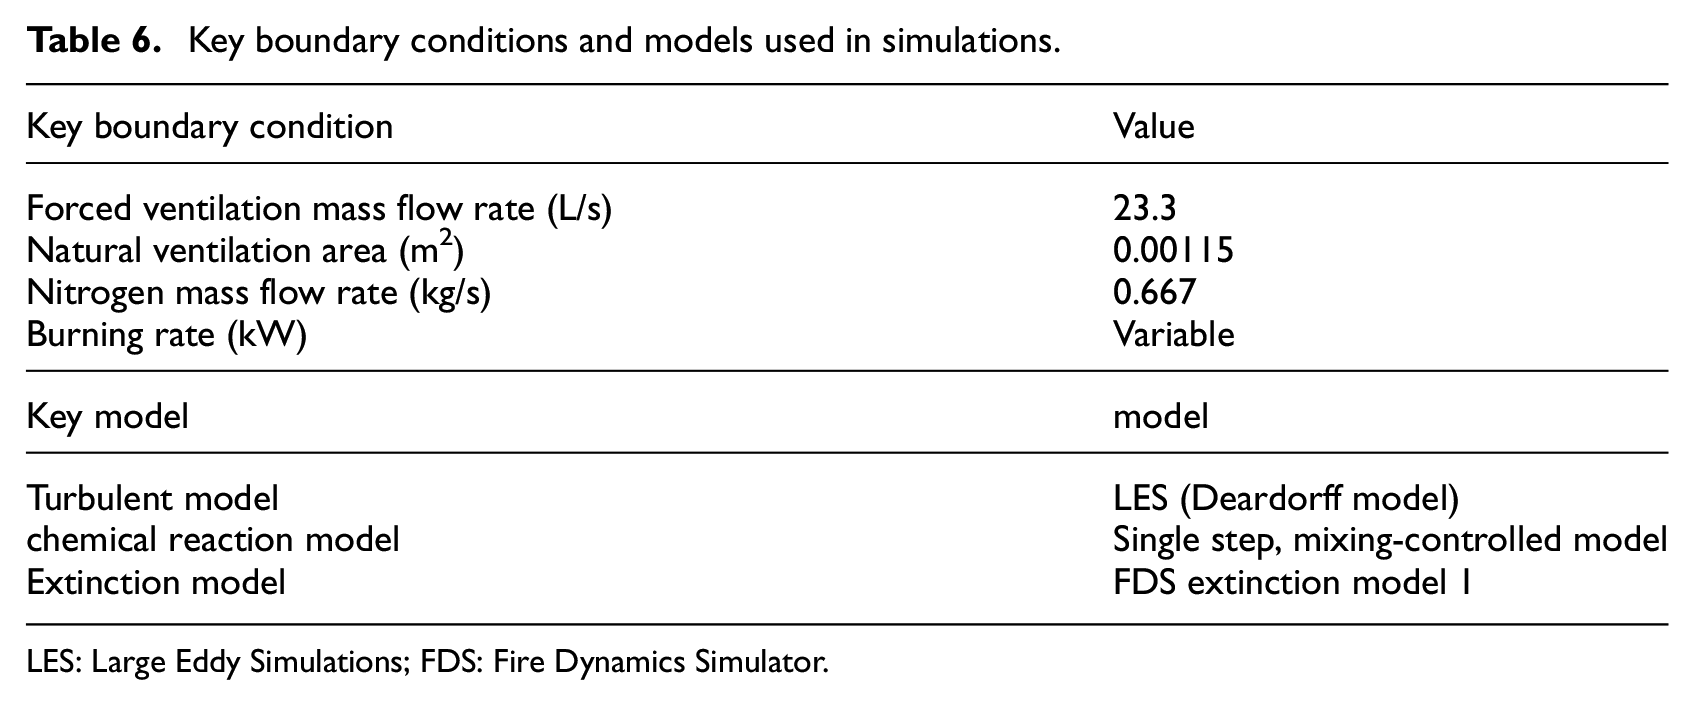
LES: Large Eddy Simulations; FDS: Fire Dynamics Simulator.
Fire vent treatments
Fires can be modelled in two different ways in FDS: (a) prescribe the energy released from the fire surface and (b) predict the energy release using the pyrolysis model. Both methods were used in this study. While the pyrolysis model was used for the validation purpose of the benchmark fire, the prescribe-fire-energy method aimed to identify the critical fire scenario (maximum temperature or exceeding the temperature criterion).
Benchmark fire using the pyrolysis model
A benchmark fire was initially simulated using the pyrolysis model available in FDS. In that model, liquid fuel was treated as a solid layered surface, so heat conduction through the fuel was computed using a one-dimensional heat transfer equation. Before combustion occurs, liquid fuel goes through an evaporation process; then, it turns into a flammable gas. The burning rate is then calculated based on the amount of gas available. The software predicts the burning rate during the fire by calculating the loss of heat into the fuel. The evaporation rate was critical in the process, and it was governed by the mass transfer number. 14 The burning properties of Jet-A fuel are listed in Table 5.
The simulation of the ignition of the surface-burning fire is triggered by a high-temperature particle located directly above the fuel surface. The surface temperature reaches 1500°C and lasts for 7 s.
The
fire method
Experiment uncertainties existed in the processes of ignition, propagation and pyrolysis of fuels. For example, the ambient conditions, purity of the fuel and ignition time could significantly affect the fire growth. It was noticed that the results obtained from the five experiments run under the same conditions resulted in slight variations. In reality, the severity of the fire is also affected by the type of fuel. However, for a reliable design, a nitrogen-based suppression system needs to pass the test even in the worst fire situation. This challenge is addressed by prescribing the fire growth rate in the current study.
A designed fire is a simplified approximation of a real-life fire. A typical pool fire Heat Release Rate (HRR) is shown in Figure 4. It includes three stages: fire growth, steady burning and decay. In this study, steady burning and decay stages are controlled by suppression processes, calculated by FDS. Only the fire growth stage is therefore prescribed. NFPA92 demonstrated that the power-law fire growth model could be used to approximate the heat release rate of a wide range of fuels, based on an earlier study. 23 These fires are therefore referred to as t-squared (t2) fires. However, a t2 fire is not suitable for simulating a surface-burning fire in this study for two reasons:
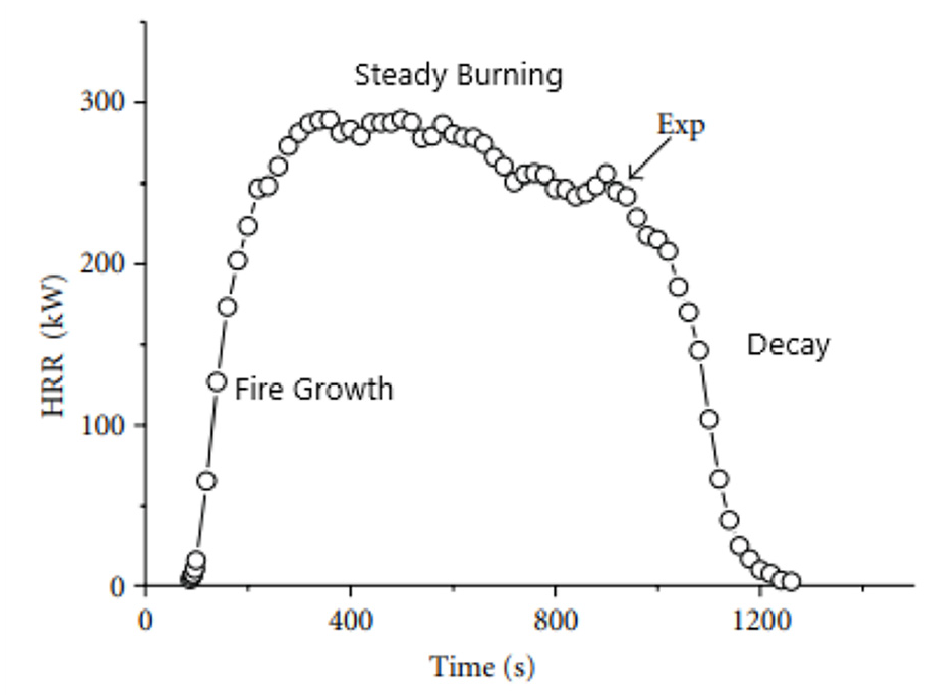
HRR and approximated curve of pool fire. 24
(a) A t2 fire model aims to predict fire spread from a local ignition point at a constant speed, to involve the entire surface eventually. It uses a constant HRRPUA of surface during fire development. Considering the fire spread speed of a pool fire is a constant, the actual local HRR is however governed by the local evaporation rate, which is a function of surface temperature and increasing gradually until thermal equilibrium is achieved. Therefore, the HRR increases during fire spread are expected to be slower than the ideal t2 model.
(b) A t2 fire model is normally used to describe an open fire, where enough amount of oxygen is available to support the rapid increase of HRR. In this cargo fire scenario, however, fire is restricted in a confined space; hence, its growth rate is affected by the ceiling and the limited amount of oxygen.
Therefore, a
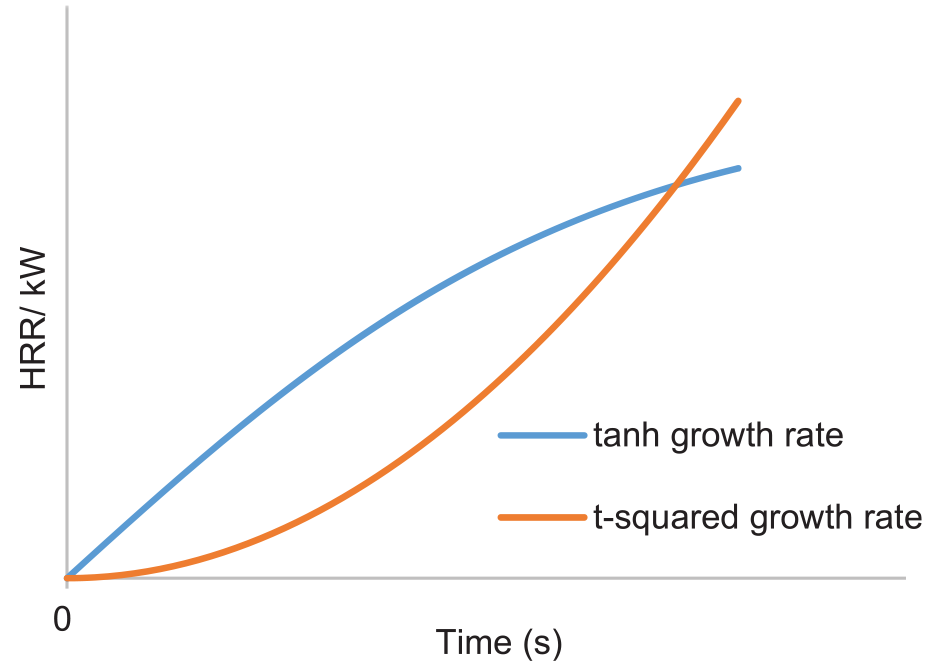
Fire growth curve comparison.

where
Assume ignition time is

The following assumptions are made in this study for modelling
(a) The modelled HRR does not include the fire decay period, which means that the decrease of HRR can only be caused by oxygen starvation rather than running out of combustibles.
(b) Complete fire suppression is achieved when both the oxygen level and the temperature fall below the critical values. Flashover is not considered in this case.
fire in surface-burning fire scenario
For the surface-burning fire scenario, Jet-A fuel is burnt in a square pan with various growth rates. Ignition is triggered by a high-temperature particle above the pan. The following equation 25 is used to calculate the maximum HRR

where
The data collected in the MPS experiment commenced from 2 to 5 min after the suppression activation. In the simulation, 500 s of simulation time was used for all the cases.
Results and discussion
Experiment results
In the experiment, the average maximum temperature and the maximum temperature-time area of all five repeating runs were 219°C and 498°C-min respectively; hence passed the MPS criteria (Max temperature – 293°C and Max temperature-time area – 608°C-min) comfortably. A consistent pattern of temperature evolution was observed during experiments. As temperatures rose quickly after ignition, the maximum temperature existed several seconds after suppression started and was recorded by TC16. After that, the compartment cooled down gradually until the end of test. The uncertainty in the five maximum temperatures and the maximum temperature-time areas were 3°C to 22°C and 2°C-min to 39°C-min, respectively.
Simulated benchmark fires with pyrolysis model
A typical modelled suppression process is shown in Figure 6, where the light blue particles represent the spread of the suppression agent (Nitrogen). The maximum temperature is also detected by TP16 as the experiment. The comparison between the maximum temperature profile of the simulated benchmark fire and experiment results (Run 5) is shown in Figure 7(a), where similar temperature trends are presented. The maximum temperature and the maximum temperature-surface area from the simulation are 284°C and 573°C-min, respectively, which also does not exceed the MPS criteria. The temperature plot of all thermocouples is shown in Appendix 1.
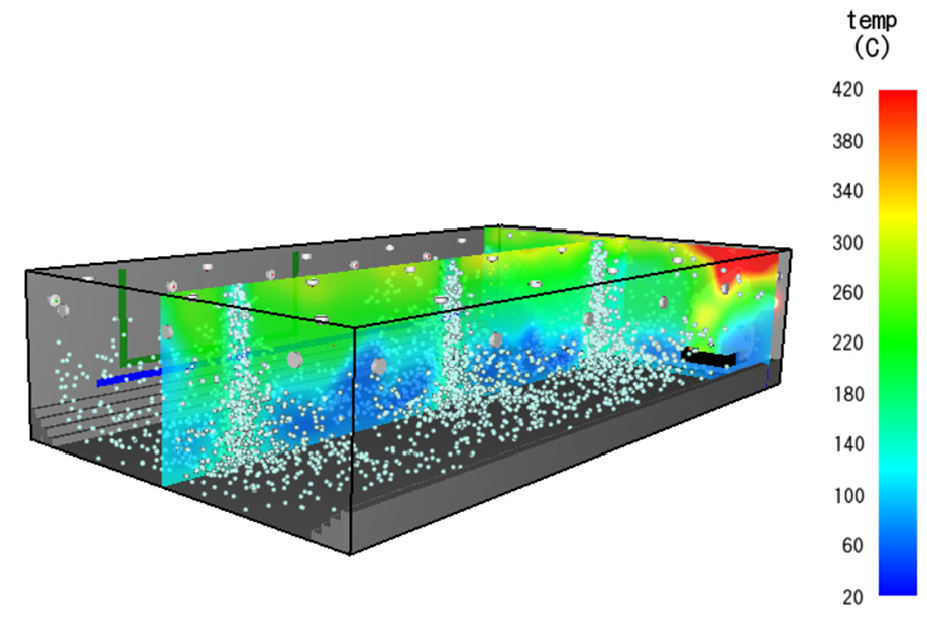
Surface-burning fire at 87 s simulation time.
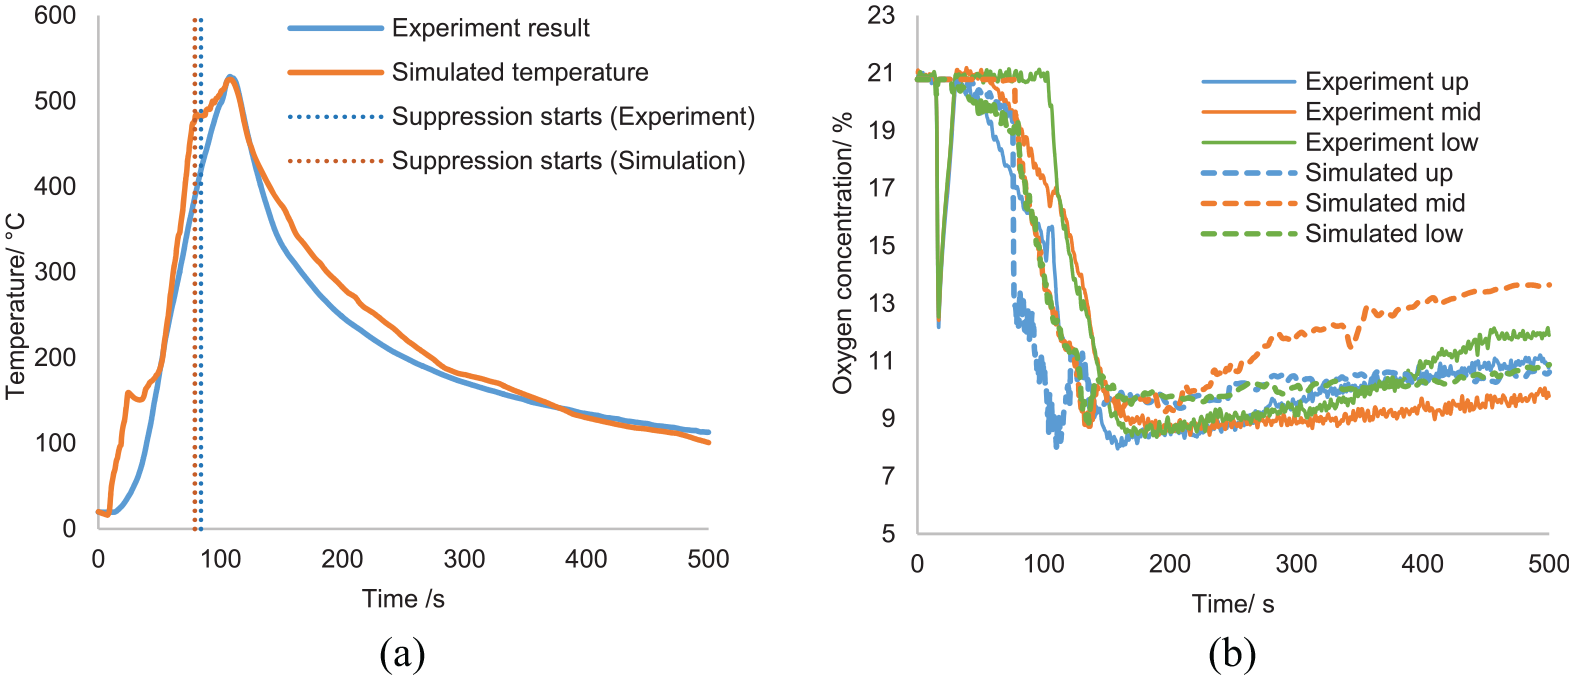
Pyrolysis model results validation: (a) maximum temperature and (b) oxygen concentration.
In both experiment and simulation, around 24 s was required for thermocouples to detect the fire, and the suppression commencement time was around 94 s. Unfortunately, there were no measurements or visual evidence to show the exact time of fire extinguishing in the experiment. The only indication of the success of suppression was the gradual decrease in the temperature profile. In the simulation, the extinguishing criterion was set to HRR = 0, and for the benchmark, this took around 30 s (Figure 7). During the simulation, 0.6 kg of fuel was burnt and resulted in a maximum HRR of 446 kW. This peak HRR is lower than the result calculated from Equation (7) (565 kW). This is mainly because estimations from Equation (7) are hugely affected by experiment uncertainties, 26 like the ventilation arrangement. While the fuel in this test was burned in a confined container, Equation (7) is more applicable for well-ventilated fires. Therefore, it is possible that Equation (7) overestimates the HRR for the current analysis. The simplification of heat transfer process in the FDS pyrolysis model could also be responsible for the discrepancy in HRR. Because the model ignores the convection and lacks detailed descriptions of phase change, it results in biased estimations of evaporation rate and HRR. It should note that in both experiments and simulations, the temperature did not drop immediately after suppression but kept rising for an additional 10 s to a value of 510°C before decreasing. This is mainly because it took a few seconds to reduce the oxygen concentration to the inert limit. The turbulence due to the nitrogen injection results in the mixing of oxygen with fuel-rich pockets, so a short period of HRR rise is noticed at the beginning of suppression.
Oxygen concentration was also measured and compared in Figure 7(b). The simulation prediction was close to that of the experiment, which proves the accuracy of the simulation. Before the suppression, the average oxygen concentration dropped to initiate and support the combustion. When suppression begins, oxygen concentrations at all three points dropped quickly. Towards the end of the suppression, the volume concentration of oxygen reached as low as 8%, and a relatively uniform distribution was observed vertically. After the suppression, due to the falling temperature and forced ventilation, ambient air entered the compartment through the pipes in the sidewall to recover the compartment pressure, which led to an increase in oxygen concentration.
The pressure profiles are given in Figure 8(c). Generally, temperature increases due to combustion, causing the initial pressure rise in the compartment. The injection of suppression agent has the potential to further increase the pressure (because a large quantity of gas was added into this confined space). However, the cooling effect of the low-temperature agent and the pipe ventilation limits this phenomenon and maintains the pressure rise within a reasonable limit, preventing a chance of explosion and further structural damage. The maximum pressure difference reached in the experiment was around 8000 Pa during the suppression. In contrast, in the simulation, the predicted maximum pressure rise given by the pyrolysis model was slightly higher and reached 9300 Pa.
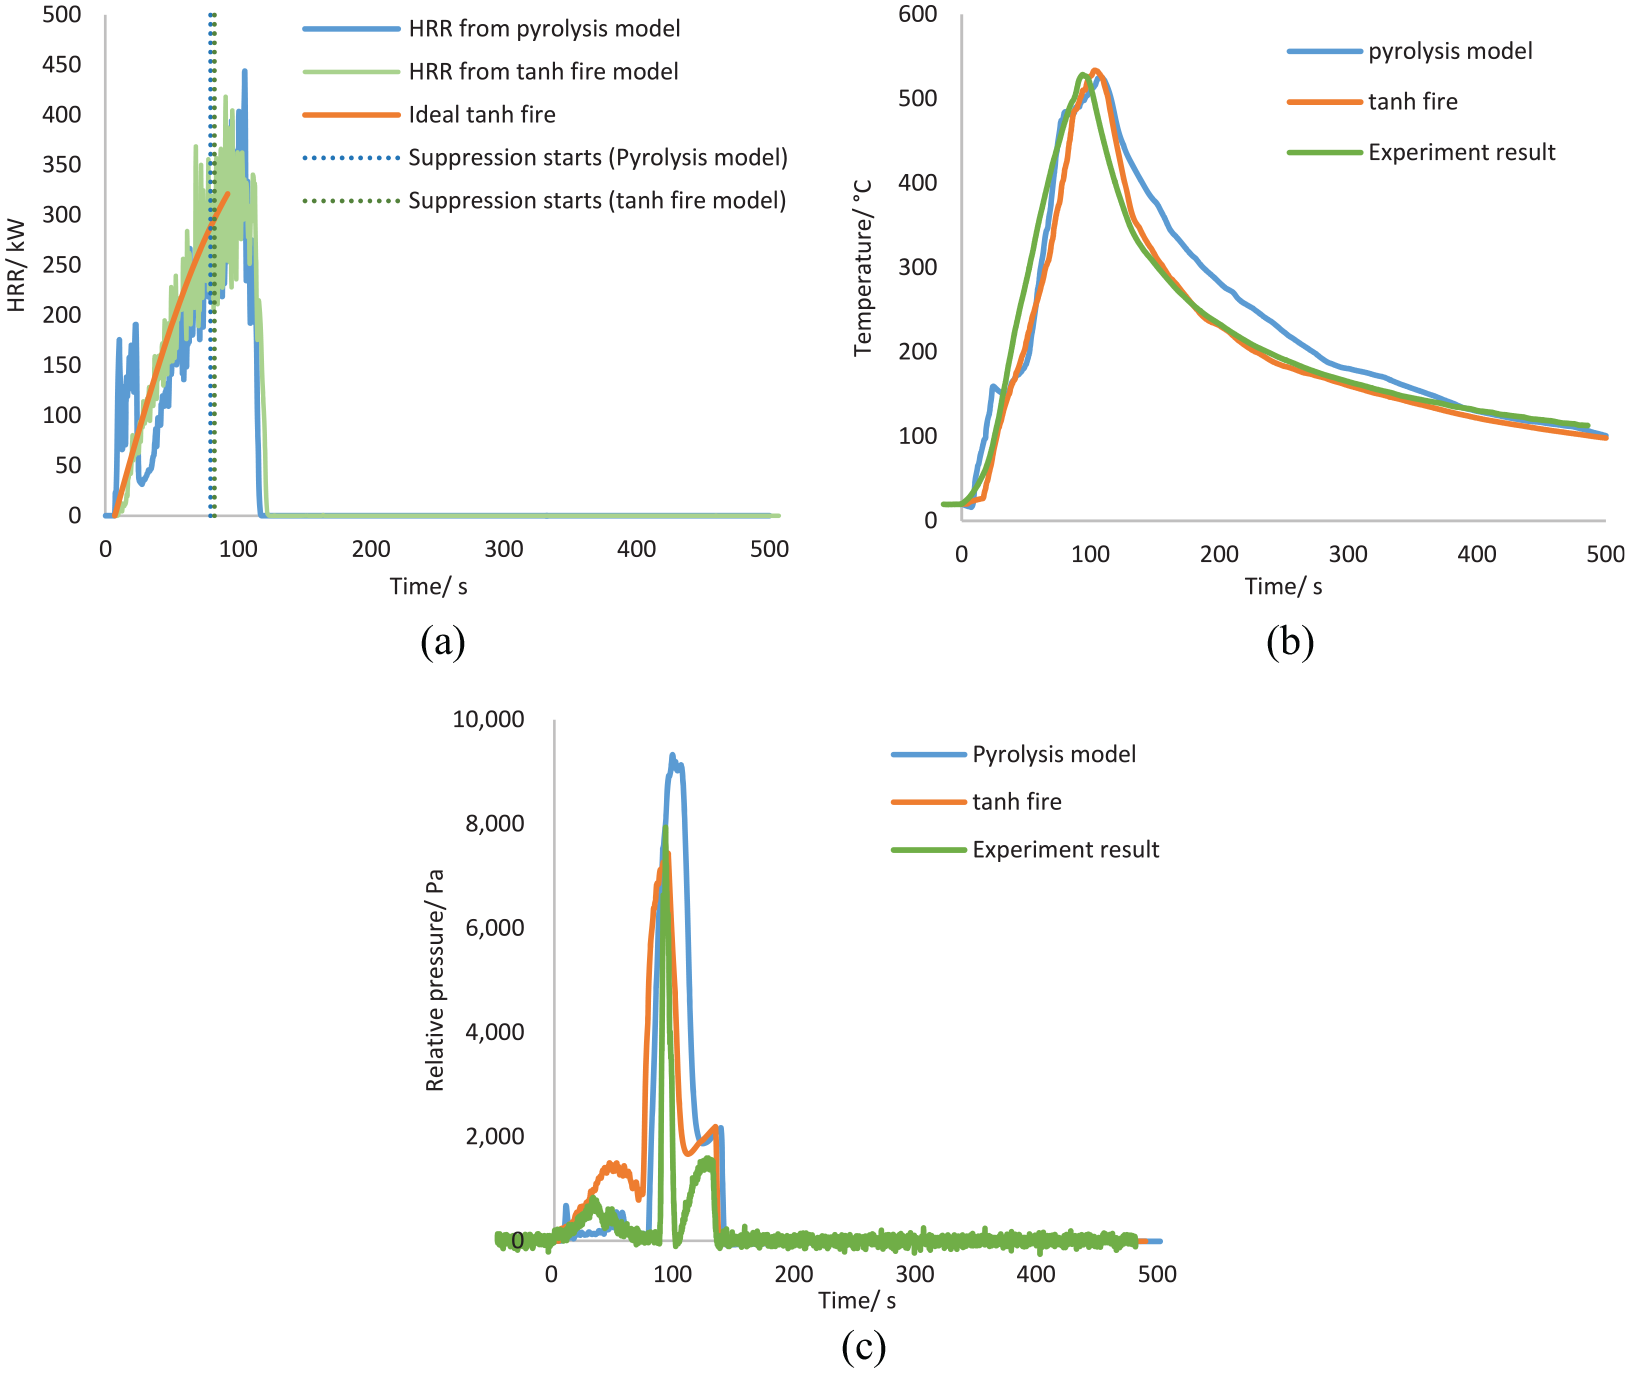
Comparison of pyrolysis model and tan h designed fire: (a) HRR, (b) maximum temperature and (c) pressure rise.
The
fire
When introducing the fire design concept, an ideal
The result of the parameter study is shown in Table 7. Different time constants of the
Surface burning fire simulation results.
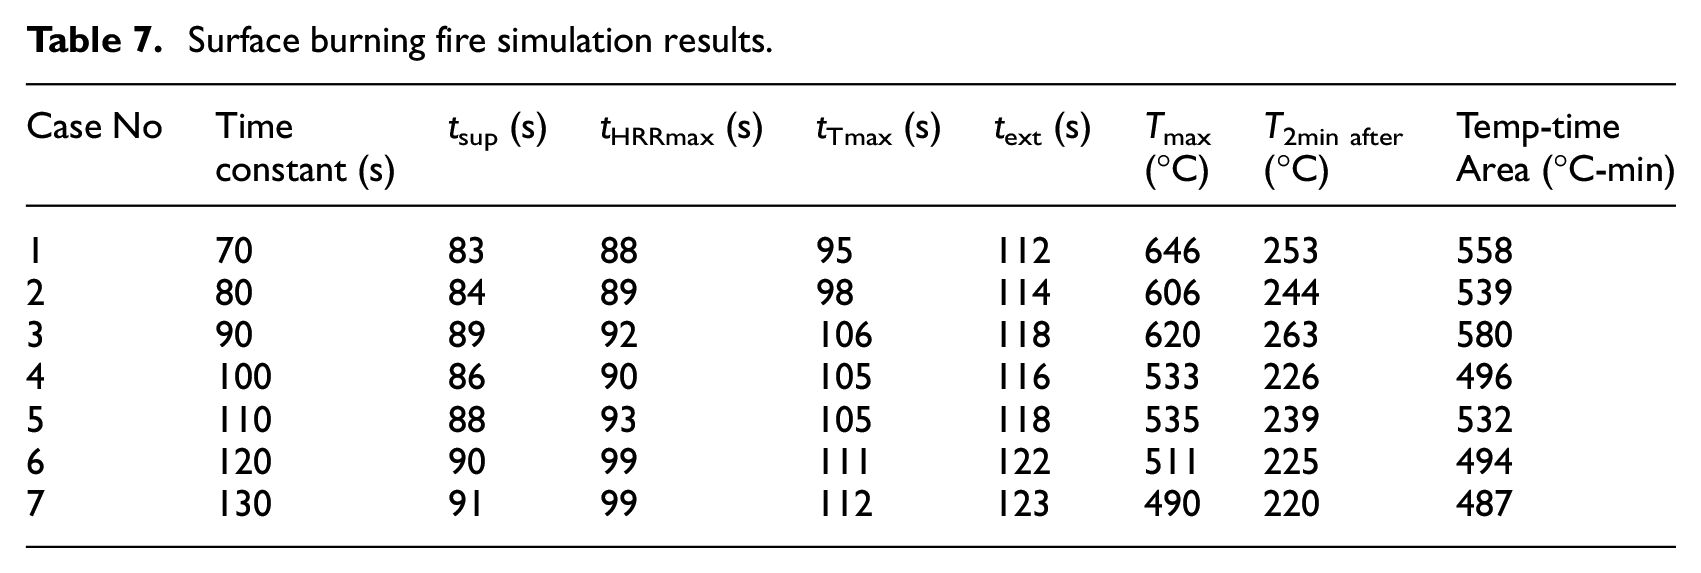
All the test cases resulted in fires being extinguished and are therefore considered to have passed the MPS acceptance criteria. Some cases with a rapidly developed fire (smaller time constant) produced maximum temperatures much higher than the benchmark fire. However, the nitrogen knock-down system was able to decrease and regulate the temperature quickly after suppression. All the fires were detected by TP16, bearing time stamps between 23 and 31 s. It is noticed that rapidly developed fires tend to activate the suppression system quickly. The extinguishing duration, however, does not vary significantly compared to slowly developed fires, which was found to be around 30 s, for all the cases.
After extinguishing the fire, the suppression agent was continuously injected, and the oxygen level decreased until it reached the designed concentration. The designed oxygen concentration was 11.34%; however, this value fell below 9% at the end of simulation for all the cases. This is because the combustion process also consumes a fair amount of oxygen, thus increasing the chance of fire extinguishing. The HRR plot and average oxygen plot are given in Figure 9. The two plots indicate that HRR started to decrease when the oxygen level reached around 12%. After the suppression, the cooling effect resulted in a pressure drop inside the container. Therefore, the oxygen level recovered slowly as ambient air entered the container through the ventilation pipe.
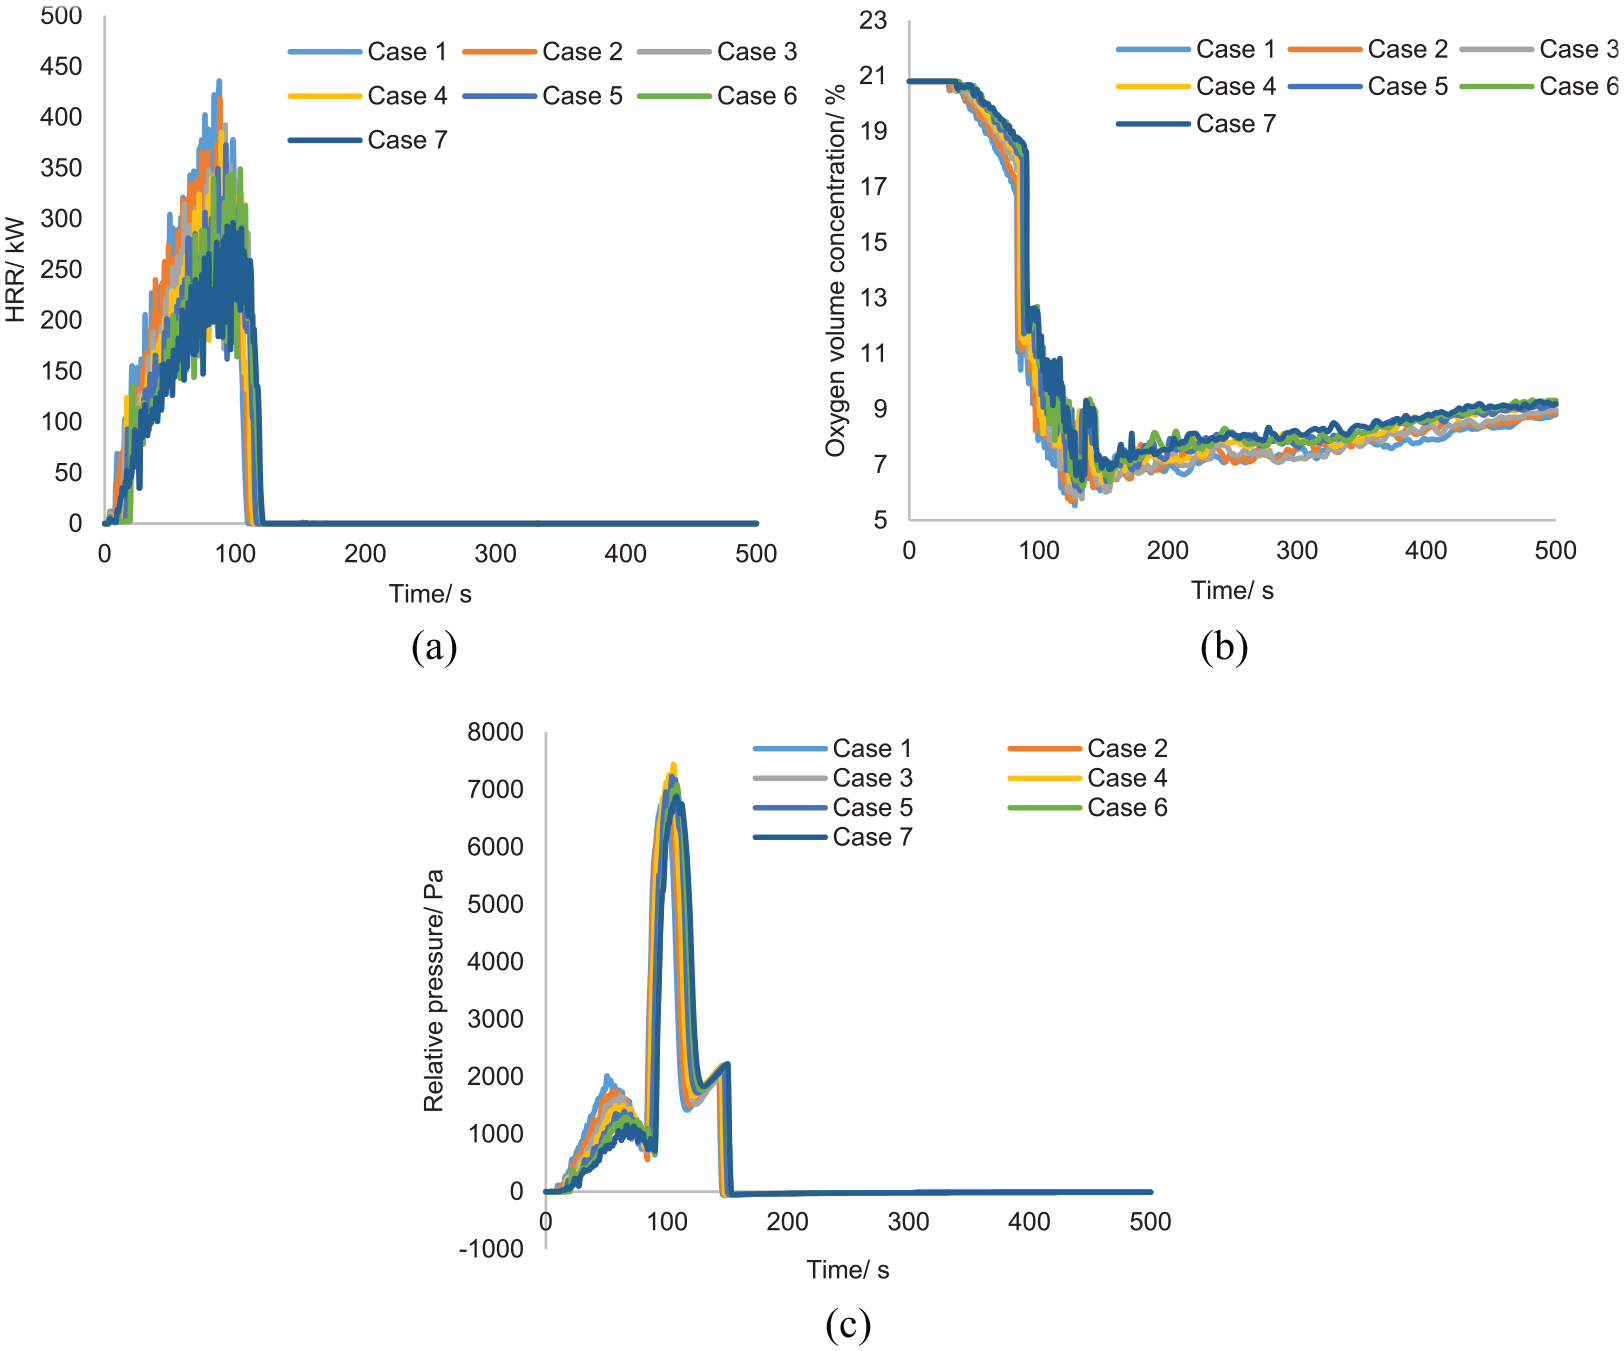
Parameter study of surface-burning fire: (a) HRR, (b) oxygen concentration and (c) relative pressure.
All fire cases exhibit a similar trend in pressure rise (Figure 9(c)). Despite the differences in heat release rate, the maximum pressure rises caused by the agent discharge are almost the same, and reaches around 7000 Pa.
Conclusion
The present research focused on the performance of a nitrogen-based aircraft cargo fire suppression system, using the CFD method to investigate the fire consequences of nitrogen suppression. The surface-burning fire scenario required by MPS was modelled, combined with the concept of fire design for uncertainty analysis. Fire design applies a
(a) For all the tested cases, fire extinguishment is achieved. Temperature criteria and temperature-time criteria specified in MPS are satisfied, with safe margins. Therefore, for the surface burning fire scenario, an inert gas fire suppression system has an overall advantage in terms of temperature performance. However, in the experiment and simulations, around 32 kg of nitrogen was used to achieve an average oxygen concentration below 11.34%. Only 5% of Halon 1301 was required in the original system; therefore, a larger volume of nitrogen needed in the cargo compartment requires a heavier system for successful fire suppression.
(b) For rapid growth surface-burning fires, higher local temperatures were observed. Although suppression was achieved, the high temperature could still be a potential threat to cause structural damage. It can be avoided using either a more sensitive fire detection system to report the fire at early stages or a shorter time delay to reduce the overall heating time.
(c) The surface-burning fire scenario showed a high pressure rise, but the ventilation system was able to keep the compartment pressure within a reasonable range to avoid overpressure and structural damage to the compartment.
(d) Fire design is an efficient simulation strategy to account for system uncertainties, and therefore evaluate the reliability of the design. It relates the fire characteristic (fire growth rate) to the parameters of interest (temperature, pressure, etc.). In reality, it provides guidance for subsequent experimental work by showing the potentially critical fire scenario. For the surface-burning fire, a rapid growth fire results in a higher maximum temperature, and therefore is considered as a critical fire scenario. It is an essential input into a System Safety Assessment.
(e) The study has demonstrated the huge potential in applying CFD for the standardised tests, due to the significant reduction in time, capital and other resources compared with experimental methods.
(f) This method of estimating the MPS reduces the impact on the environment, considering that the experiments use hydrocarbon fuels and various types of inflammable material. Safety is another point to be noted as the personnel involved in the experiments are subject to harmful products of combustion and the risk of explosion.
(g) Despite all the benefits of the proposed method described above, fire experiments cannot be replaced entirely by simulation methods due to the limitation of CFD. For example, CFD inputs rely on empirical data, and the validation of the model also requires a large amount of experimental data. Besides, both simulation and experiment results are strongly affected by the uncertainties; therefore, a more thorough uncertainty analysis is suggested.
The method developed can be extended to the study of fire in different types of geometry. It will be particularly suitable for use in many other fire-critical environments, such as buildings, shipping and surface transportation. This work is the first in the series of studies. Currently other scenarios in MPS like bulk-load, containerised-load and aerosol can explosion are also being developed. Current experiments in these areas are being undertaken at Cranfield University as part of the H2020 project which will be able provide data for comparison. The authors are confident that the methodology developed is robust and will have wider application and the results will be presented in the next series.
Footnotes
Appendix 1
Temperature profile of benchmark surface-burning fire (pyrolysis model).
Appendix 2
Temperature profile of benchmark surface-burning fire (designed fire).
Declaration of conflicting interests
The author(s) declared no potential conflicts of interest with respect to the research, authorship and/or publication of this article.
Funding
The author(s) disclosed receipt of the following financial support for the research, authorship, and/or publication of this article: This research was supported by Environmentally Friendly Fire Suppression System for Cargo using Innovative Green Technology project (EFFICIENT, grant number: 685482) under the Clean Sky 2 research programme.
1
Ozone Depletion Potential – Ability to destroy a unit mass of ozone gas per unit mass of agent relative to CFC-11. Recommended ODP should be less than 0.02 for replacement agents.6
2
Global Warming Potential – Change in radiative forcing as a result of emission of 1 kg of the agent relative to the radiative forcing as a result of emission of 1 kg of CO2. Recommended GWP should be less than 150 for replacement agents.9
3
Atmospheric Lifetime – Ratio of the atmospheric burden of a trace gas to its rate of loss from the atmosphere.
4
Although a boxed shape of compartment is required in MPS, two triangular prisms (0.43 m × 0.51 m × 8.11 m) were added at the bottom of two sides of the compartment to form a hexagonal cross-section (Figure 2c).
5
Sidewall pipes are not part of standard MPS, but were installed in the current experiment.