
Abstract
Grounded in ‘expectancy-value’ theory, this paper reports on the psychometric properties of an instrument intended to measure students’ motivation in mathematics. The participants were 2045 third-, fourth- and fifth-grade students from Estonia, Finland, Norway, Portugal, Serbia and Sweden. The Expectancy-Value Scale (EVS) was found to be suitable for early grades of primary education in measuring competence self-perceptions and subjective task values relative to the mathematics field. The results indicate a good model fit aligned with the expectancy-value theory. The EVS dimensions showed good reliability, and scalar invariance was established. However, findings also indicated high correlations between some of the EVS dimensions, which is well documented for students at this age. The findings are discussed relative to the ‘expectancy-value’ theory framework and students’ age.
Introduction
Motivation is a critical ingredient of learning, and the ‘expectancy-value’ theory is one of the most prominent frameworks for explaining why individuals engage in achievement-related tasks. This paper aims to analyse the psychometric proprieties of a mathematics motivation scale for primary school students based on the ‘expectancy-value’ theory (Eccles et al., 1983; Wigfield & Eccles, 2020).
Eccles et al. (1983) proposed a model that considers the interplay between expectancies for success and the values attributed to the task as being crucial for an individual’s choice, engagement and performance (Wigfield & Eccles, 2020). Here, expectancies are defined as individuals’ beliefs about their success in future tasks, and values are the qualities of tasks and their influence on the motivation for doing the tasks (Wigfield & Cambria, 2010). The theory differentiates between four components of achievement task values: attainment, intrinsic value, utility and cost.
Attainment value incorporates identity issues, including the importance of doing well on the task, and is bounded by the extent to which the task fulfils the person’s needs. The concept connects to the importance of the activity in the broader spectrum of the individual self-schema (Eccles & Wigfield, 2020), implying that people engage in activities to confirm relevant facets of their self-schema. Intrinsic value relates to the enjoyment one develops from participating in a task or interest in the subject, similar to the notion of intrinsic motivation (Eccles et al., 1983). Utility value rests on the individual’s perception of the usefulness of the task in achieving important goals, even if there is no interest in the task itself; it is related to the more extrinsic reasons for engaging with the task and touches upon the individual’s future goals (Wigfield & Eccles, 2020). Cost is the final identified dimension of the value component that incorporates all the adverse aspects of engaging in the task (e.g. effort and alternative activities). Cost is critical for choice because all choices involve considerations of what one must give up doing a task (Eccles et al., 1983; Wigfield & Cambria, 2010). Despite its importance, the cost dimension has been the least studied value constituent compared with other components (Kosovich et al., 2015; Wigfield & Cambria, 2010).
When studying the development of children’s self and task perceptions, Eccles and Wigfield (2020) concluded that starting in primary school, children distinguish between self-beliefs associated with different activities and discriminate between valuing activities and their competence perceptions for these activities. Moreover, regarding the value component, elementary school children differentiate intrinsic value from utility and attainment, but a partial overlap is reported when observing utility and attainment alone (Wigfield & Cambria, 2010).
Current Study
Grounded in the ‘expectancy-value’ theory (Eccles et al., 1983; Wigfield & Eccles, 2020), the present study analyses the psychometric proprieties of the Expectancy-Value Scale (EVS). Departing from a previous version (Peixoto et al., 2019) that comprised four dimensions: perceived competence (PC), intrinsic value (IV), utility value (UV) and cost (C), a fifth dimension, the attainment value (AV), was added. We intended to test the EVS instrument and explore its usability across countries and its suitability for primary education students relative to the mathematics field.
Methods
Participants
The participants were 2045 students (50.5% girls) in third (n = 672), fourth (n = 745) and fifth grades (n = 628), from Estonia (n = 464), Finland (n = 304), Norway (n = 339), Portugal (n = 339), Serbia (n = 437) and Sweden (n = 162). Parents’ consent forms were received for each student.
Instruments and Procedures
Expectancy-Value Scale instrument
Built on the Expectancy-Value Motivation Scale (EVMS; Peixoto et al., 2019), new items assessing AV were added. A panel of international experts evaluated whether each item was appropriate to the AV dimension or whether it should be placed into one of the four other dimensions. Four of the eleven newly developed items were removed because expert evaluations were not unanimous. The process resulted in a total of 34 items distributed over five dimensions: PC (6 items, e.g. Math is easy for me), IV (8 items, e.g. I like doing math), AV (7 items, e.g. Being good in math is very important to me personally), UV (7 items, e.g. What I learn in math I can use in daily life) and C (6 items, e.g. Doing math problems keeps me away from other things I like). The items were set on a 4-point scale ranging from ‘a lot of times’ to ‘never’.
Earlier, the EVMS was developed in English and translated into Finnish, Norwegian, Portuguese and Serbian, followed by back-translation procedures. The same procedures were repeated for the AV items in the EVS. The Swedish and Estonian versions followed the described procedures for all items. No significant content differences compared with the original wording were reported.
Math Identity Scale
The Math Identity Scale is a 6-item instrument measuring how much students feel math is essential to their identity (e.g. Being good at math is an important part of who I am). Confirmatory factor analyses (CFA) support the unidimensionality of the measure, χ2(9) = 105.9, p < .001, CFI = .988, TLI = .980 and RMSEA = .073, while the reliability is good (Cronbach’s α = .821, McDonald’s ω = .834, Composite Reliability (CR) = .868; Radišić et al., 2022).
Math tests
Two math tests were used as achievement measures. The first comprised 12 (third grade) or 14 (fourth and fifth grade) tasks adapted from TIMSS 2011 (IEA approval 22/022). The second test assessed arithmetic fluency (Klausen & Reikerås, 2016), including addition, subtraction and multiplication (omitted in third grade).
Procedures
Trained research assistants administered EVS in a whole-class setting during regular mathematics instruction. Before the measure was administered to the students, they were given practice items on how to answer the survey. Each test item was read aloud to control for reading difficulties.
Data Analyses
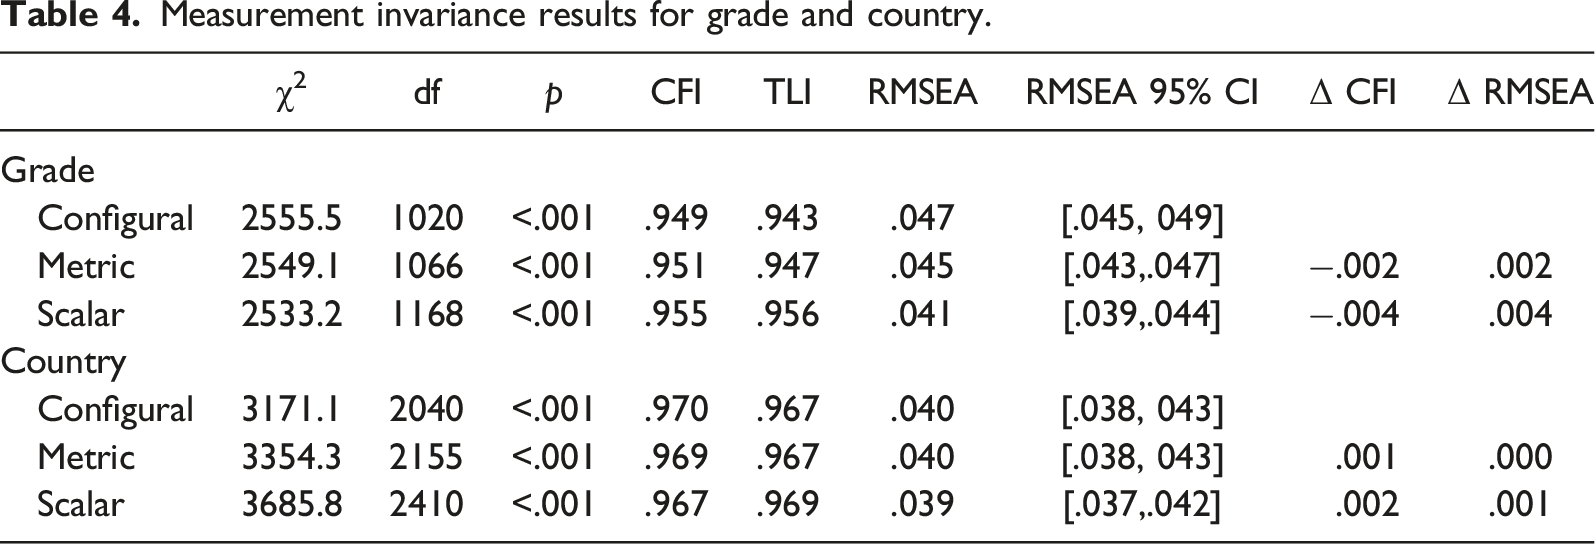
CFA was carried out in Mplus 8 (Muthén & Muthén, 1998–2017) to examine the theory-proposed factor structure of the scale by our data. The WLSMW estimator was used because of the ordinal nature of the data. The hierarchical structure of the data (i.e. students nested in schools) was taken into account using the option ‘TYPE = Complex’ in Mplus. The goodness of fit was assessed by considering values of the CFI and TLI higher than .95 and RMSEA <.08 as acceptable (Brown, 2015). To test how well the factors differentiated and how the items within each factor related to each other, we followed the guidelines proposed by Cheung and Chang (2017) and Fornell and Larcker (1981). Cronbach’s alpha, McDonald’s omega and CR were used to assess reliability. To further test the properties of the EVS, we analysed the correlations of the EVS dimensions with the identity scale and the scores from the two math tests. Comparing configural, metric and scalar invariance models, we inspected cross-country and cross-grade measurement invariance. Considering that the chi-square test is susceptible to sample characteristics, we used the difference in CFI and RMSEA to test measurement invariance. Differences in CFI <.01 and in RMSEA <.015 were considered indicating measurement invariance (Chen, 2007).
Results
Goodness-of-Fit Indices for the Tested Models.
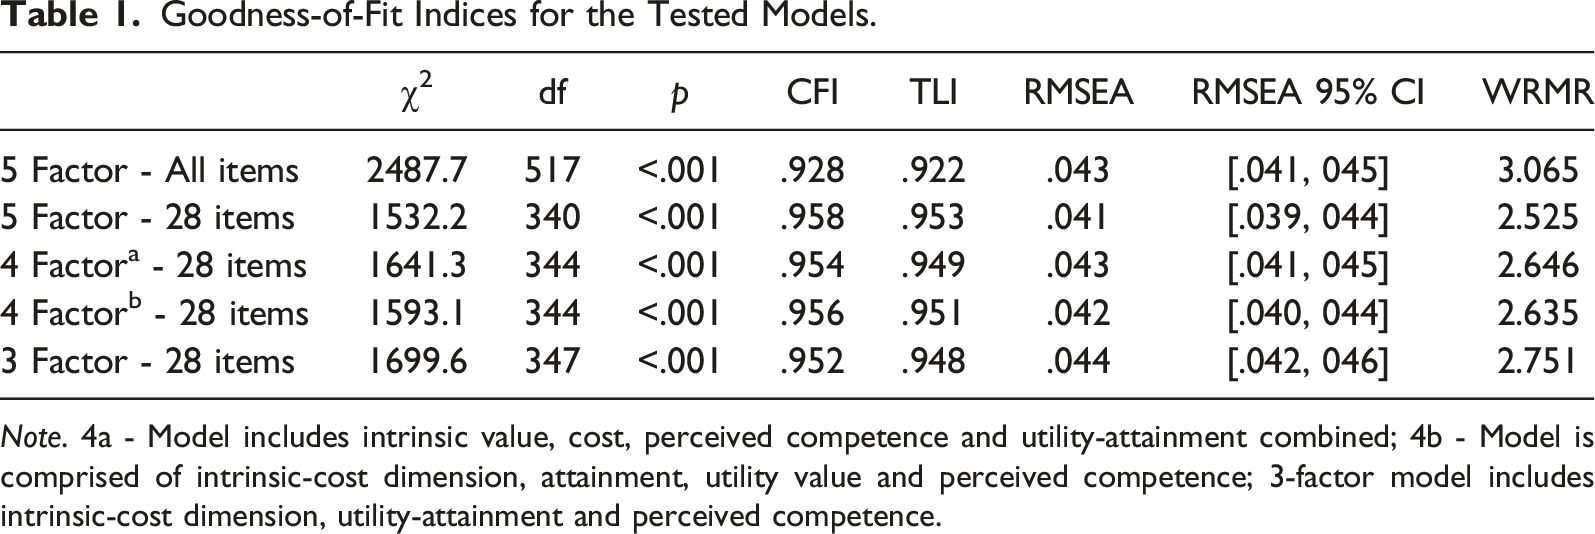
Note. 4a - Model includes intrinsic value, cost, perceived competence and utility-attainment combined; 4b - Model is comprised of intrinsic-cost dimension, attainment, utility value and perceived competence; 3-factor model includes intrinsic-cost dimension, utility-attainment and perceived competence.
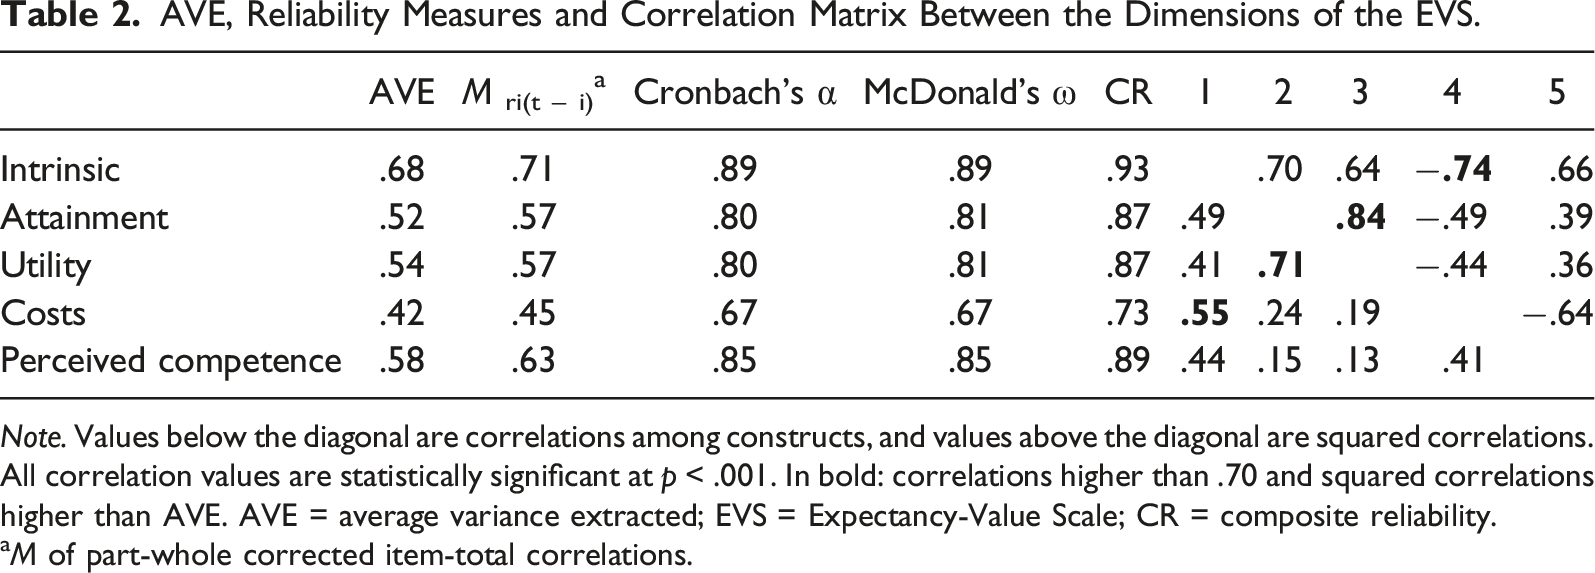
Analyses of the AVE, the factor loadings and the CR of the scale dimensions (Figure 1, Table 2) showed that, except for the cost (C) dimension, all other dimensions presented acceptable values (Cheung & Chang, 2017; Fornell & Larcker, 1981), indicating that the items included in each factor shared a high proportion of variance. The C dimension contained one item with a factor loading <.50, and the AVE was also lower than the threshold of .50. To analyse whether the defined factors differentiated from each other, we compared the AVE with the squared correlation between the constructs, following the recommendations of Fornell and Larcker (1981). Cheung and Chang (2017) also suggested avoiding a correlation between constructs significantly higher than .70. Table 2 shows that all pairs of dimensions, except for utility–attainment (UV-AV) and cost–intrinsic (C-IV), differentiated well from each other. Following this result and previous work related to younger students (e.g. Eccles & Wigfield, 2020; Wigfield & Cambria, 2010), we performed additional analyses merging the UV items with AV and C items with the IV dimension to test whether it is appropriate to keep all five dimensions separate. First, we tested two different models with four factors, which showed a slightly worse fit than the model with five dimensions. Additionally, we tested the three-factor model, which showed an even worse fit to the data (see Table 1 for fit indices of different models). Results of the 5 factor model with 28 items. Note. The coefficients presented are standardised linear regression coefficients, and all are significant (p < .01). AVE, Reliability Measures and Correlation Matrix Between the Dimensions of the EVS. Note. Values below the diagonal are correlations among constructs, and values above the diagonal are squared correlations. All correlation values are statistically significant at p < .001. In bold: correlations higher than .70 and squared correlations higher than AVE. AVE = average variance extracted; EVS = Expectancy-Value Scale; CR = composite reliability. aM of part-whole corrected item-total correlations.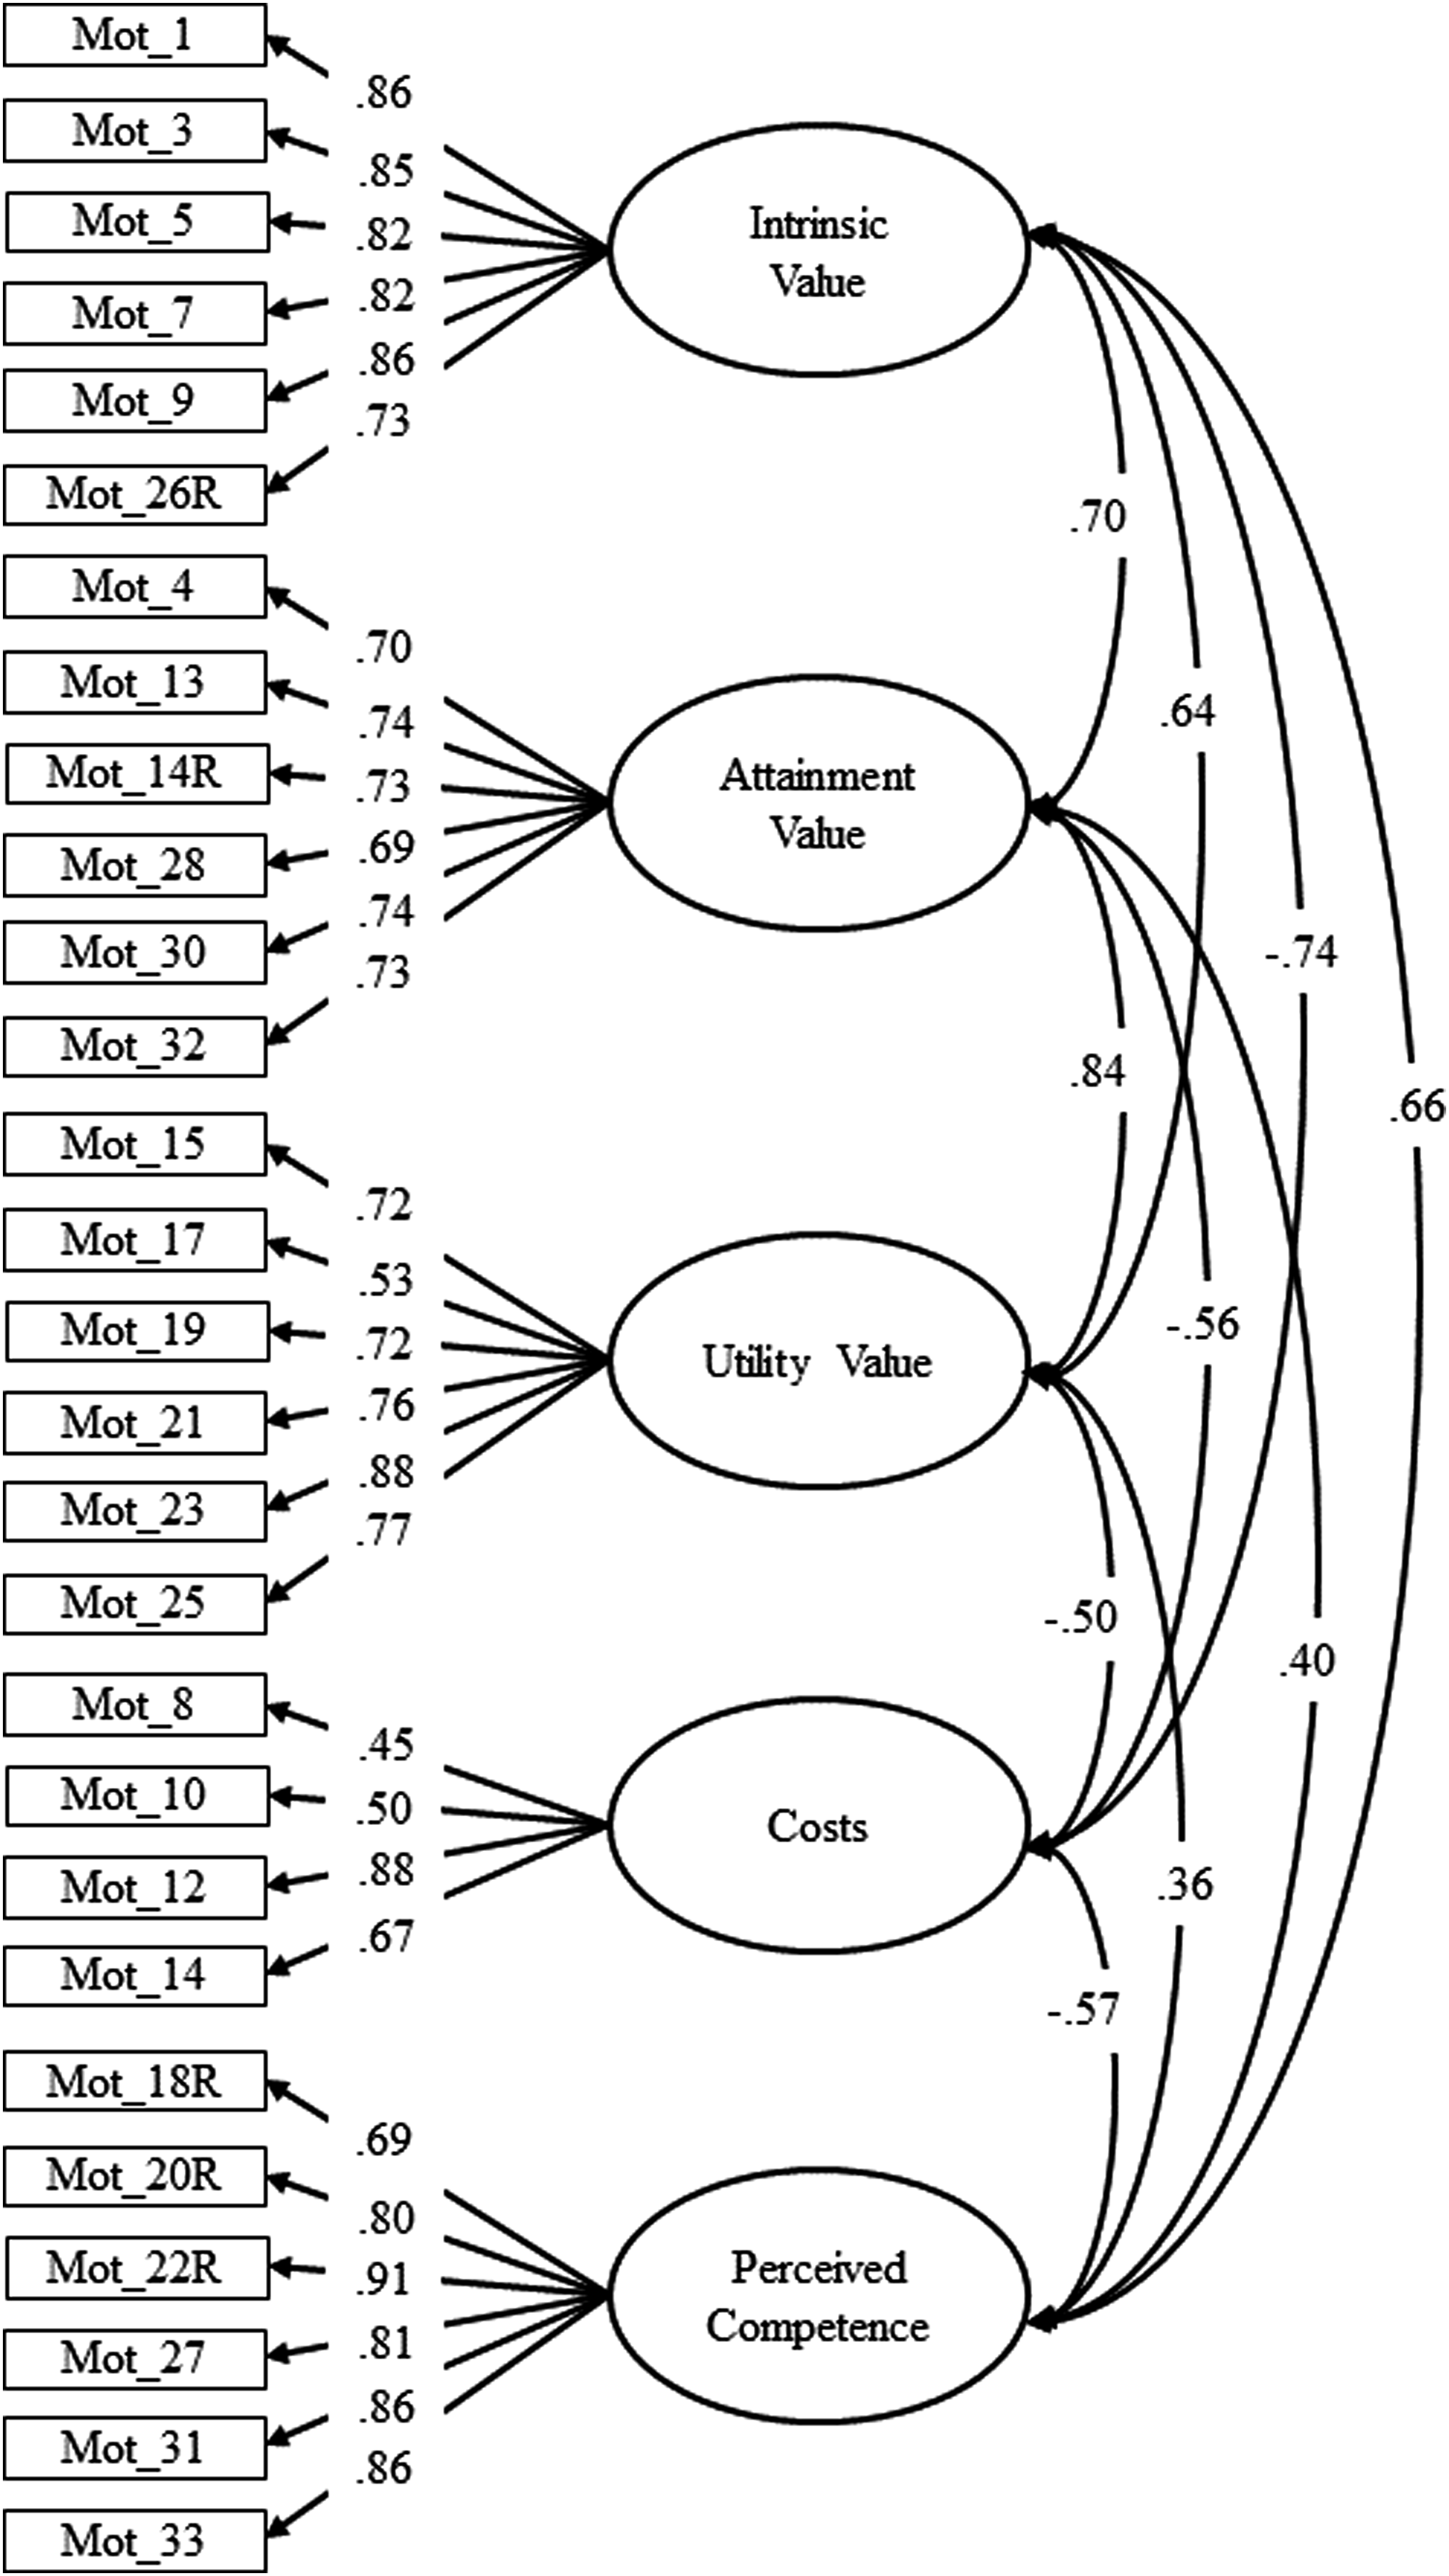
Correlations of the EVS Dimensions with Identity Scale and Achievement Tests.
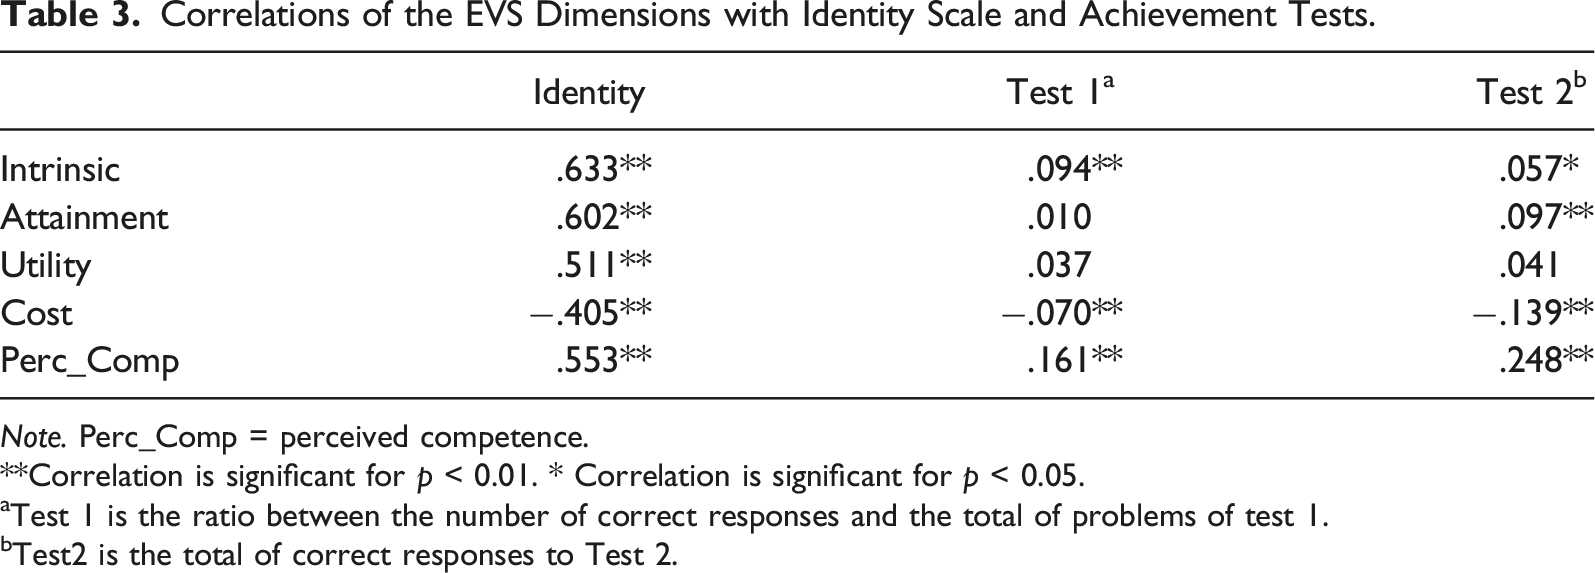
Note. Perc_Comp = perceived competence.
**Correlation is significant for p < 0.01. * Correlation is significant for p < 0.05.
aTest 1 is the ratio between the number of correct responses and the total of problems of test 1.
bTest2 is the total of correct responses to Test 2.
Measurement invariance results for grade and country.
Discussion
The purpose of the present study was to contribute to the construction of the EVS through analyses of its psychometric properties. The CFA findings validated the suitability of the EVS instrument for its use in early grades of primary education in different educational settings, describing the five dimensions aligned with the ‘expectancy-value’ theory. Nevertheless, our findings showed high correlations between some EVS dimensions. Previous research on EVT has pointed out this problem with younger students (Eccles & Wigfield, 2020; Wigfield & Cambria, 2010; Wigfield & Eccles, 2020), namely the overlap between AV and UV. Because of this, to avoid multicollinearity problems, we recommend some caution when simultaneously using the AV–UV and C–IV dimensions in structural equations modelling or other regression-based analyses. However, considering the correlation between those dimensions and the external measures, the use of all the dimensions, both in research using other analytical approaches and clinical use, is recommended. Furthermore, the experts’ evaluation validated the items’ belongingness to each dimension, which is an essential step in the validation process – or, as Borsboom et al. (2004) described it, ‘… if one knows exactly what one intends to measure, then one will probably know how to measure it …’ (p. 1067).
The correlations between the EVS dimensions and the identity and test scores were in the expected direction, hence presenting the predicted pattern. The IV and AV dimensions showed the strongest correlations with the identity measure. By its very definition, AV is related to identity (Eccles & Wigfield, 2020; Wigfield & Cambria, 2010), which can explain the higher level of the correlation between the two variables. Similarly, if a particular subject (e.g. mathematics) contributes to the person’s identity, it can be postulated that the tasks related to this subject will be intrinsically valued. The correlations with the achievement tests were lower than those with the identity measure but were in the expected direction and order. All the EVS dimensions presented positive correlations with the test scores, except for the C dimension. PC demonstrated the strongest correlation, and its magnitude was within the expected range (Möller et al., 2009; 2020).
The results for the C dimension were promising. The CR score was acceptable, and the other reliability indices were close to the threshold of .70 (Nunnally, 1978). Moreover, as expected, the C dimension was negatively associated with the other dimensions of EVS, the identity measure and the achievement tests. These results are noteworthy because the C dimension is often excluded from instruments intended for this age group (Kosovich et al., 2015). At the same time, current results pave the way for some future developments of the EVS, namely, further improvement in the wording of the C items, thus leading to an even better dimension fit and improvement in the AVE and reliability scores.
The results of the measurement invariance confirm EVS is suitable for use in different education settings (i.e. countries) and grades, allowing for deeper cross-country comparisons and insights into students building their task values and competence self-beliefs over time or in connection to other concepts central to motivation, such as achievement or identity.
Footnotes
Declaration of conflicting interests
The author(s) declared no potential conflicts of interest with respect to the research, authorship, and/or publication of this article.
Funding
The author(s) disclosed receipt of the following financial support for the research, authorship, and/or publication of this article: This work was supported by the Norges Forskningsråd (FINNUT (grant number 301033)).