
Abstract
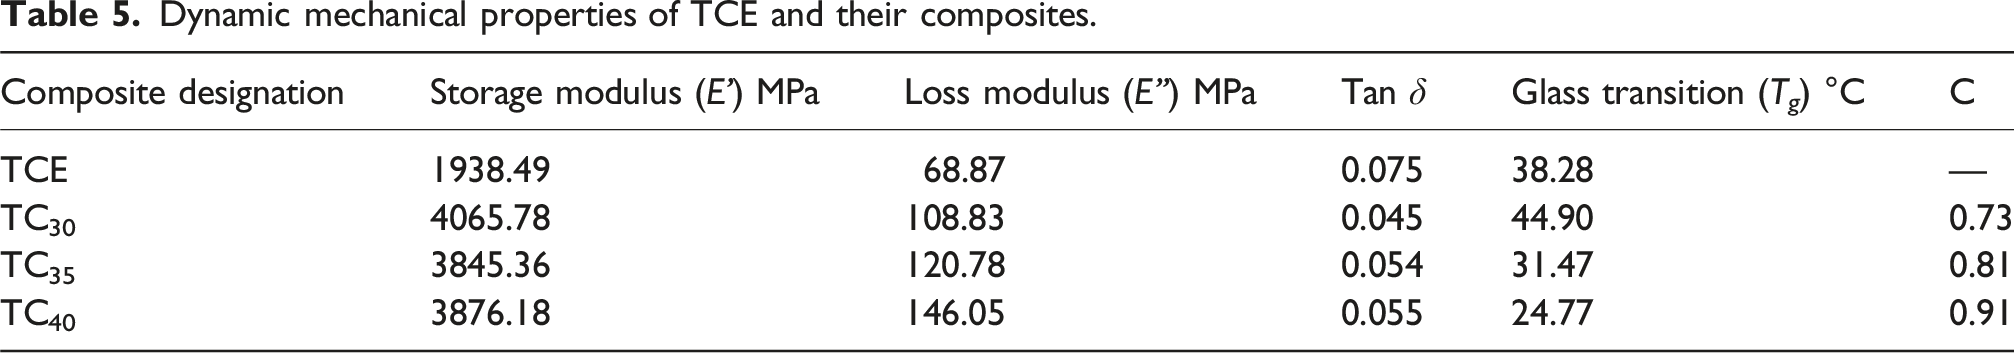
The low mechanical strength of thermoplastic copolyester elastomer (TCE) limits their use in structural applications. To improve thermal and mechanical performance, silicon carbide (SiC), polytetrafluoroethylene (PTFE), and short glass fiber (SGF) were used to strengthen TCE in this work. Injection molding and twin-screw extrusion were used for producing composites. Based on thermal analysis, hybrid SGF–PTFE–SiC improved char yield, altered melting and crystallization behavior, and raised the degradation temperature from 405.6°C to 423.9°C. According to dynamic mechanical research, 30 wt% SGF increased the loss modulus from 69 to 109 MPa (+58%) and the storage modulus from 1938 to 4066 MPa (+109%). Hybrid fillers further improved rigidity and decreased damping. Mechanical tests showed that 30 wt% SGF increased tensile strength to 76.49 MPa (+113%) and tensile modulus to 6.05 GPa (+212%); hybrid filler incorporation up to 40 wt% further increased impact strength by 35% and modulus to 6.75 GPa (+248%). Improved fiber-matrix adhesion was shown by SEM of broken surfaces; toughness was increased by fiber pullout, breaking, and decreased voids. These findings demonstrate the promise of SGF and hybrid-filled TCE composites for high-performance structural applications, such as lightweight engineering components, high-temperature load-bearing systems, and automotive components.
Keywords
Introduction
Environmental concerns, carbon footprint reduction, and recyclability demands are driving polymeric composites’ rising use across industries. Large corporations’ carbon neutrality targets boost interest in recycling and sustainable materials. The construction sector, a major CO2 emitter, focuses on optimized designs and alternative additives.1–3 Thermoplastic composites gain popularity for waste management and recyclability, offering advantages over thermosets. 4 Sustainability needs to propel this shift. 5 Demand surges in automotive, aerospace, and consumer goods for high-performance polymers. 6 Thermoplastic copolyester elastomers (TCE) excel as matrices for elasticity, chemical resistance, and thermal stability. Yet, they need property enhancements for demanding applications. Glass fibers (GFs) boost rigidity, while dual filler systems synergistically improve strength and insulation.7,8
Despite their modest stiffness and thermal stability, TCE are promising materials for engineering applications due to their superior flexibility and chemical resistance. However, this requires creative reinforcement techniques. This study investigates how short glass fibers (SGF) in conjunction with silicon carbide (SiC) and polytetrafluoroethylene (PTFE) can improve the thermo-mechanical characteristics of TCE composites. Optimal interfacial bonding and performance gains are clarified by the study through standardized hardness testing (ASTM D2240), silane coupling agent (APTES) pretreatment, and methodical examination of fabrication processes. By providing avenues for enhanced durability, hardness, and heat resistance in high-performance applications, these findings will progress the design of composite materials.
Thermoplastic composites can be manufactured using compression molding and other techniques as well, such as 3D printing, electrospinning, etc., and their properties can be tailored by adjusting the filler type and content.9–12 The incorporation of SGF, PTFE, and SiC fillers into TCE significantly influences their thermal and mechanical properties. 13 SGF reinforcement generally improves the mechanical strength and stiffness of TCE composites, whereas PTFE enhances their tribological performance.13,14 Hemanth et al. 15 reported that 20 wt% SGFs markedly improved the mechanical properties of TCE/PTFE composites. The incorporation of SCF and micro-scale fillers enhanced performance through synergistic reinforcement, as confirmed by SEM analysis indicating uniform distribution. Research on thermoplastic elastomers (TPEs) as matrix materials has been limited, with most studies focusing on specific applications or properties rather than on comprehensive investigations of TPE-based composites. Some studies have explored TPEs for specialized applications, such as magnetorheological elastomers with TPE matrices, 16 flame retardancy, 17 and energy absorption. 18 By combining experimental and micromechanics investigations, Miyase et al. 19 investigated the elevated-temperature thermal expansion of PTFE/polyetheretherketone (PEEK) composites reinforced with graphite flakes and short carbon fibers, demonstrating the influence of constituent characteristics and composite microstructure on thermal behavior. According to their research, the thermal expansion of the composite up to 240°C is largely determined by microstructural elements and thermal-mechanical connection.
Fazli and Rodrigue 20 developed recycled high-density polyethylene (rHDPE)-based thermoplastic elastomer composites using recycled tire textile fiber and regenerated tire rubber to increase stiffness and sustainability. Fiber significantly reduced impact strength while increasing tensile and flexural moduli. Later, a maleic anhydride-grafted polyethylene (MAPE)/recycled rubber (RR) blend was employed to increase compatibility and toughness. The modified composites exhibited enhanced elongation at break, increased impact resistance (by 60%), and improved thermal stability due to stronger interfacial adhesion and molecular entanglement. According to Teodorescu et al.’s study, 21 long glass fiber (LGF) reinforced polypropylene (PP) significantly improved its elasticity, impact strength, and surface hardness when treated fly ash (C) and styrene-ethylene-butylene-styrene (E) were added. The optimized composite (PP–25LGF–6.5 C–20E) is a good choice for lightweight automotive applications because of its well-balanced thermo-mechanical characteristics. Interfacial adhesion between the TCE matrix, glass fibers, and any additional micro/nanofillers strongly controls the mechanical properties of glass fiber-reinforced TCE composites. Compatibilizers enhance this interface, increasing its strength, stiffness, and ability to transfer stress under load more effectively. 22 In rHDPE/RR/RTF composites, the compatibilizer MAPE improved interfacial adhesion, encouraging uniform filler distribution and boosting elongation at break by as much as 173%. Rubber phase encapsulation increased impact toughness by 60% by creating a soft interphase that decreased stress concentration, and stronger molecular entanglements increased thermal stability. 23 Saba and Jawaid 24 emphasized the importance of thermo-mechanical analysis (TMA) as a sensitive and reliable technique for evaluating phase changes, glass transition, and thermal expansion in polymer composites. Their compilation of TMA’s fundamental ideas and uses in polymers, hybrid composites, and nanocomposites emphasizes the material characterization process’s critical importance. The mechanical and thermal conductivity properties of styrene-butadiene rubber (SBR) and styrene-butadiene-styrene (SBS) elastomers filled with silica nanofibers and functionalized graphene oxide were investigated by Park et al, 25 who focused on the impact of filler surface chemistry and dispersion methods. The study demonstrated synergistic gains in composite performance by using advanced analytical techniques for thorough characterization. Li et al. 26 showed that using poly(ethylene-butylacrylate-glycidyl methacrylate) (EBAGMA) as a compatibilizer in glass fiber-reinforced polymer composites greatly increased interfacial adhesion, resulting in improved tensile strength/modulus and refined morphology. While dynamic mechanical and thermal properties demonstrated higher storage modulus and thermal stability because of strengthened fiber-matrix interactions, rheological analysis revealed decreased melt viscosity and improved processability.
LGF-reinforced thermoplastic elastomer composites were studied by Fazli and Rodrigue. 23 They showed increased storage modulus and tan δ peaks via DMA, with higher glass transition temperatures suggesting limited chain mobility. In comparison to short fiber counterparts, morphology demonstrated uniform fiber dispersion and strong interfacial bonding, resulting in superior tensile strength/modulus and thermal stability. In their investigation of LGF-reinforced polyphenylene sulfide (PPS) thermoplastic composites, Li et al. 27 found that DMA greatly increased the storage modulus and tensile strength (by 11–13% compared to short fibers). In comparison to short fiber variations, morphology analysis showed improved fiber length retention and dispersion in LGF/PPS, which correlated to increased thermal stability and decreased crystallinity. According to Maurya et al., 28 a comprehensive analysis using techniques like DSC, TGA, and DMA is required to predict the thermal behavior of elastomeric blends because simple additive laws are insufficient. The study also demonstrated the significant improvements in elastomer composites’ mechanical properties, thermal stability, and crystallinity that compatibilizers, cross-linking density, and nano inorganic fillers provide. Bashir 29 talked about the use of dynamic mechanical analysis (DMA) to study interfacial interactions in filled polymers and stressed how important these interactions are in determining viscoelastic properties and performance. According to the review, strong filler-matrix interactions typically result in a lower tan δ peak value, which indicates better interfacial bonding. Tan and Stephens 30 investigated the viscoelastic behavior of PTFE-based materials using DMA, looking at storage modulus, loss modulus, and tan δ in the frequency domain and relaxation modulus and creep compliance in the time domain. Additionally, the study employed energy dispersive X-ray spectroscopy for compositional analysis and the Prony series to model the data for accurate curve fitting. Ibrahim et al. 31 investigated the dynamic mechanical properties of PTFE composites with respect to reinforcements made of glass, carbon, and bronze fibers. They discovered that the addition of fibers improved the loss modulus, storage modulus, and glass transition temperatures. The results of the study indicate that these reinforced composites, in particular glass fiber (GF25), carbon fiber (CF25), and bronze fiber (BF40), exhibit enhanced performance suitable for automotive and aerospace applications.
Principal component analysis (PCA) has gained significant traction in the characterization of polymer matrix composites (PMCs) due to its ability to reduce high-dimensional experimental data into interpretable principal components while preserving essential variance patterns. Palacios Moreno et al. 32 employed PCA in conjunction with acoustic emission (AE) feature extraction and unsupervised clustering to differentiate damage modes in glass fiber-reinforced polymer composites during tensile loading. PCA was used to reduce multiple AE descriptors into principal components that provide clearer clusters corresponding to matrix cracking, fiber breakage, and delamination. In hybrid polymer nanocomposites, researchers have integrated PCA into decision-making tools such as TOPSIS and Taguchi methods to objectively assign weights to multiple mechanical responses (strength, modulus, and impact resistance) and rank material performance. 33
Numerous studies have been conducted, but it is still unclear how SiC, PTFE, and SGF fillers work together to affect the thermo-mechanical behavior of TCE composites. Although research on single-filler or isolated properties prevails, thorough investigations of multi-filler dispersion, interfacial bonding, and structure-property correlations in TCE are limited. Furthermore, the effects of dual fillers on mechanical reinforcement, thermal stability, and recyclability are essential for the sustainability and high performance of thermoplastics. This study examines the synergistic effects of dual fillers (PTFE and SiC) in SGF/TCE composites to improve strength, stability, and performance. It distinctly clarifies multi-filler interactions and structure-property correlations, bridging the gap. Principal component analysis (PCA) statistically categorizes TCE, and their composites based on their overall behavior.
Materials and methods
Materials
The matrix material for this study was chosen to be TCE, specifically Arnitel EM740 from DSM Engineering Plastics (Pune, India), because of its remarkable mechanical strength and thermal stability.
The silane coupling agent (3-Aminopropyl) triethoxysilane (APTES, ≥98.0%, Cat. No. 741442) was procured from Sigma-Aldrich, Bangalore, India. The density of this liquid silane (CAS No. 919-30-2, MW 221.37 g/mol) is 0.929 g/mL at 25°C, its refractive index is n20/D = 1.421, and its boiling point is 217°C at 760 mmHg. APTES was used as a coupling agent to improve the interfacial adhesion between the glass fibers and the TCE matrix because it contains both hydrolyzable ethoxy groups and amino groups. To strengthen interfacial bonding and improve the overall mechanical performance of the TCE/SGF composites, the short glass fibers (SGFs) were pre-treated with APTES.
The SGFs were purchased from Fine Organics and had an average diameter of 12 μm and a length of 6 mm. The 6 mm SGF length was selected to maintain a sufficient fiber aspect ratio for efficient reinforcement while guaranteeing good dispersion and flowability during extrusion and injection molding. Additionally, this length reduces processing flaws and fiber breakage, confirming the TCE composites’ consistent mechanical performance.
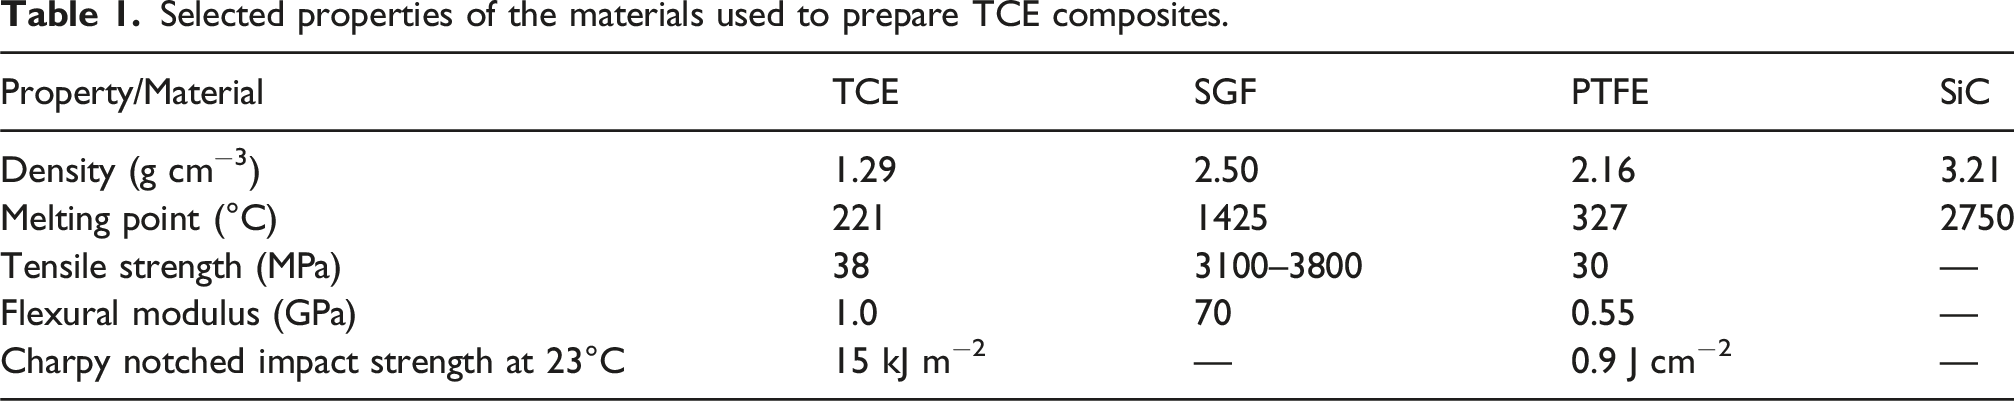
Selected properties of the materials used to prepare TCE composites.
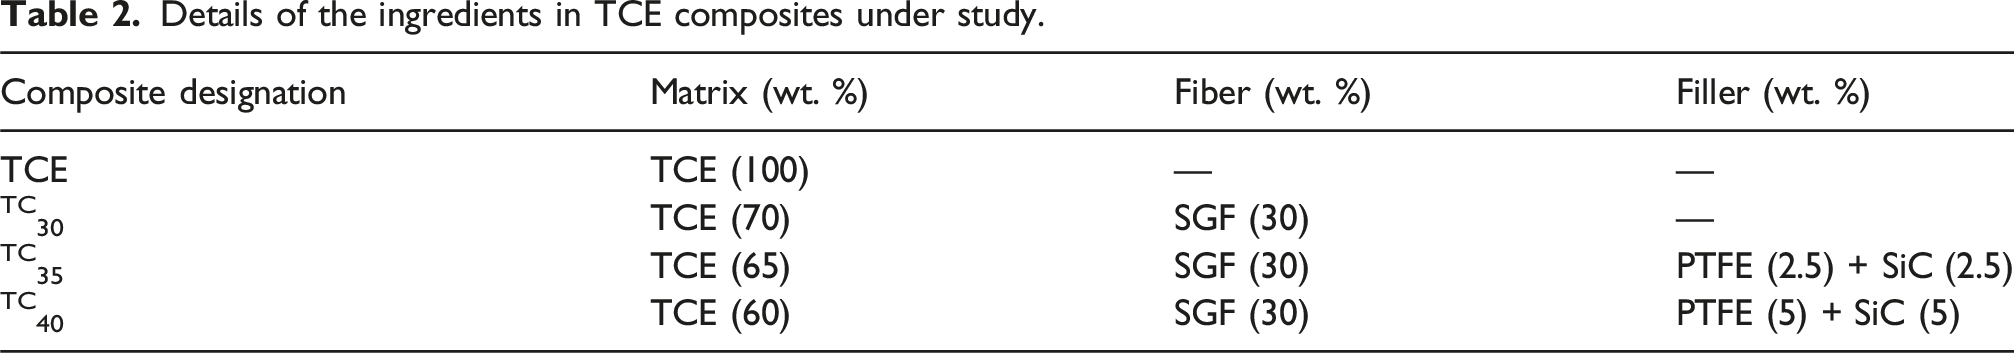
Details of the ingredients in TCE composites under study.
Composite fabrication
The TCE-based composites were produced using an injection molding machine (DGP Windsor, 50 T) and a twin-screw extrusion system (Make: CMEI, Model: 16CME, SPL, Chamber size 70 cm3). To remove moisture before processing, the matrix, fibers, and fillers with the intended proportions (as listed in Table 2) were combined using a mechanical mixture for roughly 15 min at a speed of 80 rpm and dried in an infrared oven for 10 h at 75°C. The chosen ingredients were then compounded under a controlled temperature profile using a twin-screw co-rotating extruder. The screw speed was set at 100 rpm, and the zones were 200°C, 210°C, 220°C, 240°C, and 260°C.
To ensure thermal stability during molding, the extrudates were pre-dried in a vacuum oven for 24 h at 100°C after being pelletized. Zone 1: 220°C and Zone 2: 250°C barrel temperatures were used in the injection molding process for producing the standard test specimens in accordance with ASTM, with the mold temperature kept at 35°C. Maintaining precise processing temperatures during extrusion and molding was essential to preserving material integrity and achieving desired properties. The process of fabricating composites is depicted in Figure 1. Schematic representation of the fabrication process and characterization methods for TCE composites reinforced with SGF, PTFE, and SiC fillers.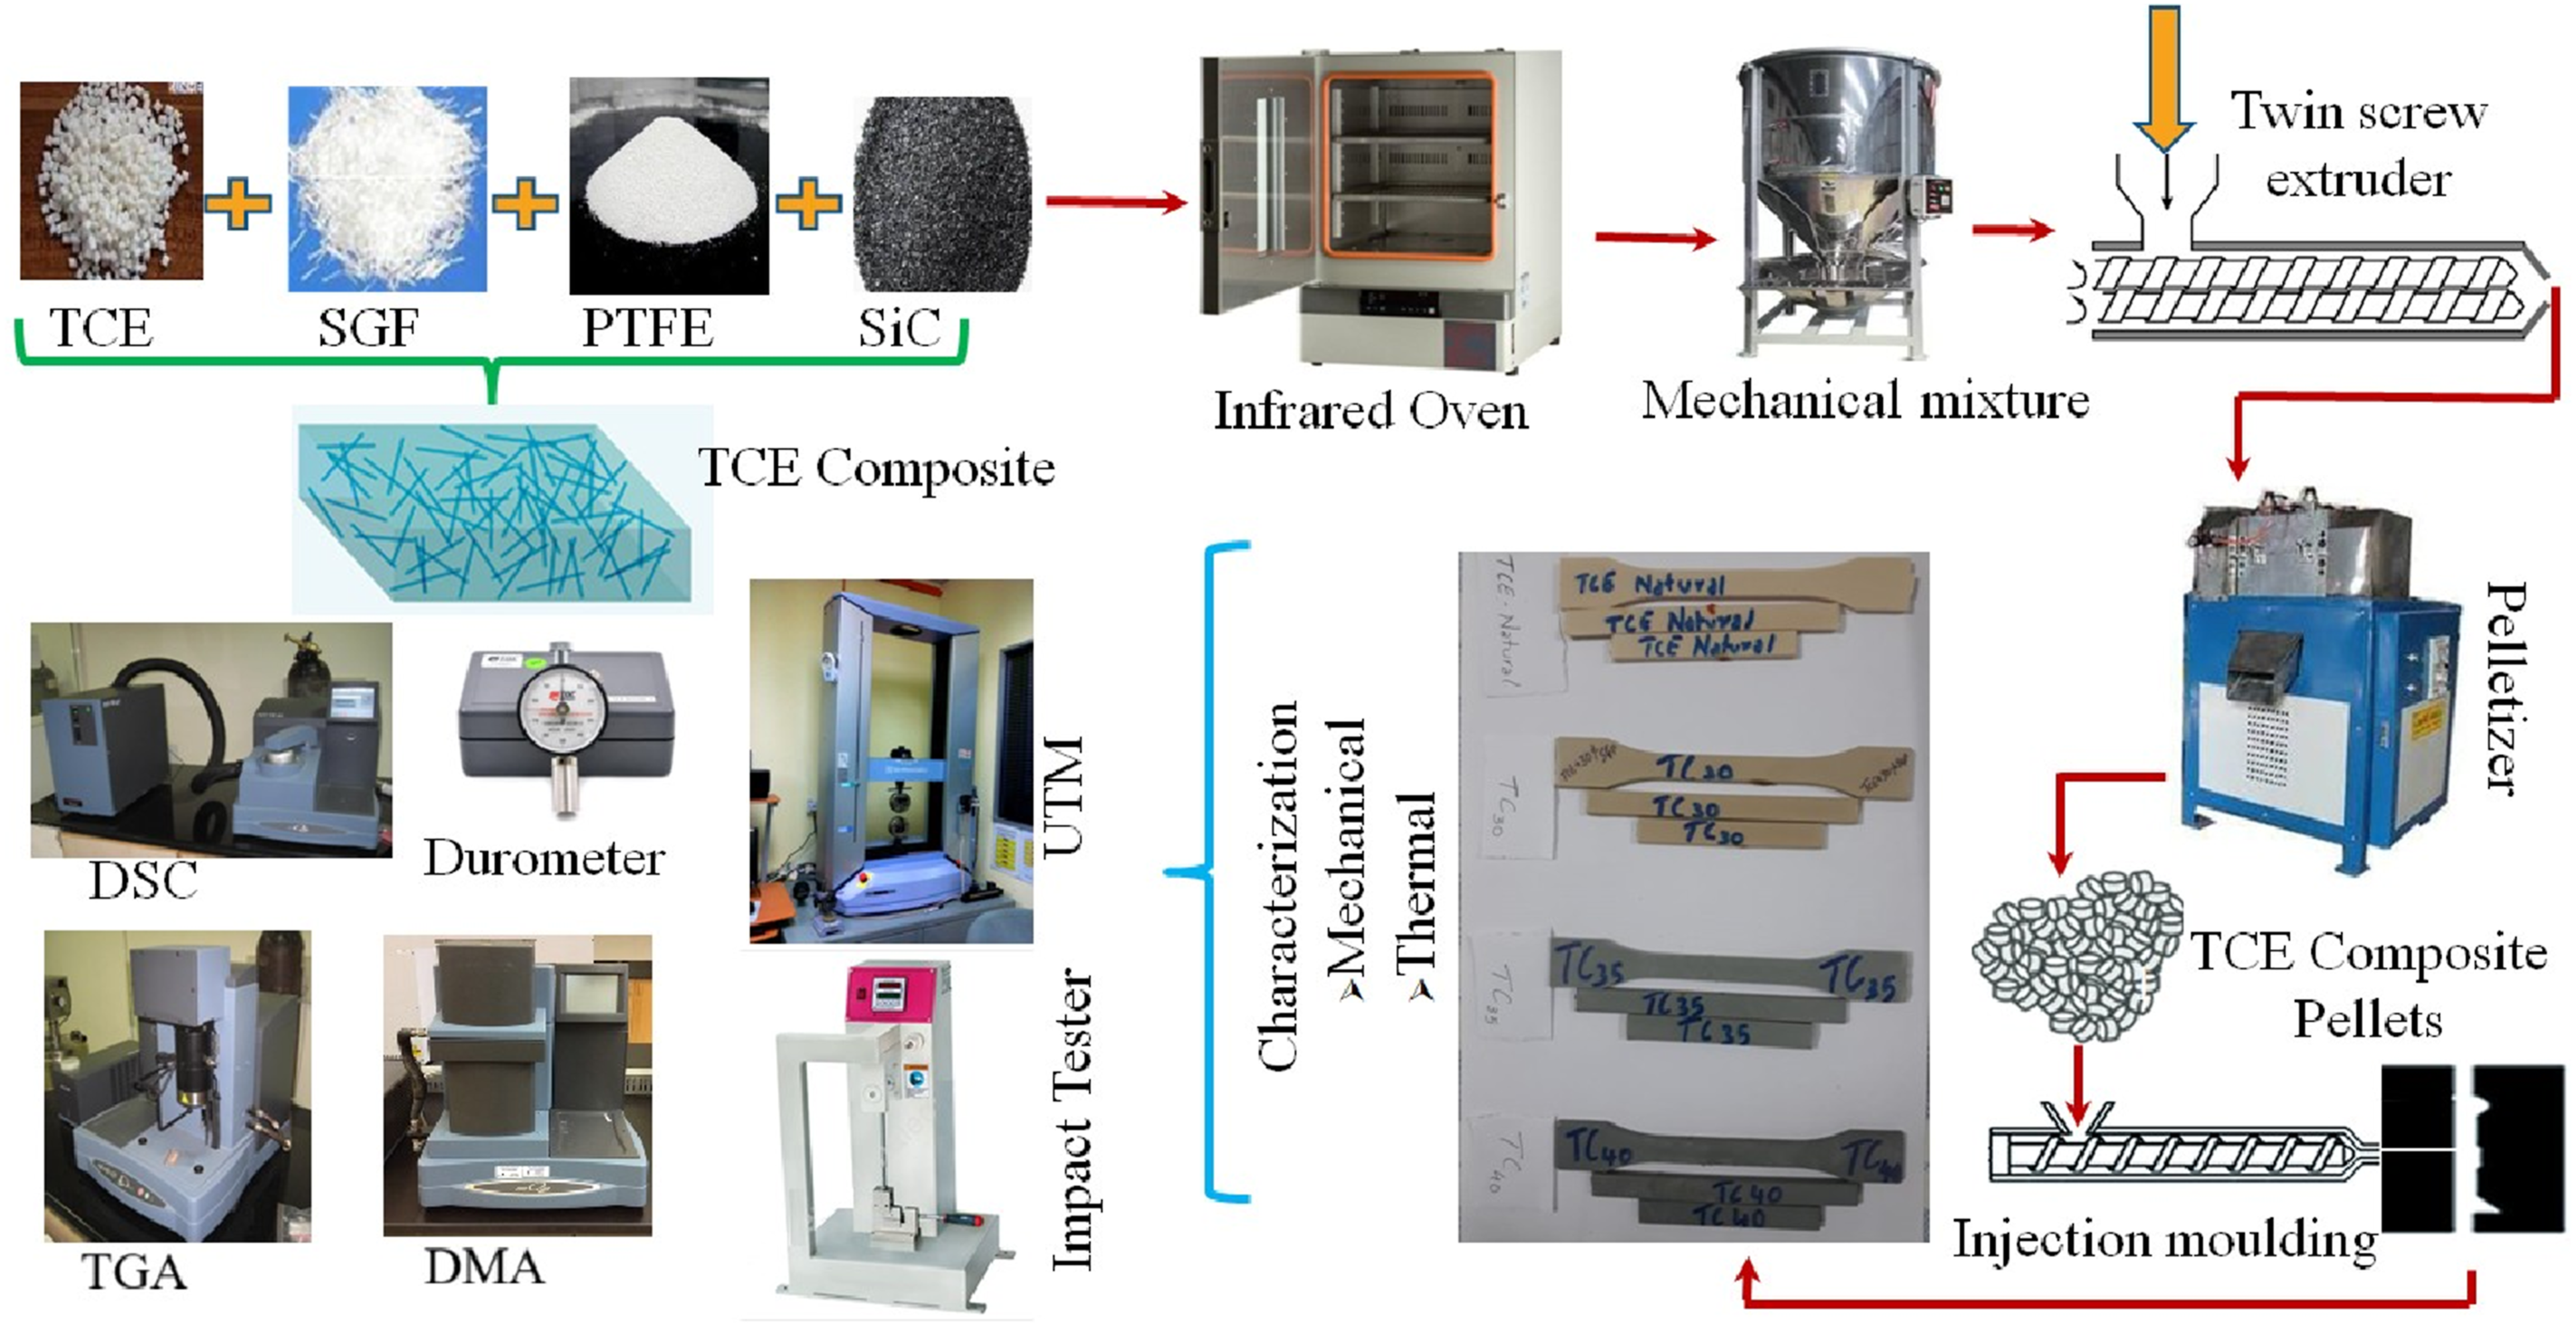
Thermal characterization
Thermal gravimetric analysis
To assess the decomposition behavior and thermal stability of TCE and their composite under regulated heating conditions, thermal gravimetric analysis (TGA) was carried out. The beginning degradation temperature and sample residual mass are two important factors related to thermal behavior that may be understood thanks to this technique, which sheds light on the weight loss of the samples in response to temperature increases. The impact of the silane treatment and SGF concentration on the thermal behavior of the TCE compounds was also evaluated using the TGA data, which may have shown synergistic effects between the constituents. A thermal analyzer TGA Q50 (TA instruments) was used to evaluate the properties of pristine TCE and its composites. Each sample, weighing about 5–10 mg, was put on a platinum pan and heated to 900°C from room temperature at a rate of 10°C/min under nitrogen in order to determine the initial degradation (TIDT), final degradation temperatures (TFDT), and residual mass. In compliance with ASTM D 2584, the test was conducted. The instrument was calibrated as per the manufacturer’s recommended procedures.
Differential scanning calorimetry
The thermal analysis was performed using TA Instruments’ DSC Q100. The instrument was calibrated as per the manufacturer’s recommended procedures. To comprehend the behavior of temperature, a trial specimen weighing 5–10 mg was used. After 2 minutes at −60°C, the trial specimen was heated to 280°C (the initial heating) at a rate of 10°C per minute and kept there for 1 minute. With a 2-min isothermal hold at −60°C for every run, cooling from 280°C to −60°C was carried out at the same rate (10°C per minute). The results from second heating are discussed here. The following formula can be used to determine TCE composites’ degree of crystallinity (Xc):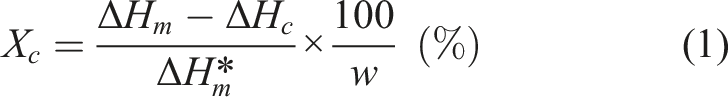
Dynamic mechanical analysis
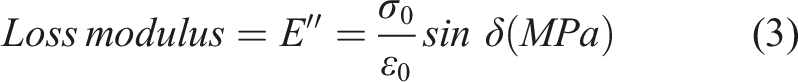
The temperature, frequency, and stress of a material under slight deformation brought on by a sinusoidal load are all examined using dynamic mechanical analysis (DMA). Tan δ and moduli are used to measure damping and stiffness. The storage (E’) and loss (E’’) moduli are defined as follows: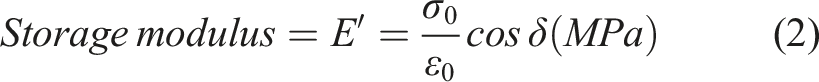
The C factor is defined as follows: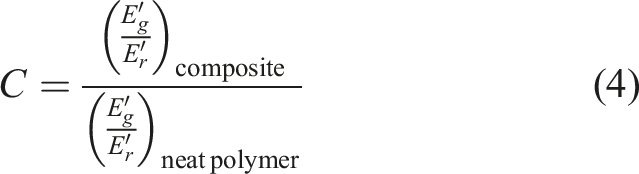
The DMA Q 800 Dynamic Mechanical Analyzer from TA was used, and the specimen measured 20 mm by 12 mm by 1.6 mm. The equipment’s three-point bending mode was used for the measurements, and the corresponding viscoelastic properties were ascertained in relation to temperature. Under nitrogen flow, the temperature ranged from −60 to 150°C at a heating rate of 5°C per minute. The frequency at which the samples were scanned was 1 Hz. The instrument was calibrated as per the manufacturer’s recommended procedures.
Physico-mechanical characterization
Thermal analysis and physico-mechanical testing were used to evaluate the composite’s performance in detail. Density, void percentage, tensile strength, flexural strength, and impact strength were among the important characteristics assessed. These experiments were associated with the thermal behavior findings from TGA and DSC investigations and offered important new information about the reinforcing effects of SGF on the TCE polymer matrix.
Density and void fractions
In a lot of weight-sensitive engineering applications, density is essential. Because of their reduced density, polymer matrix composites (PMCs) are frequently chosen over conventional materials. The relative proportions of the materials that make up a composite determine its overall density.
However, the existence of pores and spaces in the composite may cause differences between the measured and predicted densities. Mechanical performance and characteristics are greatly impacted by this type of porosity, which frequently results in decreased fatigue resistance and greater vulnerability to moisture intrusion. Predicting the quality of the composite is made easier by knowing the degree of porosity.
A METTLER AE 200 densometer was used to measure density in accordance with ASTM D792-08 guidelines. After being weighed in air, test specimens were suspended by a wire and immersed in distilled water at 23°C. The composite density was computed using the difference between these readings. After completing five trials, the average value was published. Equation (5) was used to determine the theoretical density of fiber-reinforced composites, as explained by Agarwal et al.
35
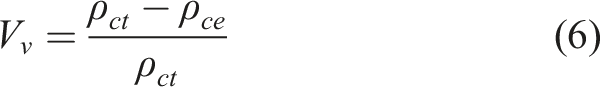
The volume fraction of voids (V
v
) is calculated from equation (6):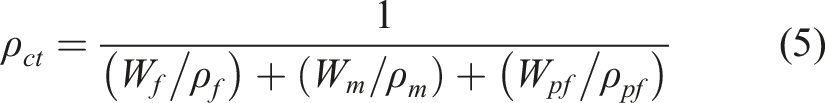
Hardness
TCE composites were subjected to ASTM D2240 hardness testing using a Type M digital durometer (HP-E II series) that has a patented pressure mechanism to maintain constant contact pressure and reduce tilting errors. A hardened steel conical indenter (30° angle, 0.1 mm tip radius, 1.4 mm stem diameter) was used for Type D measurements in this investigation, which were carried out under a 44.48 N load. Each sample had five replicate measurements, and the mean value was noted.
Tensile test
To investigate the tensile behavior of the compounds under investigation, uniaxial tension tests were performed on specimens composed of the composites. The test samples were subjected to progressively higher axial loads until they failed. A few crucial characteristics, including strength, elastic modulus, and breakage during elongation, were assessed using the applied load and dislodgement values recorded throughout the experiment. Utilizing a universal testing machine (UTM) manufactured by JJ Lloyd in London, United Kingdom, with a capacity range of 1–20 kN, the tension behavior of the TCE compounds was assessed. The tests were conducted in accordance with ASTM D 638 Type 1 standards (see Figure 2 for test coupon dimensions). Each material composition was tested on a minimum of three specimens. Tensile tests were conducted at room temperature with a gripper head velocity of 5 mm/min. depicts test coupon sizes (mm) for tensile loading as per ASTM D 638 Type 1.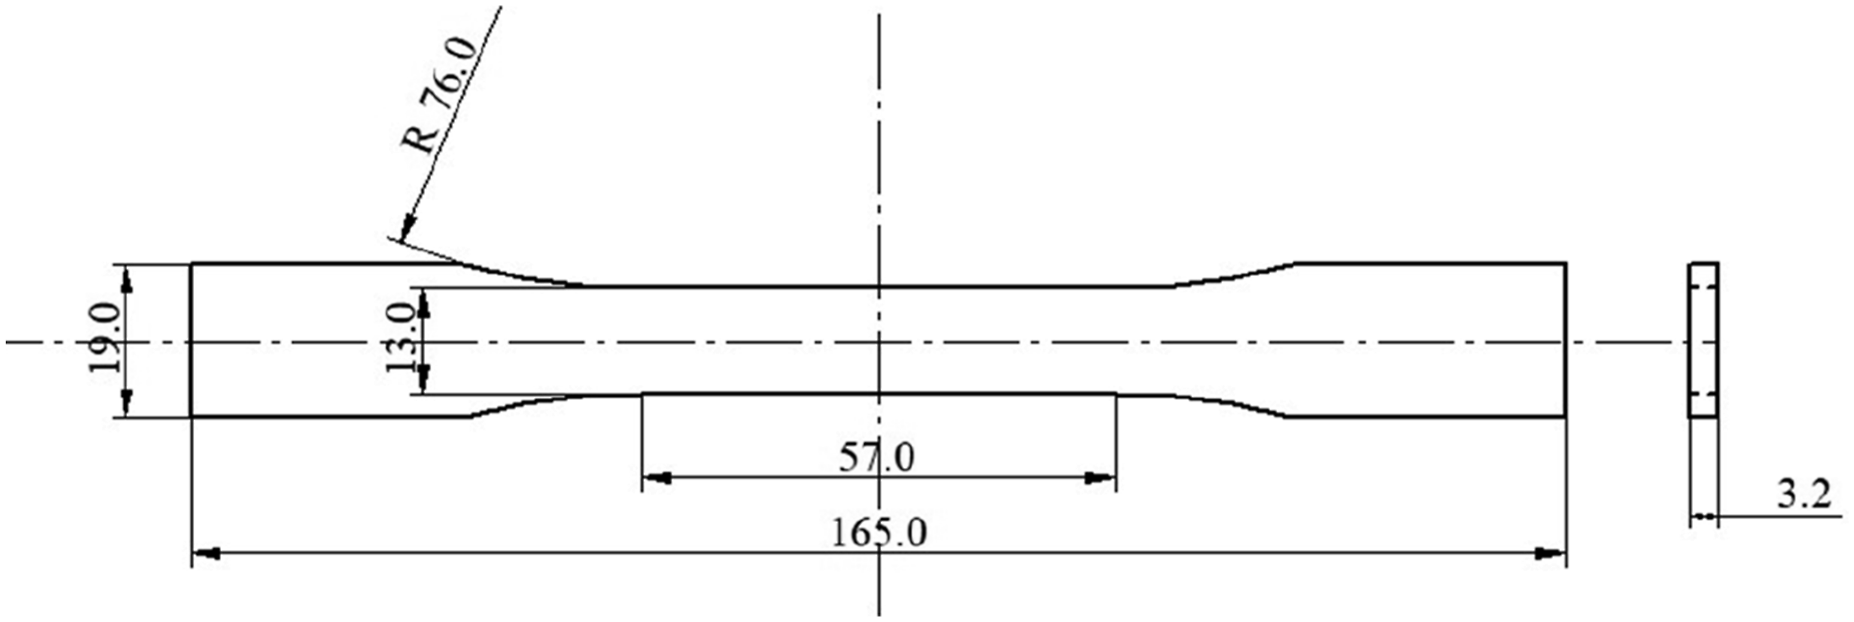
Flexural test
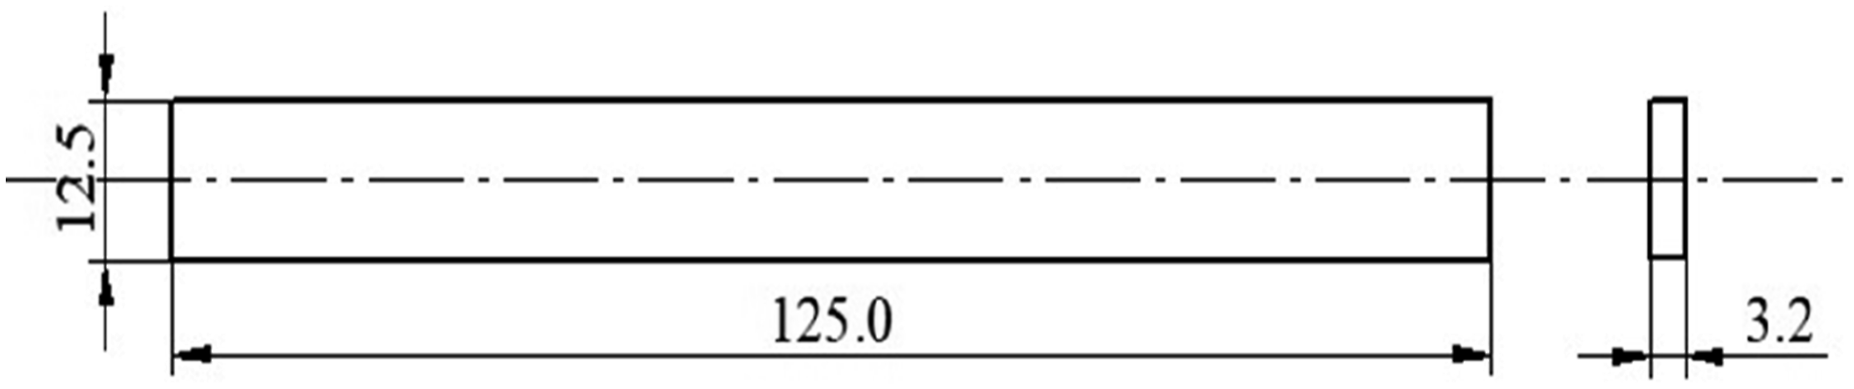
The flexural tests are used to measure the magnitude of force needed to deform a plank beneath three tip weighing condition to determine flexural strength corresponding to load. Flexural tests, in the current study, were done on the UTM utilized to carry out tensile tests, by accommodating the fixtures to apply normal load at tips as specified by the ASTM D 790 standards. The test sample was placed horizontally on two rollers 50 mm apart, which act out as a simply supported beam experiencing tip load at the center. The flexural behaviors were determined with a gripper head velocity of 2 mm per minute. For flexural tests, at least three specimens were used to assess each experimental condition in order to ensure the precision, dependability, and repeatability of the findings. Variations between specimens were noted and taken into account during the analysis. The customary specimen used is shown in Figure 3 and flexural strength of the sample is calculated by the equation (7). Flexure test coupon sizes (mm) as per ASTM D 790.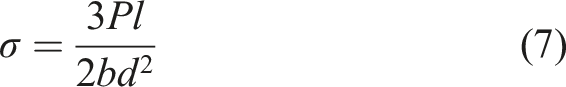
Impact test
The capability of the material to bear the rupture under dynamic load at elevated velocity is the impact strength of that particular material. The test coupons rupture instantly upon application of dynamic load experiencing elevated rate of strain. In the present investigation Izod impact strength was executed in compliance with ASTM D256-Type A using INSTRON (mass of blow hammer = 1.3 kg) impact test rig with a hitting velocity of 3.2 m s−1. To ensure the precision, dependability, and repeatability of the findings, each experimental condition for impact tests was examined using a minimum of three specimens. Variations between specimens were noted and taken into account in the analysis. Figure 4 provides the details of impact test coupon utilized in the present investigation. Impact test coupon sizes (mm) as per ASTM D 256 Type A.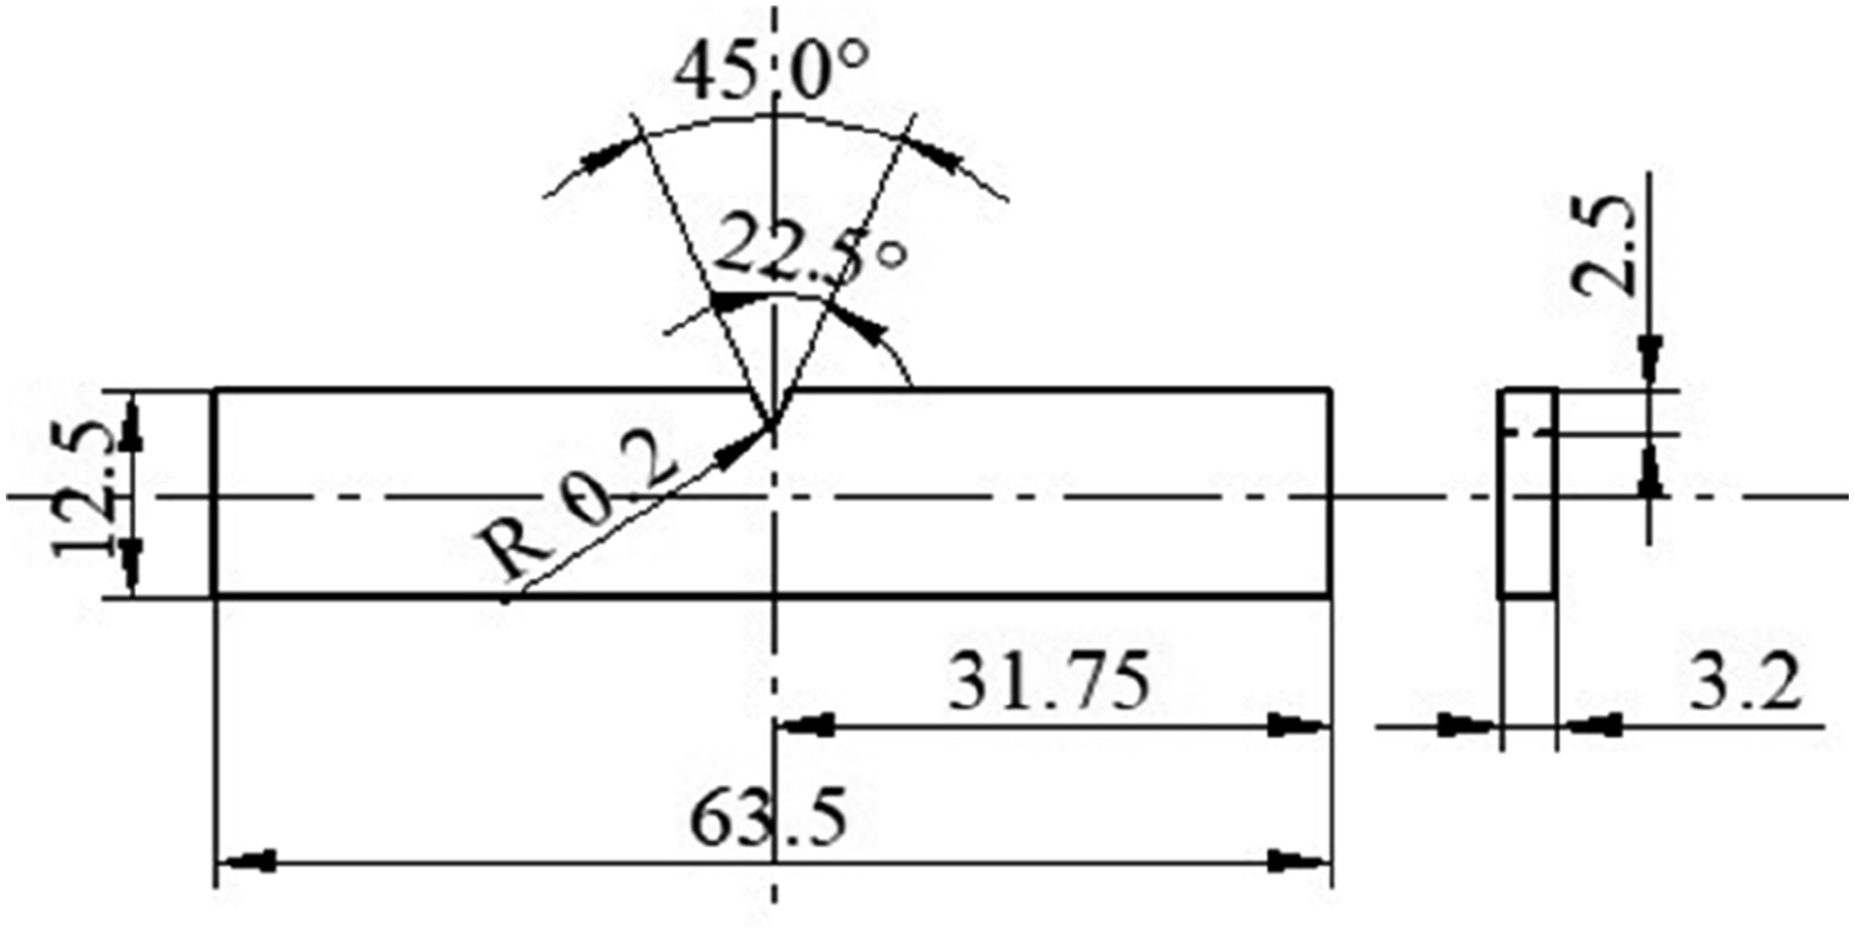
Principal component analysis
The experimentally determined values of theoretical density, experimental density, tensile strength, tensile modulus, flexural strength, flexural modulus, impact strength, and hardness (Shore D) for each of the four material systems (TCE, TC30, TC35, and TC40) were used to conduct principal component analysis (PCA).
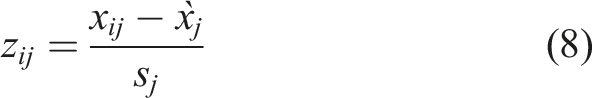
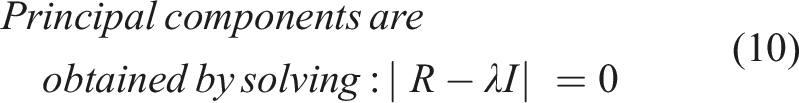
Prior to PCA, the dataset was standardized using z-score normalization to eliminate unit dependency and ensure equal weighting of all variables. The standardized data matrix was then subjected to PCA using the covariance method. Principal components were extracted based on eigenvalues, and the first two principal components (PC1 and PC2), which captured the majority of the variance, were selected for interpretation. PCA score plots were used to evaluate sample clustering, while loading plots were used to identify the contribution of individual variables to each principal component. The following equations are used for identifying and analyzing the principal components.
Z-score normalization is done by formula
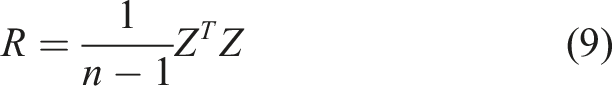
Eigenvalue–eigenvector decomposition
Principal component loadings
Loadings indicate how strongly each variable contributes to a principal component and it can be obtained by the following equation:

Results and discussion
Thermogravimetric analysis of TCE and its composites
The thermogravimetric behavior of pristine TCE and its composites with different concentrations of short glass fiber (SGF) and dual fillers (PTFE and SiC) is shown in Figure 5. While the composites show improved thermal stability, with degradation temperatures shifting to 416.8°C (TC30), 419.5°C (TC35), and 423.9°C (TC40), respectively, the commencement of thermal degradation for neat TCE occurs at about 311.8°C. Thermogravimetric analysis (TGA) curves of neat TCE and its composites (TC30, TC35, and TC40), showing weight loss (%) as a function of temperature.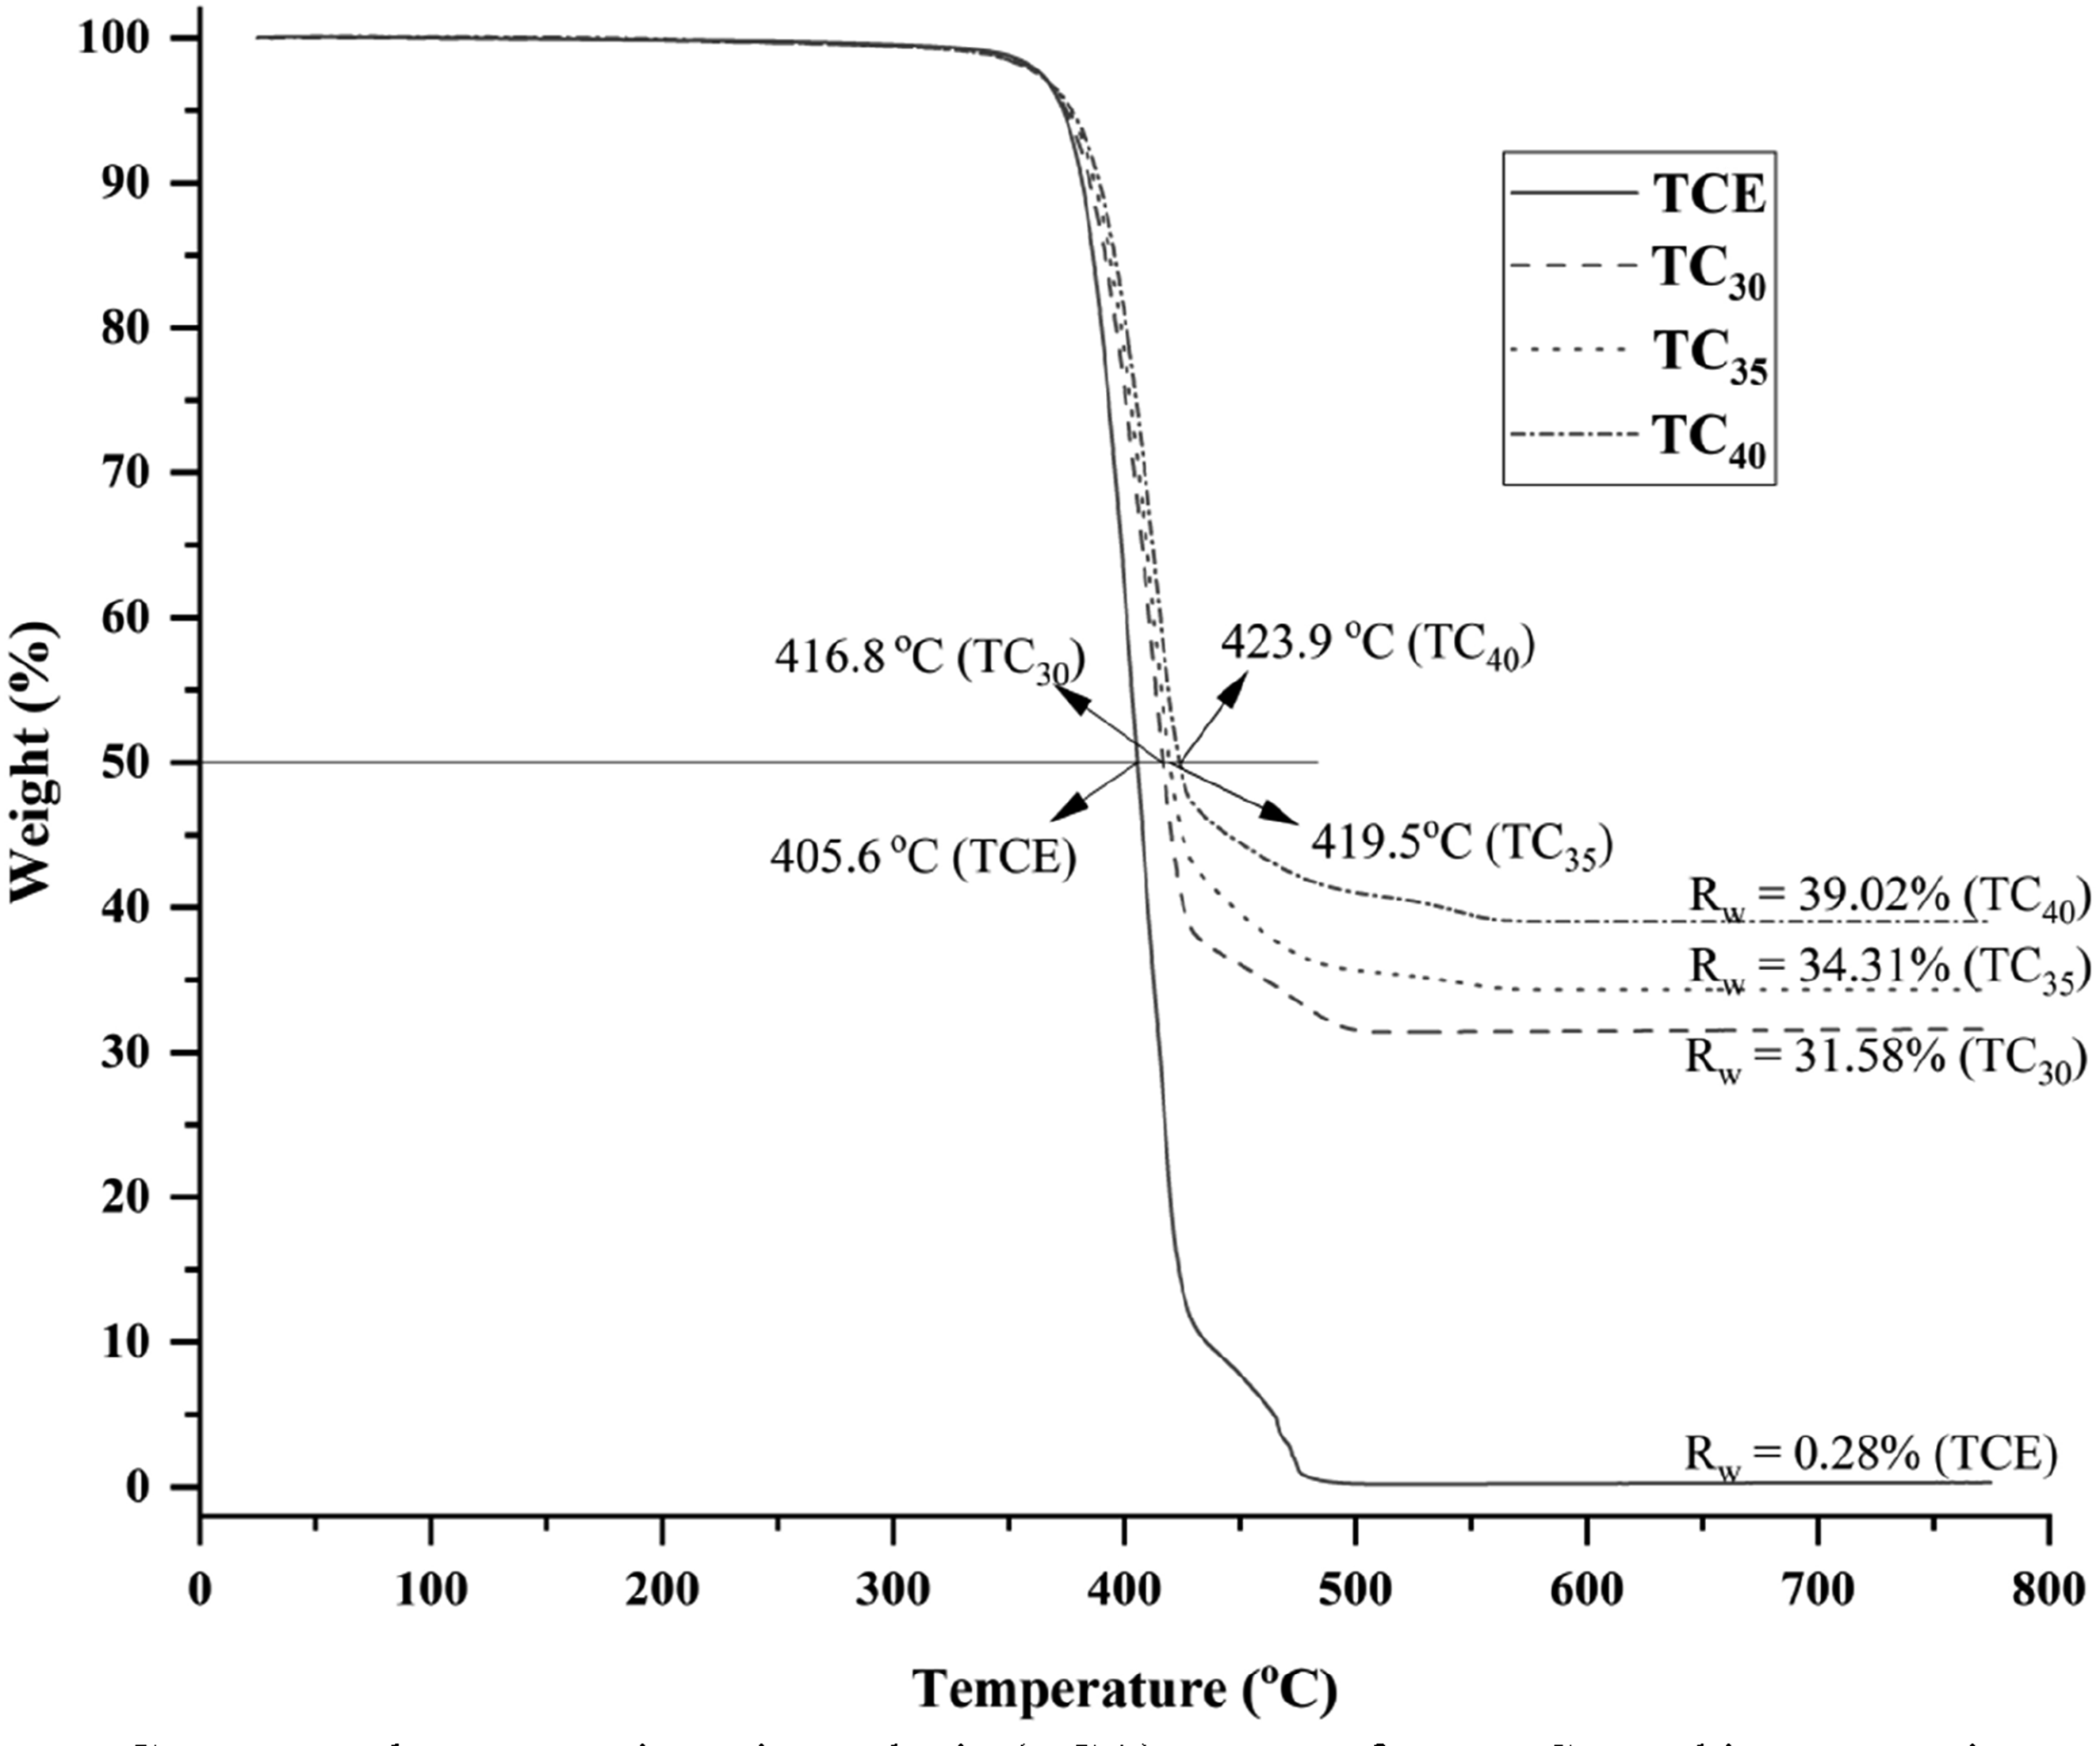
The composites’ elevated degradation temperatures show that adding fillers and SGF enhances thermal resistance, most likely because of their capacity to dissipate heat and create a barrier. Furthermore, from 0.28% (TCE) to 31.58% (TC30), 34.31% (TC35), and 39.02% (TC40), the residual weight at 700°C (R700) increases dramatically. This confirms the existence of filler reinforcement and thermally stable inorganic components, which promote char formation and enhance composite integrity at high temperatures. Ultimately, the TGA data show that adding higher filler content significantly improves the TCE composites’ heat stability and char-forming capacity.
Thermogravimetric analysis data of TCE and its composites showing initial degradation temperature, temperatures at 25%, 50%, and 75% weight loss (T25%, T50%, and T75%), and final degradation temperature.
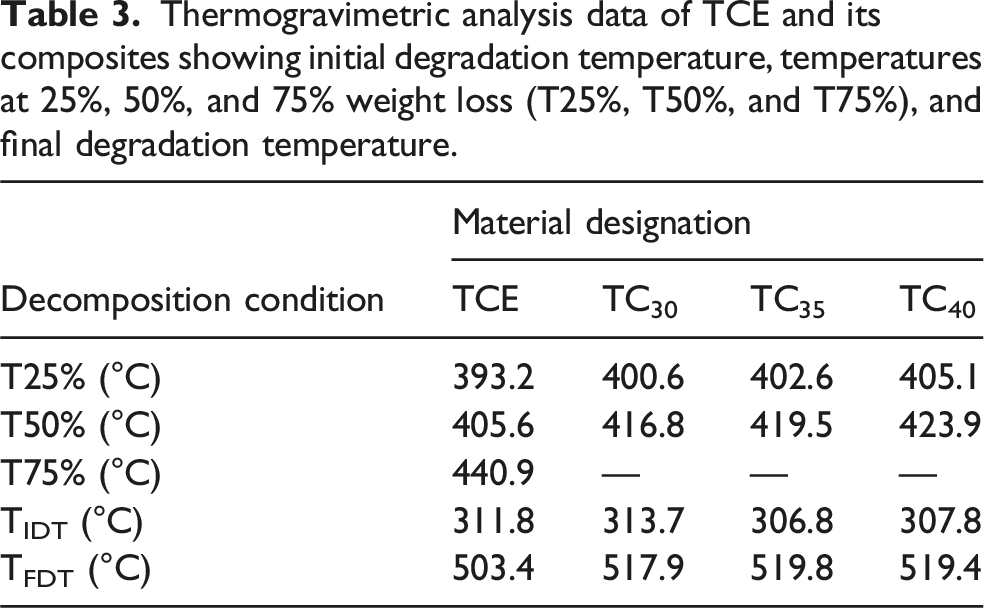
In accordance with Das et al.’s 36 findings, the TIDT of unfilled TCE is recorded at 311.8°C. While adding 2.5 wt % PTFE and SiC to TCE + SGF (TC35) resulted in a somewhat lower TIDT of 306.8°C, adding 30 wt % SGF (TC30) boosts the TIDT slightly to 313.7°C. A TIDT of 307.8°C is observed with a further increase to 5 wt % PTFE and SiC (TC40).
The thermal barrier effect of SGF is responsible for the improvement in TIDT for TC30. Glass fibers absorb and redistribute heat more efficiently than the matrix because of their high thermal conductivity and heat capacity, which delays the onset of degradation. The weight loss in SGF-containing composites is considerably less at 460°C (as opposed to 440°C for pure TCE), indicating that SGFs limit chain mobility and prevent softening, improving the composite’s structural integrity at high temperatures. 37 Furthermore, neat TCE exhibits a 5% weight loss at 373.5°C, which is in close agreement with Wang et al.’s findings, 38 which found that neat thermoplastic polyester elastomer (TPEE) degraded by 5% at 370.3°C. Particulate fillers (PTFE and SiC) improve the TCE + SGF system’s resistance to thermal deterioration at every stage of weight reduction, as shown in Table 3. By preventing mass loss at high temperatures, these fillers serve as thermal barriers, preventing the polymer chains from degrading further. Higher decomposition temperatures, which indicate better thermal stability, are generally the result of the synergistic interaction between SGF and dual particle fillers. Gul et al. have documented similar patterns, 39 emphasizing the improved heat resistance of TPEE composites with hybrid filler systems.
Differential scanning calorimetry of TCE and its composites
The thermal behavior of TCE and its composites was assessed using Differential Scanning Calorimetry (DSC), which measures heat flow to and from the test specimen in relation to a reference as a function of temperature. The energy received (endothermic, like melting) or released (exothermic, like crystallization) during thermal transitions is reflected in the heat flow, which is measured in milliwatts. DSC assists in determining specific heat capacity, transition and reaction enthalpies, and characteristic temperatures such glass transition temperature (T
g
), melting temperature (T
m
), and crystallization temperature (T
c
). In DSC analysis of thermoplastic composites, Farkas
40
suggested using two thermal cycles to create a controlled thermal imprint and erase the prior thermal history, guaranteeing repeatable results. In order to accurately determine the crystallinity of TCE and its composites, this work used the cooling phase from the first cycle and the heating phase from the second cycle. Figure 6 displays the TCE and its composites’ endothermic and exothermic curves. The addition of SGF to the TC30 composite resulted in a small increase in thermal stability, as the neat TCE’s T
g
of 8.2°C rose to 8.5°C. Nevertheless, a minor decrease in T
g
was noted for the hybrid composites TC35 and TC40, which may have resulted from the combined effect of SiC and PTFE fillers interfering with the mobility of the polymer chain. It was found that neat TCE had a melting point (T
m
) of 210.7°C. When PTFE, SiC, and SGF were added to the TC35 and TC40 composites, T
m
dropped. This decrease could be explained by the fillers’ interference with the production of the crystalline phase, which lowers the melting energy needed. It’s interesting to note that the TC30 composite saw a modest rise in T
m
, indicating that the SGF alone may have increased thermal resistance by preventing heat diffusion and postponing melting. The peak melting temperature (T
m
) and onset melting temperature (T
M
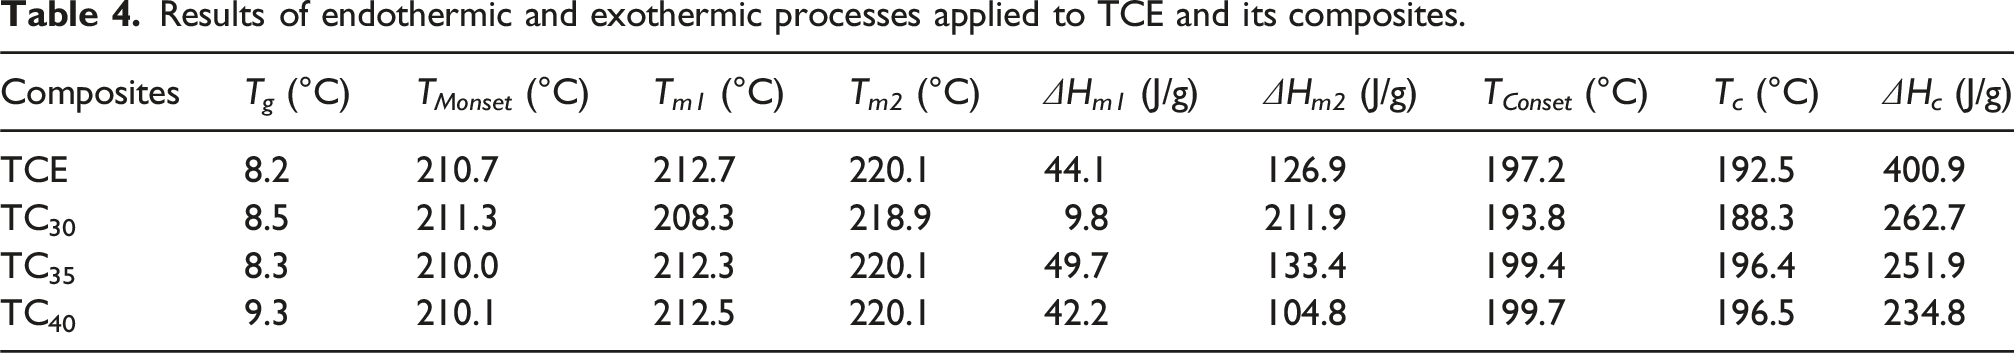
onset) derived from the DSC endothermic curves is shown in Table 4. Every material showed two distinct melting peaks. Melting of soft crystallites is associated with the first peak, whereas melting of more rigid crystalline regions is associated with the second peak. Endothermic and exothermic DSC curves of neat TCE and its composites during the second heating cycle, showing thermal transitions such as glass transition, crystallization, and melting behavior. Results of endothermic and exothermic processes applied to TCE and its composites.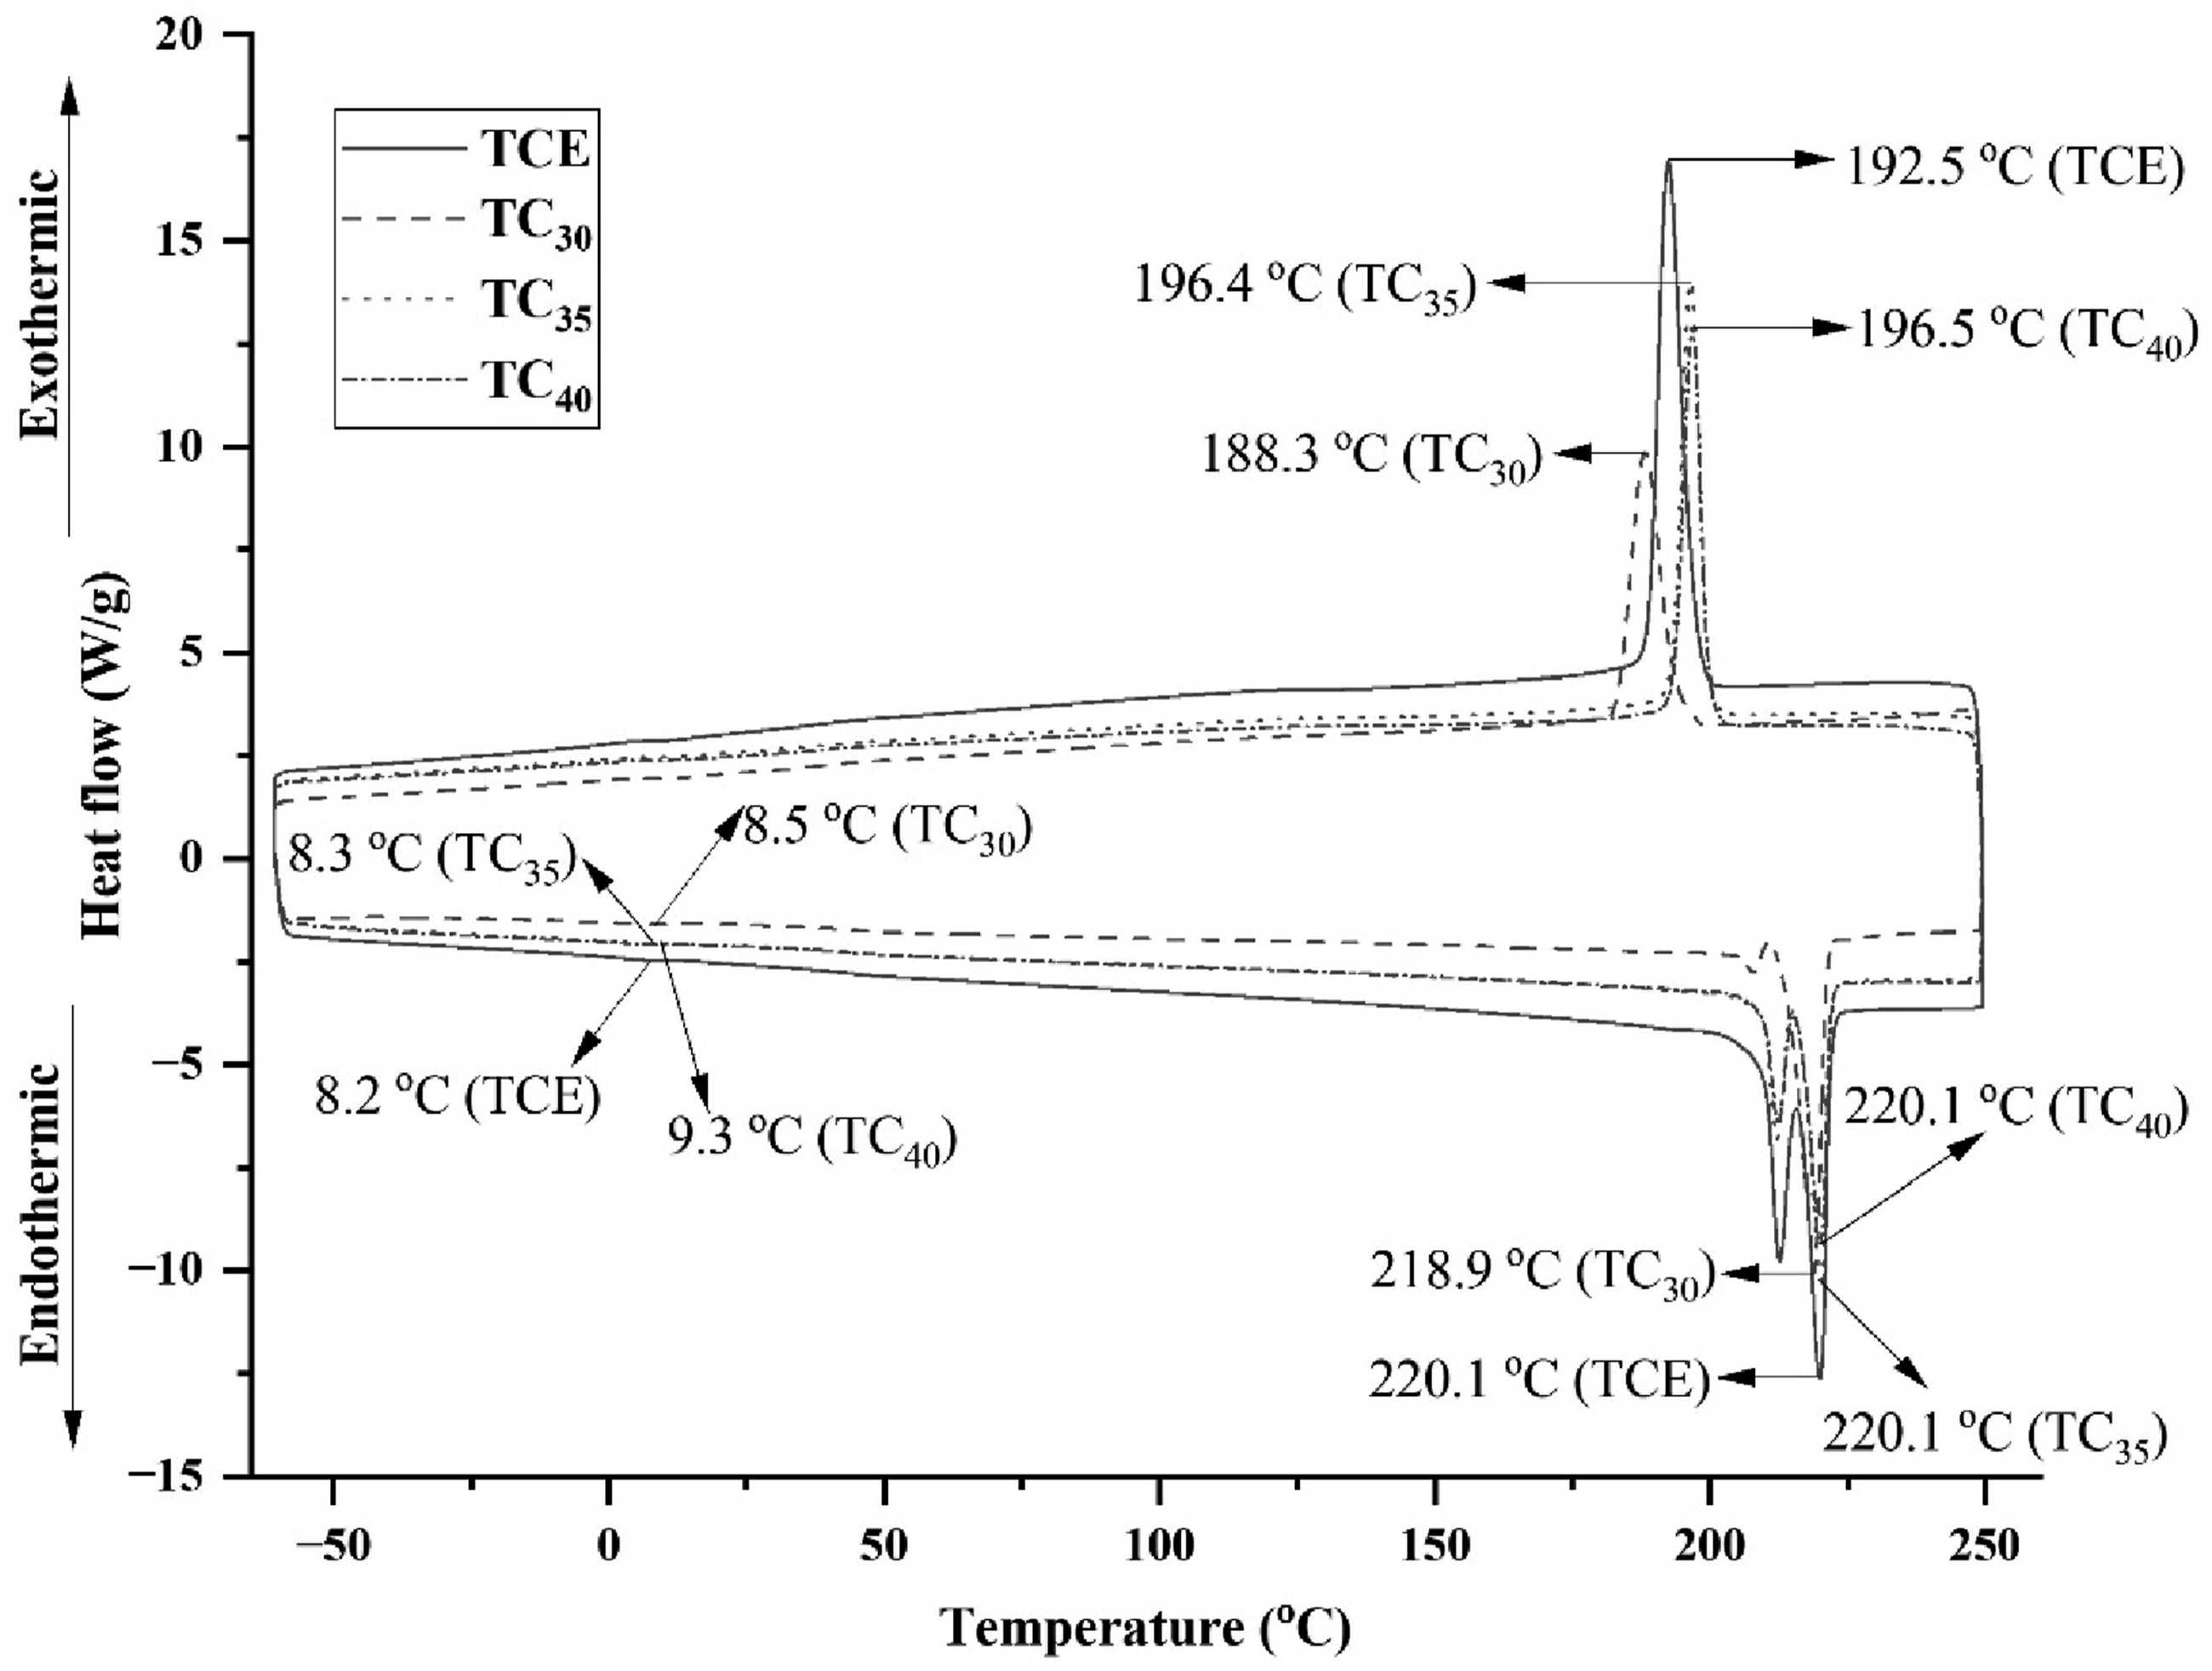
As reported by Chen et al. 41 vapor-grown carbon nanofibers (VGCNF) in TPU nanocomposites increased crystallinity from 8.2% (neat TPU) to 15.4% at 5 wt% content by acting as nucleating agents that promoted ordered chain packing during melt compounding. Higher storage modulus (DMA) and thermal stability (TGA onset ∼50°C higher) were associated with enhanced crystallinity; however, excessive filler content (>7 wt%) decreased it because agglomeration disrupted crystal growth.
In contrast to clean TCE, the TC30 composite’s primary melting peak exhibits a modest decrease, most likely as a result of SGF’s inhibitory influence on the TCE matrix’s crystallization process. The melting temperatures showed little change when fibers and particle fillers were added to the TCE + SGF system (as in TC35 and TC40). The observed melting temperatures for TC30 and TC35 composites fell between 218.9°C and 220.1°C, which is in close agreement with the material manufacturer’s stated melt temperature of 221°C. It appears from this consistency that the melting behavior of the matrix is not considerably affected by the inclusion of both SGF and particle fillers. The fibers and fillers’ heterogeneous nucleation effects, which encourage melt crystallization, may be the cause of the minor variations in melting points. Improved nucleating effectiveness may result from the polar reinforcements’ higher chemical affinity for the TCE matrix and their high surface area, which also improves interaction at the filler-matrix interface. The total crystallinity (X c ) of the polymer composites is strongly correlated with the enthalpy of melting (ΔH m ), making it a crucial characteristic in this situation. The DSC thermograms’ thermal parameters, including glass transition temperature (T g ), onset of melting (T Monset ), peak melting temperature (T m ), and ΔH m , as shown in Table 4, offer a thorough grasp of how fillers and fibers affect the thermal behavior of TCE-based composites.
Figure 6 shows two different endothermic melting peaks that indicate the existence of both fully and partially formed crystalline areas in the TCE matrix. While the higher-temperature peak shows the melting of well-developed crystalline zones, the lower-temperature peak most likely represents the melting of less-ordered (amorphous-derived) crystallites. The crystallization temperature onset (T Conset ) for neat TCE is 197.2°C. The composites TC40 and TC35 begin crystallization a little sooner, at 199.7°C and 199.4°C, respectively, followed by TC30, as seen in Table 4 and Figure 6.
Neat TCE has a high crystallization enthalpy of 400.9 J/g and a narrow exothermic crystallization peak at 192.5°C. The crystallization process is completed at 178.9°C. In comparison, the TC35 composite begins crystallization at 199.4°C with a narrower peak at 196.4°C, demonstrating that while crystallization begins at a little higher temperature; the process itself is quicker due to the nucleating impact of fibers and fillers.
By improving the crystallization kinetics of TCE and providing greater control over processing temperatures, this behavior demonstrates that fibers and particle fillers both function as efficient heterogeneous nucleating agents. With a crystallization enthalpy of 234.8 J/g, TC40 has the lowest of all the composites, followed by TC35 and TC30. Because it reduces the solidification time during molding, a lower crystallization enthalpy is beneficial because it shortens cycle durations and boosts manufacturing efficiency. As a result, the micro-filled hybrid composites under investigation present encouraging prospects for economic and energy-efficient manufacturing.
Further to this, TCE commercially available as Arnitel® EM 740 comprises crystalline PBT hard segments and amorphous polyether soft segments. Because the TCE backbone is made of these segments, the polymer is intrinsically semi-crystalline. However, DSC analysis in the present study showed pronounced cold crystallization exotherms whose enthalpy value was significantly higher than the melting enthalpy, showing that the material has to be considered largely amorphous upon heating. This can be ascribed to suppressed hard-segment crystallization during processing and crystallization taking place predominantly during the DSC heating scan. The degree of crystallinity of TCE before heating was therefore assumed negligible (X c ≈ 0%).
Dynamic mechanical analysis
Figure 7 presents the temperature dependence of storage modulus (E′) for pristine TCE and its composites TC30, TC35, and TC40, respectively. For all samples, the storage modulus decreases with the increase in temperature, showing the typical transition from glassy to a rubbery state due to increasing mobility of the polymer chains. In the glassy region (lower than −50°C), all materials show very high storage modulus values, indicating limited molecular mobility and high stiffness, which is coherent with the elastic energy storage capability of polymeric materials in this region. The composites have a much higher storage modulus in the whole temperature range compared to pristine TCE. TC30 shows the highest E′, followed by TC40 and TC35, featuring the reinforcing effect of the SGFs and hybrid fillers. The values are present in Table 5. Storage moduli of TCE composites. Dynamic mechanical properties of TCE and their composites.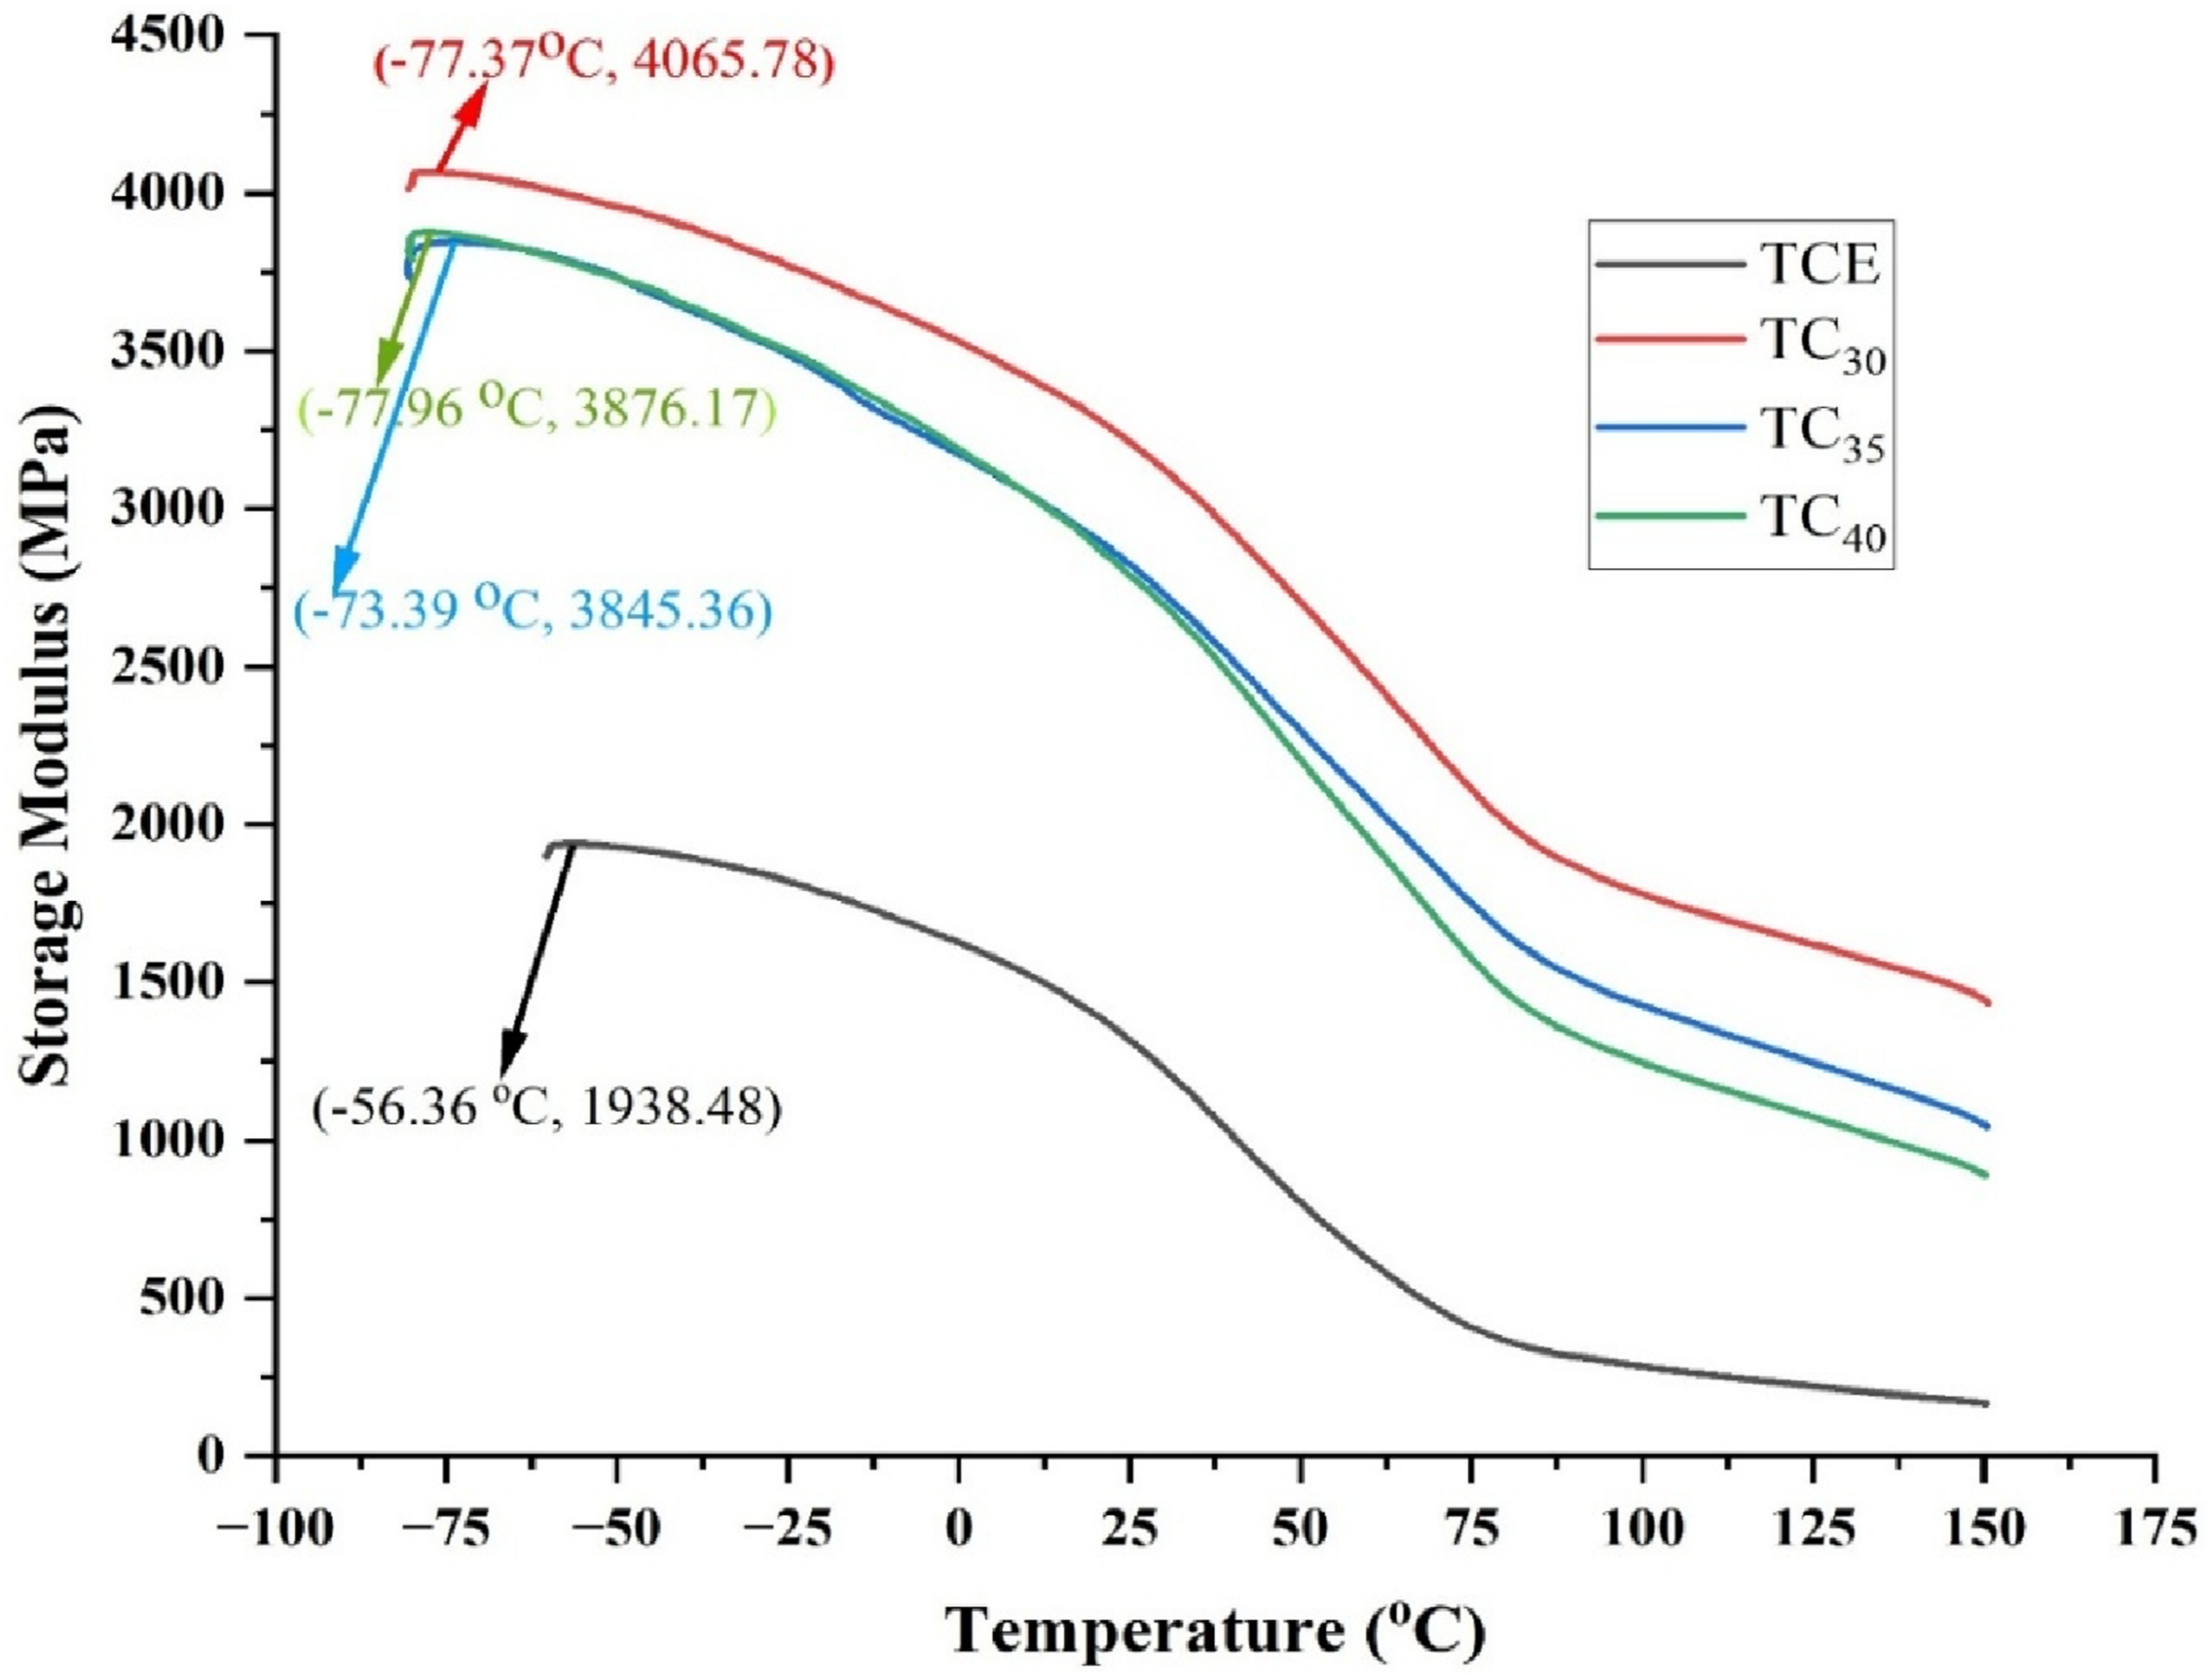
The stiffness of the composites is due to the load-carrying effect of the rigid fibers and fillers that hinder chain mobility and provide an effective way of stress transfer inside the polymer matrix.24,42 The synergistic stiffening effect is evident with much higher intensity in the glassy region where the motion of main chain segments becomes restricted owing to the network of SGFs and ceramic SiC particles.
The decline in E′ for all materials as temperature approaches the glass transition region is sharp, which corresponds to the onset of cooperative segmental motion in the amorphous phase. However, this reduction is followed by retention of a significantly higher rubbery-plateau modulus in the composites compared with pristine TCE. This implies that even beyond Tg, the reinforcing phases maintain some degree of mechanical integrity and resist deformation.43,44 A similar trend has been observed in fiber- and ceramic-reinforced thermoplastic elastomer systems, where fillers maintained significant stiffness at high temperatures.45,46 These observations support the conclusion from Figure 7 that fiber and hybrid filler reinforcement significantly improves stiffness and thermal resistance of the copolyester elastomer matrix.
Figure 8 shows the temperature dependence of the loss modulus, E″, which characterizes the viscous response and energy dissipation properties of the test materials. Loss moduli of TCE composites.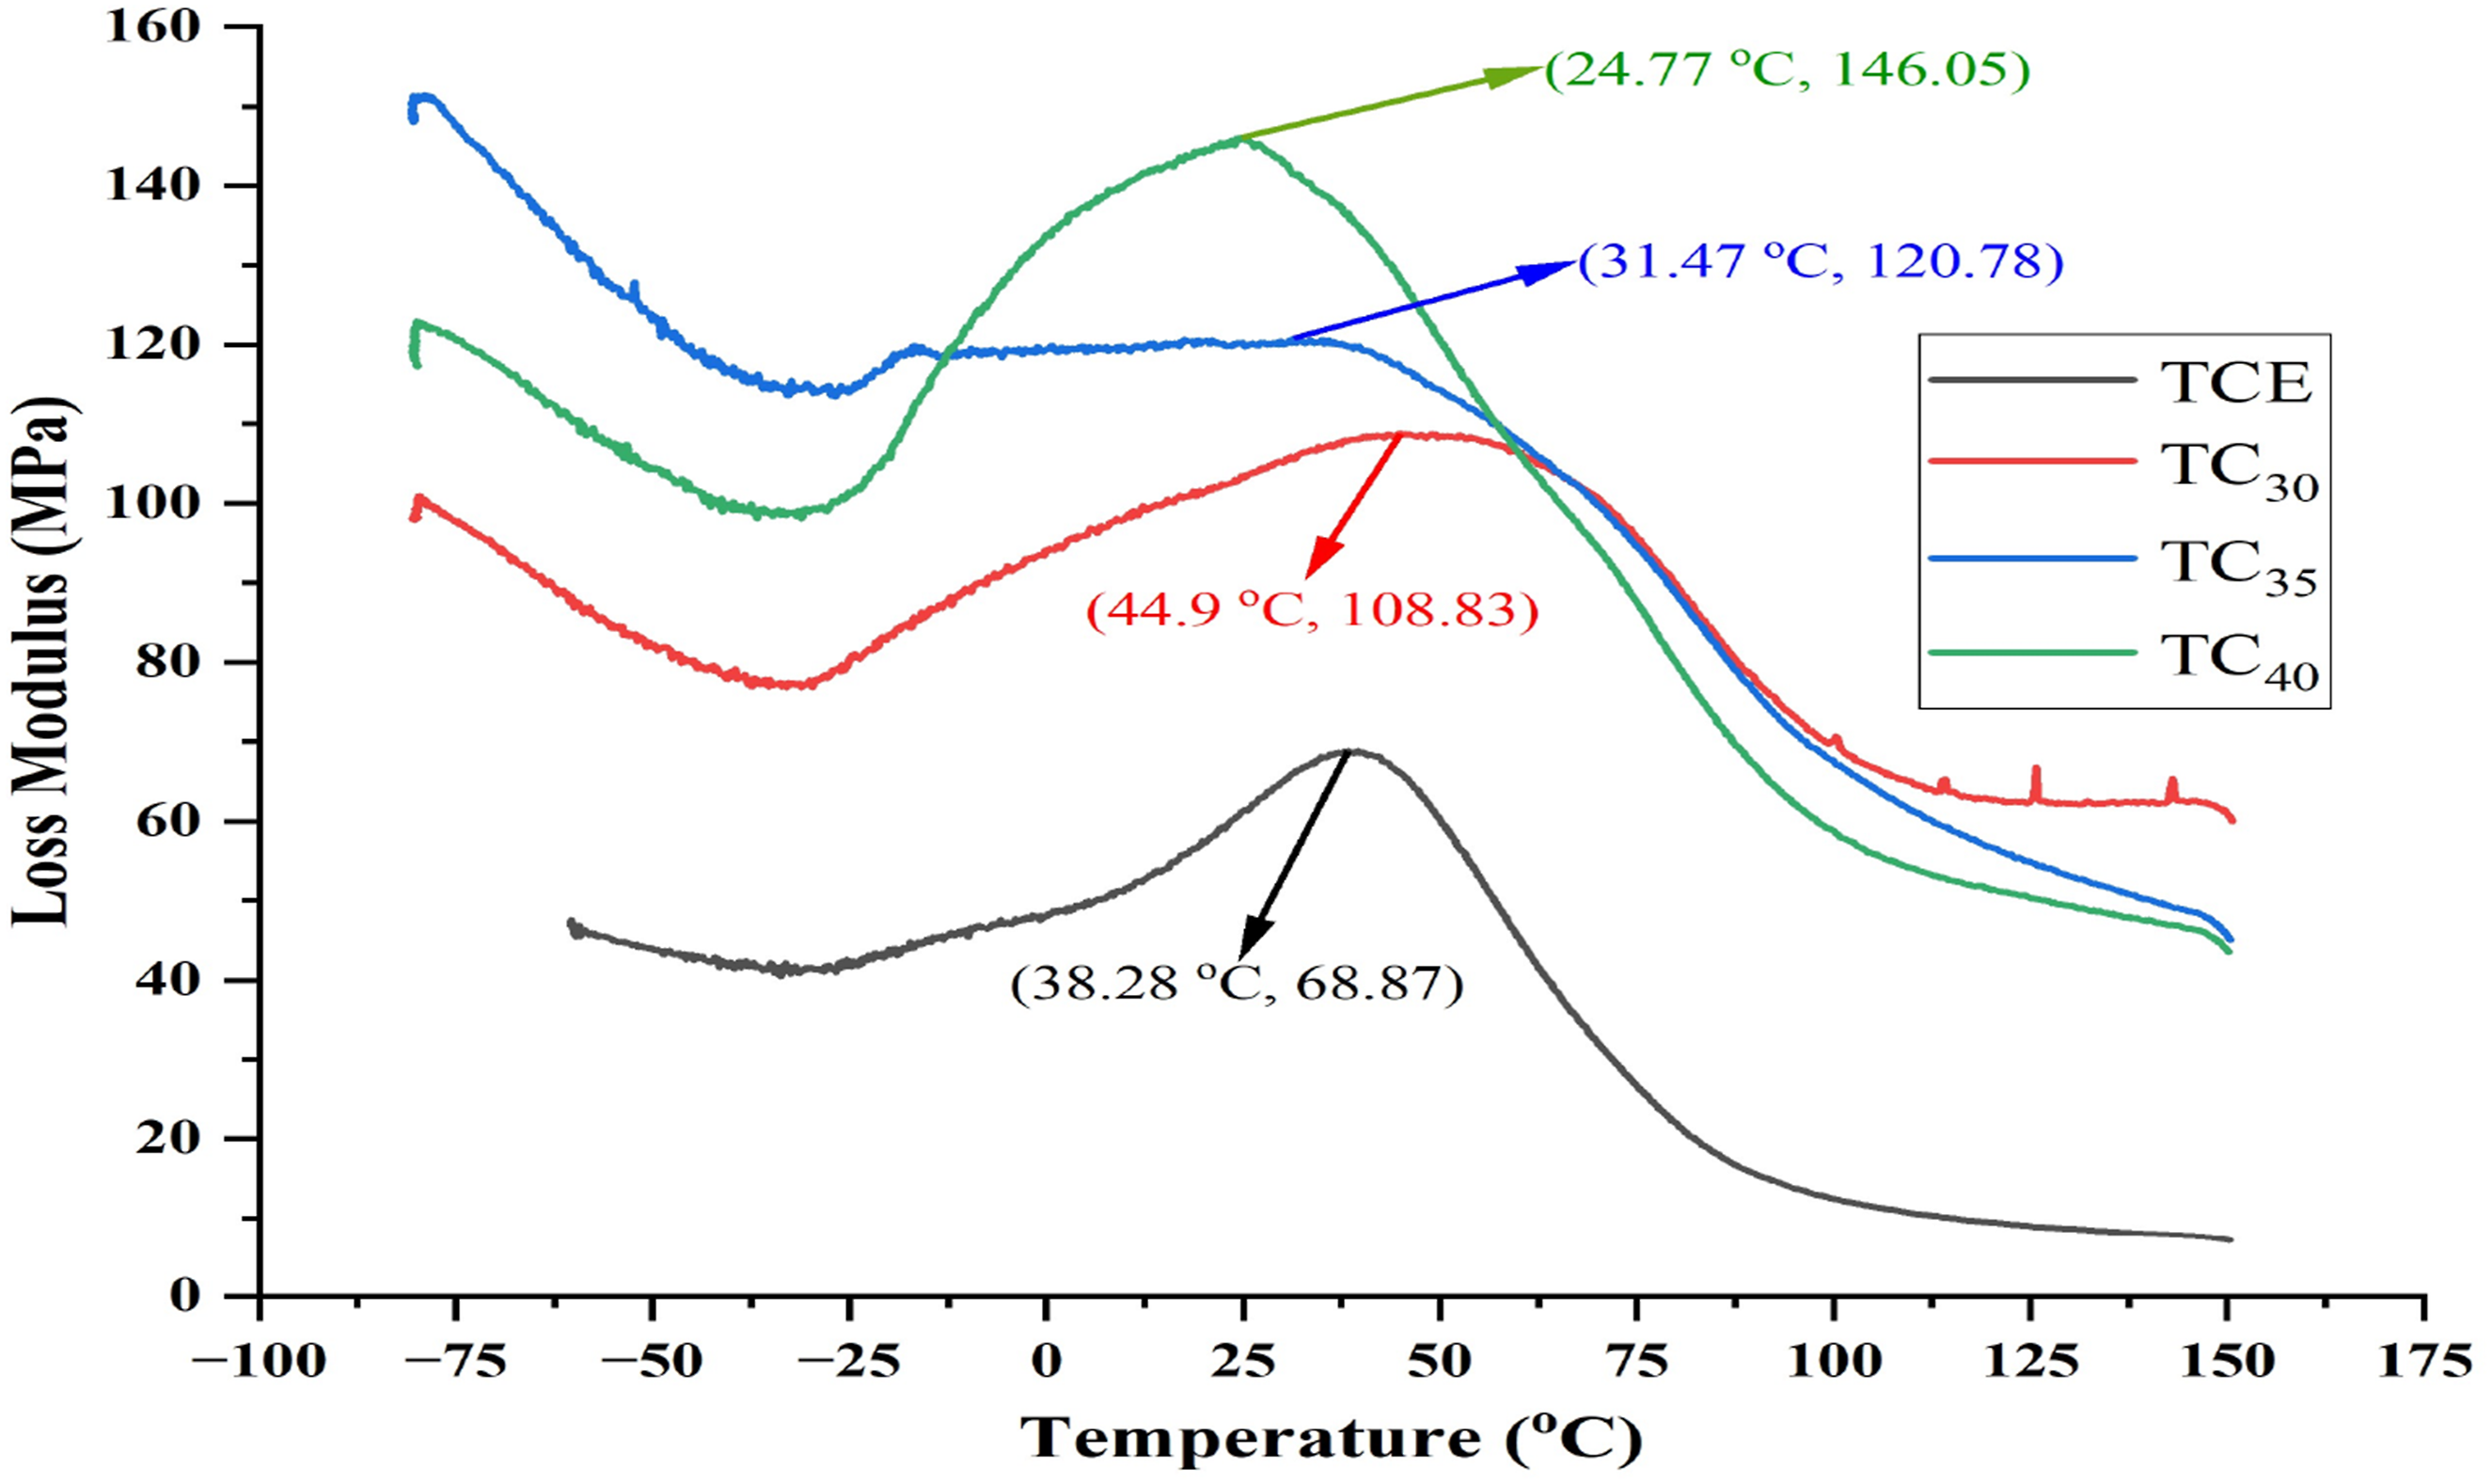
For pristine TCE, a well-defined E″ peak is observed near the glass transition region, corresponding to the maximum internal friction or viscous dissipation arising from the cooperative segmental relaxation of polymer chains. 47 This peak corresponds to the primary α-relaxation process, characteristic of TCE. 36
In contrast, the composites show wider and less intense E″ peaks compared to pristine TCE. Lower peak height indicates reduced energy dissipation due to the increasingly restricted mobility of polymer chains through the presence of SGFs and fillers. In TC30, the restraint imposed by glass fibers reduces viscous losses because of the inhibition of the segmental motion of the matrix. The above trend is more pronounced in TC35 and TC40, where the combined effects of SGFs and rigid SiC particles further restrict the chain mobility of the matrix and reduce internal friction accordingly.48,49
In the TC40 hybrid composite, the E″ curve reveals a broadened peak with some asymmetry or shoulder at higher temperatures. This is ascribed to the secondary relaxation processes of the PTFE phase that, at elevated temperatures, could give rise to localized interfacial sliding or additional dissipative mechanisms.31,50 However, the predominant effect of this hybrid composite remains the strong confinement of the polymer segments by the reinforcing phases, resulting in lower overall viscous dissipation. These findings agree well with reports on hybrid-filled polymer composites, in which ceramic and fibrous reinforcements suppress damping while enhancing thermo-mechanical stability. 51 The loss modulus and glass transition values are present in Table 5.
Figure 9 shows how tan δ varies with temperature for pristine TCE and its composites. Tan δ is the ratio of loss modulus to storage modulus; it characterizes the balance between viscous and elastic responses and is a common indicator of glass transition temperature.
52
Phase angle (Tan δ) of TCE composites.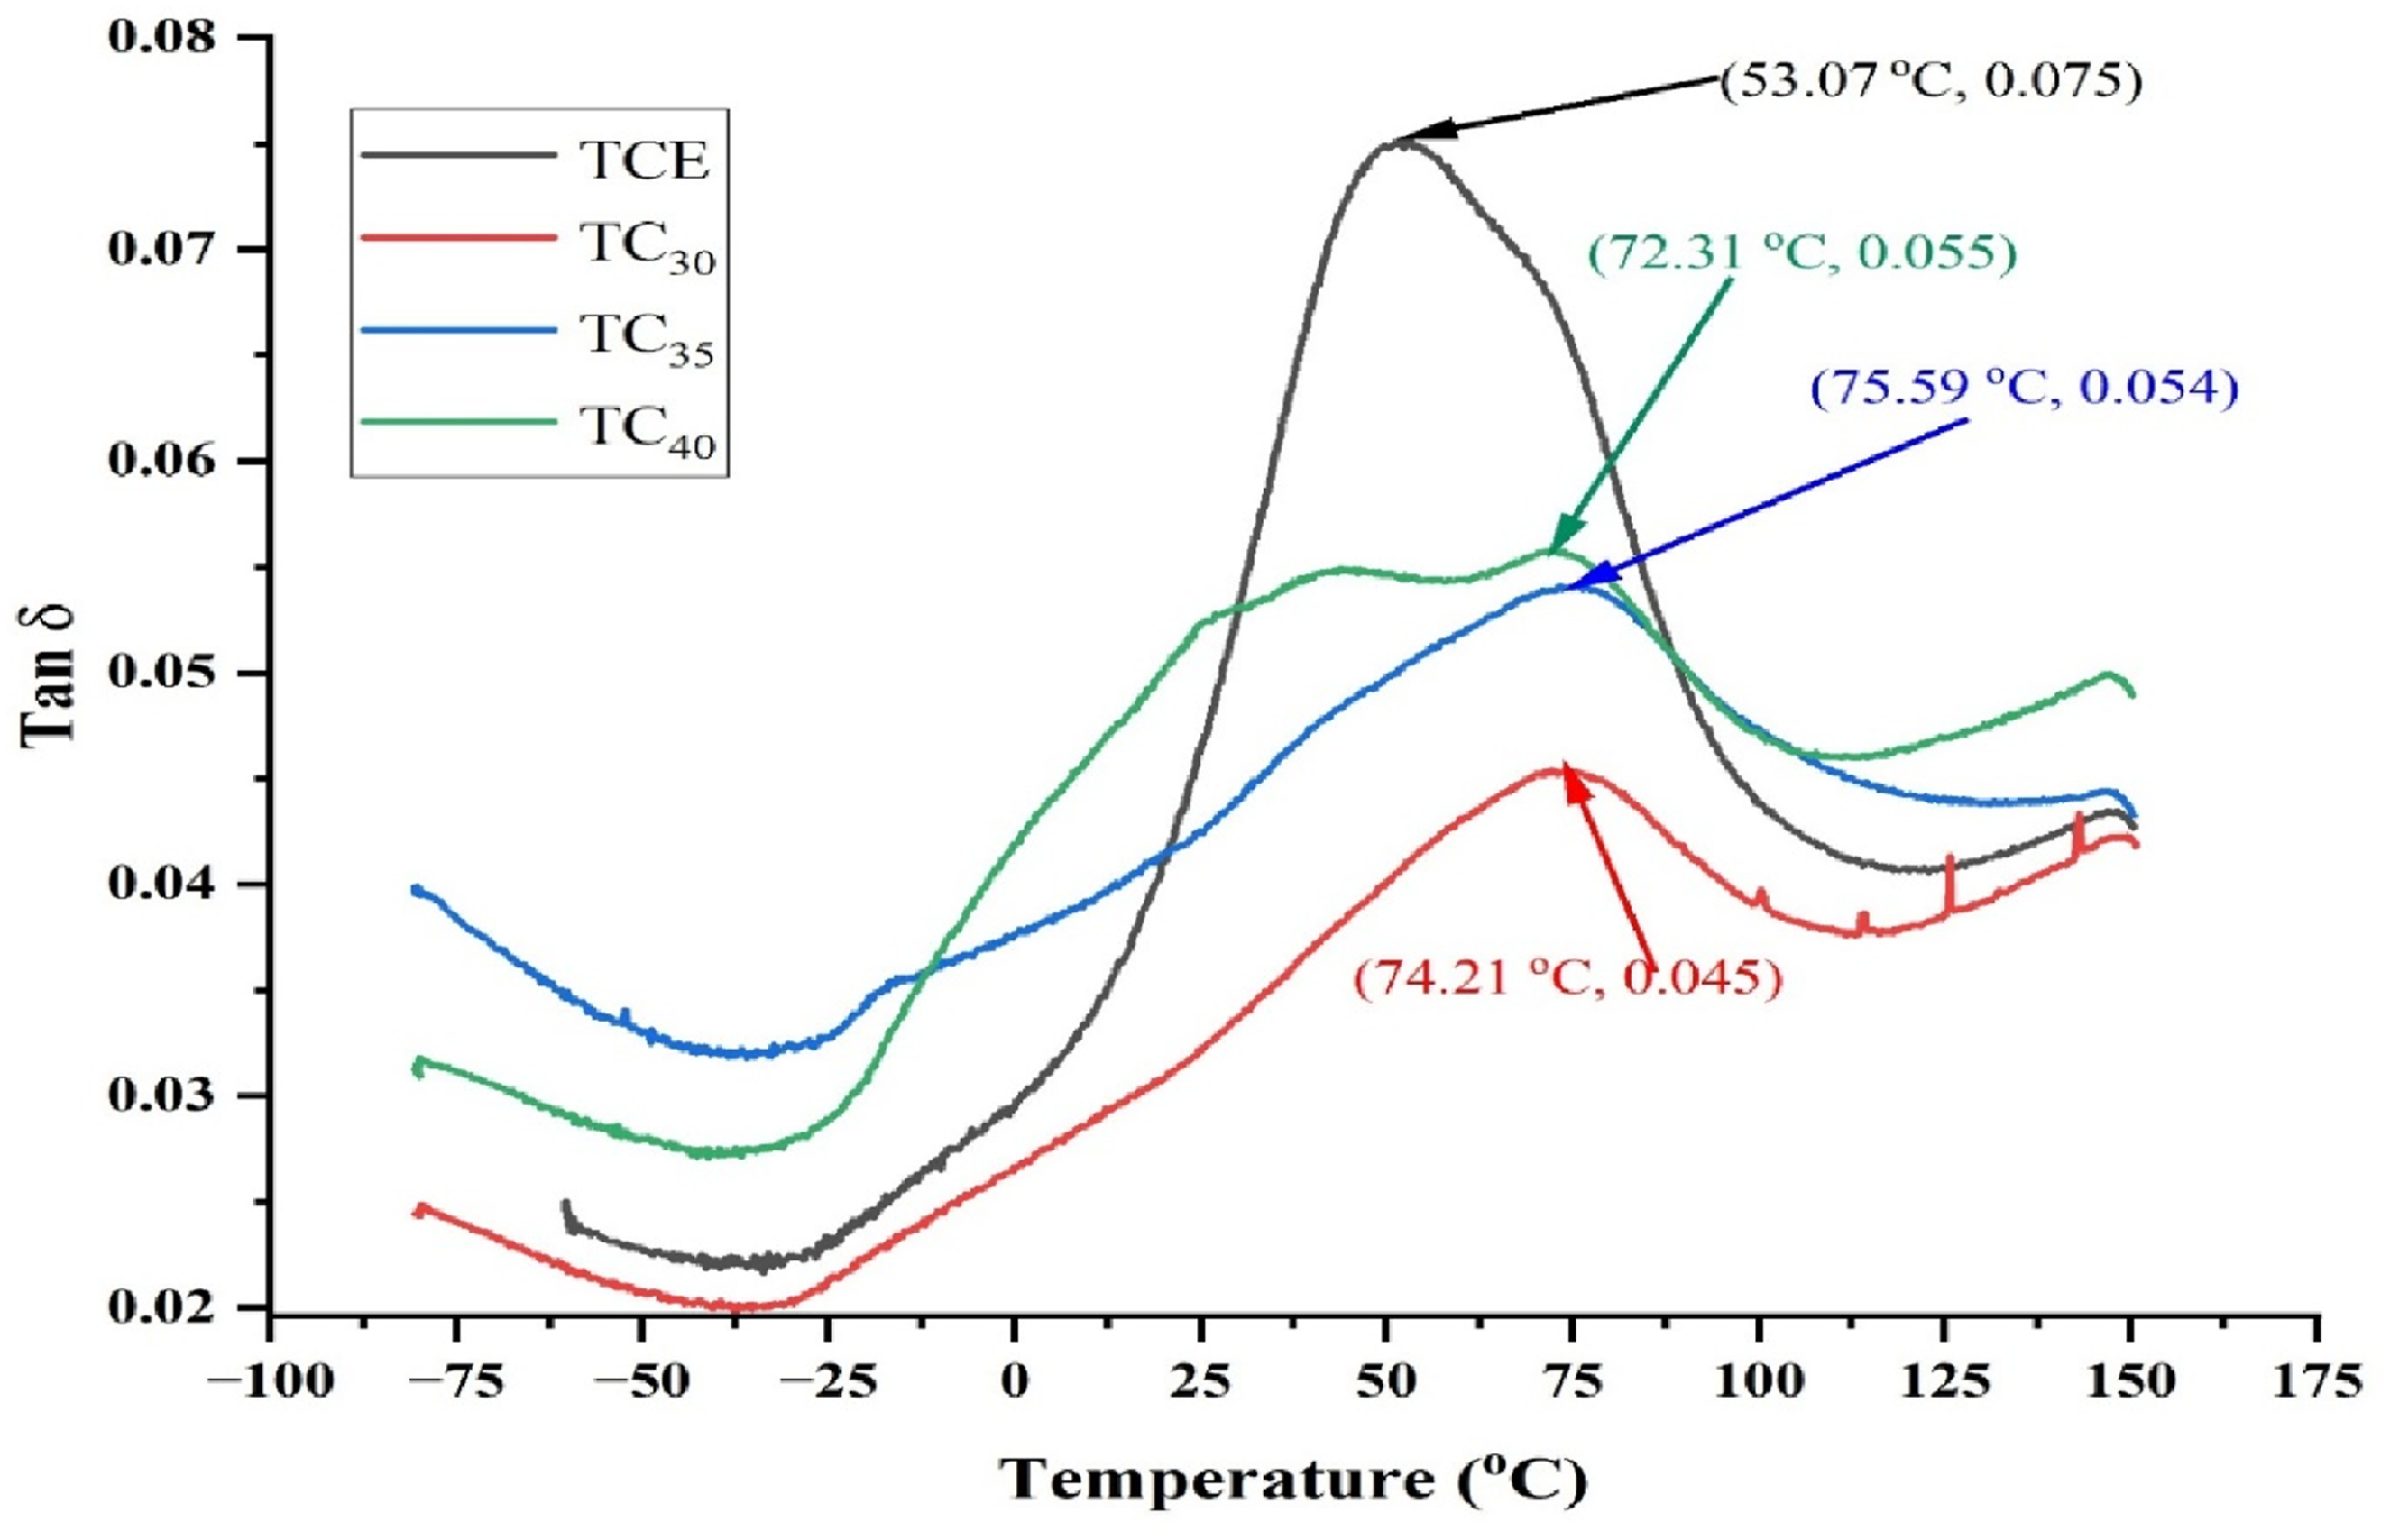
TCE in its virgin form has a well-defined tan δ peak in the glass transition region, representing high damping and thereby good energy dissipation. This can be taken as an indication of the high molecular mobility, which is desirable in applications related to damping of vibrations and resistance against impact. 53 In unreinforced thermoplastic matrices, Infanta Mary Priya et al. 54 observed sharp tan δ peaks, which indicated uniform relaxation times. In contrast, fiber-reinforced composites displayed broader, lower-intensity peaks because of heterogeneous interfacial regions and restricted chain mobility from fiber-matrix interactions. For TC30 and TC35, the shift of the tan δ peak to higher temperature indicates increased thermal stability with a delay in segmental relaxation, which is consistent with good interfacial adhesion and increased physical constraints.24,51
For TC40, the tan δ peak is the lowest and broadest for all samples studied herein, thus confirming extensive restriction of molecular motion and reduced energy dissipation. This behavior evinces the synergistic effect of the reinforcing SGFs, SiC, and PTFE, whereby rigid fillers raise stiffness while PTFE subtly modifies interfacial friction and relaxation behavior at higher temperatures.31,50 In reinforced TPE systems, as has been extensively reported, corresponding decreases in tan δ amplitude with increasing filler content signify enhanced mechanical stability and decreased dynamic losses. 55 This effect results from increased interfacial interactions and limitations on chain mobility caused by filler.42,56 TC30 showed the lowest C factor, signaling optimal fiber-matrix interaction and stiffness dominance.57,58 The phase shift values and C factors are indicated in the Table 5.
Physical and mechanical properties statistical tools
Density and void fractions
The density values, both theoretical and experimental (Figure 10), demonstrated a progressive increase with fiber and filler reinforcements. TC40 exhibited the highest density (theoretical: 1.79 g. cc−1, experimental: 1.73 g. cc−1), validating the impact of high-density fiber and fillers (SGF: 2.5 g. cc−1, SiC: 3.21 g. cc−1, PTFE: 2.16 g. cc−1). Nevertheless, subtle variations between the theoretical and experimental values indicate porosity of 2.42 %, 2.33 % and 3.35 %, in TC30, TC35, and TC40, respectively, which are likely resulting from filler agglomeration. This finding corresponds with the SEM observations, wherein the irregular filler distribution led to void formation, subsequently influencing the mechanical performance and density uniformity. Theoretical and experimental densities of TCE and their hybrid composites.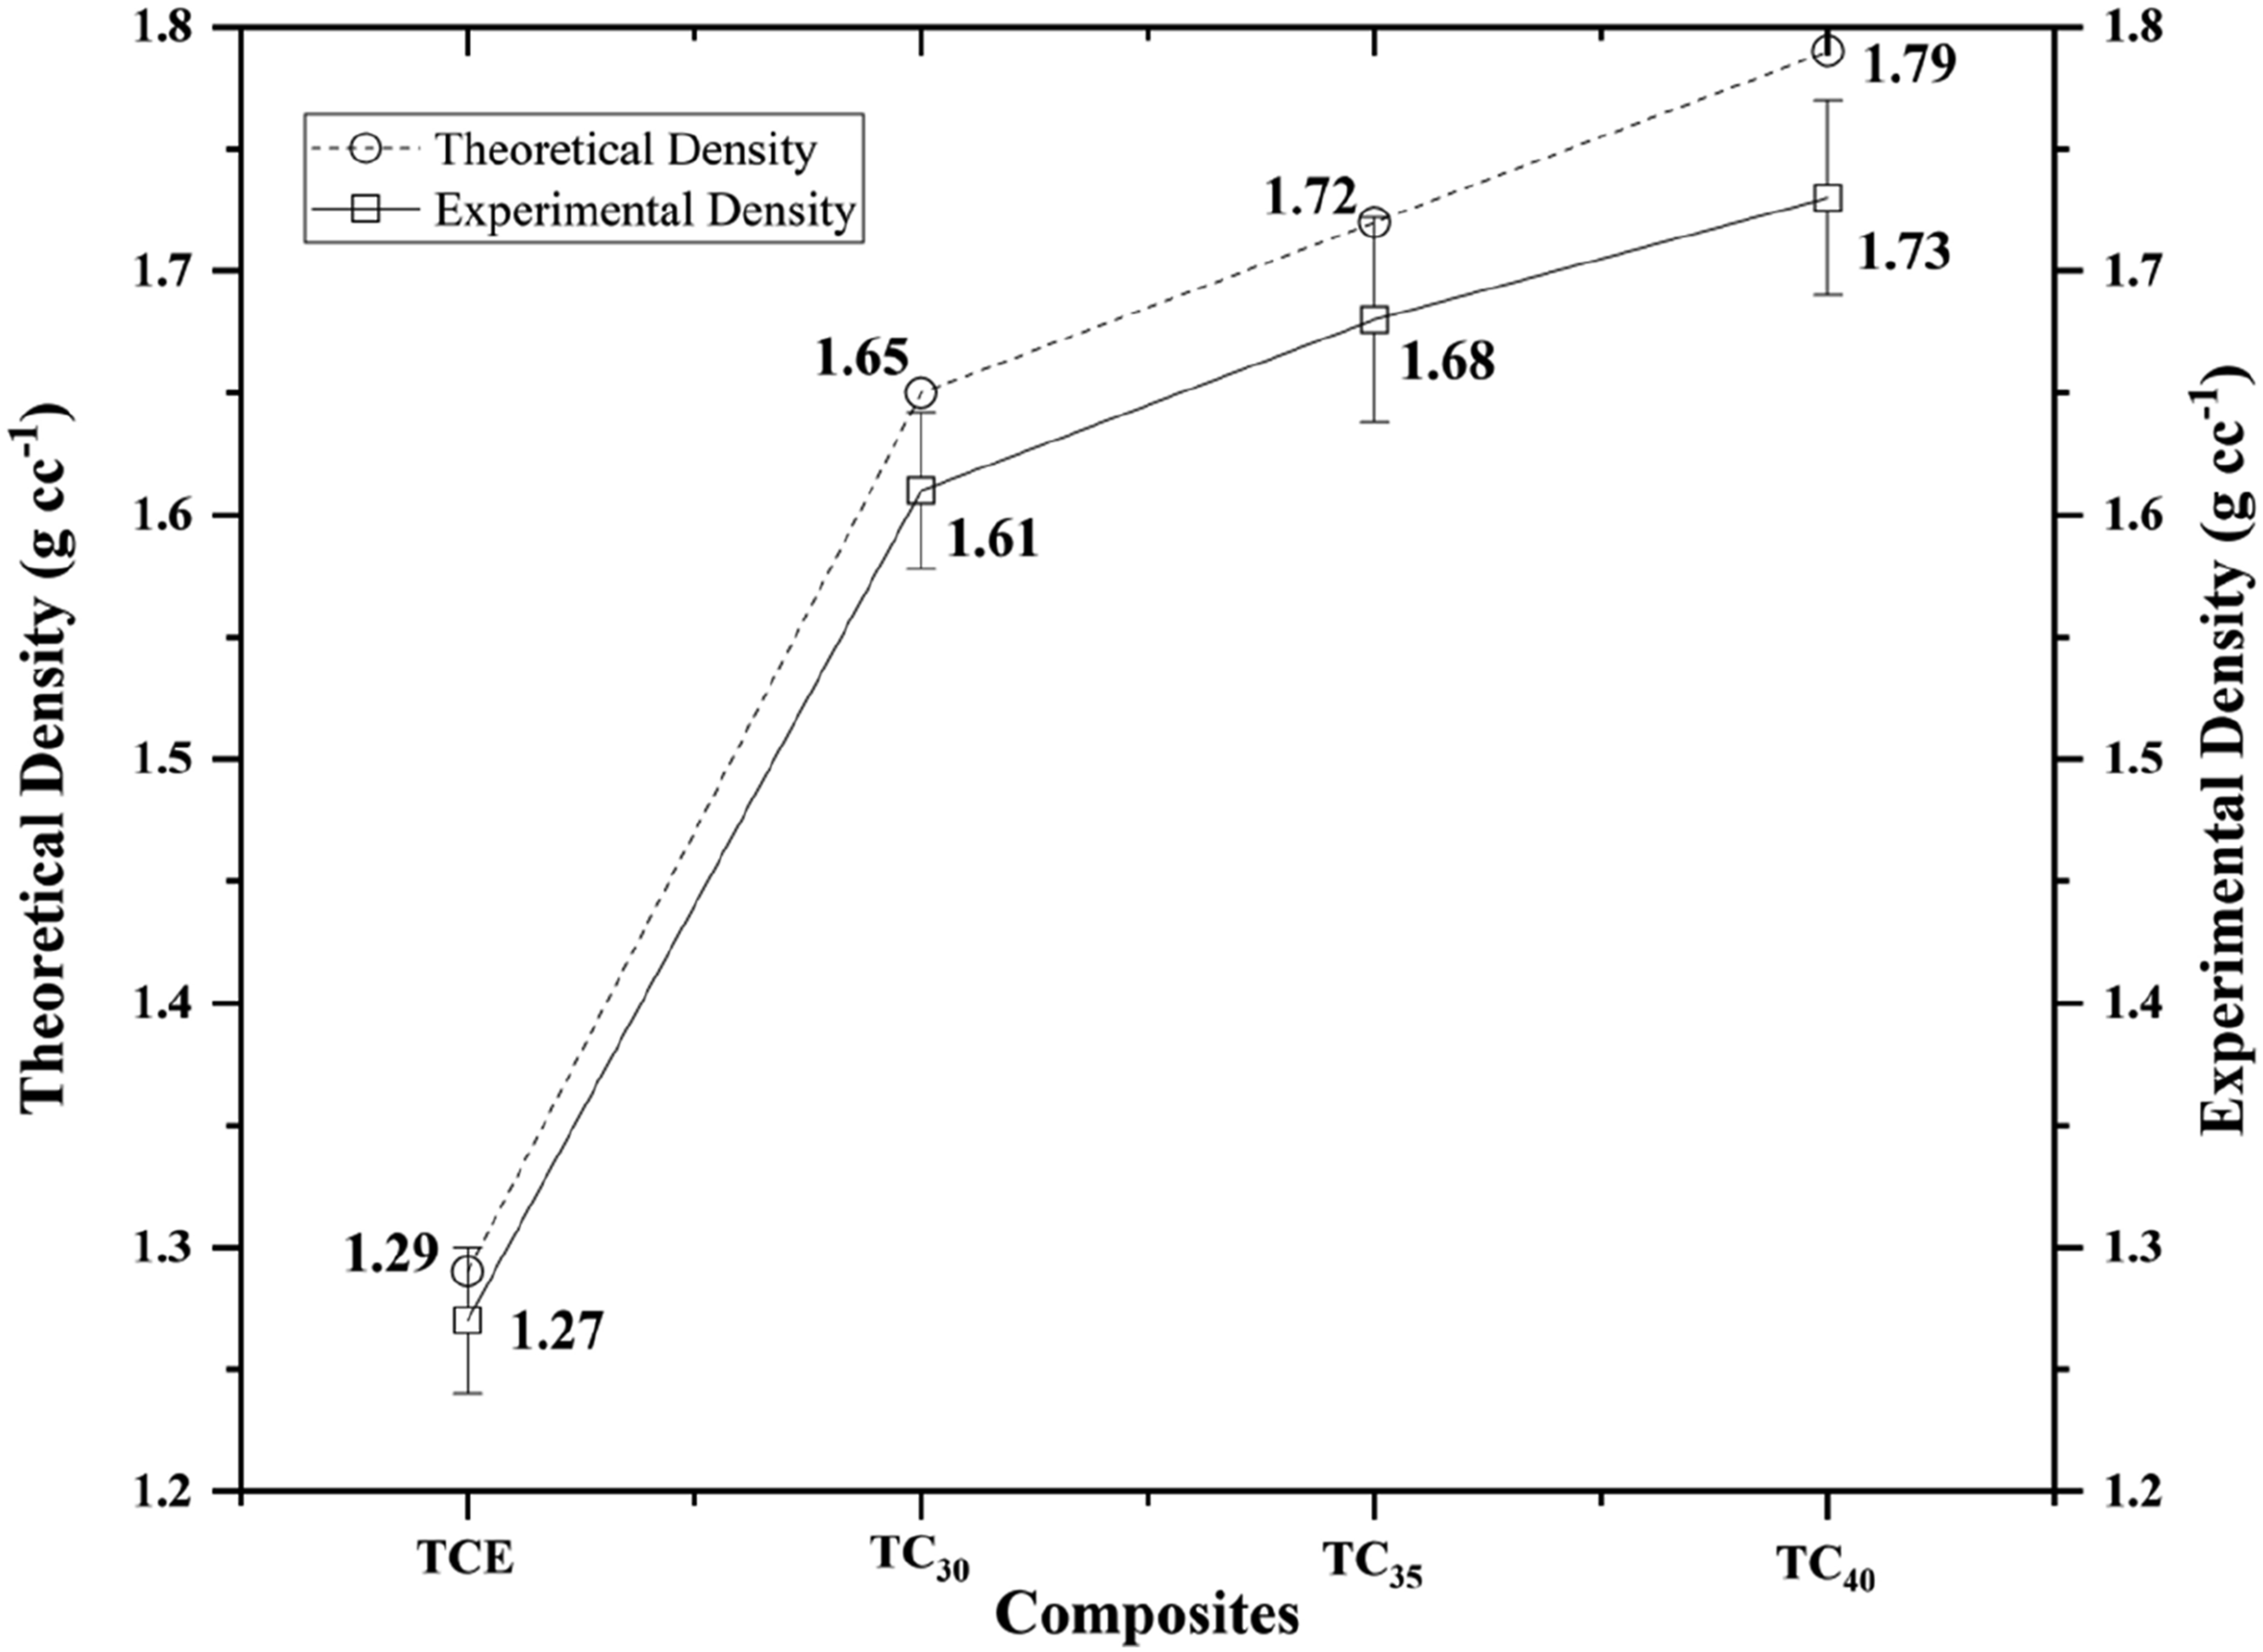
Tensile properties
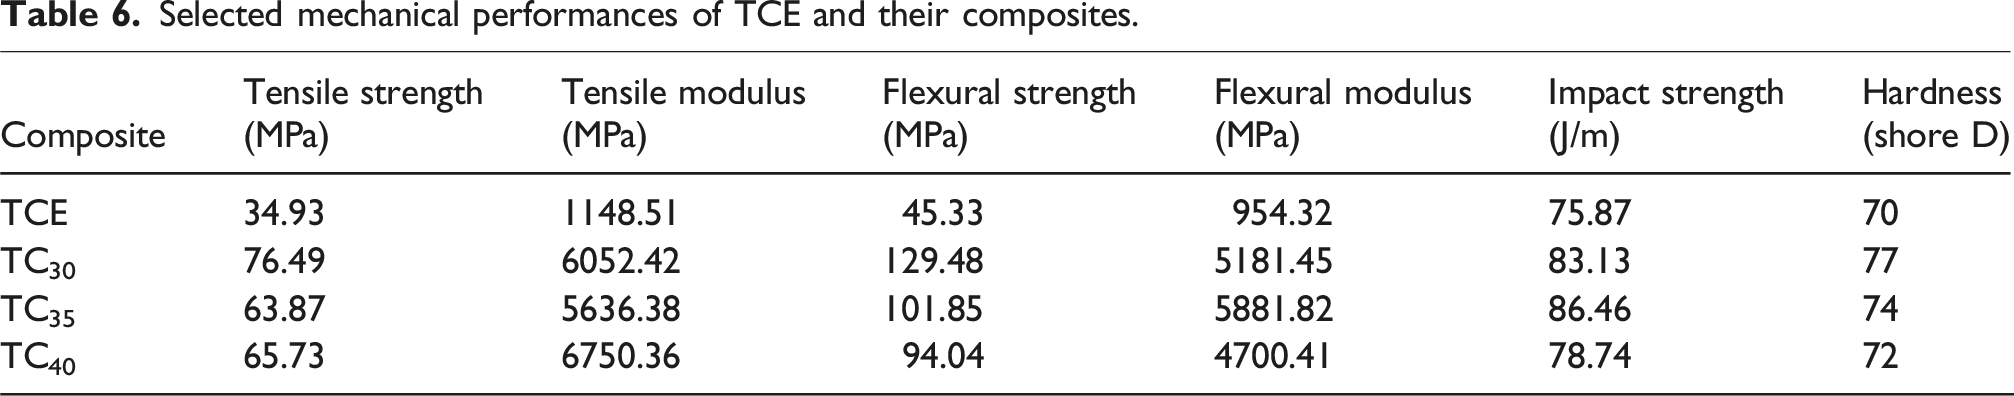
The tensile strength and modulus (Figure 11) exhibited significant improvement from TCE to TC30, with TC30 demonstrating the highest tensile strength (76.49 MPa) and modulus (6052.42 MPa) values. Similarly, an investigation by Teodorescu et al.
21
reported that the polypropylene reinforced with 30 wt % glass fiber composites demonstrated highest tensile properties in their study group. The reinforcement effect of the SGF 30 wt % facilitates enhanced stress transfer within the matrix. The tensile fracture surfaces of the TC30 compound, is illustrated in Figure 12, reveal distinct failure mechanisms that elucidate the differences in fiber-matrix adhesion and stress distribution. TC30 exhibited fiber pullout, from the matrix material. Tensile properties of TCE and their hybrid composites. Microscopic image of tensile fractured TC30 composite sample.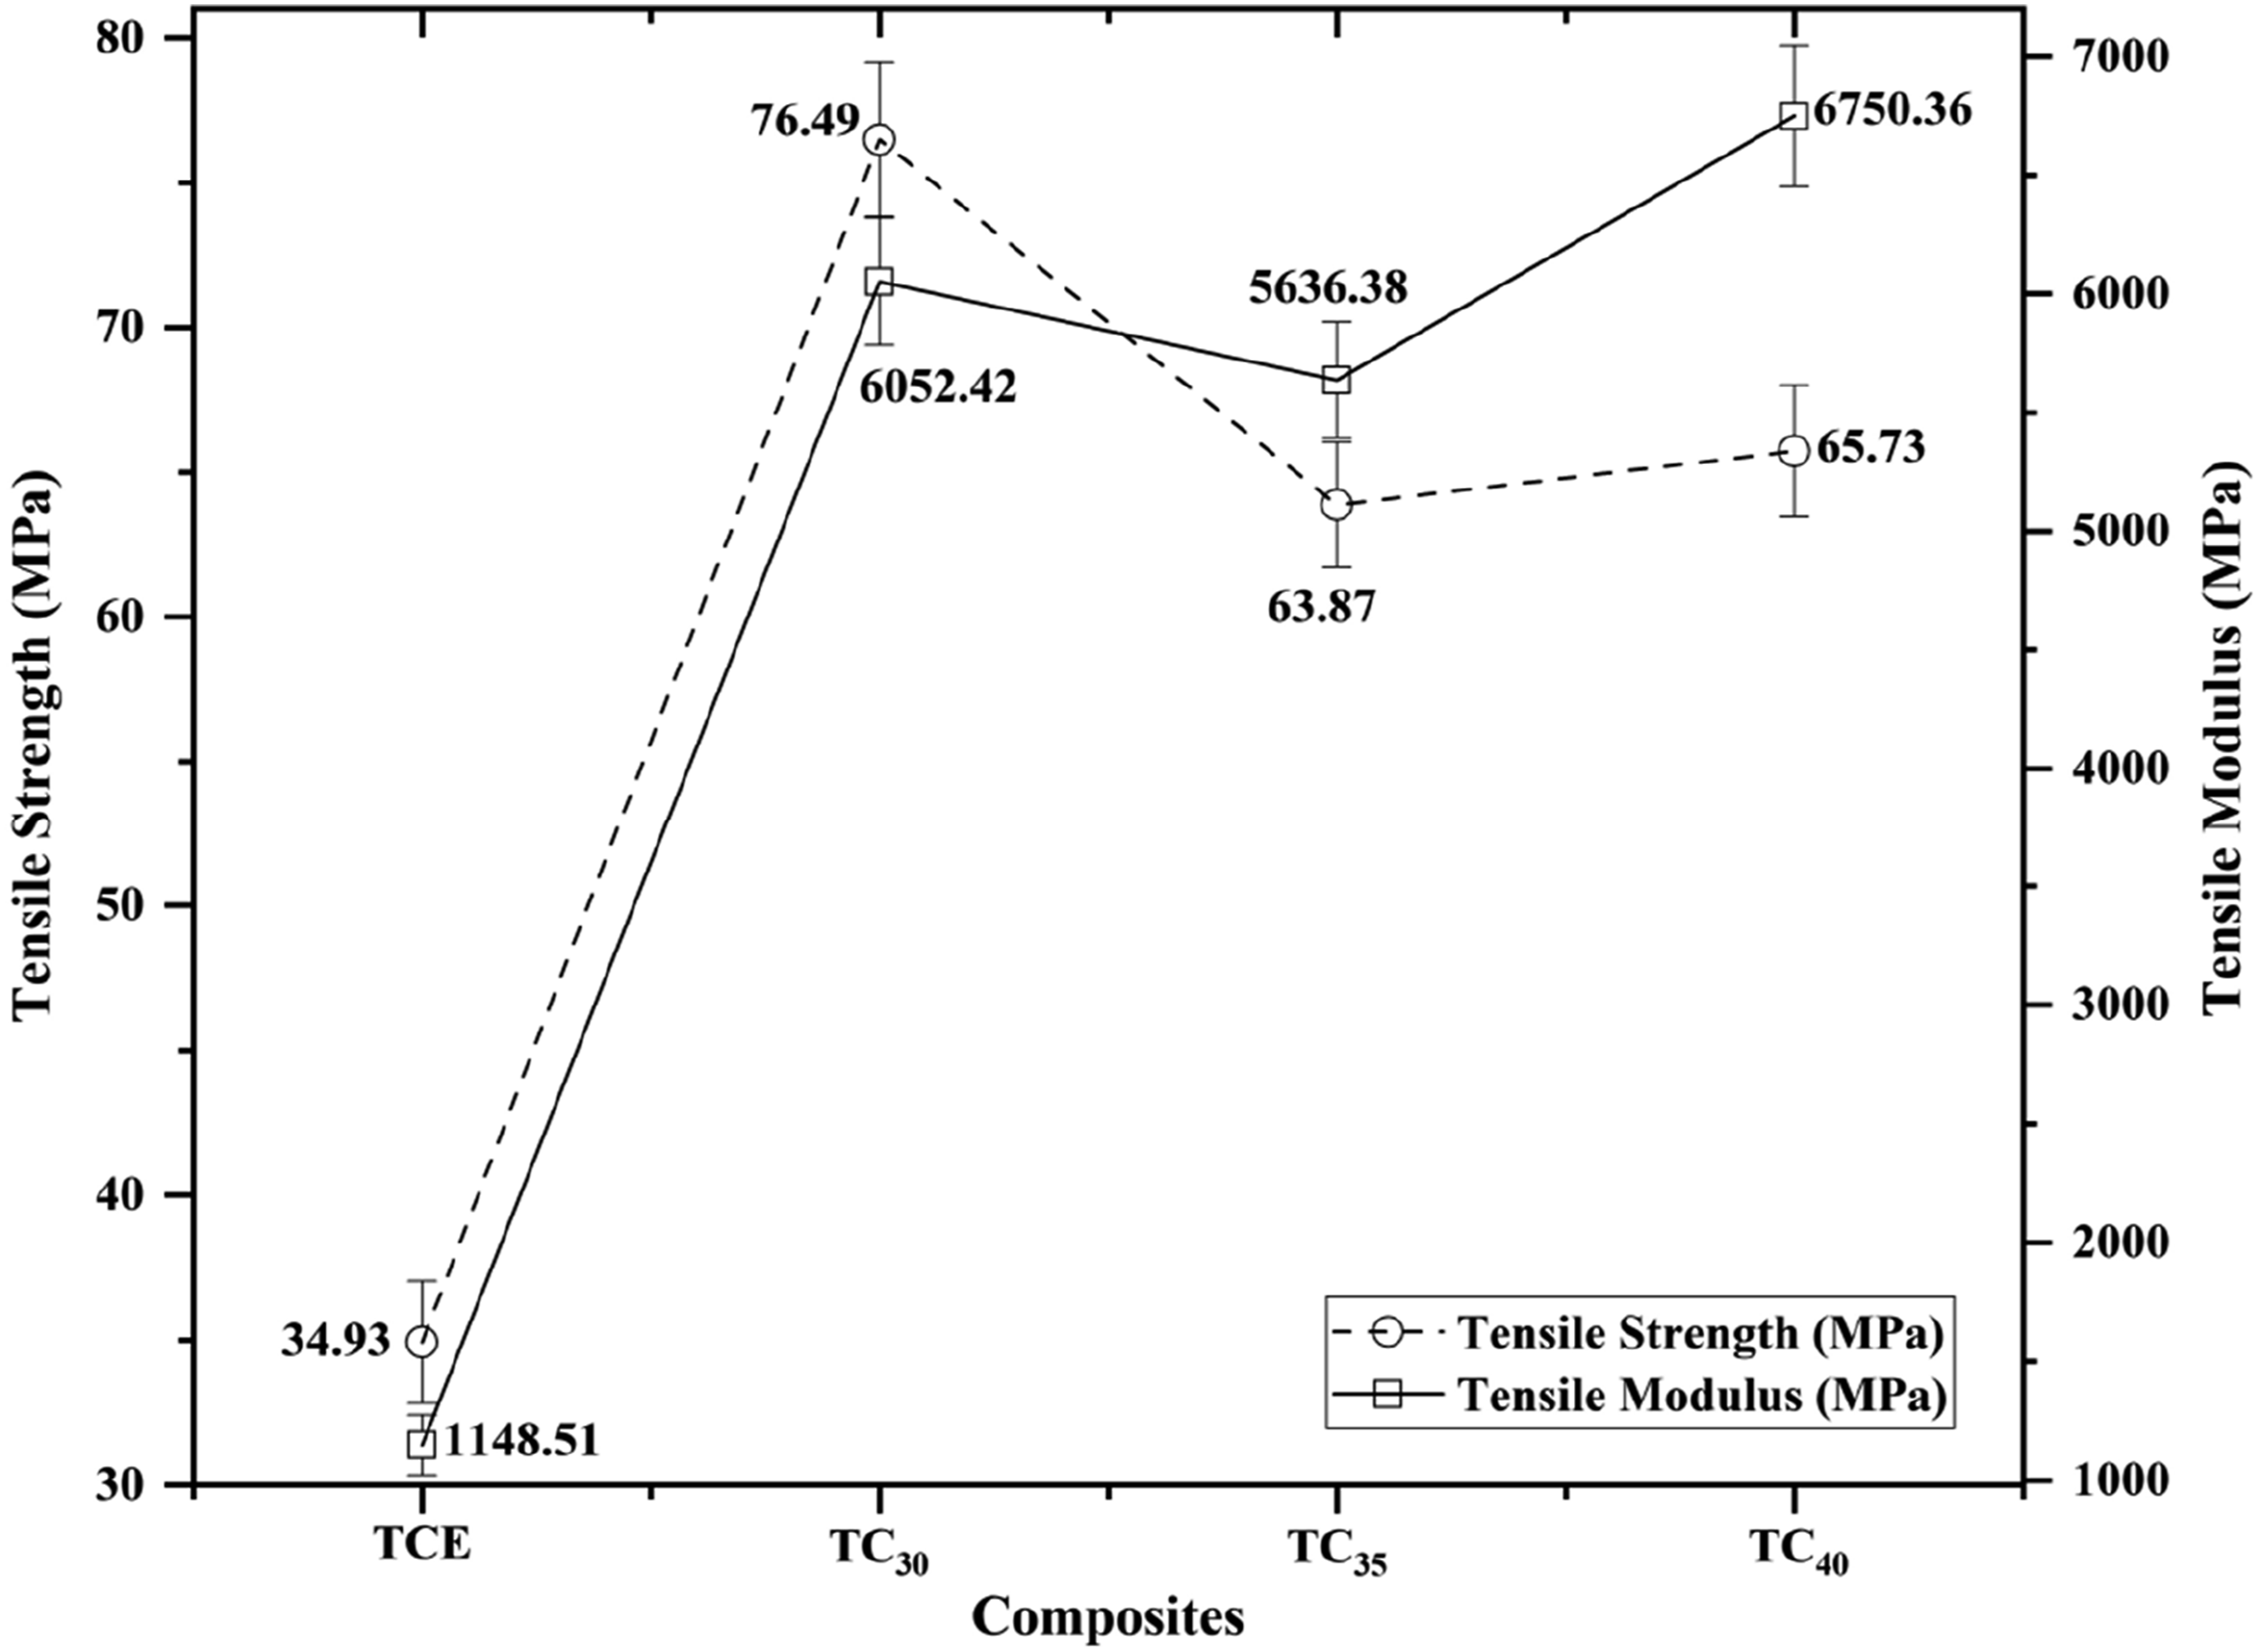
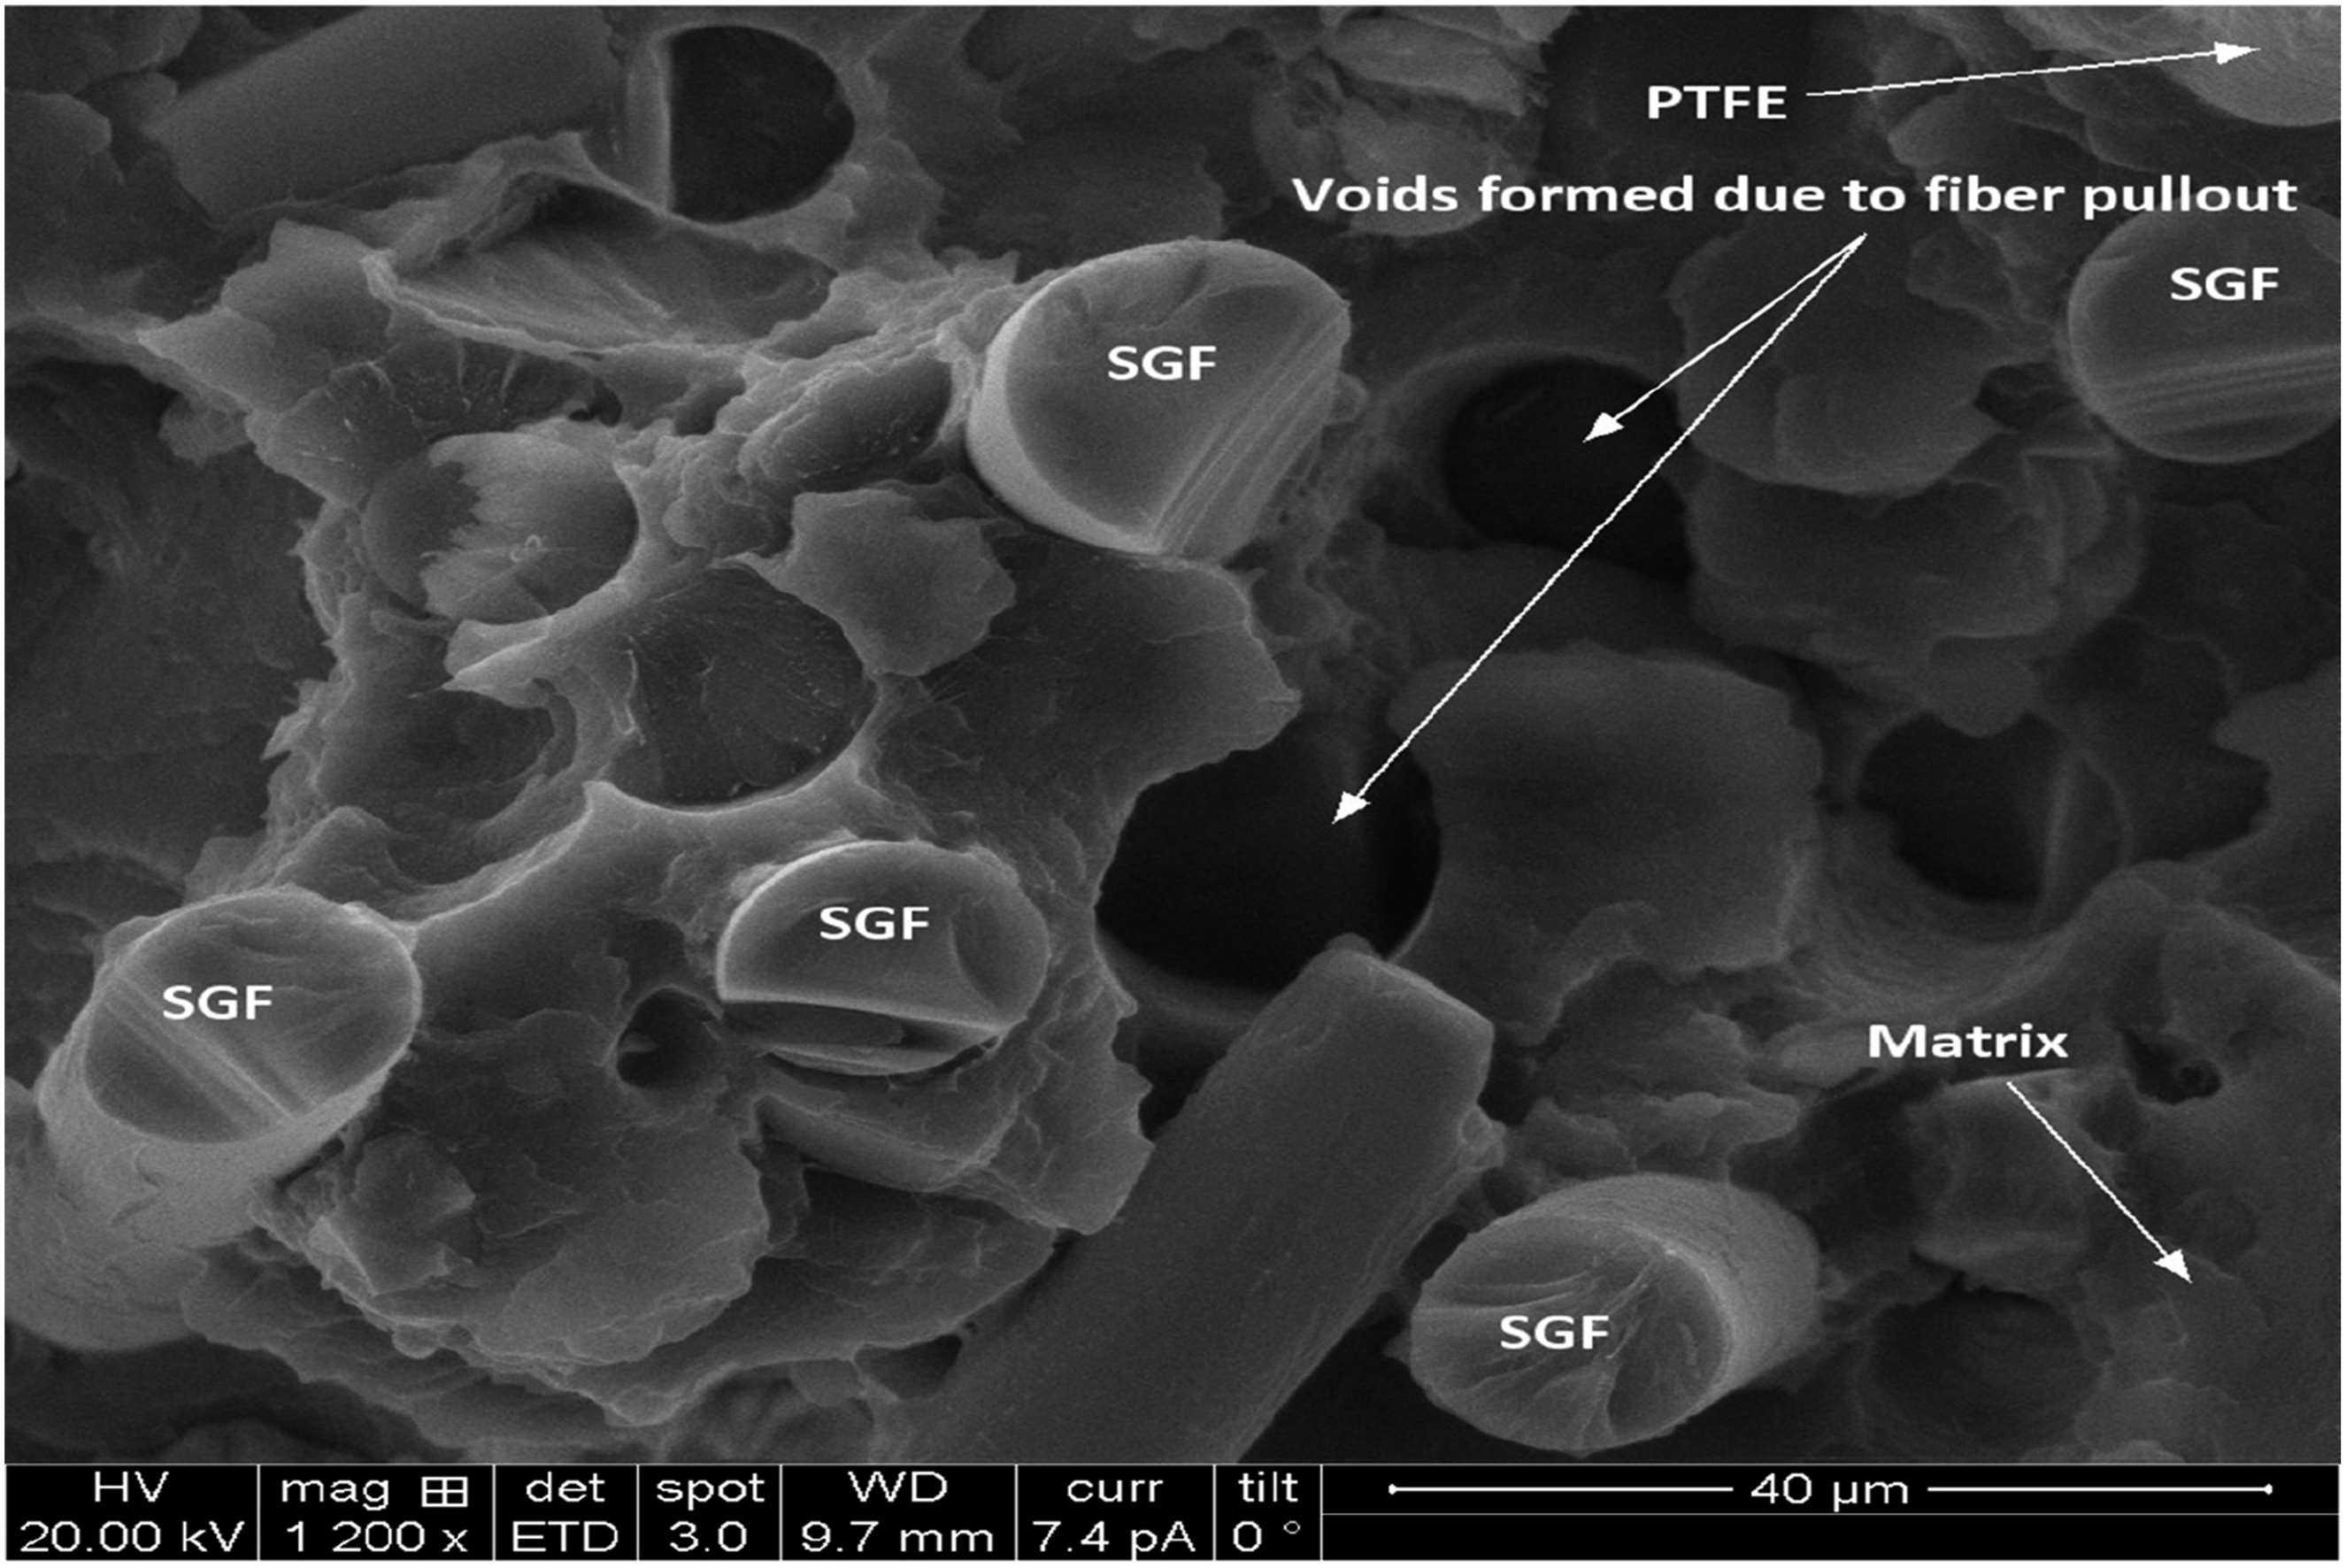
Further, it is evident from the SEM, that most of the fibers are oriented along the direction of application of load, resulting in the more energy absorption before rupture. Figure also reveals better interfacial adherence of matrix material to the SGF indicating the requirement of more energy for the fracture to happen. However, the diminution in the strength subjected to tensile load on TC40 and TC35 (65.73 and 63.87 MPa, respectively) suggests that presence of PTFE and SiC disrupt fiber alignment, thereby diminishing stress transfer efficiency. Also, it is evident that the filler particles are not consistently spread out in the matrix. For the reason that the PTFE possess broad melting temperature, the compounds’ poor tensile strength was caused by particle pullout and cracking due to their insufficient binding strength. According to Jian and Tao, 59 the significant improvement in resistance to wear and strength under tensile mode of CF/PPS compounds that comes from the addition of PA6 as a compatibilizer is intimately associated to the compatibilizer cross-linking fortifying activity. Therefore, a sufficient compatibilizer must be applied to have appropriate aggregation. A comparison of TC30, TC35, and TC40 showed that although fillers improved thermal stability, high filler content could cause agglomeration and micro gaps, which would lower the tensile strength.
The ruptured faces of the TC30 and TC40 compounds subjected to tensile load, illustrated in Figures 12 and 13, reveal distinct failure mechanisms that elucidate the differences in fiber-matrix adhesion and stress distribution. TC30 exhibited fiber pullout, from the matrix material. Further, it is evident from the SEM, Figure 12, that most of the fibers are oriented along the direction of application of load, resulting in the more energy absorption before rupture. The presence of smooth fiber surfaces suggests that the fibers did not contribute significantly to load-bearing, resulting in premature failure of the composite. This confirms that interfacial debonding dominates the failure mechanism under tensile stress for TC35. TC40, however, displays a more irregular and rough fracture morphology, with more pronounced fiber breakage and reduced pullout, suggesting stronger fiber-matrix adhesion compared to TC30. The increased number of microcracks and irregular voids indicated a higher degree of stress transfer, which improved the overall tensile modulus. Microscopic image of tensile fractured TC40 composite sample.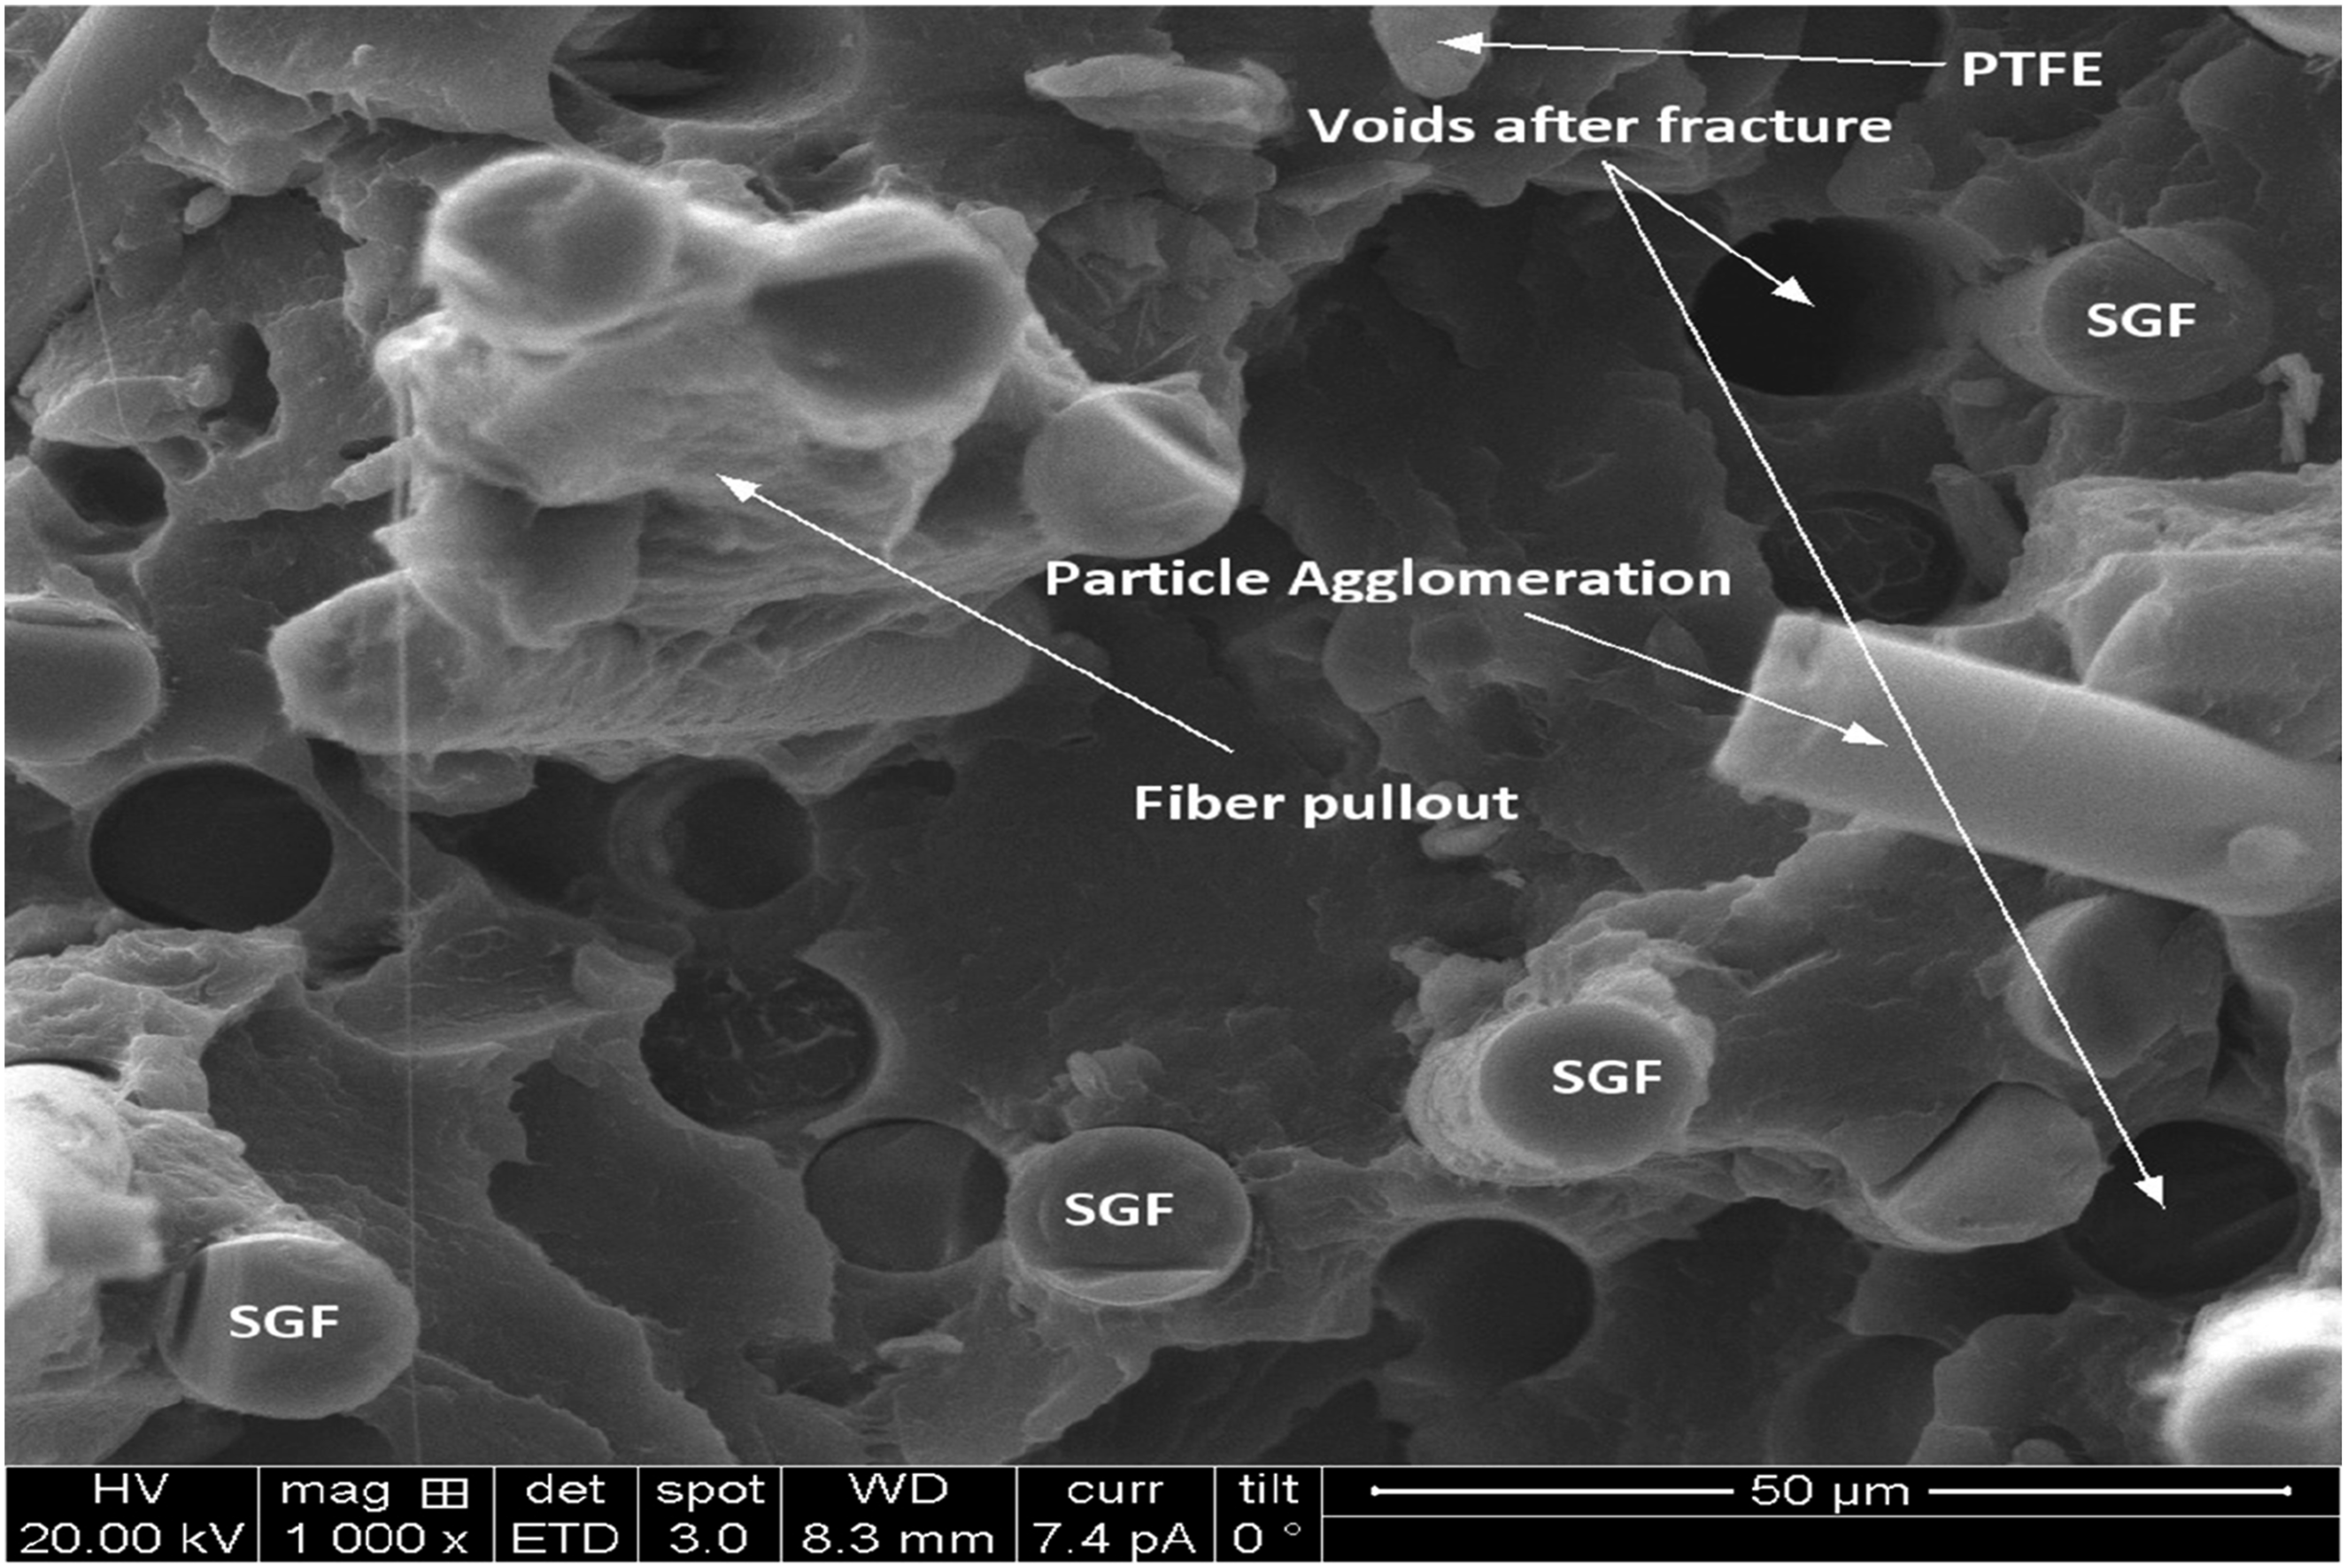
Flexure properties
The flexural properties (Figure 14) demonstrated a comparable trend. TC30 exhibited the highest flexural strength (129.48 MPa), indicating effective fiber-matrix adhesion in the composite. Numerous studies,60,61 have established that adding strands improved modulus and flexural strength. Rather than passing through the fiber, the applied normal load passes through the matrix material and is transmitted about it. As a result, the postponed fiber rupture has a high load-bearing capability. Flexural strength and modulus of TCE and their hybrid composites.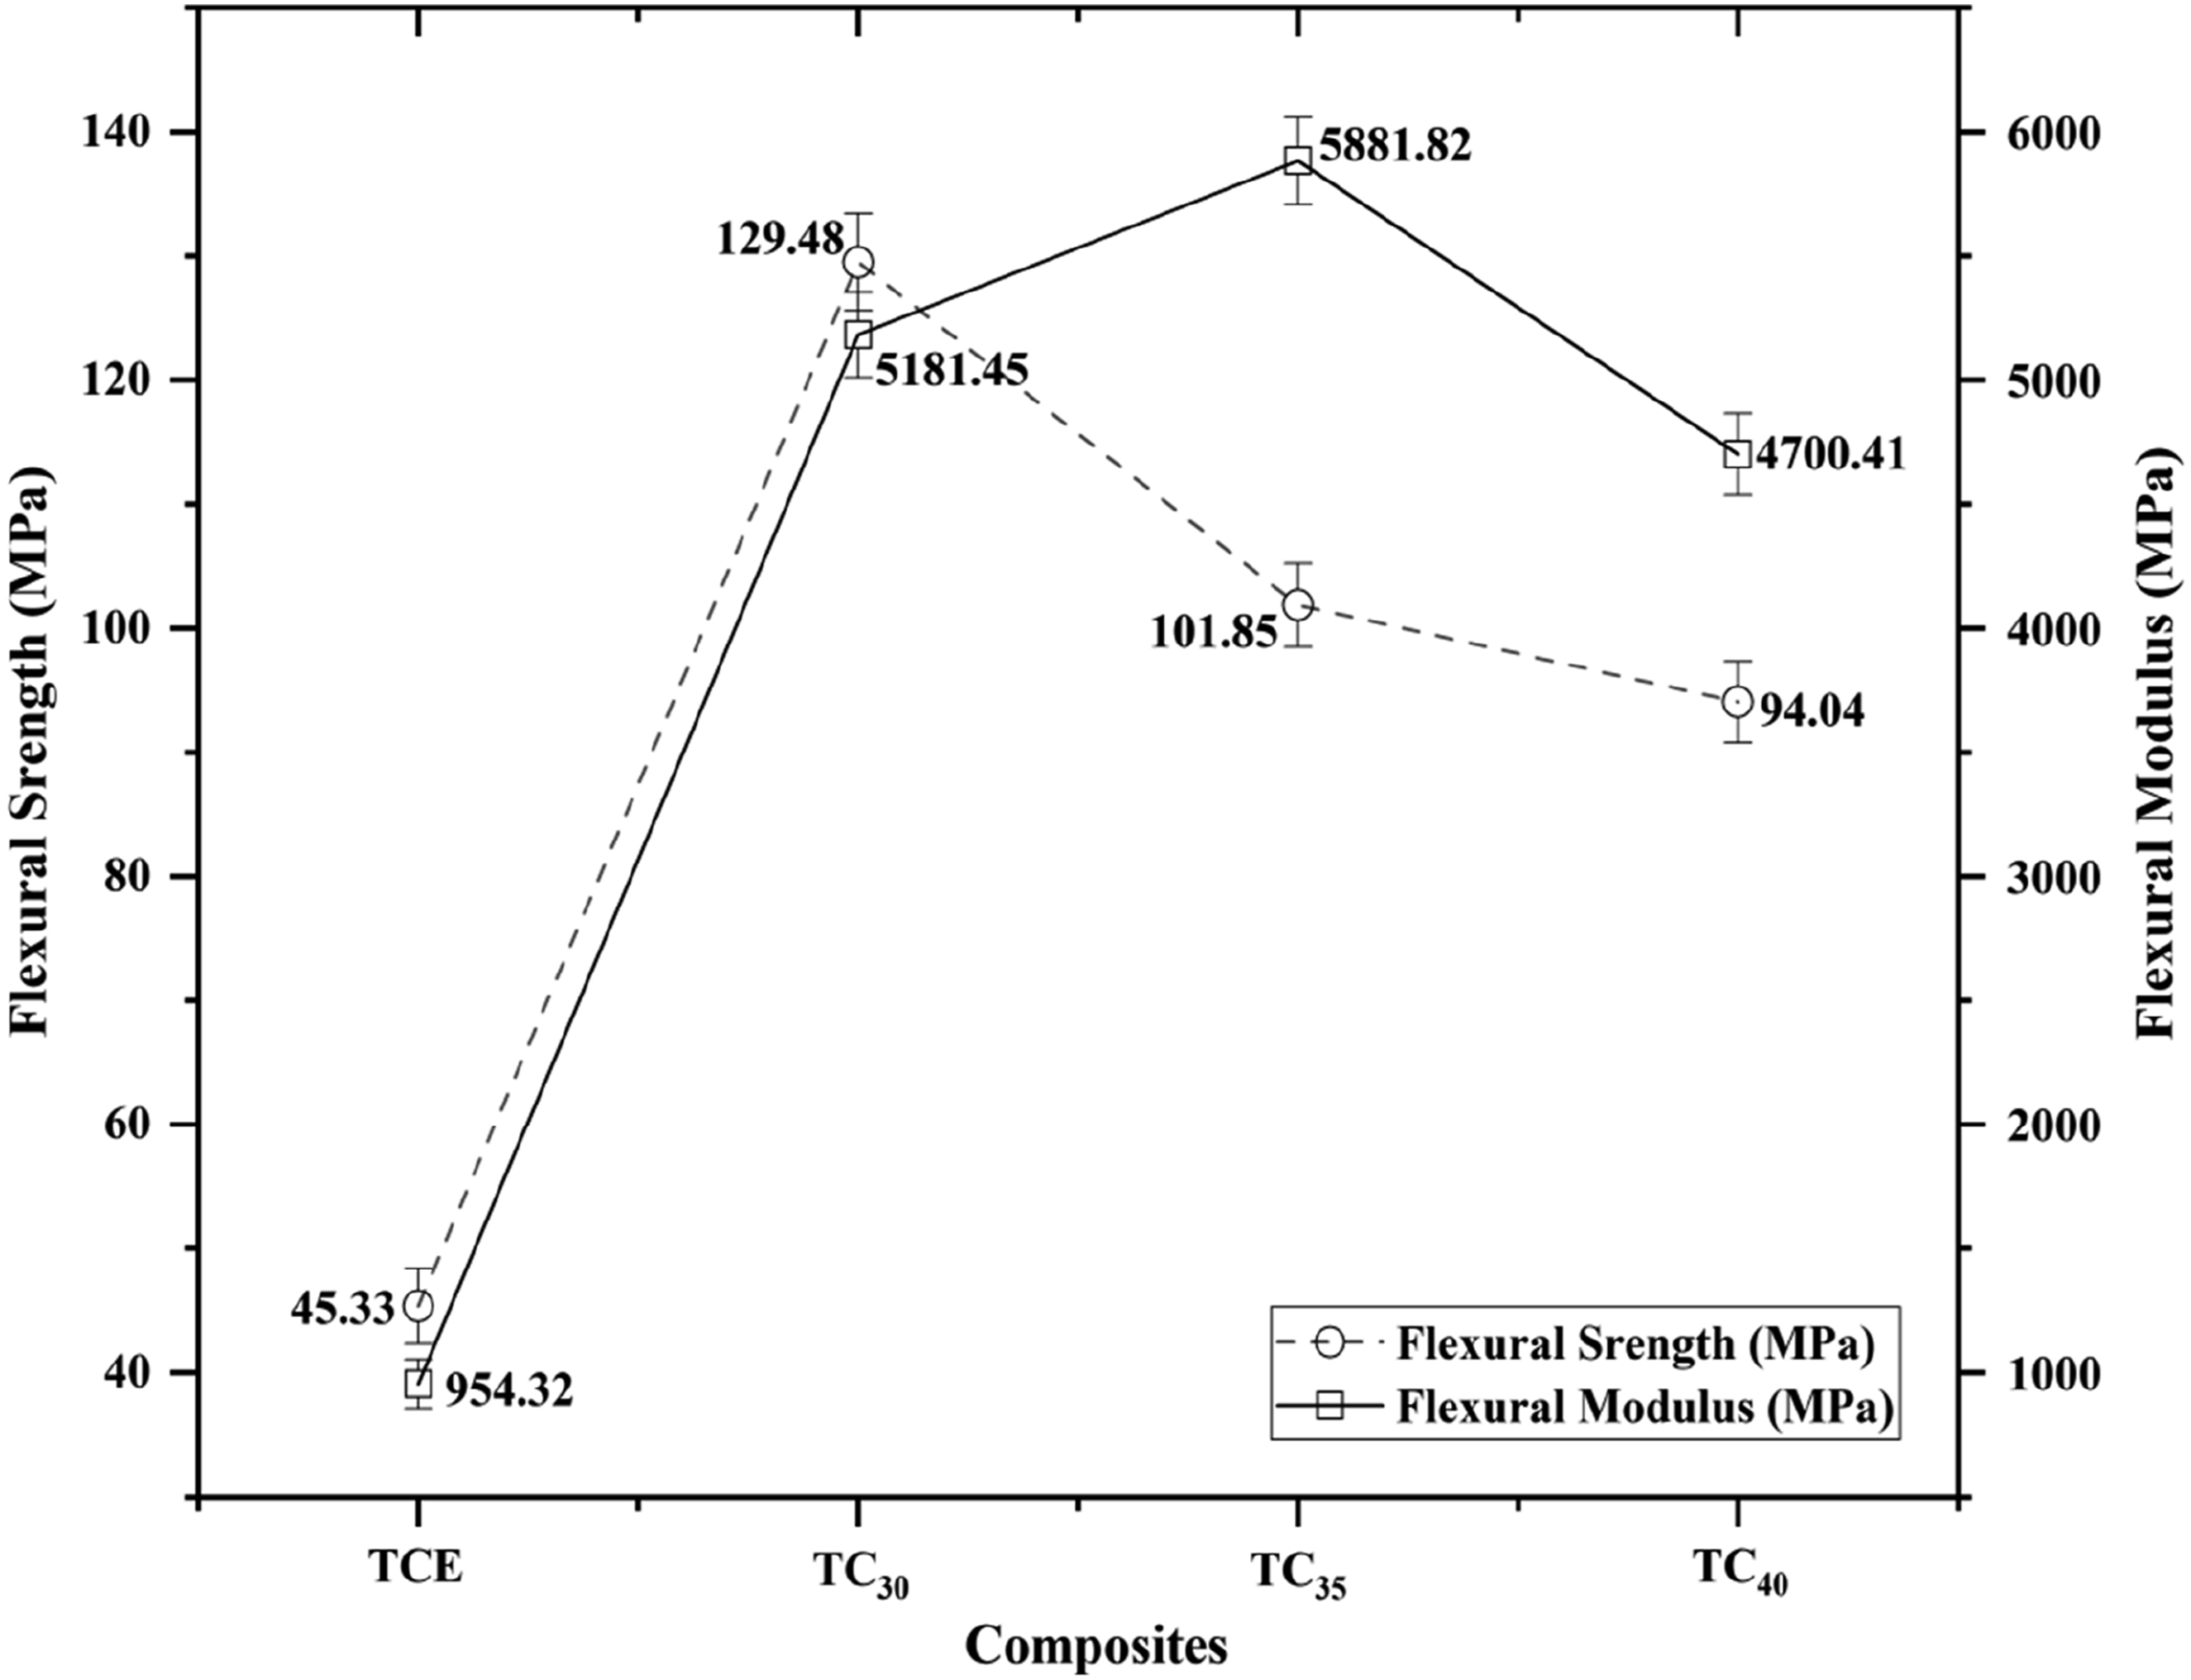
However, TC40 displayed a decrease in flexural strength (94.04 MPa), which was attributed to the excessive content of particulate, resulting in the creation of microcracks and matrix discontinuity. A comparative analysis confirmed that the optimal fiber and filler balance is crucial; the SGF enhances strength, whereas the presence of PTFE and SiC introduce defects, reducing flexural strength.
At TC30, the fracture surface exhibited clean fiber breakage with some fiber-matrix debonding, suggesting moderate adhesion between the two phases (Figure 15). The presence of sharp-edged fiber breakage indicates a brittle fracture mechanism, where the stress concentration at the fiber-matrix interface leads to catastrophic failure. TC35, conversely, exhibited a higher degree of fiber pullout (inset of Figure 16), implying a relatively weaker interfacial bonding than TC30. The rough fracture morphology suggests enhanced energy dissipation due to fiber bridging, which may contribute to improved toughness but also indicates susceptibility to debonding under flexural stress. Microscopic image of flexure fractured TC35 composite sample. Microscopic image of flexure fractured TC30 composite sample.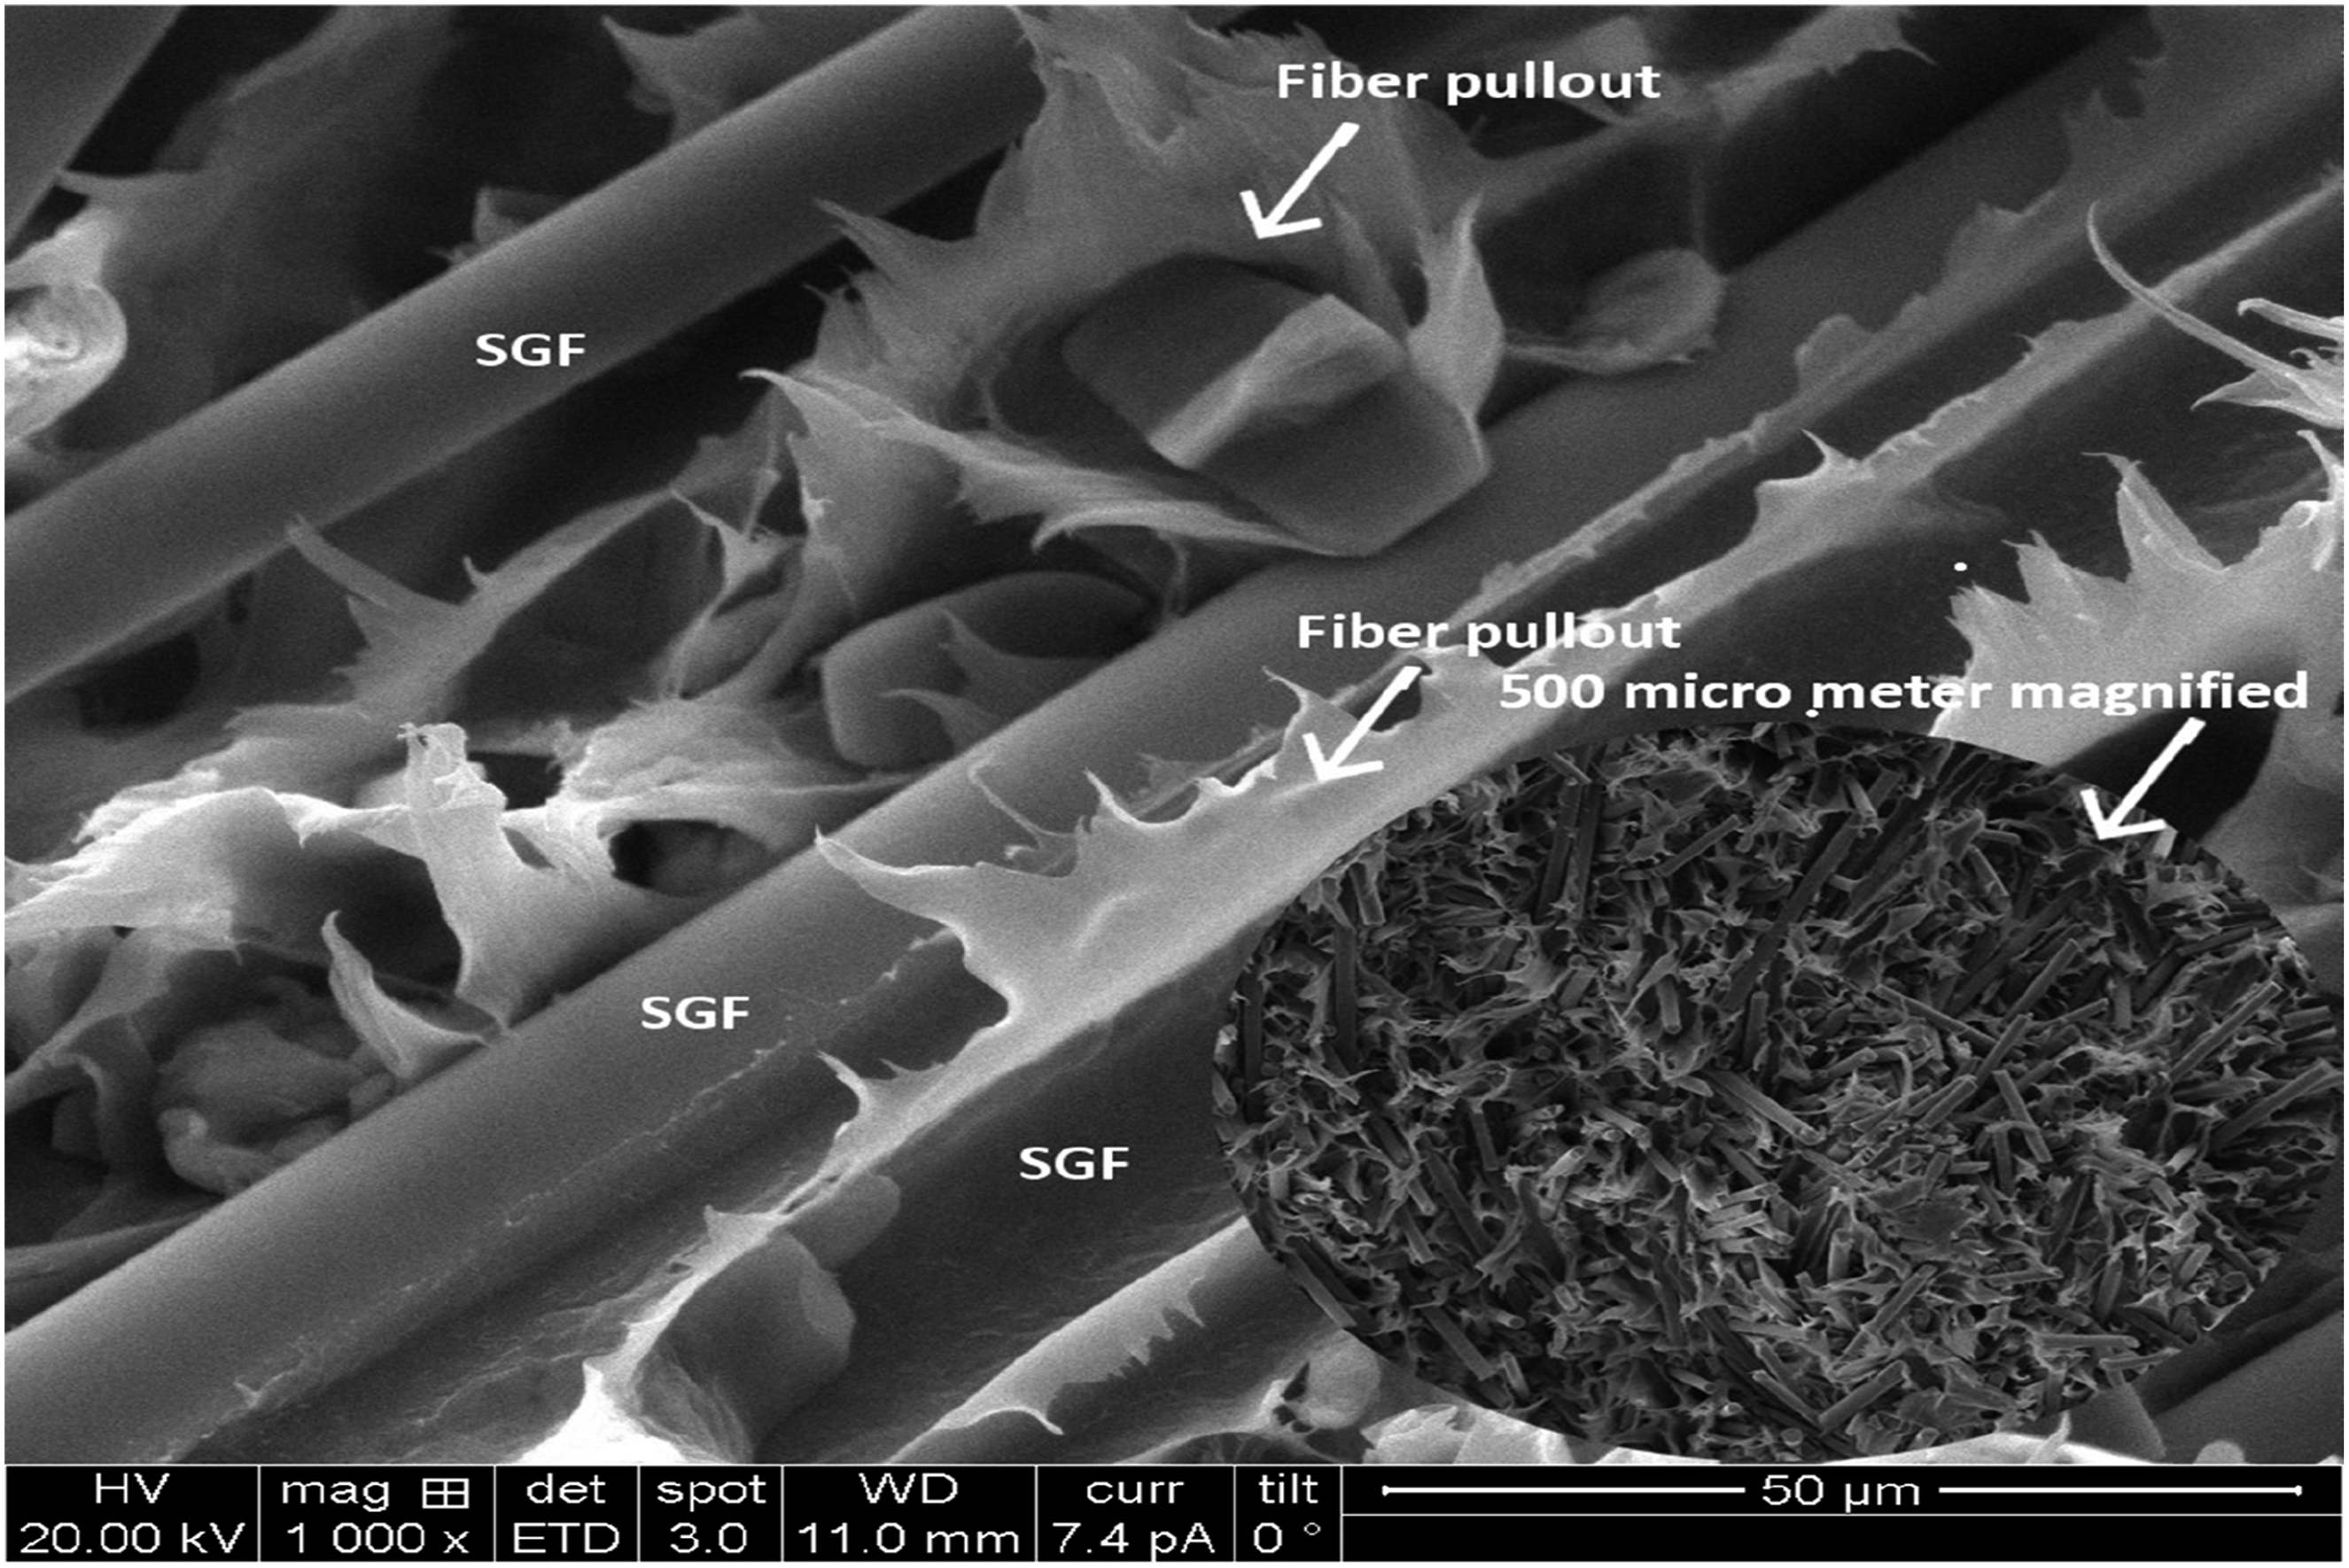
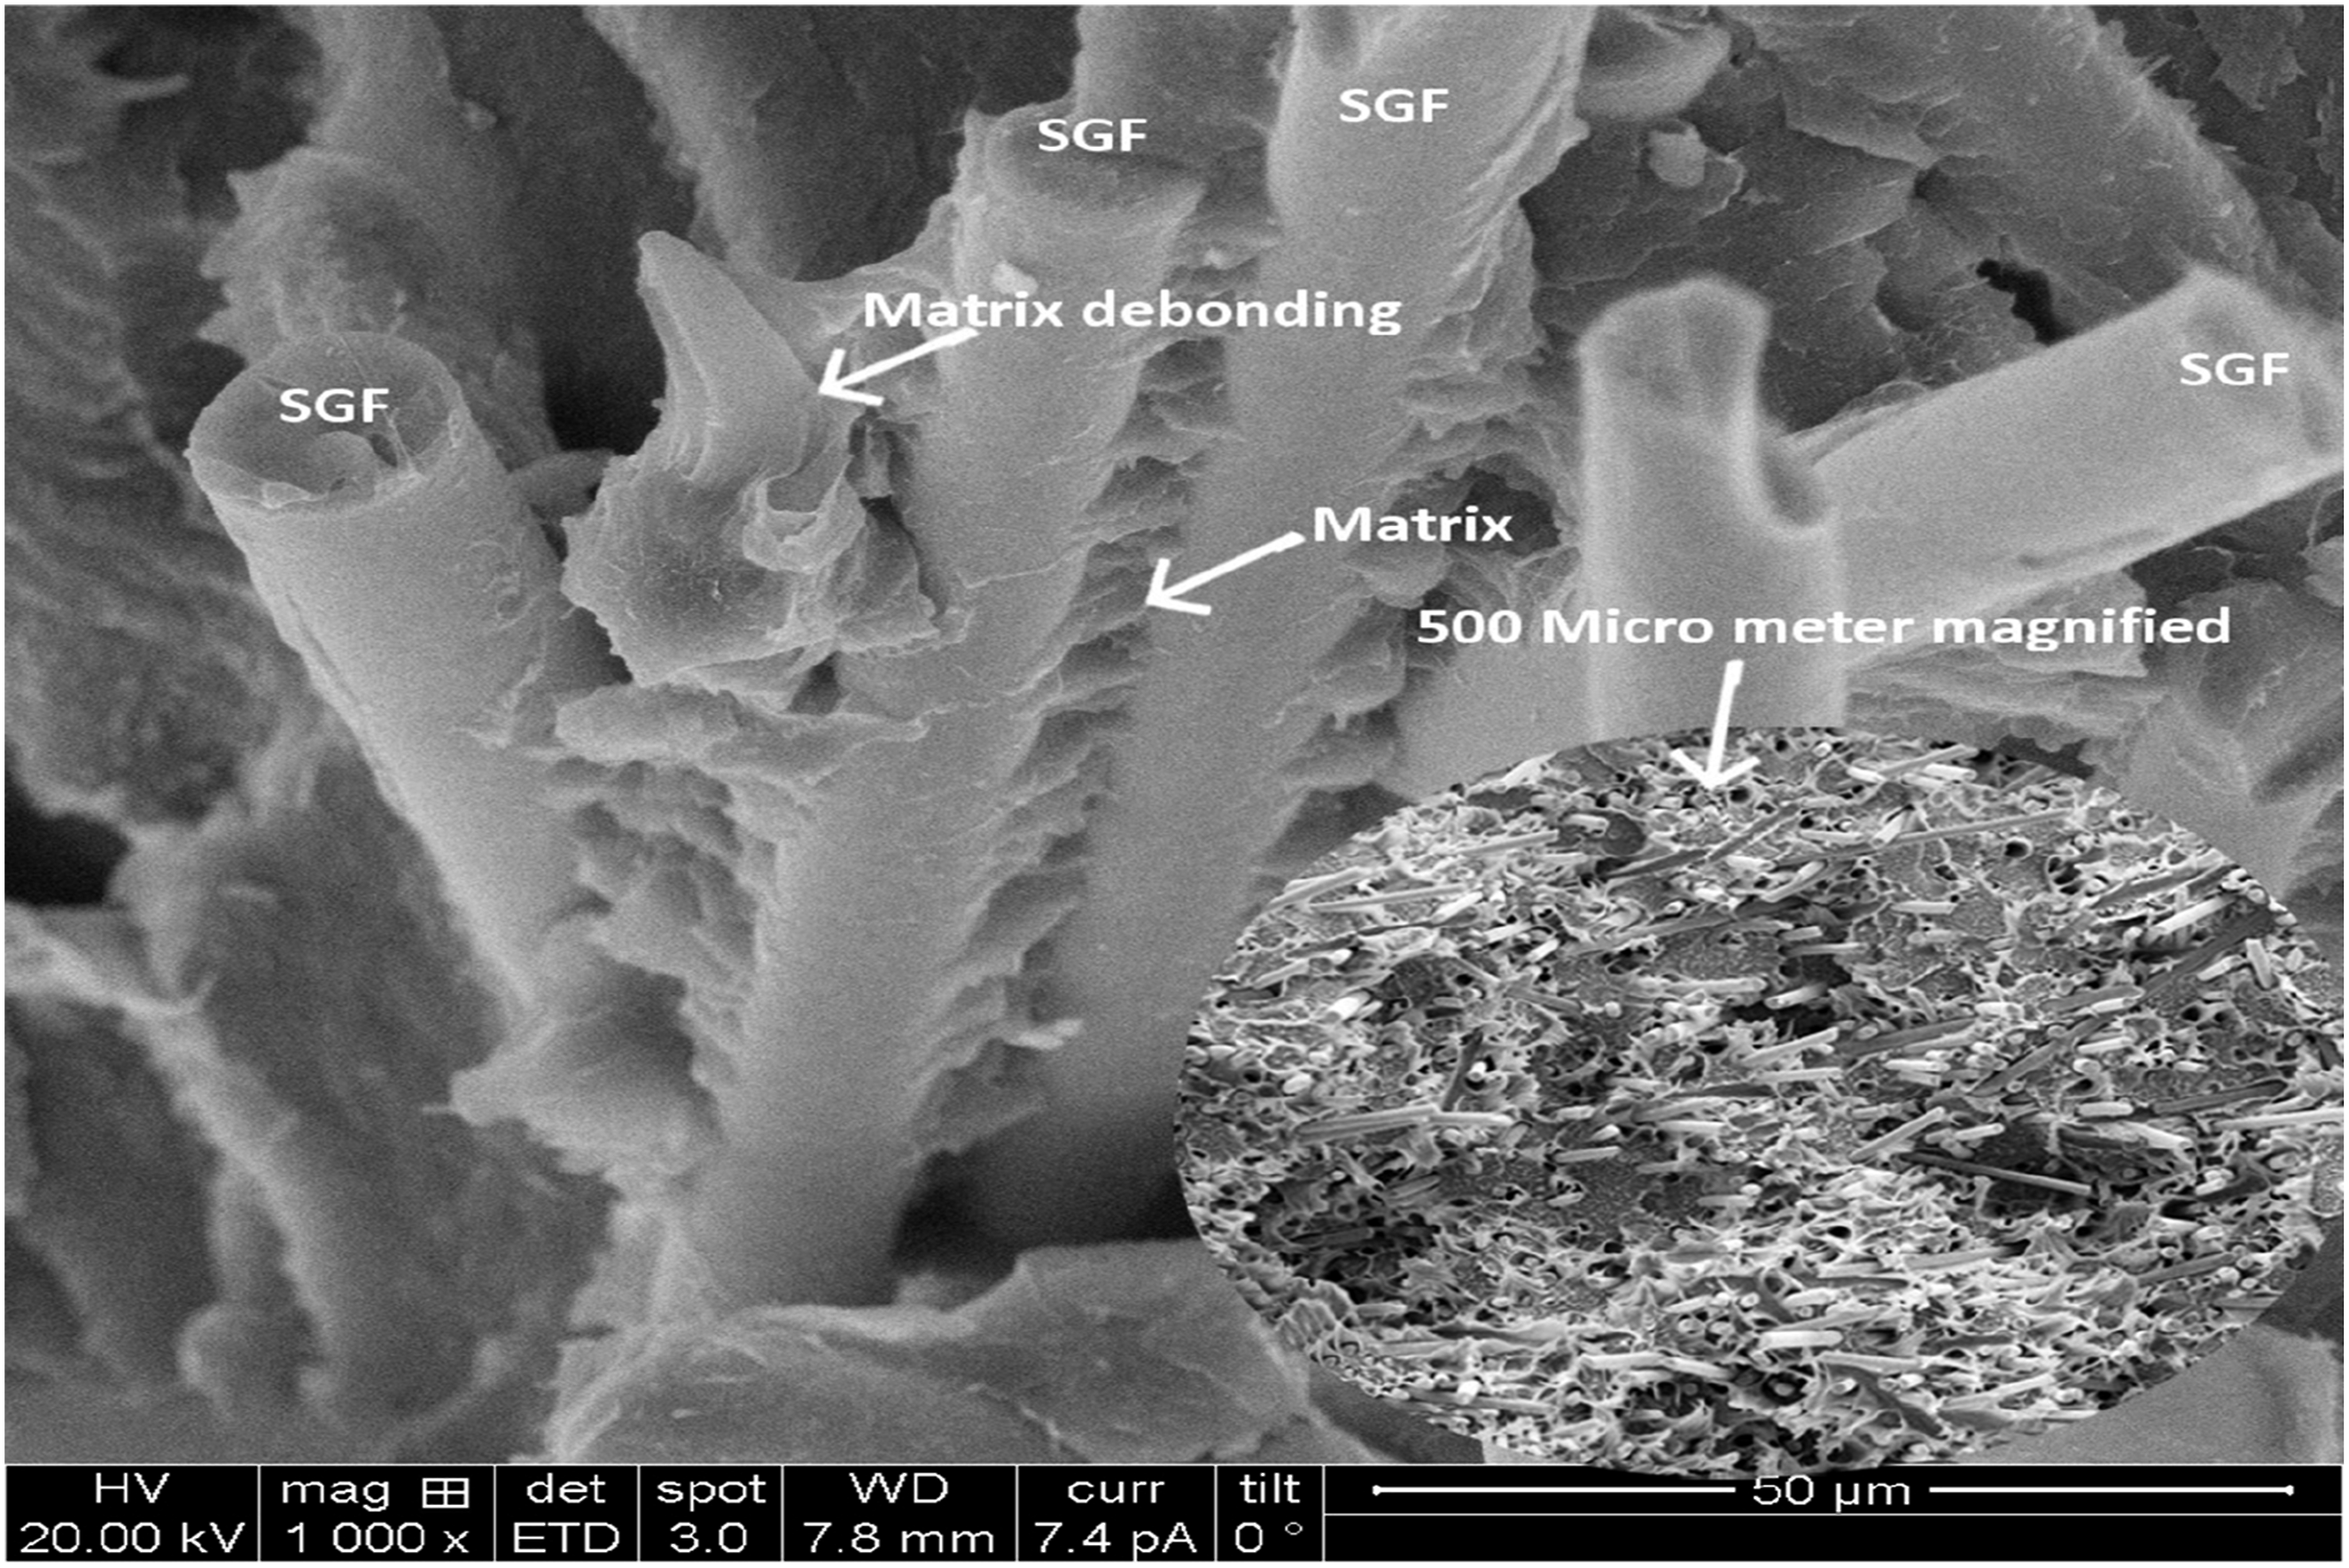
The fillers present in the composites acts as the stress receiver, leading to a low to moderate deflection. Vollenberg and Heikens 62 have discovered that the size of the particulate fillers influences the modulus while the polymer is firmly bound to them. Hence, the inclusion of PTFE and SiC in TCE + SGF has increased the modulus of TC35 (5881.82 MPa) which is highest in the study group.
Impact strength and hardness
The impact strength and hardness (Figure 17) are presented concurrently because they provide complementary insights into the toughness and surface resistance of the composites, respectively. Impact strength quantifies a material’s capacity to absorb energy under sudden impact, whereas hardness reflects its resistance to localized deformation. Generally, an increase in impact strength corresponds to enhanced ductility, whereas higher hardness is associated with improved wear resistance but may diminish toughness owing to increased brittleness. This correlation is evident in TC30 and TC35, where an increase in the SGF and PTFE content enhances the impact resistance but marginally reduces the hardness due to the improved energy absorption and elasticity. Impact strength and hardness of TCE and their hybrid composites.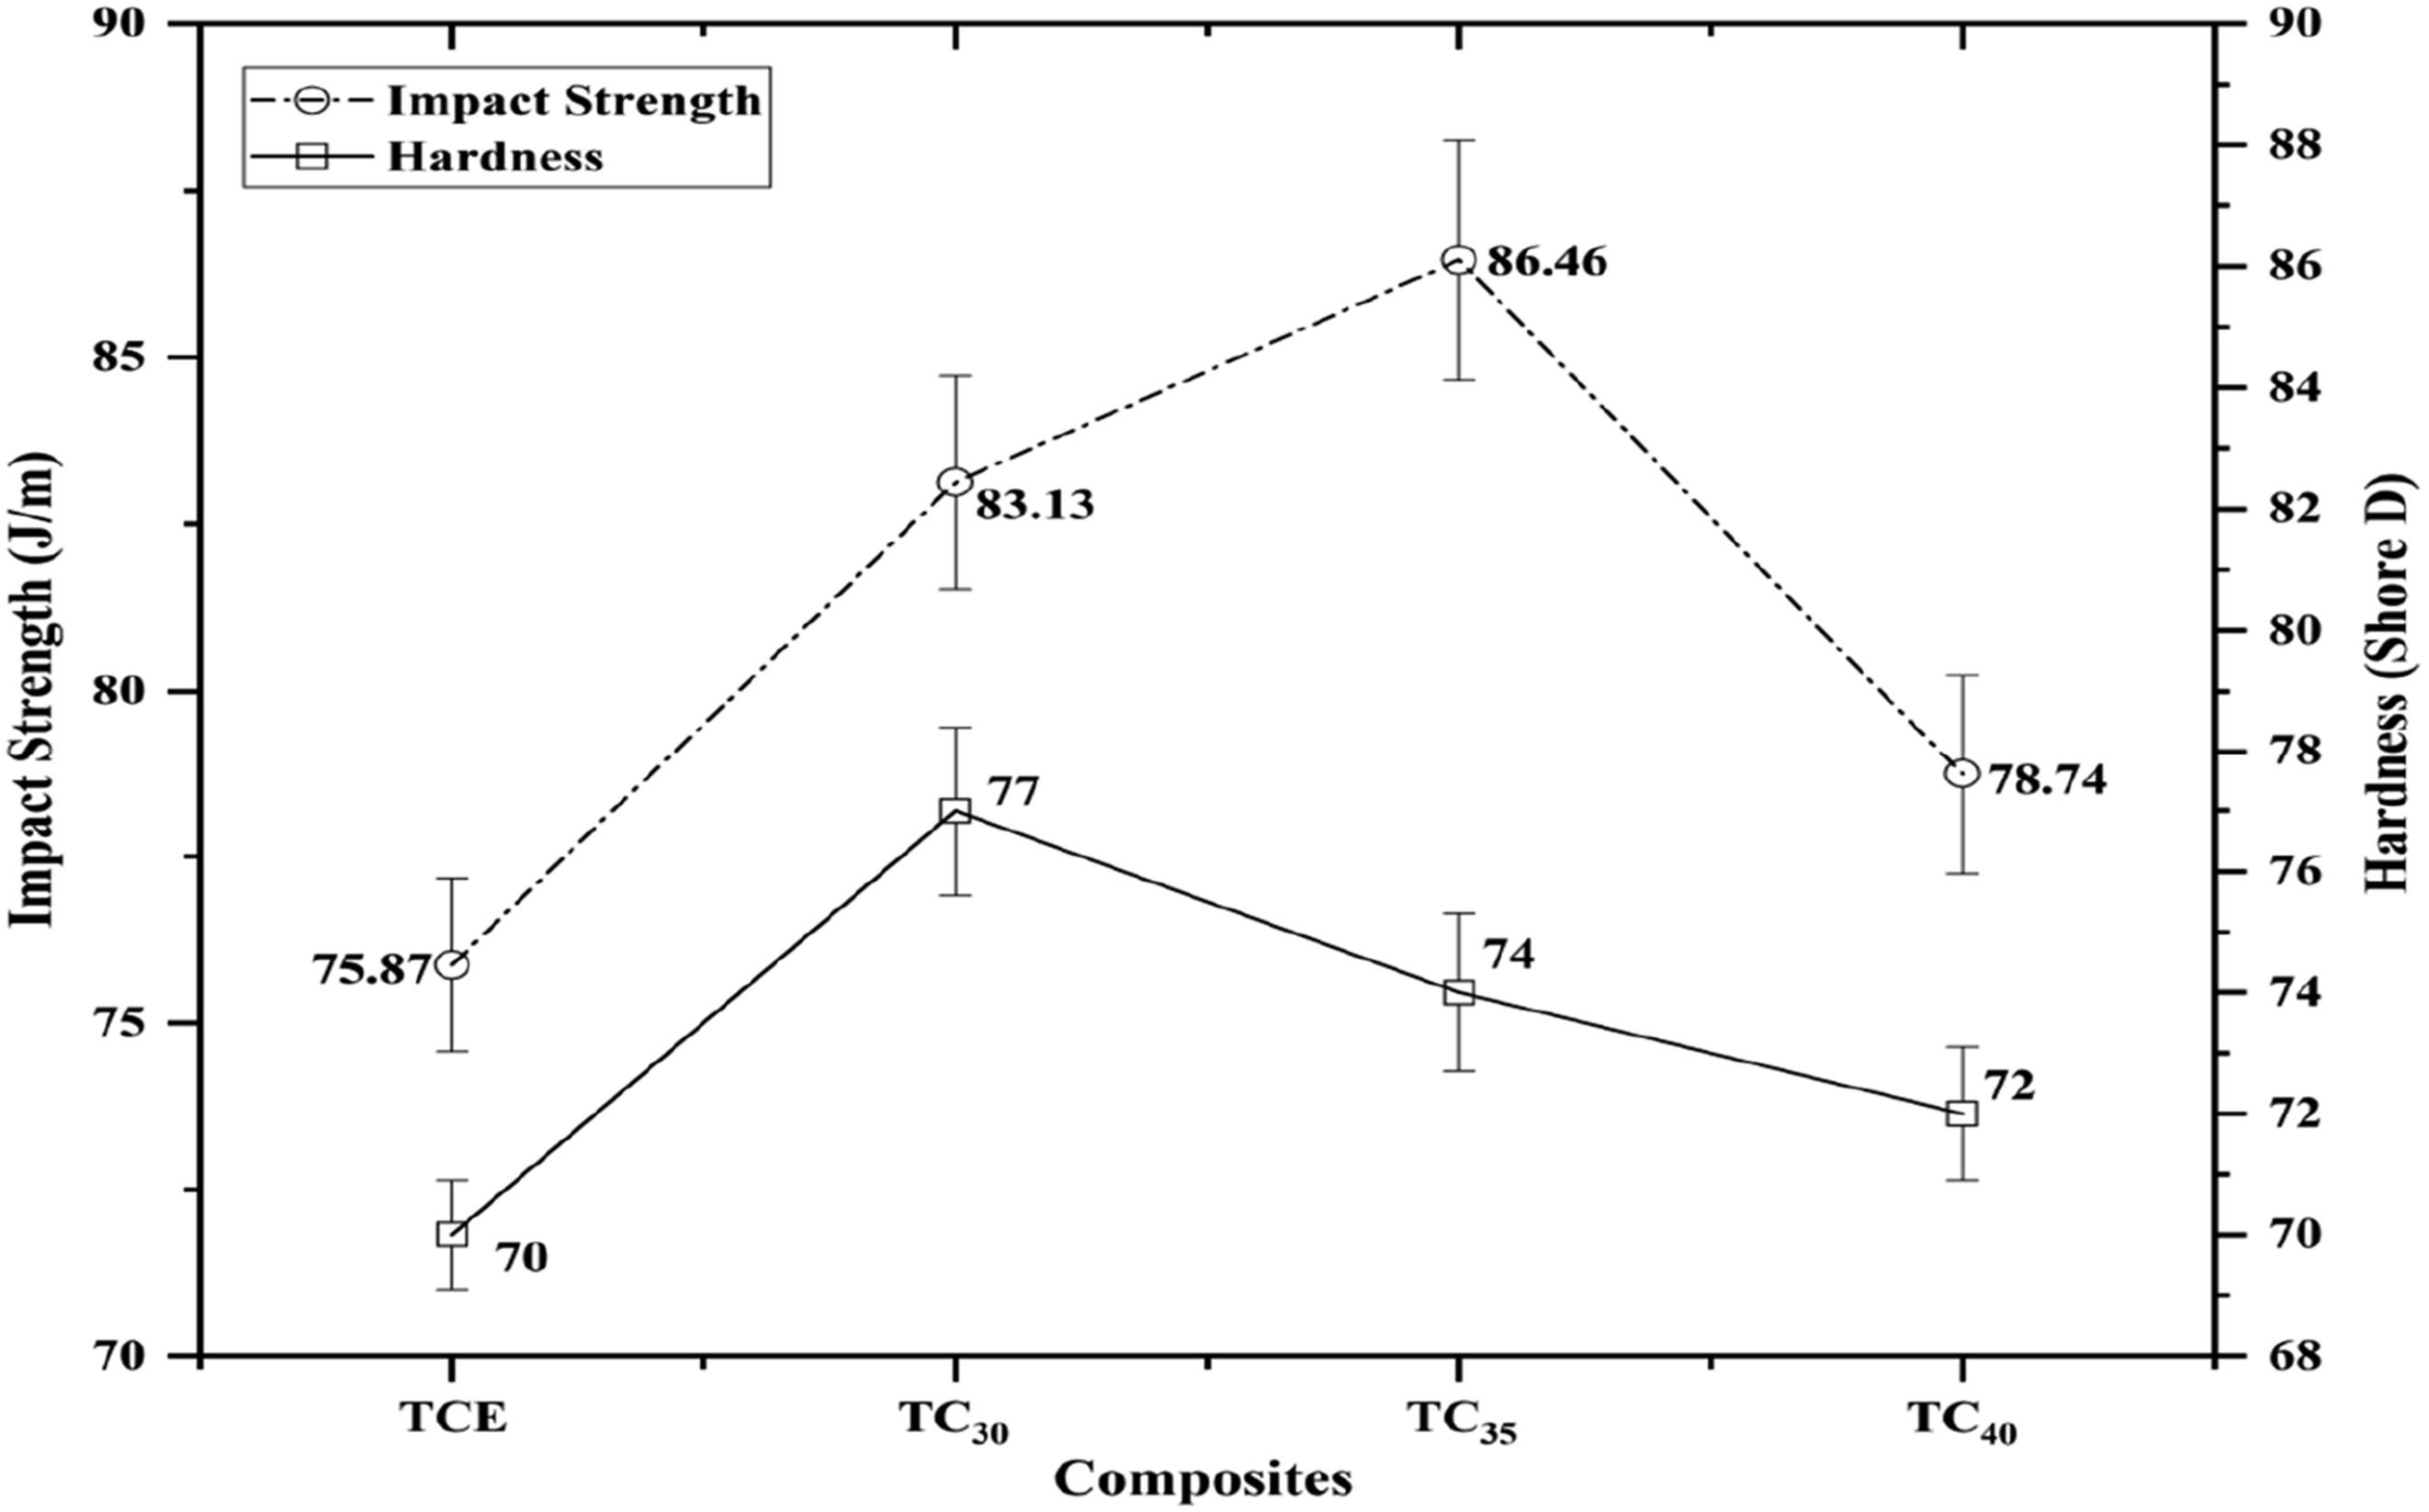
Conversely, in TC40, the addition of SiC increased the hardness but resulted in lower impact strength due to brittle fracture mechanisms. The fracture morphology of TC35 under impact loading, as shown in Figure 18, displays a rough and fragmented surface with significant matrix deformation and fiber pullout. The presence of shear lips, micro voids, and fibrillation indicates a higher energy absorption capacity, which is characteristic of composites subjected to high-strain-rate loading. The extensive fiber pullout and matrix shearing suggest that the impact failure is primarily governed by fiber debonding rather than direct fiber fracture. The formation of micro voids near the broken fibers indicates that the stress concentration sites facilitated crack propagation, leading to localized plastic deformation before complete failure. This behavior suggests that TC35 exhibits moderate impact resistance, and further improvements in the fiber-matrix interaction could enhance energy dissipation. Potential modifications comprise the surface modification of strands or the incorporation of toughening agents into the matrix to improve bonding and fracture resistance under impact loads. Microscopic image of TC35 fractured surface due to impact loading.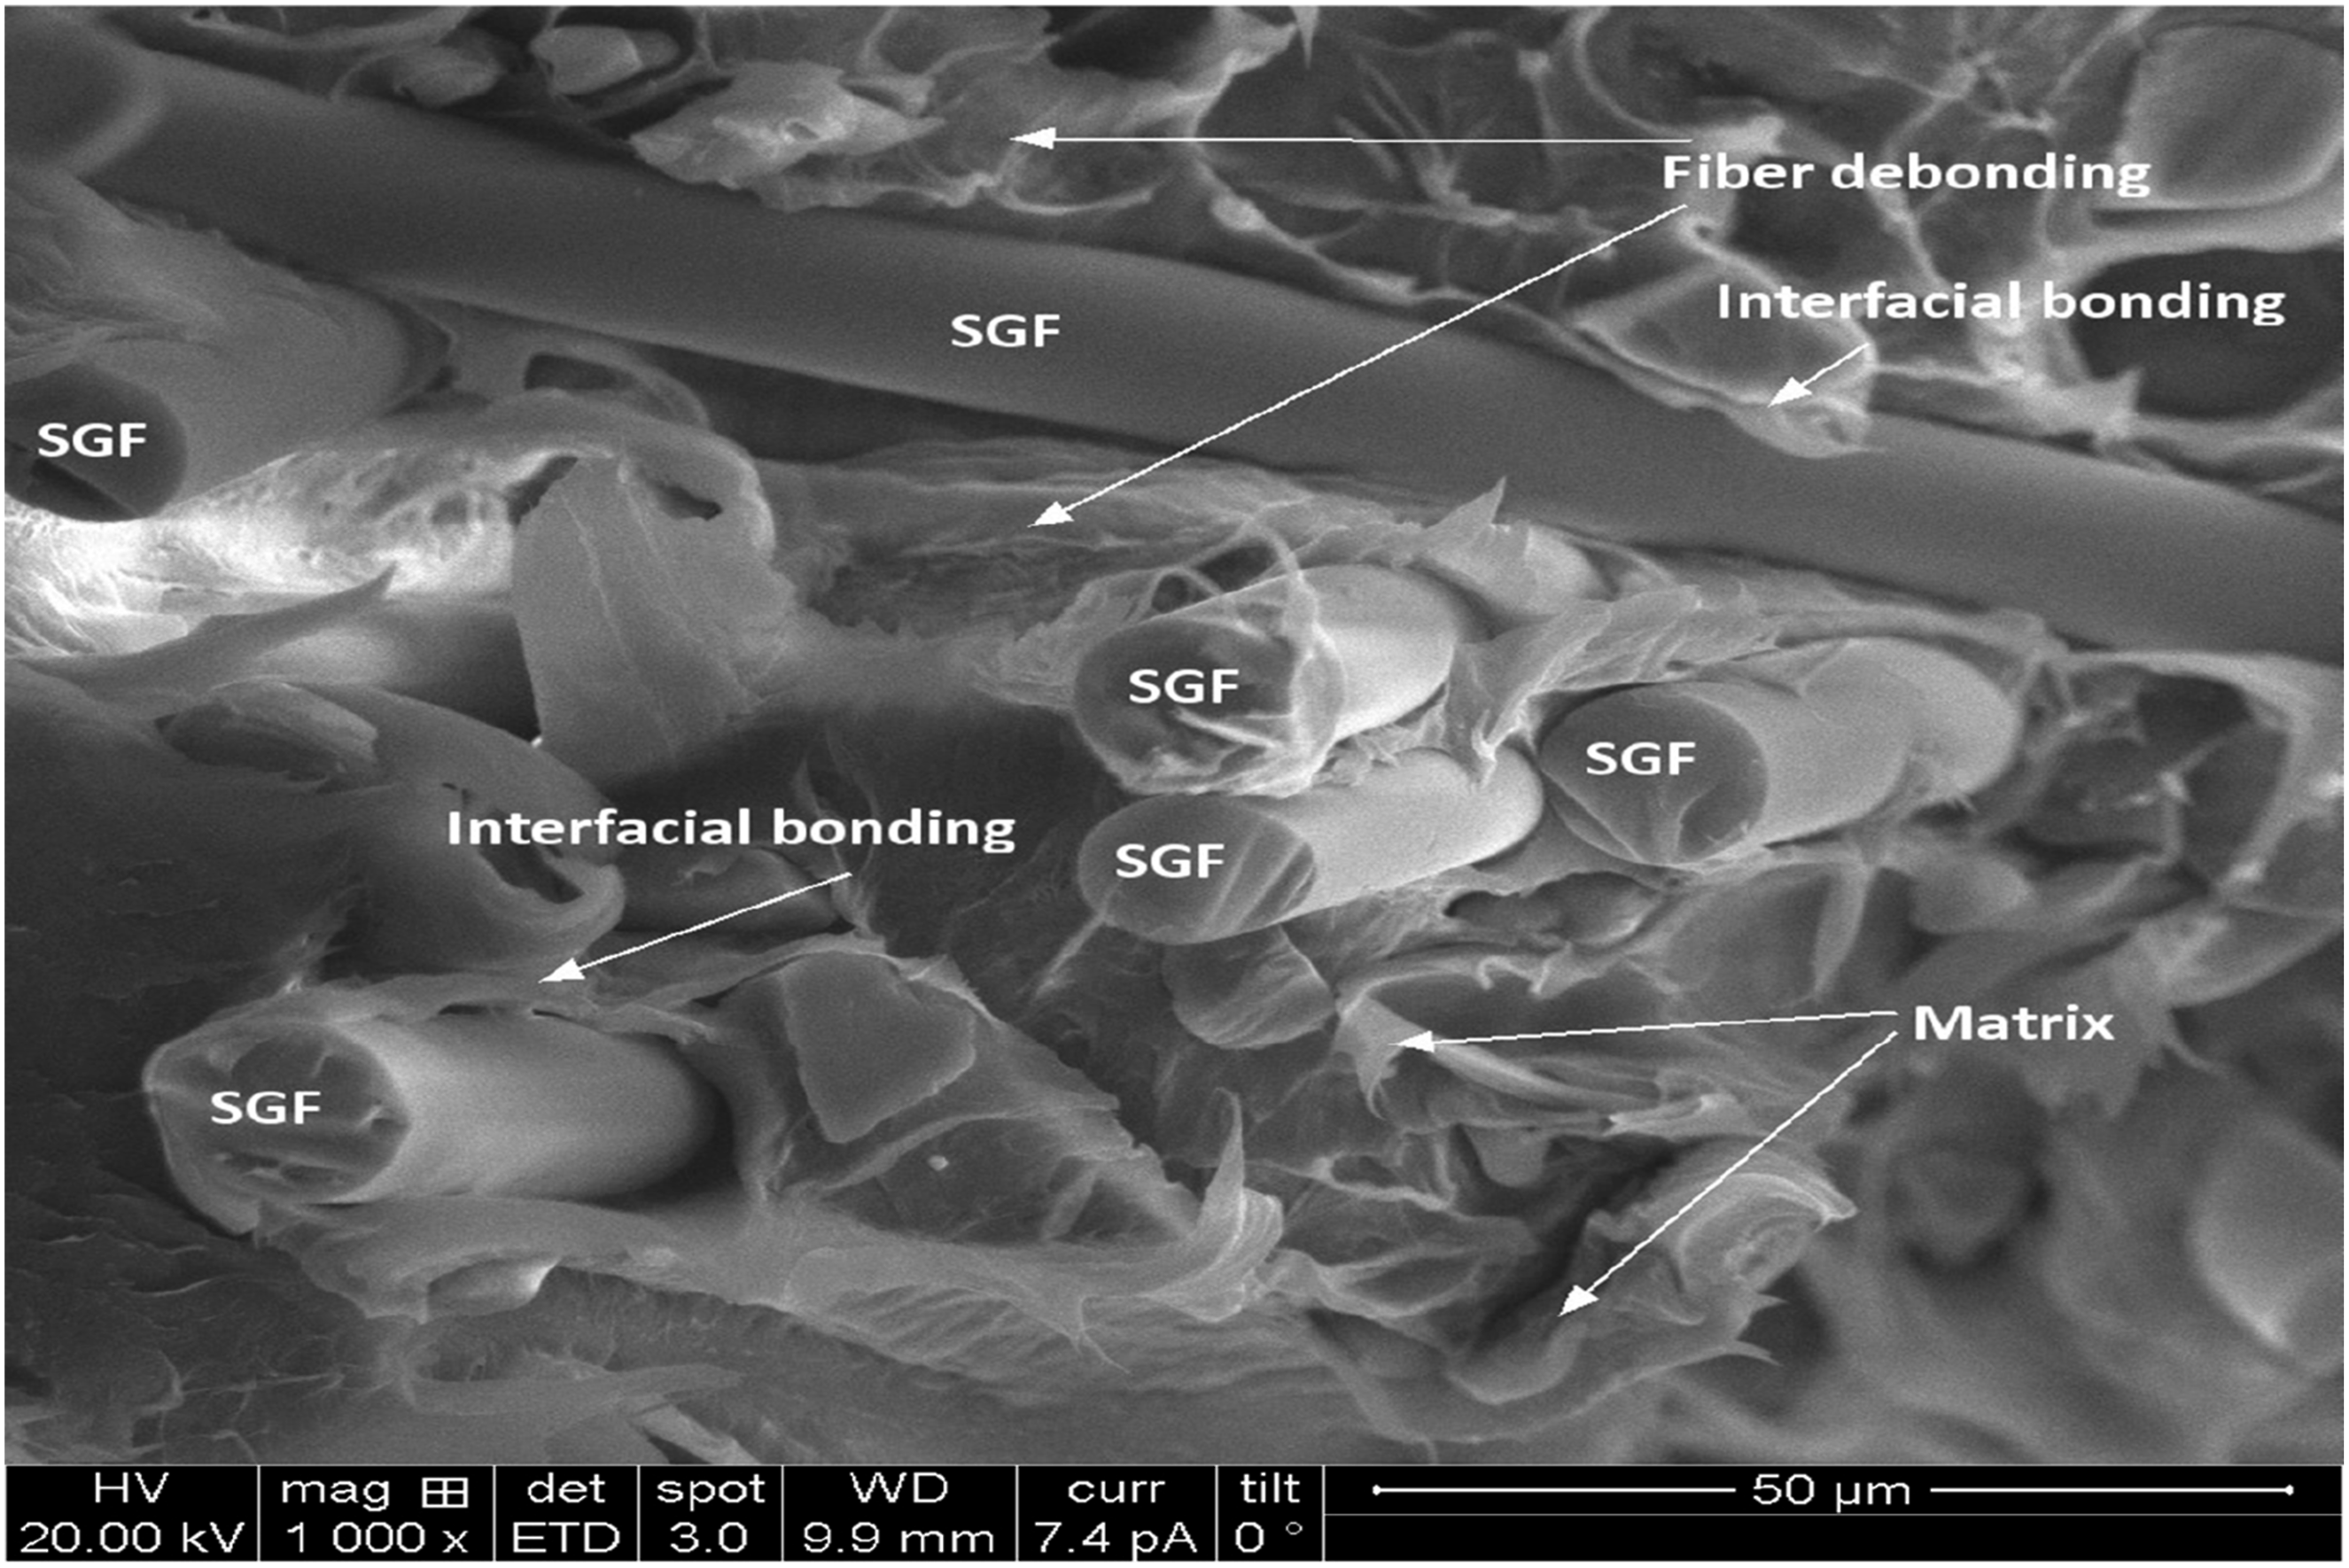
Principal component analysis on mechanical performance
Raw mechanical performance data matrix
Selected mechanical performances of TCE and their composites.
Data standardization (Z-Score normalization)
Presents the normalization values for the TCE composites.
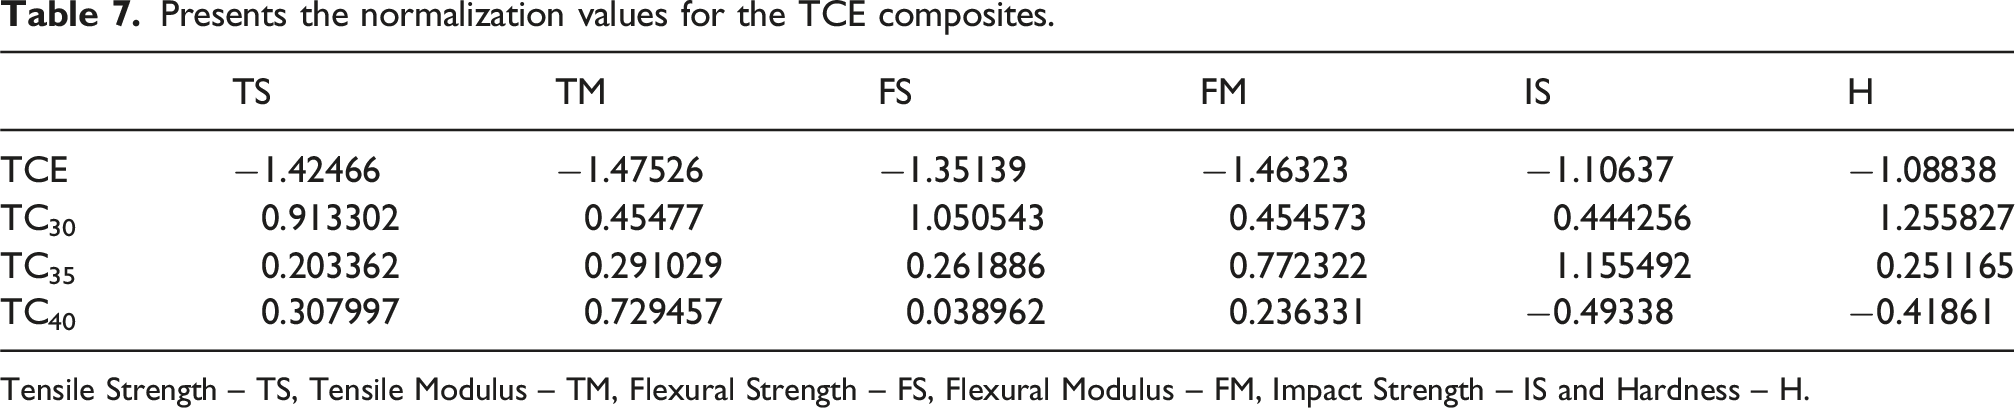
Tensile Strength – TS, Tensile Modulus – TM, Flexural Strength – FS, Flexural Modulus – FM, Impact Strength – IS and Hardness – H.
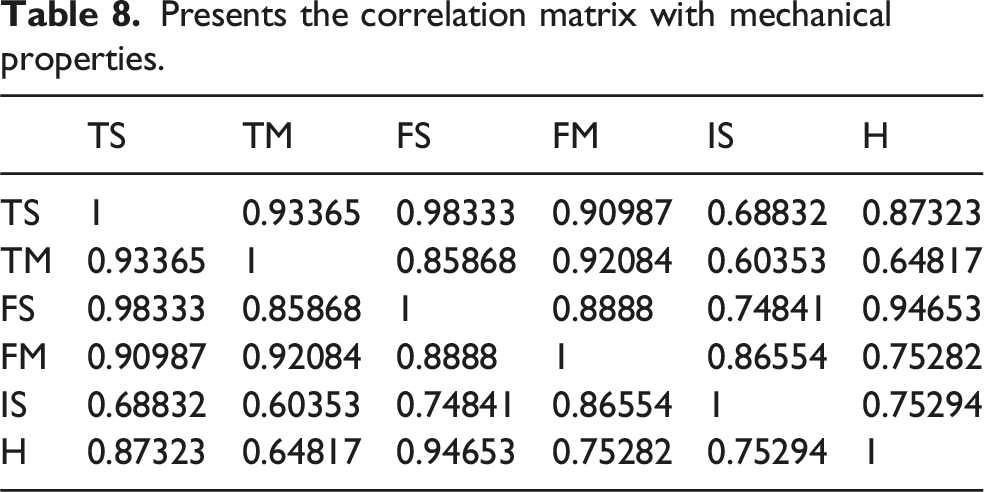
Correlation matrix
Eigenvector decomposition
Presents the coefficients of principal components.
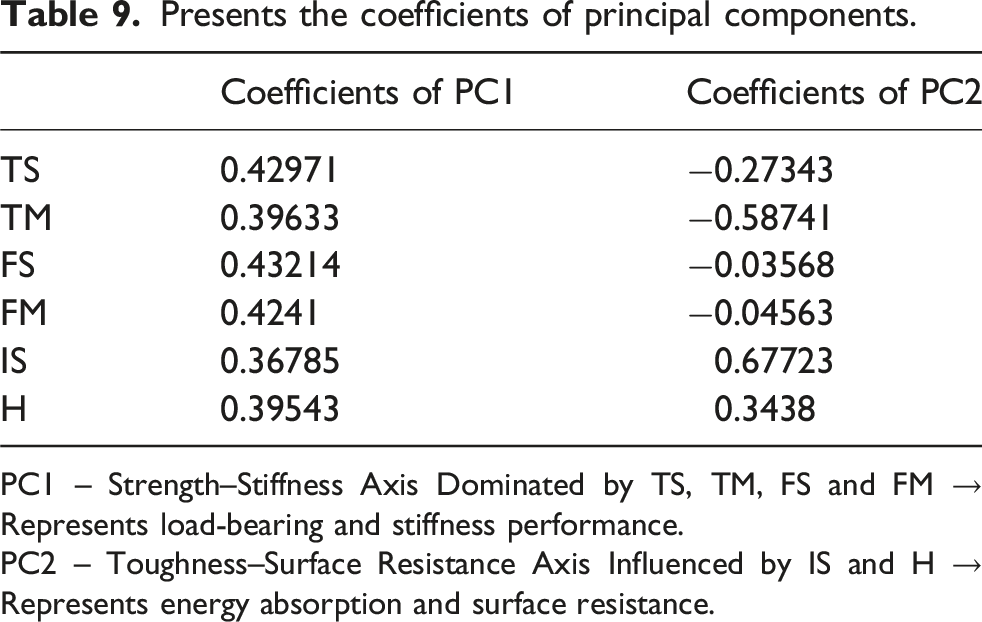
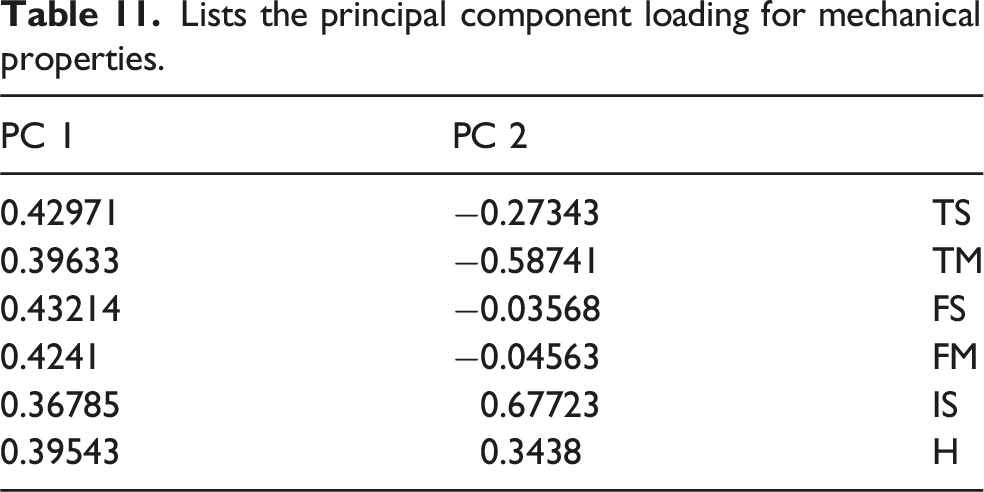
PC1 – Strength–Stiffness Axis Dominated by TS, TM, FS and FM → Represents load-bearing and stiffness performance.
PC2 – Toughness–Surface Resistance Axis Influenced by IS and H → Represents energy absorption and surface resistance.
Selection of principal components
Presents the eigen value for principal components.
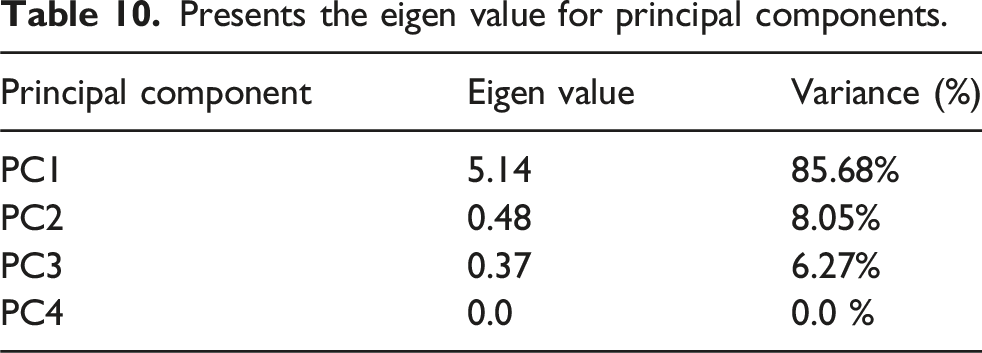
The eigenvalue spectrum from PCA (Figure 19) indicates that the first principal component (PC1) has an eigenvalue of 5.14, which contributes 85.68% of total variance, thereby suggesting that mechanical behavior for these composites is governed by a single dominant factor. This component is associated chiefly with strength and stiffness properties, thus revealing reinforcement to strongly influence the load-bearing responses of composites. Eigenvalue spectrum of principal components for mechanical properties.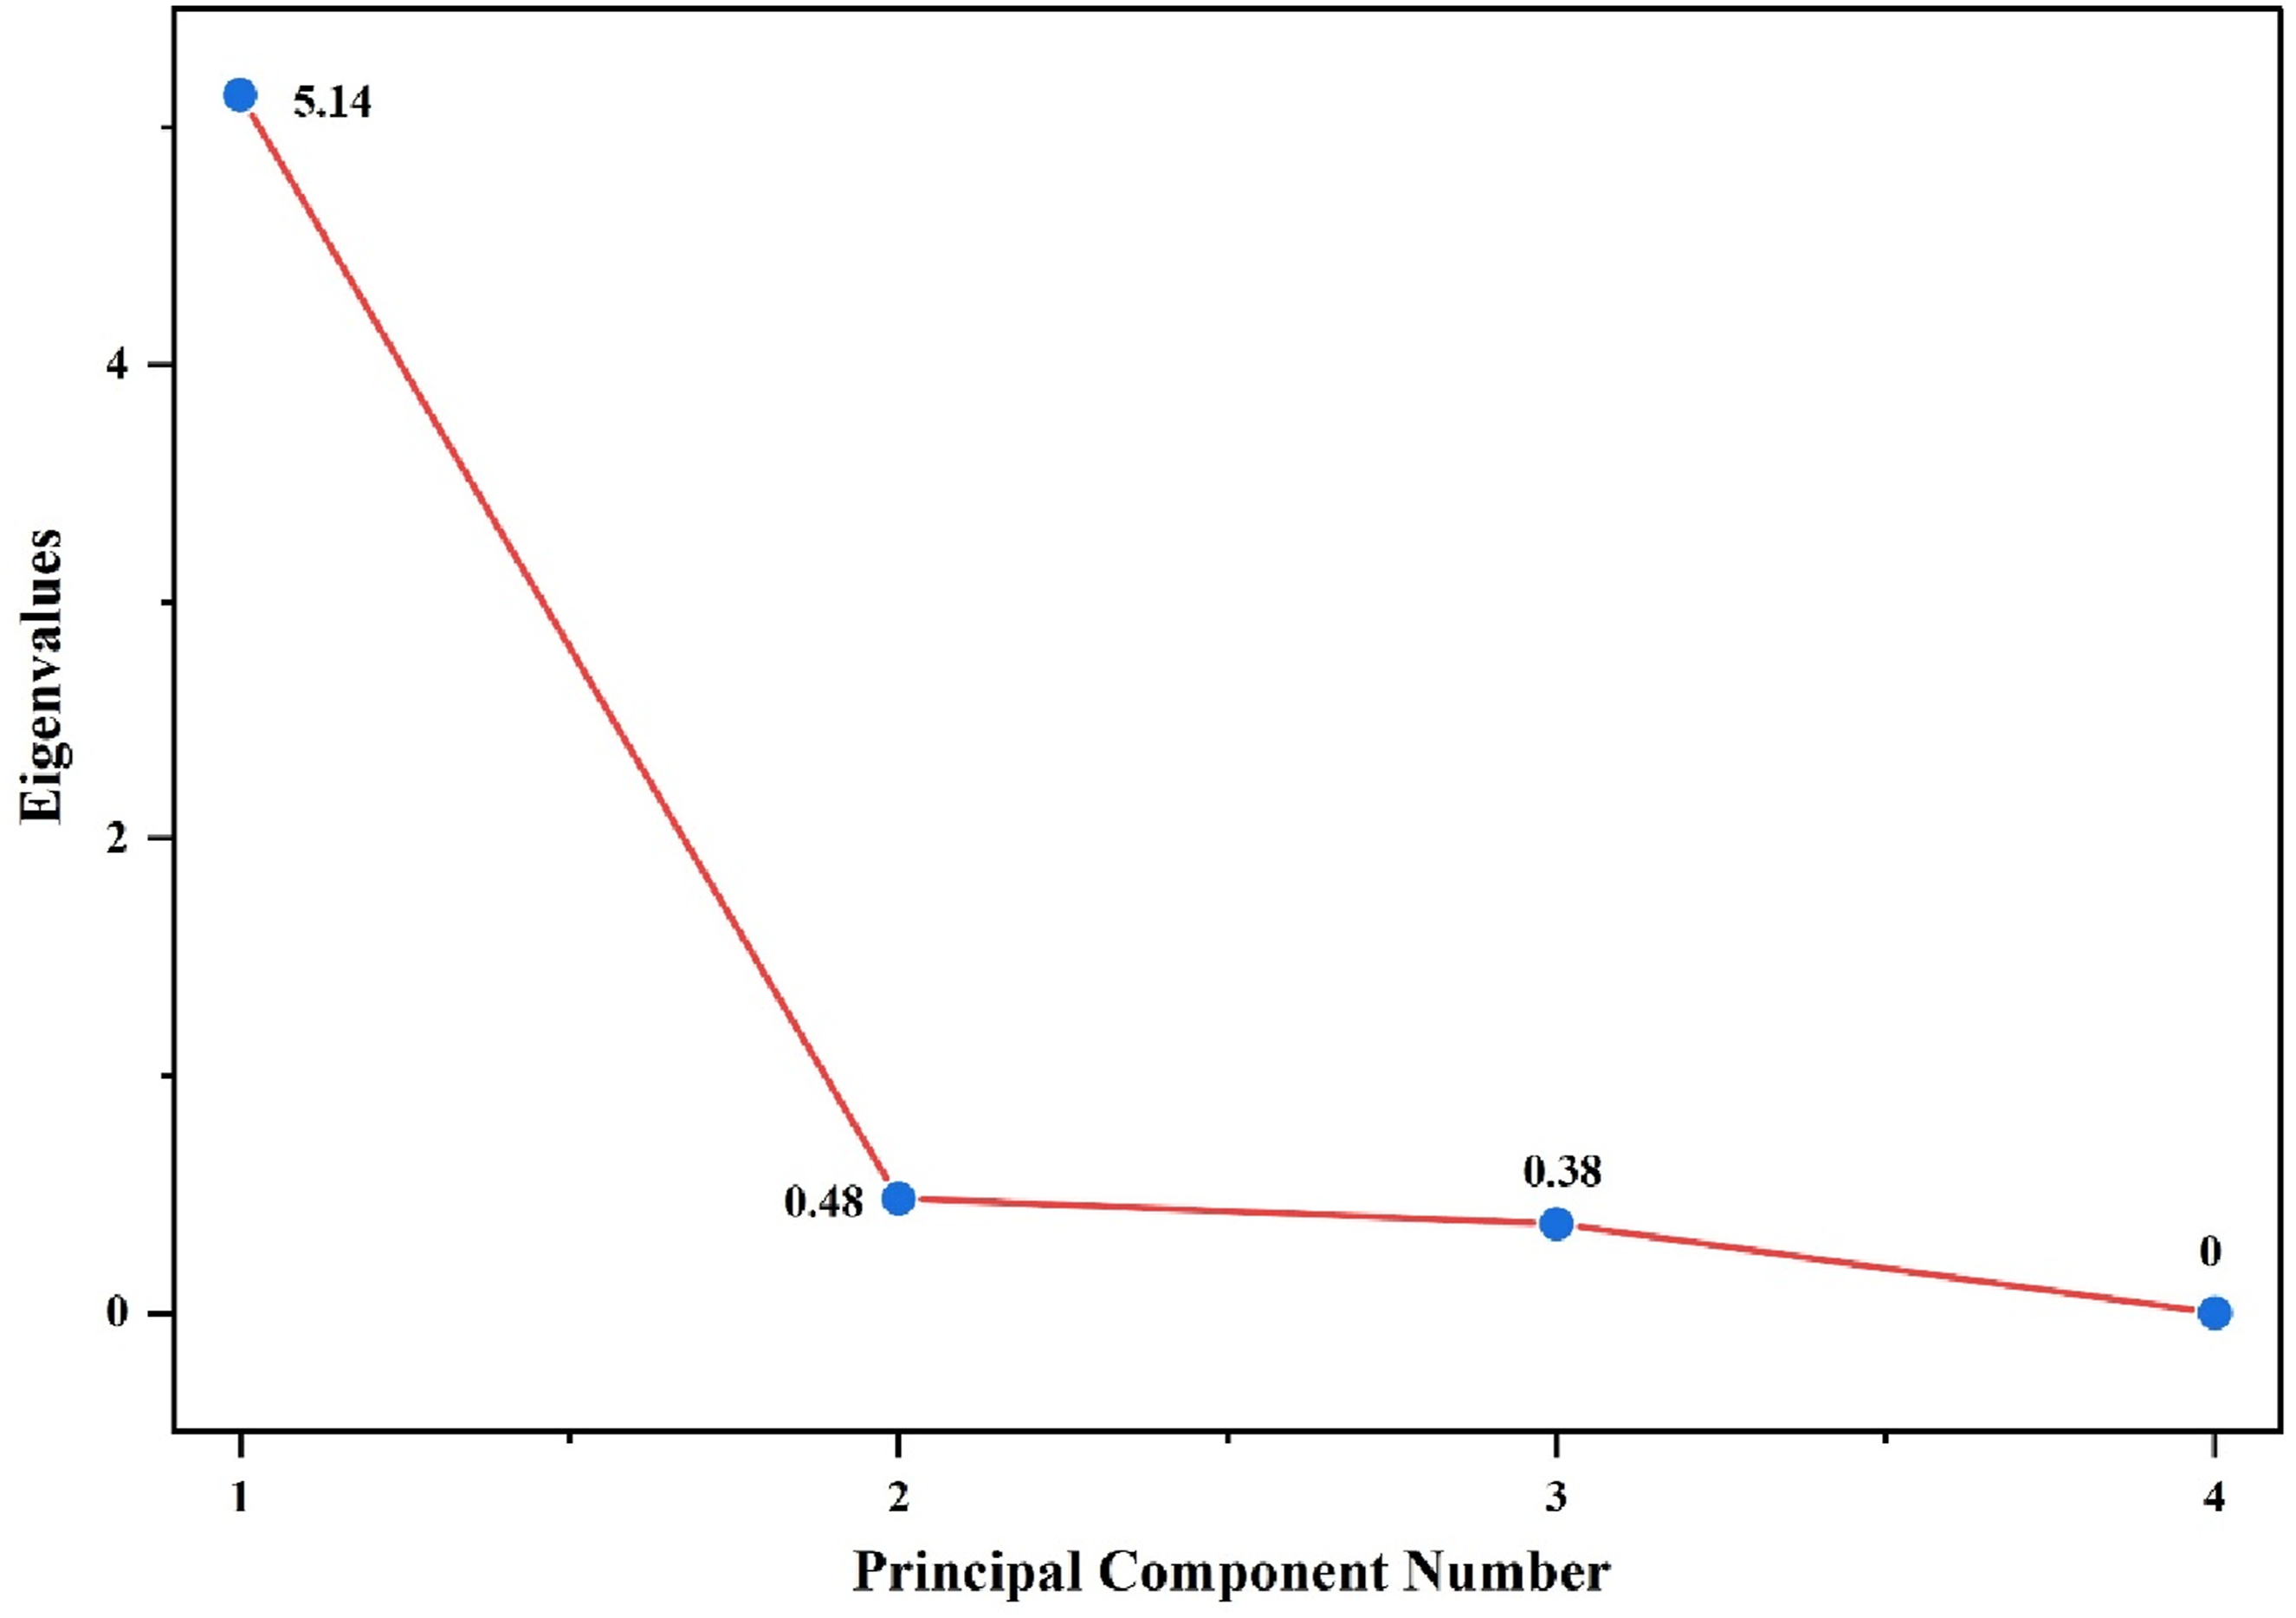
The second principal component, PC2, adds another 8.05% to the explained variance, bringing the cumulative explained variance to 93.73%. PC2 captures secondary variation associated with toughness and surface resistance, which involves some trade-offs not fully represented along PC1. The third principal component explains only 6.27% of the variance, while the higher-order components contribute negligibly to the explained variance.
Overall, the high cumulative variance captured by the first two principal components justifies the use of PCA two-dimensional representations when interpreting the mechanical performance of the composites and confirms that their behavior is primarily driven by a dominance of stiffness–strength with minor secondary effects.
Principal component loadings
The principal component loading values signify the position and relationship of the mechanical properties (as in Figure 20) and are deduced by equation (11). The values of principal component loading for mechanical properties are listed in Table 11. Pca biplot revealing strength–stiffness and toughness contributions in TCE composites. Lists the principal component loading for mechanical properties.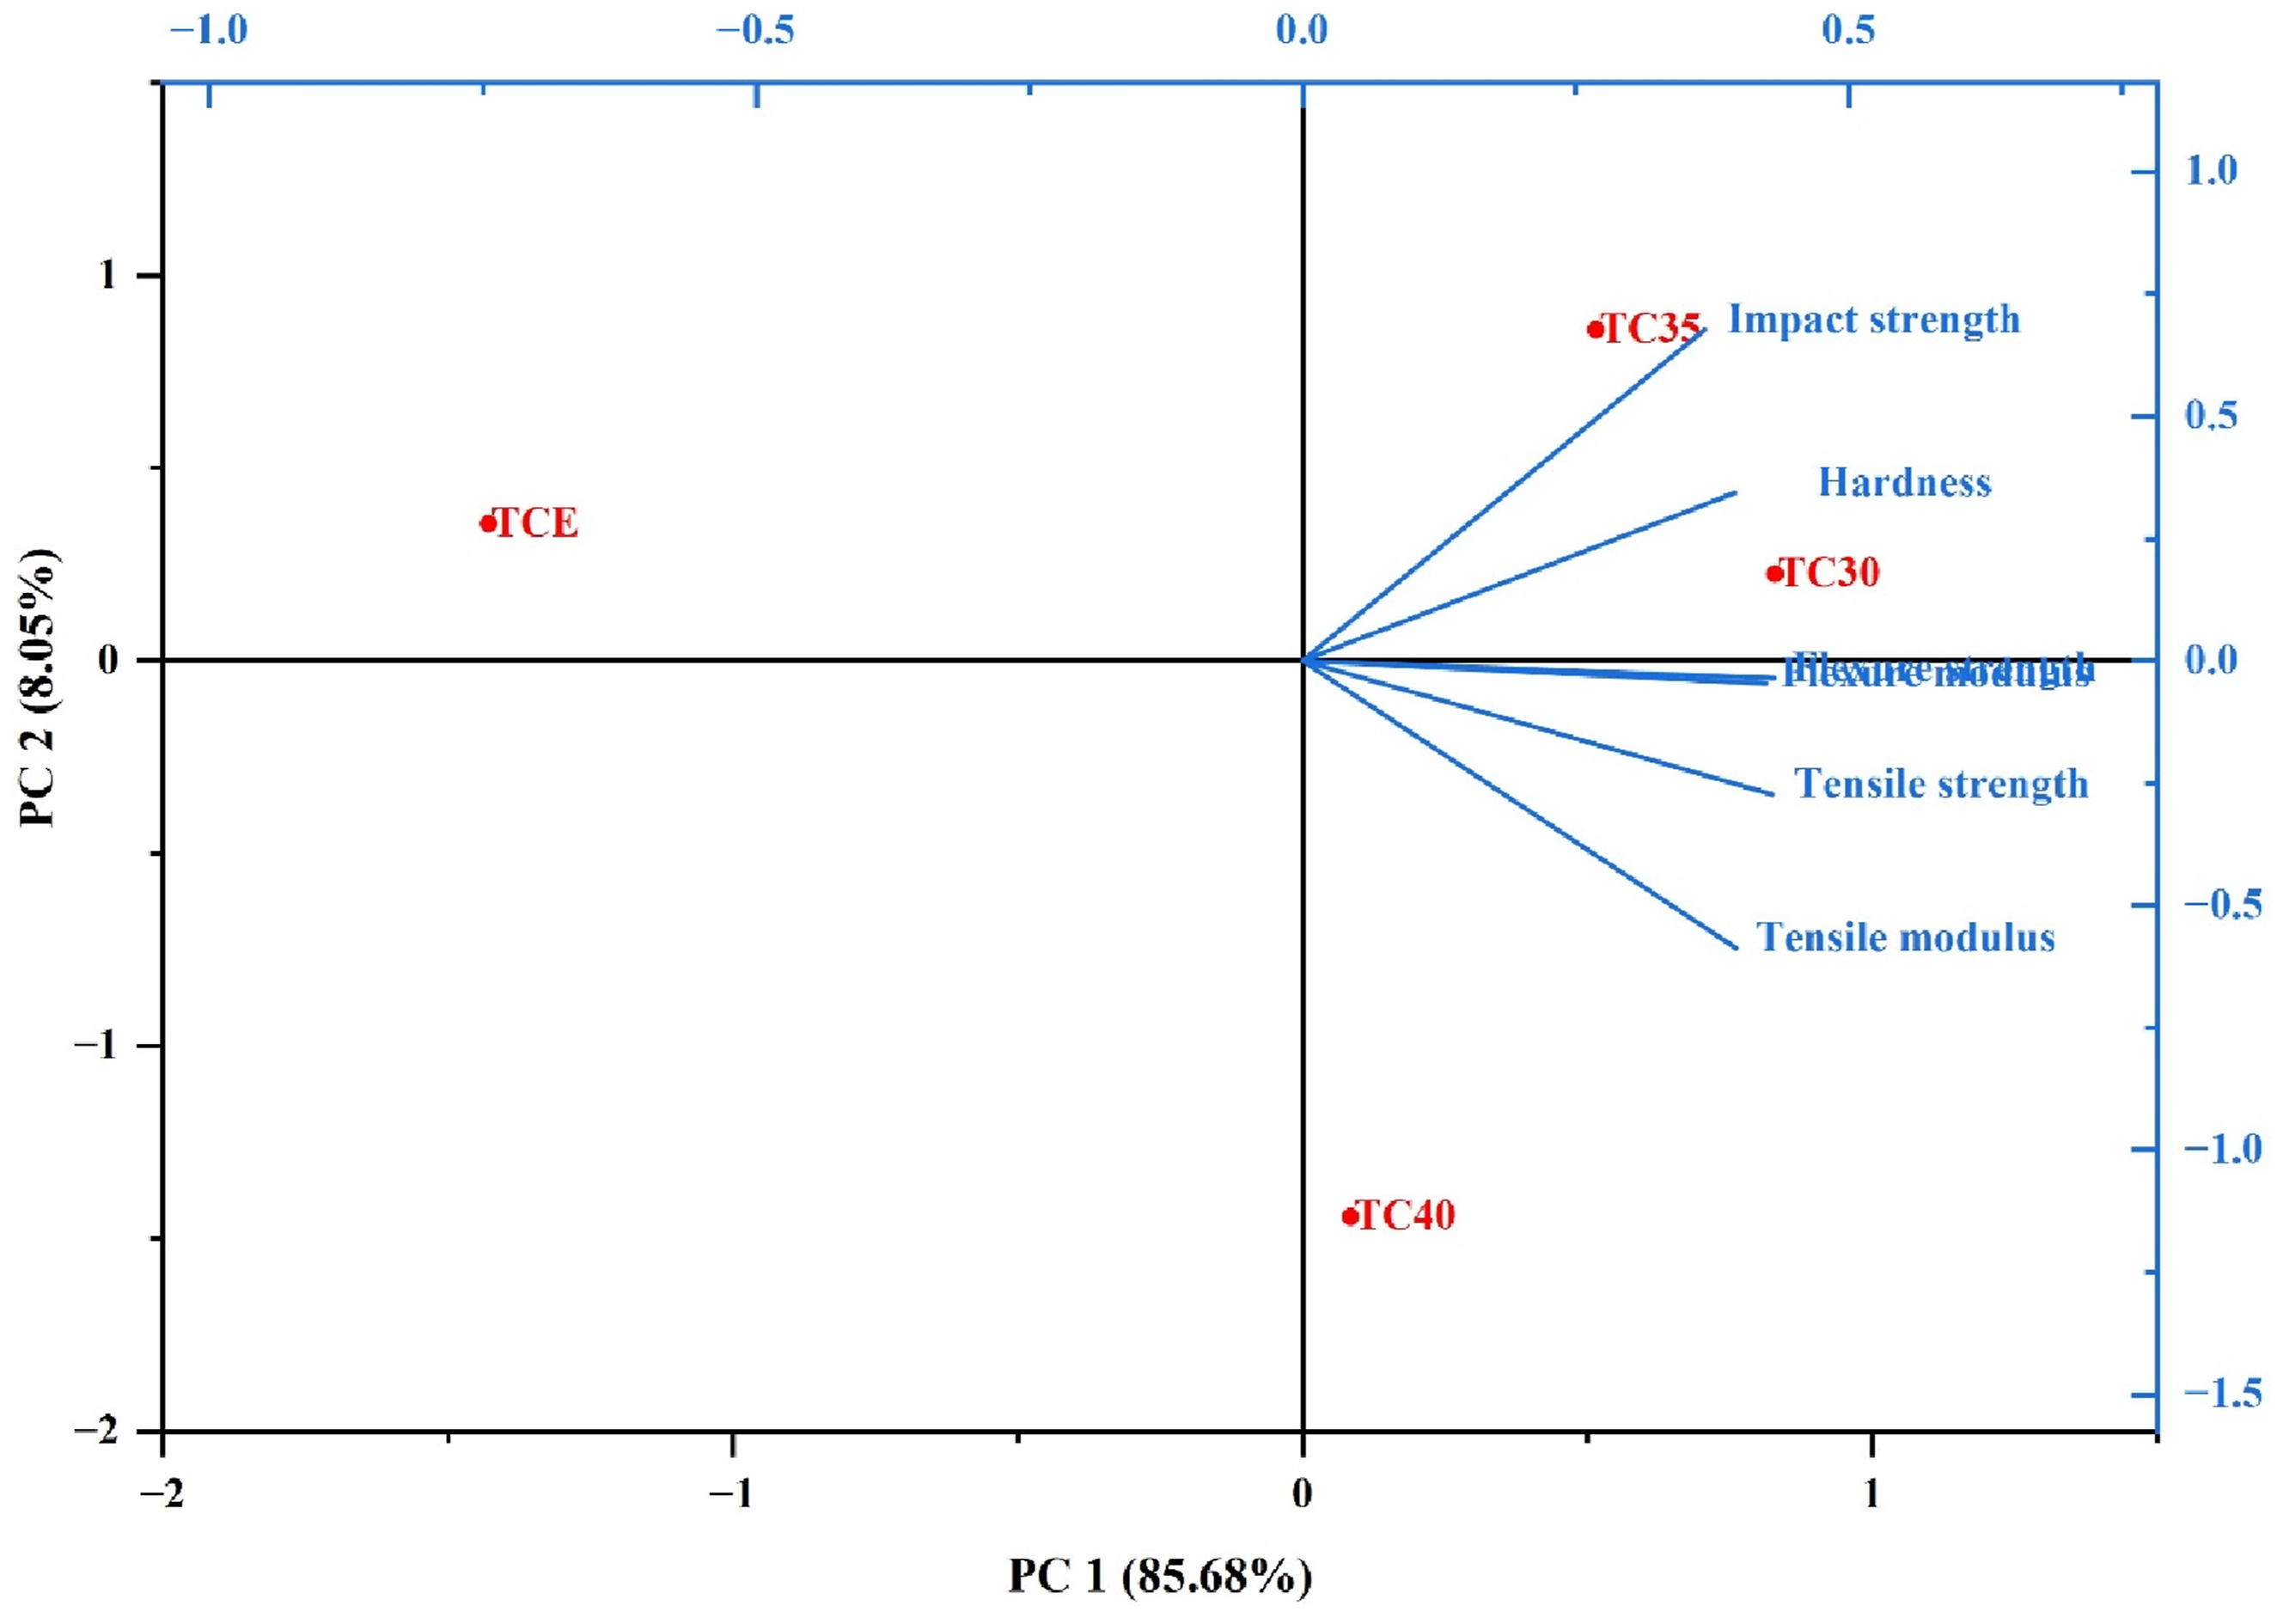
Principal component analysis scores
Presents the principal component analysis scores for TCE and their composites.
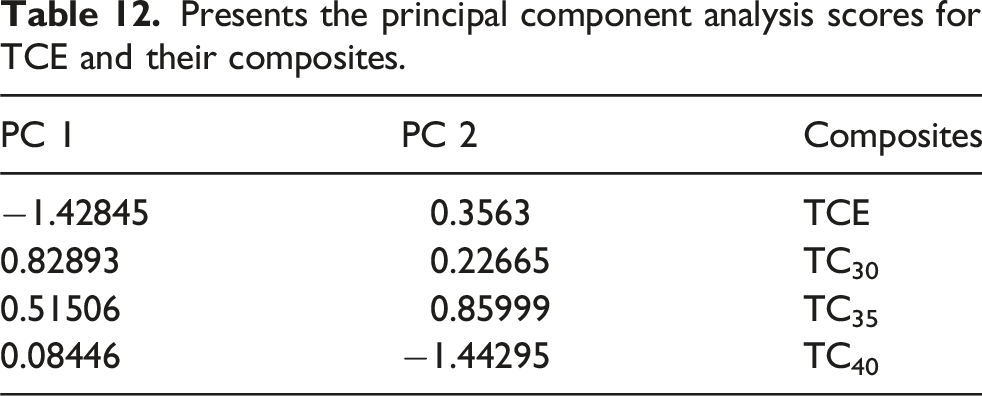
Figure 20, presents the PCA biplot of mechanical properties, illustrating the relationship between composite formulations (TCE, TC30, TC35, and TC40) and the contributing mechanical variables along the first two principal components. PC1 and PC2 explain 85.68% and 8.05% of the total variance, respectively, accounting for a cumulative variance of 93.73%, thereby enabling meaningful two-dimensional interpretation.
PC1 (strength–stiffness axis) is dominated by tensile strength, tensile modulus, flexural strength, and flexural modulus, as indicated by the closely aligned vectors along the positive PC1 direction. This confirms that PC1 represents the overall load-bearing and stiffness performance of the composites.
PC2 (toughness–surface hardness) is primarily influenced by impact strength and hardness, which are oriented along the positive PC2 direction. This component captures energy absorption capacity and resistance to localized deformation, representing toughness-related behavior.
Pristine TCE is located in the negative PC1 region, far from the stiffness and strength vectors, indicating its low mechanical strength and stiffness. Its proximity away from impact and hardness vectors reflects the comparatively inferior mechanical performance of the unreinforced matrix.
TC30 lies in the positive PC1 region near the tensile and flexural vectors, demonstrating optimal stress transfer with enhanced stiffness and strength due to effective SGF reinforcement. Its moderate position along PC2 indicates a balanced combination of stiffness and toughness, corroborating tensile and flexural test results.
TC35 is positioned in the upper-right quadrant, near to the impact strength vector, indicating enhanced energy absorption and toughness. This behavior is attributed to the presence of PTFE, which promotes ductility and energy dissipation while maintaining reasonable stiffness.
TC40 appears in the lower-right quadrant, characterized by high PC1 but negative PC2 values. This positioning indicates high stiffness dominance accompanied by reduced toughness, consistent with excessive filler content leading to restricted polymer chain mobility, increased brittleness, and reduced impact resistance.
The biplot also reveals strong correlations between: • Tensile and flexural properties, as evidenced by the small angles between their vectors. • Impact strength and hardness, which are largely orthogonal to stiffness-related vectors, indicating that toughness is largely independent of stiffness in these composites.
The above biplot clearly visualizes the stiffness–toughness trade-off in TCE and their composites. TC30 emerges as the mechanically optimal composition with balanced strength and toughness, TC35 favors impact resistance and ductility, and TC40 prioritizes stiffness at the expense of toughness, while pristine TCE exhibits inferior mechanical performance.
Conclusion
• The thermo-mechanical performance of TCE composites supplemented with dual fillers (SiC and PTFE) and short glass fiber (SGF) was thoroughly assessed in this work. The following are the main conclusions: • Hybrid SGF–PTFE–SiC fillers synergistically improved the thermal stability and crystallization behavior of TCE, demonstrating its suitability for high-temperature structural applications. • Consistent filler distribution is critical for mechanical performance, as 2–3% porosity from filler agglomeration and voids can influence density uniformity and stress transfer. • The incorporation of SGF and hybrid fillers significantly enhanced the thermo-mechanical properties of TCE, with up to a 109% increase in storage modulus and a 58% increase in loss modulus, alongside reduced damping. • Synergistic reinforcement markedly improved tensile, elastic modulus, and impact strength, achieving up to a six-fold increase in stiffness, confirming the effectiveness of hybrid fillers for high-performance structural composites. The PCA biplot captures the growth of mechanical performance in TCE composites, emphasizing a shift from a compliant, low-strength matrix to stiffness- and toughness-tailored composite systems with an increase in reinforcement content. • Fractographic analysis revealed that improved fiber-matrix adhesion and reduced voids in SGF and hybrid-filled composites enhanced stress transfer, contributing to superior mechanical performance.
Footnotes
Acknowledgments
The authors thank Manipal Institute of Technology, Manipal Academy of Higher Education for the support and encouragement to carry out this research.
Authors’ contributions
Funding
The authors received no financial support for the research, authorship, and/or publication of this article.
Declaration of conflicting interests
The authors declared no potential conflicts of interest with respect to the research, authorship, and/or publication of this article.
Data Availability Statement
The data that support the findings of this study are available from the corresponding authors upon reasonable request.