
Abstract
The Fair Labor Standards Act’s minimum wage laws provide important protections for workers. However, it still permits employers to pay subminimum wages to youth under age 20, student-vocational learners, full-time students, individuals with disabilities, and tipped workers. This has important economic consequences, especially for economically vulnerable workers in the low-wage sector. Using 2009–2019 Current Population Survey–Merged Outgoing Rotation Group (CPS-MORG) data (n = 502,976), we find that 3.7 percent (about 1,565,805) of hourly workers were paid subminimum wages based on state minimum wage laws, and subminimum wages were associated with increases in family poverty by 1.4 percentage points. Importantly, the relationship between subminimum wages and poverty differed across workers with particularly telling results for disability. Unlike for youth and students for whom access to subminimum wage labor was associated with decreased family poverty, subminimum wage work compounded already high poverty rates for hourly workers with disabilities. Within a broader context of low-wage work, this research speaks to the impacts of subminimum pay on economic insecurity and poverty—an ongoing social problem disproportionately affecting people with disabilities.
Introduction
Minimum wage laws offer workers protection from extreme exploitation in the workplace. The landmark Fair Labor Standards Act (FLSA) provided workers with the first minimum wage of 25 cents per hour in 1938 (or $4.51 in 2019 dollars). Although the federal minimum wage has declined in the United States since its peak in 1968 ($11.58 in 2019 dollars), mobilizing efforts raised its value to $7.25 in 2009. Several states have since implemented higher minimum wages. This is important because living on the minimum wage is nearly impossible (Edin and Shaefer 2016; Ehrenreich 2001). A wage of $7.25 per hour amounts to approximately $15,080 per year for a full-time worker, barely above the poverty threshold (U.S. Office of the Assistant Secretary for Planning and Evaluation 2022). Rarely is this enough to survive without additional assistance. Yet, many workers earn wages below these official levels—a fully legal practice for specific groups of workers.
The FLSA currently provides exemptions to employers that permit them to pay subminimum wages to five groups of workers—youth under age 20, student-vocational learners, full-time students, individuals with disabilities, and tipped workers 1 (Bradley 2017). Varying rationales have been used to support the assignment of subminimum wages to different groups across settings. In the case of students and youth, paying regular wages, even low wages, is thought to increase school attrition (Kelly and McGuinness 2017; Organisation for Economic Co-operation and Development [OECD] 2015). For tipped workers, policies dating back to the late-1960s accounted for a “tip credit” to discount the minimum wage assuming that tipped workers were earning more than the minimum wage (Allegretto and Cooper 2014).
Similar attitudes and practices have been used to justify paying subminimum wages to workers with disabilities, a practice sanctioned by a policy system nearly as old as the modern American welfare state (Pettinicchio 2019; Scotch 2001). Workers with disabilities have also been historically segregated into “sheltered workshops” or “work centers” that receive U.S. Department of Labor (DOL) Section 14(c) certificates permitting them to pay subminimum wages (May-Simera 2018; Whittaker 2005). In many contexts, policies continue to allow, if not encourage, below-minimum wages, resting on the assumption that people with disabilities are less productive members of society. Although the demand for subminimum wage workers under the waiver program is declining (DOL 2021), subminimum wages are still common in the low-wage sector independent of waivers (Fine et al. 2021).
As is the case for many people of color, women, and immigrants, disabled workers earn subminimum wages partly because they are clustered in low-wage sector jobs (Maroto and Pettinicchio 2014b)—typically precarious and non-unionized—seen as undesirable, undervalued, and low-skilled and, where subminimum wages are more likely (Fry and Lowell 1997). As low-wage workers, they are more prone to wage theft—avoidance by employers in paying minimum wage often through workarounds involving scheduling, shift changes, and overtime (Bernhardt, Spiller, and Polson 2013; Clemens and Strain 2020). As J. Fine et al. (2021) show, rising unemployment is positively associated with greater likelihood of wage theft, as evidenced in the period during and following the Great Recession and the COVID-19 pandemic. Importantly, women and people of color, disproportionately found in certain industry sectors, were more likely to experience wage theft in times of economic upheaval. Whether formally or informally, a common theme justifying assignment of subminimum wages is that recipients, often members of vulnerable and marginalized groups, are simply worth less, which allows them to be exploited by employers in the low-wage sector.
Recent national- and state-level efforts to raise the wage assumed that having access to low-wage work (including jobs that have higher rates of subminimum pay), will be helpful to workers and families living in or at-risk of living in poverty. They also mask the gendered, racialized, and ableist nature of low and subminimum wage pay’s effect on poverty and insecurity. This situation raises the following questions: How common are subminimum wages among youth, student, tipped, and disabled workers? Are people with disabilities overrepresented among subminimum wage workers? How are subminimum wages tied to family poverty? Do those effects vary across vulnerable groups, especially those legally permitted to receive subminimum wages?
Using 2009–2019 Current Population Survey–Merged Outgoing Rotation Group data, we present a portrait of subminimum wage workers and examine the economic consequences of subminimum wage pay. We find that although hourly workers with disabilities were less likely to receive subminimum wages than full-time students, tipped workers, and youth under age 20, the consequences of paying subminimum wages were much greater for people with disabilities. Unlike other workers, people with disabilities paid subminimum wages faced a compounded risk of family poverty, resulting in exceptionally high poverty rates for these workers. In addition to being one of the few studies to document the payment of subminimum wages for people with disabilities within a broader context of low-wage work, this research also directly speaks to the association between subminimum pay and poverty—an ongoing social problem disproportionately affecting Americans with disabilities. 2
Situating Subminimum Wages within the Low-wage Sector
Social scientists studying subminimum wages have focused much of their attention on specific groups identified by policies as legal recipients of subminimum wages. For youths and disabled people, subminimum wages are thought to increase employment opportunities. Debates between economists D. Neumark and W. Wascher (1992, 1994) and Card, Katz, and Krueger (1993) in the early 1990s about whether increasing the minimum wage decreases youth employment opportunities were in part motivated by 1990 changes to Federal minimum wage standards that set a subminimum wage standard for youths. Tip credits also exempt tip workers from minimum wage standards. The assumption here, however, is that tipped workers earn additional money directly from customers via gratuities. In the low-wage, precarious, and non-unionized food service sector, which is among the fastest growing sectors in the United States (U.S. Bureau of Labor Statistics [U.S. BLS] 2021), “tipped wage” has become synonymous with “subminimum wage” (Goldberg and Minkoff-Zern 2021).
Beyond these groups, scholars have also documented widespread subminimum pay among immigrant and undocumented workers through a combination of no pay for overtime work, no or unpaid breaks, no compensation for work-based injuries, and straightforward assignment of wages below the minimum standard across a variety of low-wage industries where immigrants are overrepresented (Akaras and Amar 2011; Bernhardt et al. 2009). Finally, sociologists and criminologists have framed low and subminimum wage pay among prisoners and former inmates through policies like workfare, parolefare, and prisonfare as neoliberal mechanisms of social control (Goldberg 1999; Wacquant 2010; Zatz 2020). These poverty regulating programs place individuals in low and subminimum wage jobs and, according to Josh Seim and David J. Harding (2020), they actually do little to alleviate poverty.
Disability represents a somewhat special case of low and subminimum pay. Even with the declining use of waivers, C. Friedman (2019) recently documented considerable occupational and regional variation in the use of DOL Section 14(c) certificate waivers. Firms in wealthier, more populated regions with more disability-related service providers (like Goodwill) and a manufacturing presence saw higher use of waivers and subminimum wages. But there are far more disabled workers in the competitive low-wage sector earning subminimum wages who are not subject to waivers. Situating the assignment of subminimum wages in the broader low-wage or minimum wage sector sheds light on how some groups are disproportionately affected by these practices because of their status and where they are located in the labor market (Friedman and Rizzolo 2020).
Many supply-and-demand-side factors like human capital and employer preferences leading to occupational clustering of racialized and gendered groups in low-wage work also likely influence employment in jobs paying subminimum wages (Browne et al. 2001; Charles and Grusky 2004; Padavic and Reskin 2002; Unger 2002; Weeden 2005). A disproportionate number of workers who rely on “unpredictable gratuities” are women and women of color. Assigned subminimum wages, they may earn 70 percent below the minimum wage (Andrea et al. 2020). More generally, those within the low-wage sector are more likely to be paid below the minimum wage because of employer practices like reducing hours and last-minute shift assignments, creating unpredictable work schedules, pooling tips, offering no insurance or benefits, and lowering payroll costs (Azar 2003; Haley-Lock 2012; Lambert 2008; Lambert, Haley-Lock, and Henly 2012). Wage theft continues to negatively affect earnings despite minimum wage laws in part because, as Fine et al. (2021) conclude, complaint-based enforcement does little for those vulnerable workers in industries like the food manufacturing sector where there is high wage theft but few formal complaints.
Disabled workers are also clustered in low-wage jobs, such as those in the food and service and manufacturing sectors, where subminimum pay is more likely regardless of waivers (National Council on Disability 2018; Maroto and Pettinicchio 2014b). Pre-labor market discrimination, disadvantages in education, and the failure of vocational programs to train people with disabilities into competitive employment within expanding industries (Chan et al. 2010; Eckes and Ochoa 2005; Moore et al. 2011) further contribute to later disadvantages including employment in subminimum wage jobs and consequently, inadequate income.
These individual- and organizational-level factors shaping wages are embedded in broader regional, political, and economic milieus. More generally, labor market opportunities are a function of place (Haynie and Gorman 1999). Gaps between “good” and “bad” jobs (see Kalleberg 2011)—the latter where members of marginalized groups are more likely to be clustered—vary by region (Haley-Lock 2012). This means that in areas where there is higher unemployment, underemployment, and a concentration of low-skilled jobs and low-wage workers, the wages of people with disabilities will be especially negatively affected (McLaughlin and Coleman-Jensen 2008). More specifically, disability rights legislation and minimum wage laws vary by state where although some states have entirely done away with legally sanctioned subminimum wages, others have not. Regardless, about 105,006 workers with disabilities were earning subminimum wages under 1,316 Section 14(c) certificates in 2019 (Association of People Supporting Employment First 2021). This illustrates the importance of considering state-level minimum wage cut-offs above using only the federal minimum wage and to ascertain how family poverty across different groups is negatively affected by low and subminimum wage pay.
Although employment is a means to limit economic insecurity and poverty, it only does so if workers are earning enough to lift themselves out of poverty. When workers are thought to be unproductive and undervalued in the competitive labor market, as is the case with disabled people (Robert and Harlan 2006; Russell 2002) and with declining disability employment rates over the last 30 years (Maroto and Pettinicchio 2014a, 2015; Pettinicchio 2019), these are then used to justify low and subminimum wages. Even when working within the low-pay sector, people with disabilities are still paid less within those occupations than people without disabilities (Maroto and Pettinicchio 2014b). Thus, the economic consequences of subminimum wage pay may be potentially greater for certain workers, like those with disabilities.
The Implications of Subminimum Wages for Poverty
Poverty has been at the heart of sociological inquiry since the emergence of the discipline. Matthew Desmond and Bruce Western (2018) and D. Brady (2019) provide recent extensive reviews on the status of this field. Both call for an integrative approach to understanding poverty synthesizing structural, individual, and relational perspectives with Desmond and Western (2018) emphasizing exploitive relationships, (see also Tomaskovic-Devey and Avent-Holt 2019; Maroto and Pettinicchio 2022), and in the case of Brady (2019), political and power resource perspectives. At the same time, both acknowledge difficulties in isolating specific factors leading to poverty because not only are these interrelated, but they may also be endogenous to poverty itself.
Poverty is highest among Black mother-only families in the United States for whom good jobs are unavailable and for whom family obligations often bar them getting good jobs. Increased costs of living and other expenses, and declining government supports pushed these families, and others, to the edge (Edin and Lein 1997). In 2020, 25 percent of Americans with disabilities lived below the poverty line and made up almost 18 percent of all those 18 to 64 years old living in poverty (Schrider et al. 2021). Women and racial minorities with disabilities are among those earning the least, even when accounting for income outside the labor market and, have among the highest poverty rates (Maroto, Pettinicchio, and Patterson 2019; She and Livermore 2007). Families with household members with disabilities may also face added living expenses and additional earnings penalties if non-disabled family members cannot work because they are providing care (Maroto and Pettinicchio 2020). Even when financially strained because of low income, inadequate supports, and added expenses, families may still provide support to family members not living at home (Federal Reserve 2020; Fox, Glassman, and Pacas 2020; Fox et al. 2015).
A factor often singled out as contributing to poverty is the erosion in the value of the minimum wage over the last 40 years (Acemoglu and Autor 2011; Card and DiNardo 2002; Lemieux 2008). This leads to exploitation in that workers are increasingly underpaid for the work they do, more likely among low-wage women workers and workers of color (Liu, Sakamoto, and Su 2010; Sakamoto and Kim 2010). Alternatively, because these effects are greatest in the lower tail of the wage distribution (David, Manning, and Smith 2016), minimum wage standards can act as anti-poverty tools (Wolla 2014). Yet, economists have debated whether specifically raising the minimum wage exacerbates or alleviates poverty. Many economists believe that if wages are “too high” among low-wage workers, employers reduce hours, cut jobs, or refrain from hiring thereby offsetting any poverty-alleviating effects raising the minimum wage would have especially on low-wage workers. Anindya Sen, Kathleen Rybczynski, and Corey Van De Waal (2011) refer to this as negative spillovers on the working poor.
Empirical inconsistencies surrounding the effects of wage increases on poverty suggest that different people in the low-wage sector, namely the poorest or near-poorest, are affected differently by the assignment of minimum and, potentially, subminimum wages. Dallin Overstreet (2021) argues that most workers earning the minimum wage are younger people who are not primary household breadwinners and so increasing the wage would do little to address family poverty. Joseph J. Sabia, Richard V. Burkhauser, and Taylor Mackay (2018) found that increasing the minimum wage for tipped workers decreased the chances of living in a poor family but not the broader (often nonpoor) household. Recently, epidemiologists found that women and women of color, already more likely to be assigned subminimum wages and to live below the poverty line, especially benefit from minimum wage increases (Andrea et al. 2020).
The economics literature makes broad, average population-level assumptions about how wage increases affect poverty and assumes that increasing the low-wage floor alone alleviates poverty. Furthermore, as Lonnie K. Stevans and David N. Sessions (2001). and Jennifer Romich and Heather D. Hill (2018) explain, raising the minimum wage may not have any long-term effects on poverty if many workers are not covered or affected by increases. Likewise, other factors like household circumstances and the availability of other sources of income including government benefits (see Maroto, Pettinicchio, and Patterson 2019; Maroto and Pettinicchio 2020) may offset the effects of wage increases on poverty. Scholars call on researchers to more closely consider how poverty experienced by different groups in the low-wage sector is shaped by the minimum and subminimum wage.
The low-wage or “bad jobs” sector has expanded over the past 30 years with broader social forces like deindustrialization, globalization, and de-unionization contributing to a bifurcated labor market (Kalleberg 2011; Leicht 2008, 2016; Western and Rosenfeld 2011). There are also many racialized, classed, gendered, and ableist dimensions to low-wage work and poverty (Bonacich 1972; Browne and Misra 2003; Howell 1982; Leicht 2016; Reskin 1993; Western and Rosenfeld 2011). For example, disability has the largest effects on poverty for people with less education, for people of color, and for women with work-limiting disabilities (Pettinicchio and Maroto 2017; Maroto, Pettinicchio, and Patterson 2019). This is in part because people with disabilities, particularly people with cognitive and multiple disabilities, are clustered in low-wage work earning considerably less than non-disabled workers in this sector, except when in unionized employment (Pettinicchio and Maroto 2021a). Unions lift wages overall and challenge arbitrariness in employer actions that affect earnings. However, most vulnerable groups in the low-wage sector face obstacles in accessing unionized employment and unionized employment is typically not an option for subminimum wage workers.
Given the effects of low-wage work on poverty, we expect that subminimum wage work will also be associated with poverty at the family level. Even if subminimum wages help some individuals to find low-wage work, they cannot on their own bring a family out of poverty. Subminimum wages may supplement other sources of household income, which is often the case with youth and among disabled workers who may also receive income supports. In those situations, subminimum wages could help alleviate poverty. However, if workers do not receive additional sources of income and supports, subminimum wages can exacerbate already high poverty, particularly for tipped workers who are primary earners and workers with disabilities who already earn considerably less than non-disabled counterparts and are more likely to experience poverty.
Data, Measures, and Methods
We use pooled CPS-MORG data for 2009–2019 to study subminimum wages among hourly workers across the population. The CPS is a large, ongoing national monthly household survey conducted jointly by the U.S. Census Bureau and the U.S. BLS that provides one of the most extensive sources of employment and demographic data for the United States (Flood et al. 2018). Specifically, the CPS uses a household rotation pattern where households are included in the survey for four consecutive months, left out of the survey for eight months, and then re-interviewed for four months (U.S. Census Bureau 2019). In addition to the monthly CPS questions, employed CPS respondents age 15 and older also answer specific earnings- and work-related questions when rotating out of the survey at months 4 and 8, including questions regarding hourly pay for workers. Although other surveys, such as the American Community Survey (ACS) and the National Health Interview Survey (NHIS), contain information on disability status and annual earnings, the CPS also contains important information on hourly earnings and hourly work status, making it ideal for a study focused on the payment of subminimum wages.
We begin our analysis in 2009 after which CPS revised their set of disability-related questions to provide better information regarding different types of limitations (see Altman and Bernstein 2008). To ensure that we only observe each individual once, we restrict our sample to respondents exiting in month 4 of their rotation (MISH = 4). We also limit our sample to hourly workers age 18 and older with at least some work hours in the previous week. 3 After incorporating these restrictions, we obtained a sample of 502,976 respondents for 2009–2019. Finally, we weight estimates with survey-provided weights divided by 12 to account for the inclusion of all monthly samples per year (EARNWT/12).
To capture the experiences of hourly workers, we examine subminimum wages for all hourly workers with employment in the past week. This required combining CPS-MORG data with state and federal minimum wage data obtained from the DOL, FRED, the Federal Reserve Bank of St. Louis. 4 We created a binary subminimum wage variable by comparing the respondent’s self-reported hourly earnings for their current job with the state or federal minimum wage for the previous year to ensure any new minimum wage laws have gone into effect. Using data from workers reporting hourly earnings helped to limit respondent reporting error that is introduced in studies that calculate hourly earnings by dividing annual or weekly earnings by annual or weekly hours worked. It also allowed us to isolate workers for whom minimum wage laws directly applied.
For most respondents, we compared hourly earnings with the state minimum wage. If the state did not specify a minimum wage or if the state’s minimum wage was below the federal minimum wage, we used the federal minimum wage ($7.25 for most years) instead. Following work examining changes in state-level minimum wage laws (Clemens and Strain 2018, 2020), this strategy improves upon most BLS analyses of subminimum wages that rely on comparisons with only the federal minimum wage. For the final variable, respondents making less than the minimum wage were coded as 1, those making the minimum wage or above were coded as 0.
We then connect subminimum wages to Census poverty thresholds. We use a rough approximation of family poverty status based on a comparison of family income with the given weighted average poverty thresholds for the individual’s family size and year. 5 Family income refers to the annual family income, in categories, of all persons related to the head of household. It includes the income of all household members 15 years of age or older. Income includes money from jobs; net income from business, farm, or rent; pensions; dividends; interest; Social Security payments; and any other monetary income. Because the CPS provides only a categorical variable for family income, we recoded family income levels to the median income for each category and then compare those values with the specified poverty threshold for the family’s size. 6 We provide additional details for the construction of our poverty measure and sensitivity analyses in Supplemental Appendix B.
In examining subminimum wages, we pay special attention to four groups of workers—people with disabilities, youth under age 20, full-time students, and tipped workers. 7 Disability status includes limitations based on six CPS questions that ask whether the respondent had a cognitive, physical, independent living, self-care, vision, or hearing difficulty (Livermore et al. 2011). These questions, which were revised across the CPS, ACS, and Survey of Income and Program Participation (SIPP) surveys in 2008, have aimed to address disability more broadly than the CPS’s previous work-limiting disability definition. However, because these questions do not also consider the severity of disability, they do not go far enough to address Washington Group recommendations regarding the measurement of disability (Pettinicchio and Maroto 2021b).
Disability is measured in relation to cognitive, physical, independent living, self-care, vision, or hearing limitations (U.S. BLS 2015). Cognitive difficulties include those related to remembering, concentrating, or making decisions. Physical difficulties include difficulties walking or climbing stairs. Mobility or independent living difficulties (IDLs) indicate the presence of any condition that creates difficulties in completing errands. Self-care difficulties include those around providing for own personal needs, such as bathing and dressing. Vision difficulties indicate whether the respondent was blind or had serious difficulty seeing even with corrective lenses. Finally, hearing difficulties indicate whether the respondent was deaf or had serious difficulty hearing. In addition to disability status, we also examine disability type within our descriptive analyses. These variables indicate whether the respondent reported a cognitive, physical (ambulatory), hearing, vision, or independent living or self-care disability. 8
We compare subminimum wages among people with disabilities with other categories of workers legally allowed to be paid the minimum wage. Tipped workers is a dichotomous variable that indicates whether the respondent received overtime, tips, or commission as part of their regular pay. Enrollment status indicates whether the respondent was currently enrolled in school as a full-time student, a status that also includes vocational learners. To isolate youth under age 20, we use a categorical age variable with categories of 16–29 years, 20–29 years, 30–49 years, and 50 years and older. 9
To control for other factors associated with the payment of subminimum wages and the incidence of poverty, we include predictors for the respondent’s reported sex, race and ethnicity, and citizenship status. Sex is a categorical variable of male (the referent) or female. We indicate race/ethnicity with a categorical variable measured as non-Hispanic White (the referent), non-Hispanic Black, Hispanic, or non-Hispanic other. Citizenship status indicates whether the respondent was not a native-born or naturalized U.S. citizen.
We also control for marital and parental status, family size, educational attainment, and weekly work hours. We measure marital status with a categorical variable that indicates whether the respondent was currently married (the referent), never married, or separated, divorced, or widowed. Parental status indicates whether the respondent reported any children and family size indicates the number of people (adults and children) in the respondent’s family. Educational attainment indicates whether the respondent completed a bachelor’s degree or higher. Weekly work hours accounts for the respondent’s usual hours worked per week over the past year.
Finally, we account for major occupational category with nine broad occupational groups: —management, business, and financial occupations; computer, engineering, and science occupations; education, legal, arts, and media occupations; health care and technical occupations; service occupations; sales occupations; office and administrative support occupations; natural resource, construction, and maintenance occupations; and production, transportation, and material moving occupations. To better control for differing legal and policy environments, we also include indicator variables for the respondent’s state of residence and survey year.
Addressing our first set of research questions—To what extent do people with disabilities receive subminimum wages and how does this compare with youth, students, and tipped workers?—we begin with a descriptive discussion of subminimum wages by disability status and type and compare these differences with those for tipped workers, students, and youth. We then incorporate a logistic regression model to examine differences in subminimum wages when controlling for demographics, family structure, human capital, occupation, state, and time. Addressing our second set of research questions—How are subminimum wages tied to poverty, and do the effects vary across groups?—we focus on family poverty as our outcome variable and include a series of interactions between the payment of subminimum wages and our key variables.
Findings
A Portrait of Subminimum Wage Workers
In addition to providing basic descriptive statistics for our sample, Table 1 also compares characteristics of subminimum wage workers with those working the minimum wage and above. We estimate that, based on state minimum wage rates, there were approximately 1,565,805 subminimum wage hourly workers with earnings and at work in 2019, accounting for about 3.7 percent of the hourly workforce. This estimate exceeds other provided estimates because we focus on state minimum wages, which in many places were much higher than the federal minimum wage in 2019 (see Supplemental Appendix C).
Descriptive Statistics by Subminimum Wage Payment, CPS MORG 2009–2019.
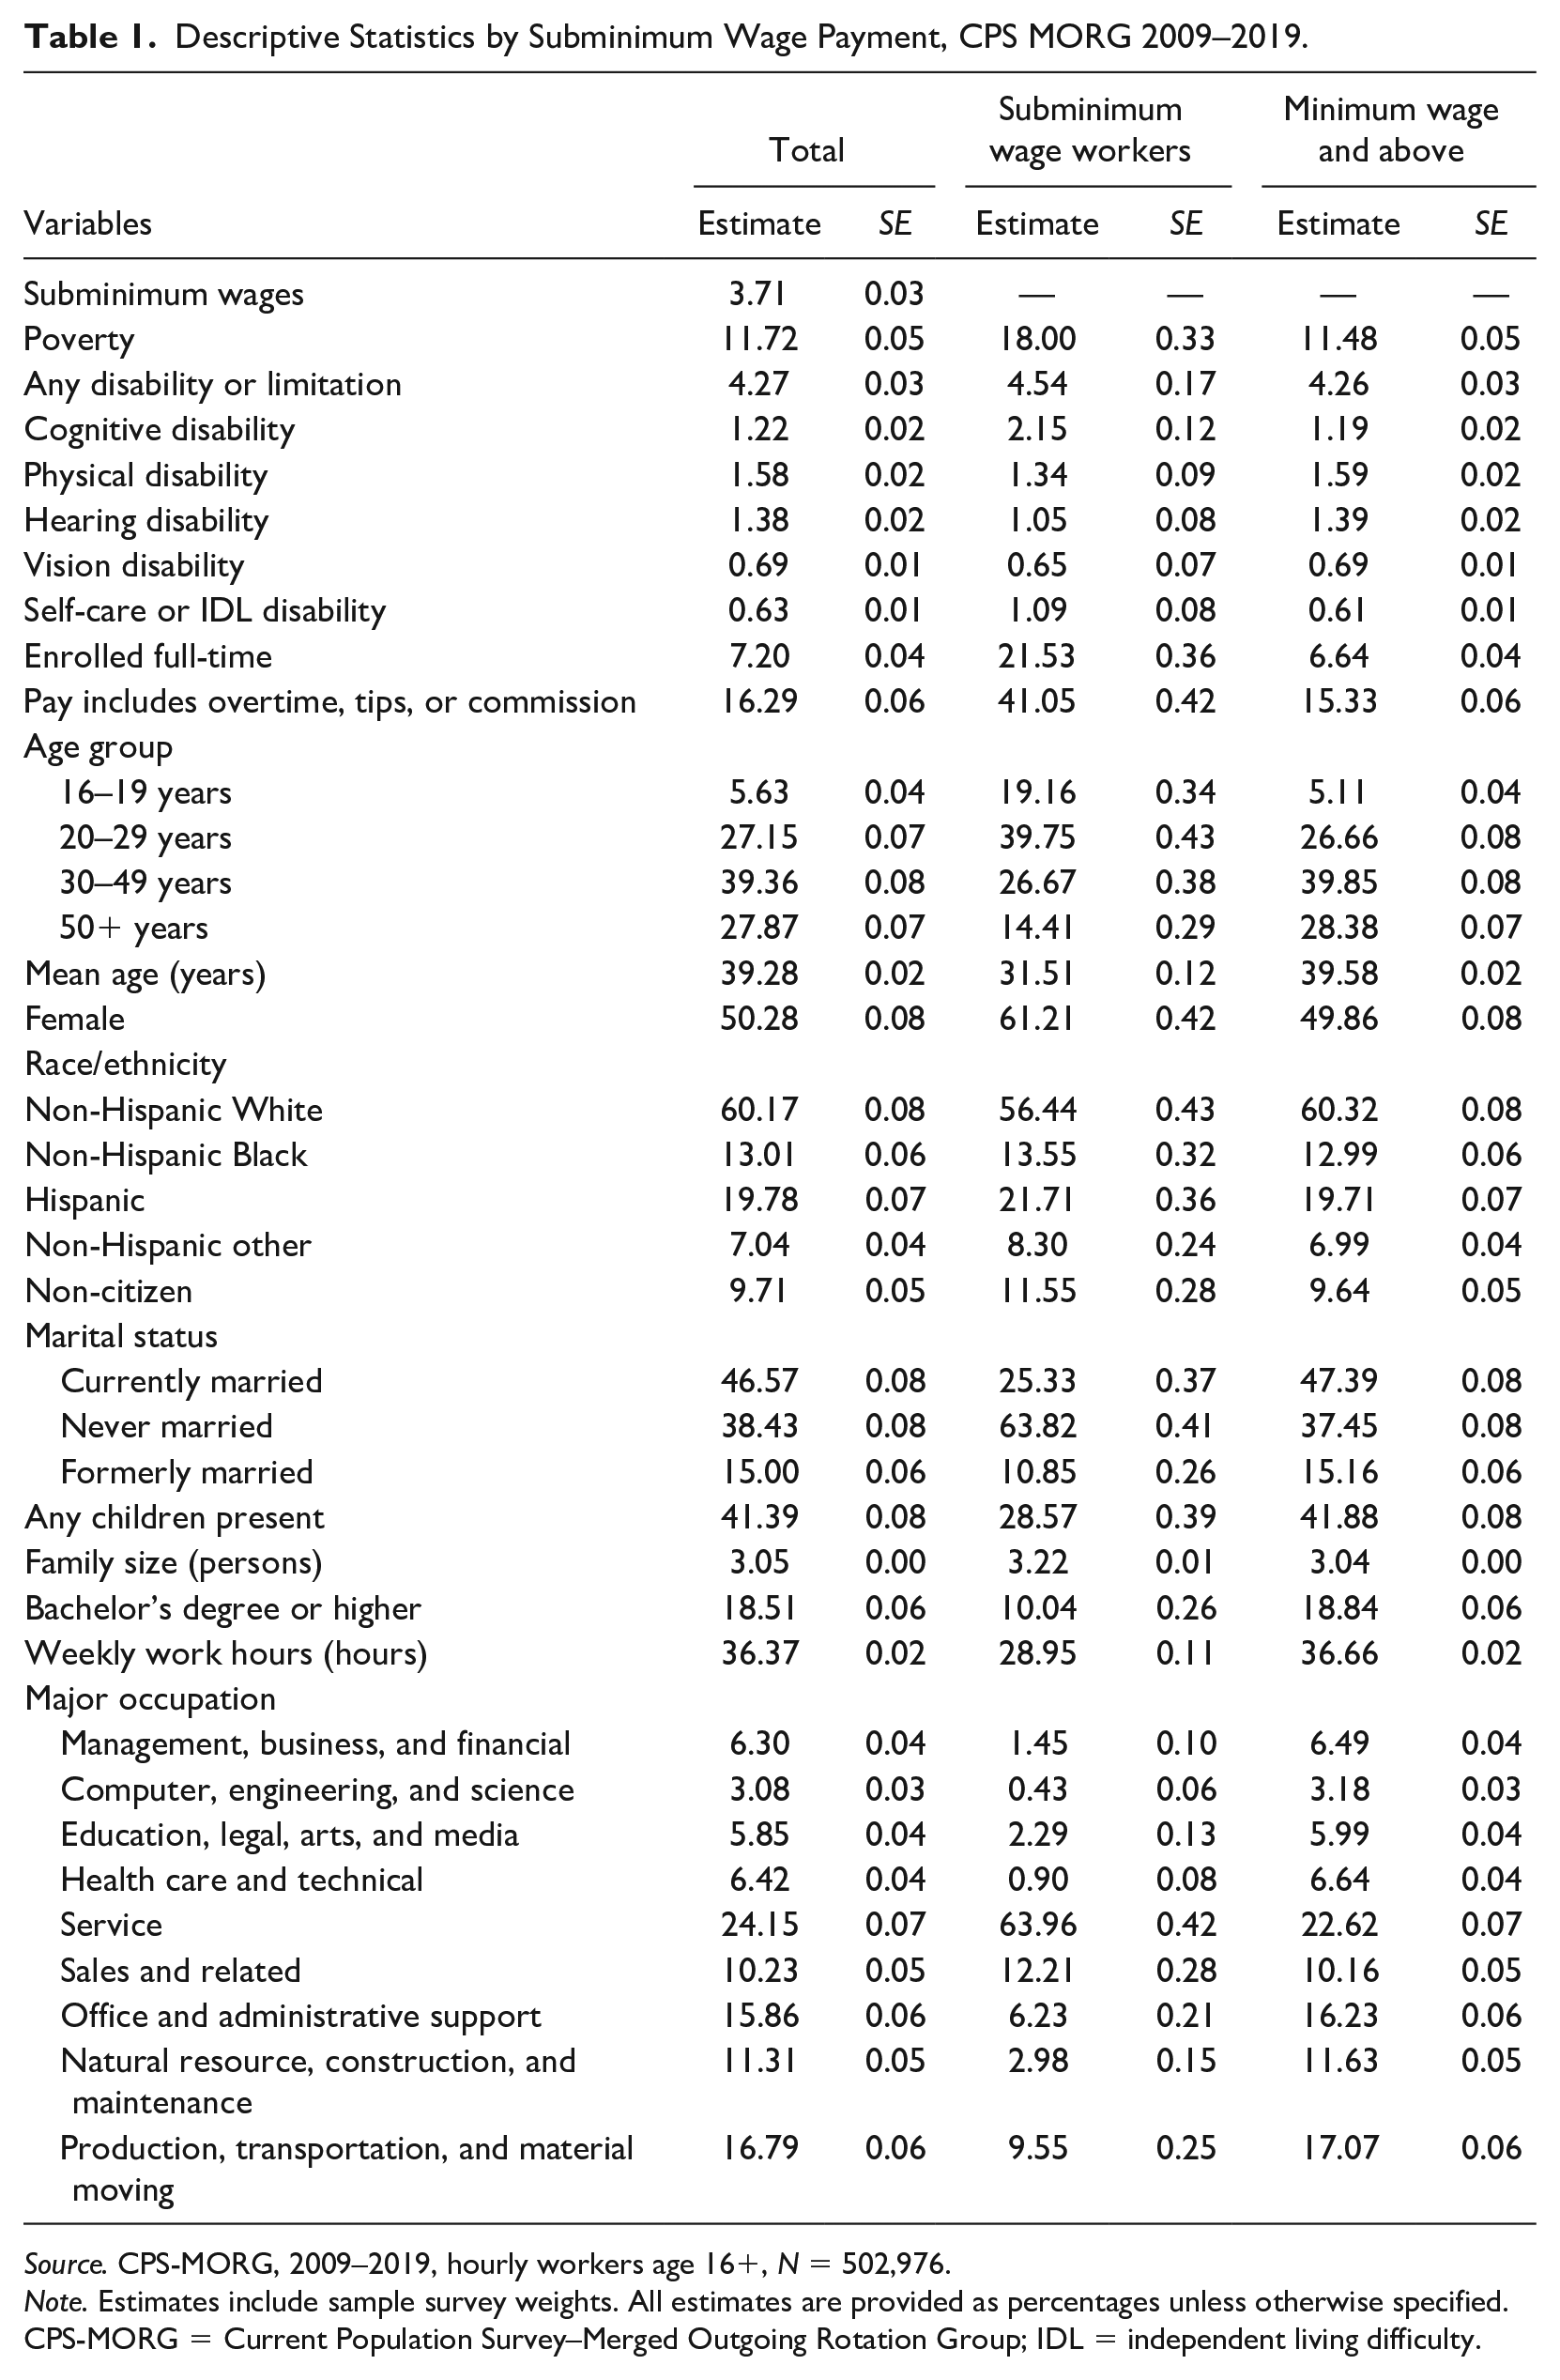
Source. CPS-MORG, 2009–2019, hourly workers age 16+, N = 502,976.
Note. Estimates include sample survey weights. All estimates are provided as percentages unless otherwise specified. CPS-MORG = Current Population Survey–Merged Outgoing Rotation Group; IDL = independent living difficulty.
As Table 1 shows, subminimum wage workers are more likely to experience poverty than higher-wage workers. People with cognitive and self-care/IDL disabilities, students, tipped workers, and youth are also overrepresented among subminimum wage workers, which we would expect based on the given laws. In addition, subminimum wage workers are more likely to be female, unmarried, and without children. Non-citizens are also overrepresented among this group. Subminimum wage workers were most often found working in the service and sales sectors.
Figure 1 reiterates the findings from Table 1 by highlighting the percentages of subminimum wage workers across different groups. Approximately 3.9 percent of people with disabilities received subminimum wages, and 6.5 percent of workers with cognitive or IDL disabilities were paid below the minimum wage, as shown in Figure 1. Disparities were also present across other groups, at rates higher than those present by disability. Young people under age 20 were much more at-risk for earning subminimum wages than older adults. Students and tipped workers were also much more likely to report subminimum wages.
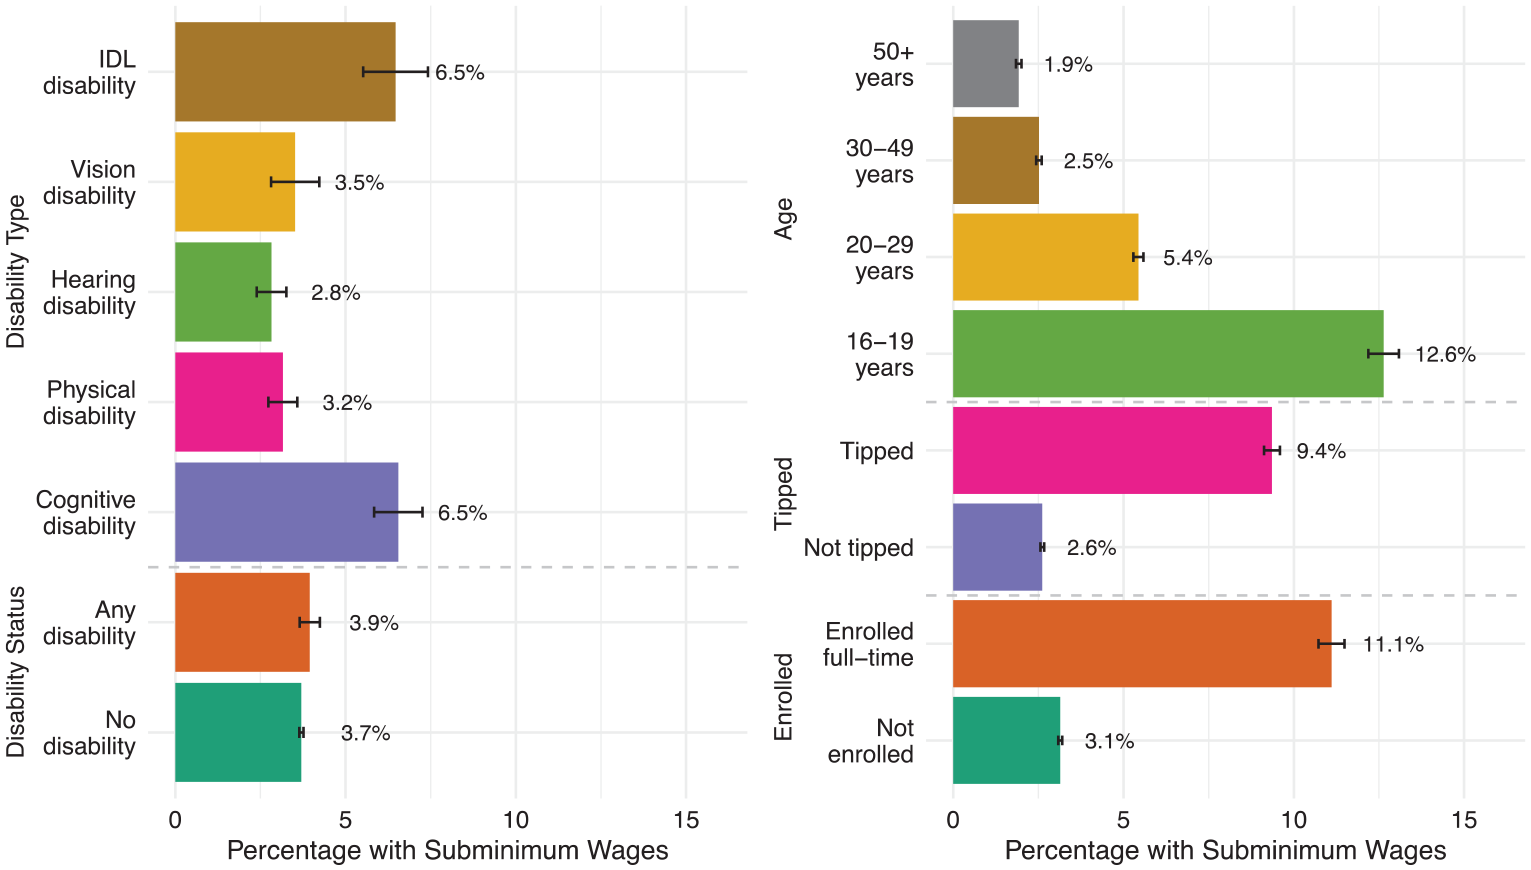
Subminimum wages across disability type and status, age, enrollment status, and tipped worker status.
Expanding on these descriptive comparisons, we examine disparities in the payment of subminimum wages across groups using a logistic regression model in Table 2. 10 As Table 2 shows, hourly workers with disabilities were more likely to receive subminimum wages by 0.2 percentage points, net of key control variables. 11 Although this percentage is small, in relation to a base percentage of 3.7 percent of workers receiving subminimum wages, it represents an increase of 5.4 percent.
Results from Logistic Regression Models Predicting Subminimum Wages.
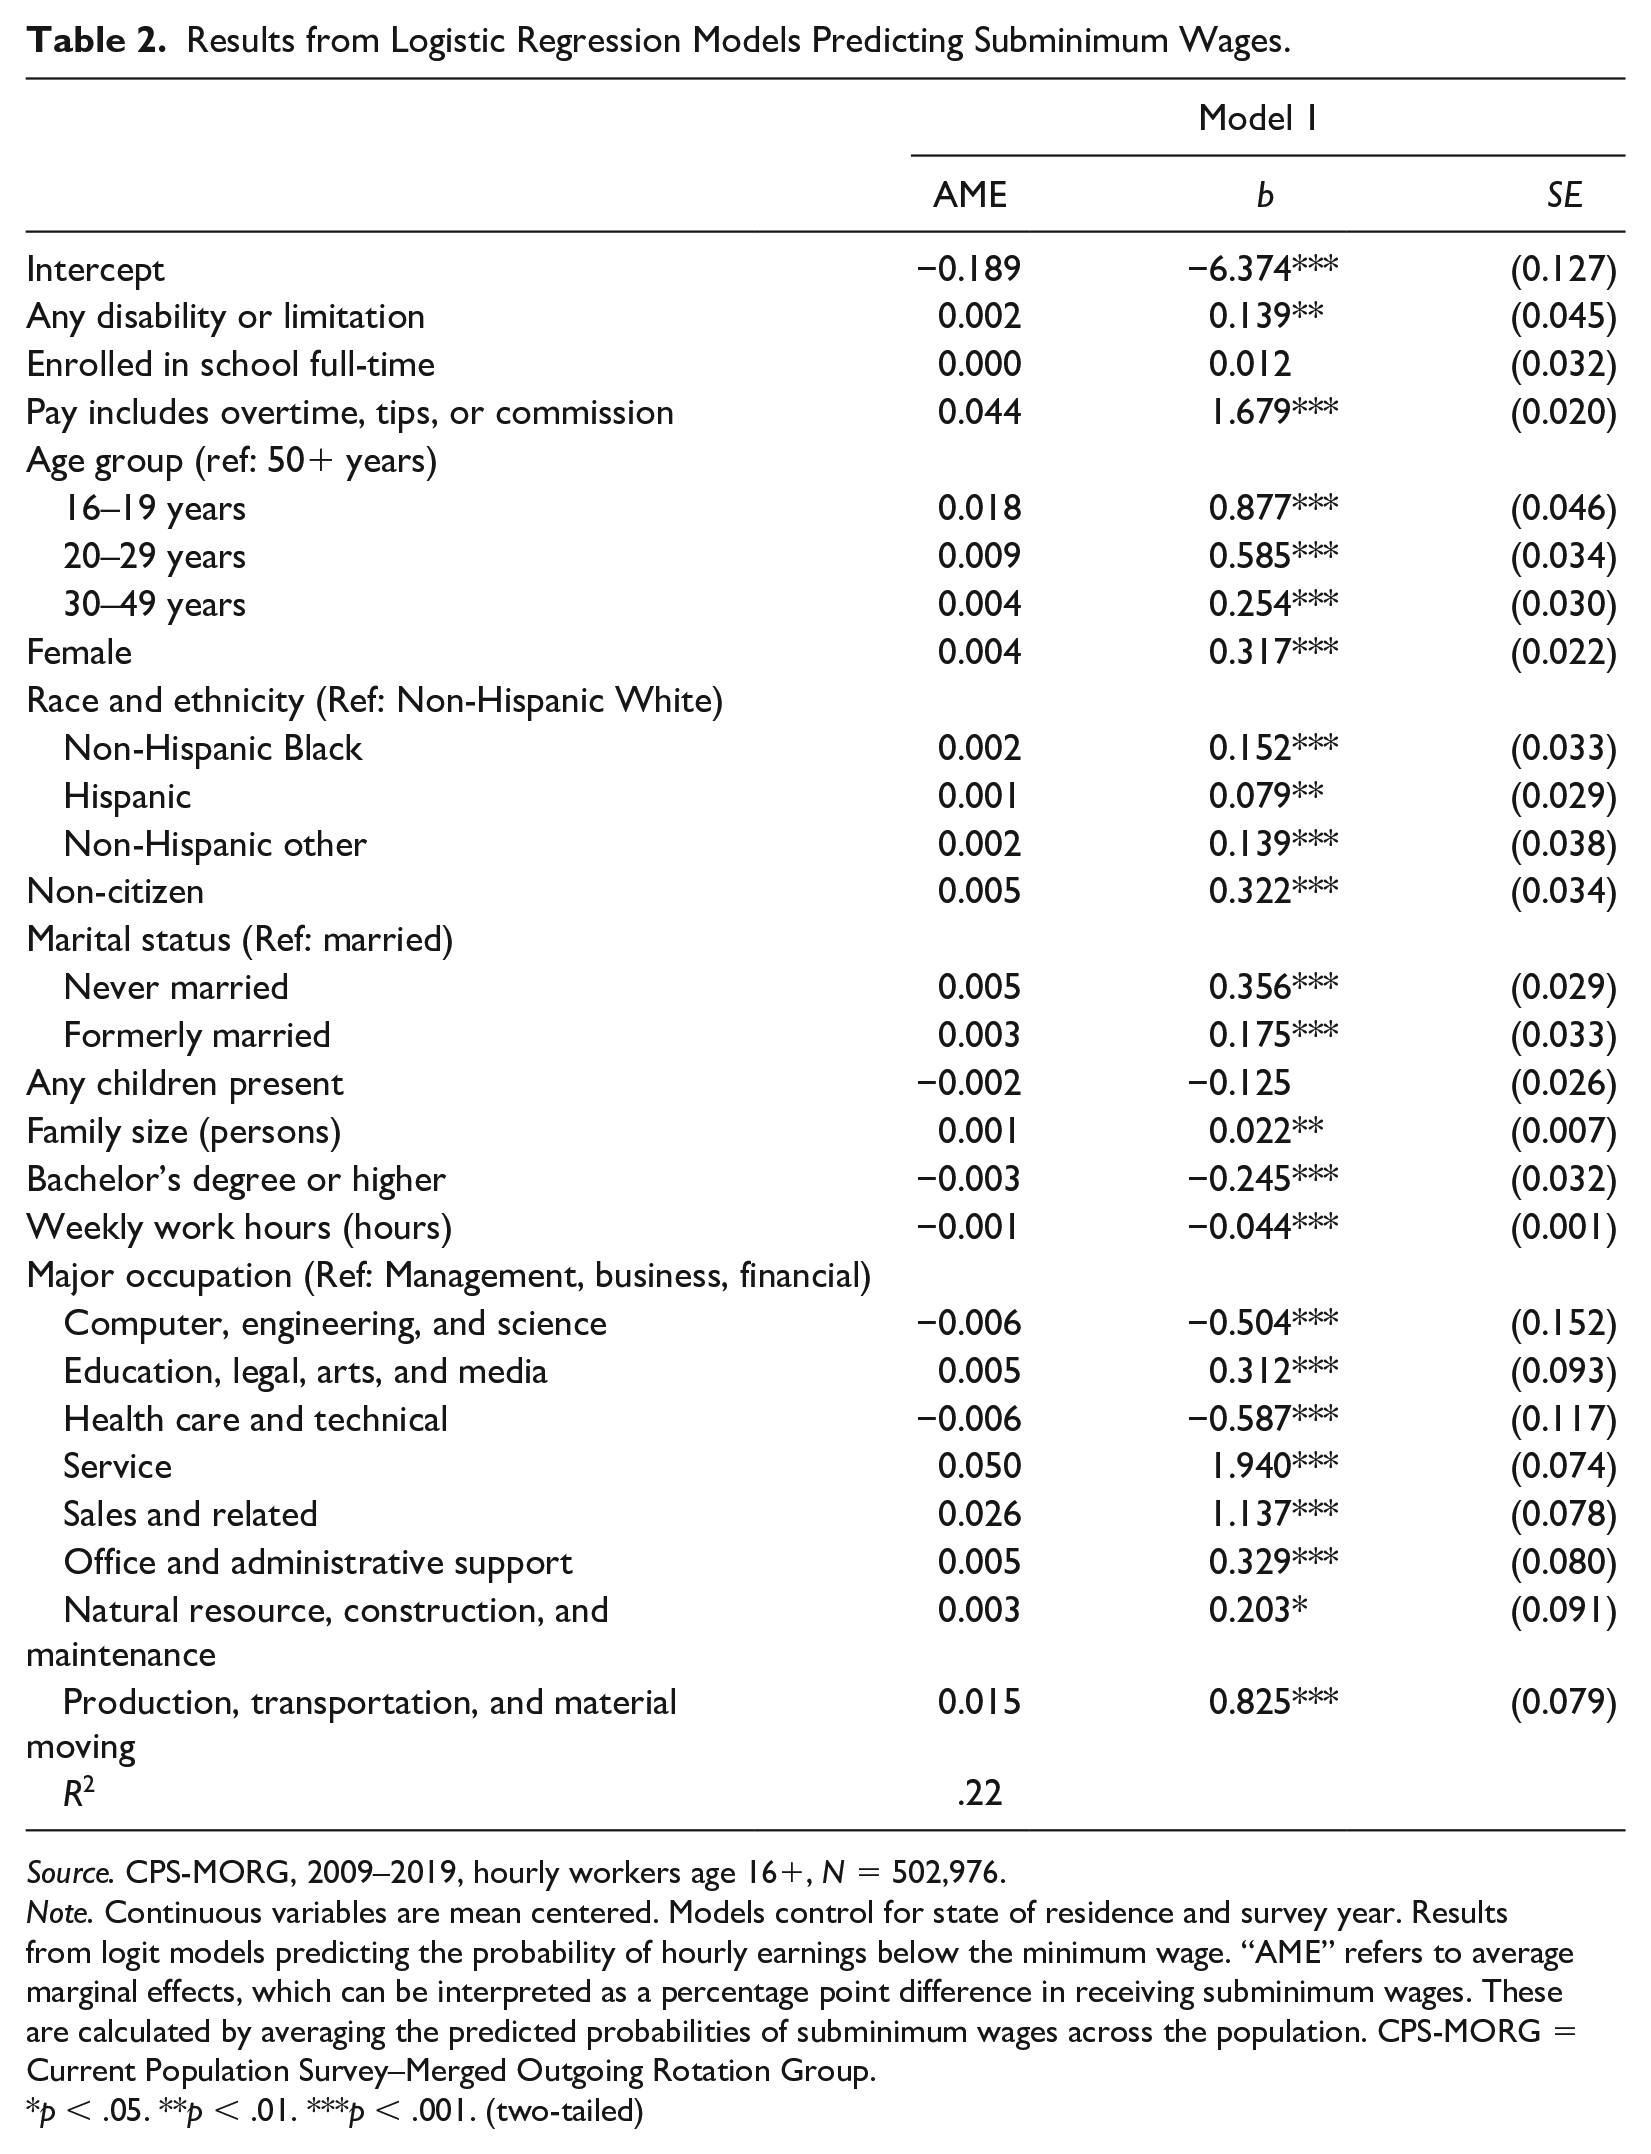
Source. CPS-MORG, 2009–2019, hourly workers age 16+, N = 502,976.
Note. Continuous variables are mean centered. Models control for state of residence and survey year. Results from logit models predicting the probability of hourly earnings below the minimum wage. “AME” refers to average marginal effects, which can be interpreted as a percentage point difference in receiving subminimum wages. These are calculated by averaging the predicted probabilities of subminimum wages across the population. CPS-MORG = Current Population Survey–Merged Outgoing Rotation Group.
p < .05. **p < .01. ***p < .001. (two-tailed)
Rates were higher across other groups permitted to receive subminimum wages. Tipped workers were more likely to receive subminimum wages by 4.4 percentage points, net of controls. Youth under age 20 were also more likely than workers age 50 and older to receive subminimum wages by 1.8 percentage points. However, after controlling for other factors, school enrollment was not significantly associated with receiving subminimum wages. Finally, across control variables, occupation also showed a strong relationship to subminimum wages with higher rates in service and sales occupations.
Subminimum Wages and Experiences of Poverty
Documenting exposure to subminimum wages is important for subsequently understanding how they contribute to inequality and poverty. In Table 3, we present results from logit models predicting the probability of having a family income below the official poverty threshold across groups and by subminimum wage receipt.
Results from Logistic Regression Models Predicting Poverty.
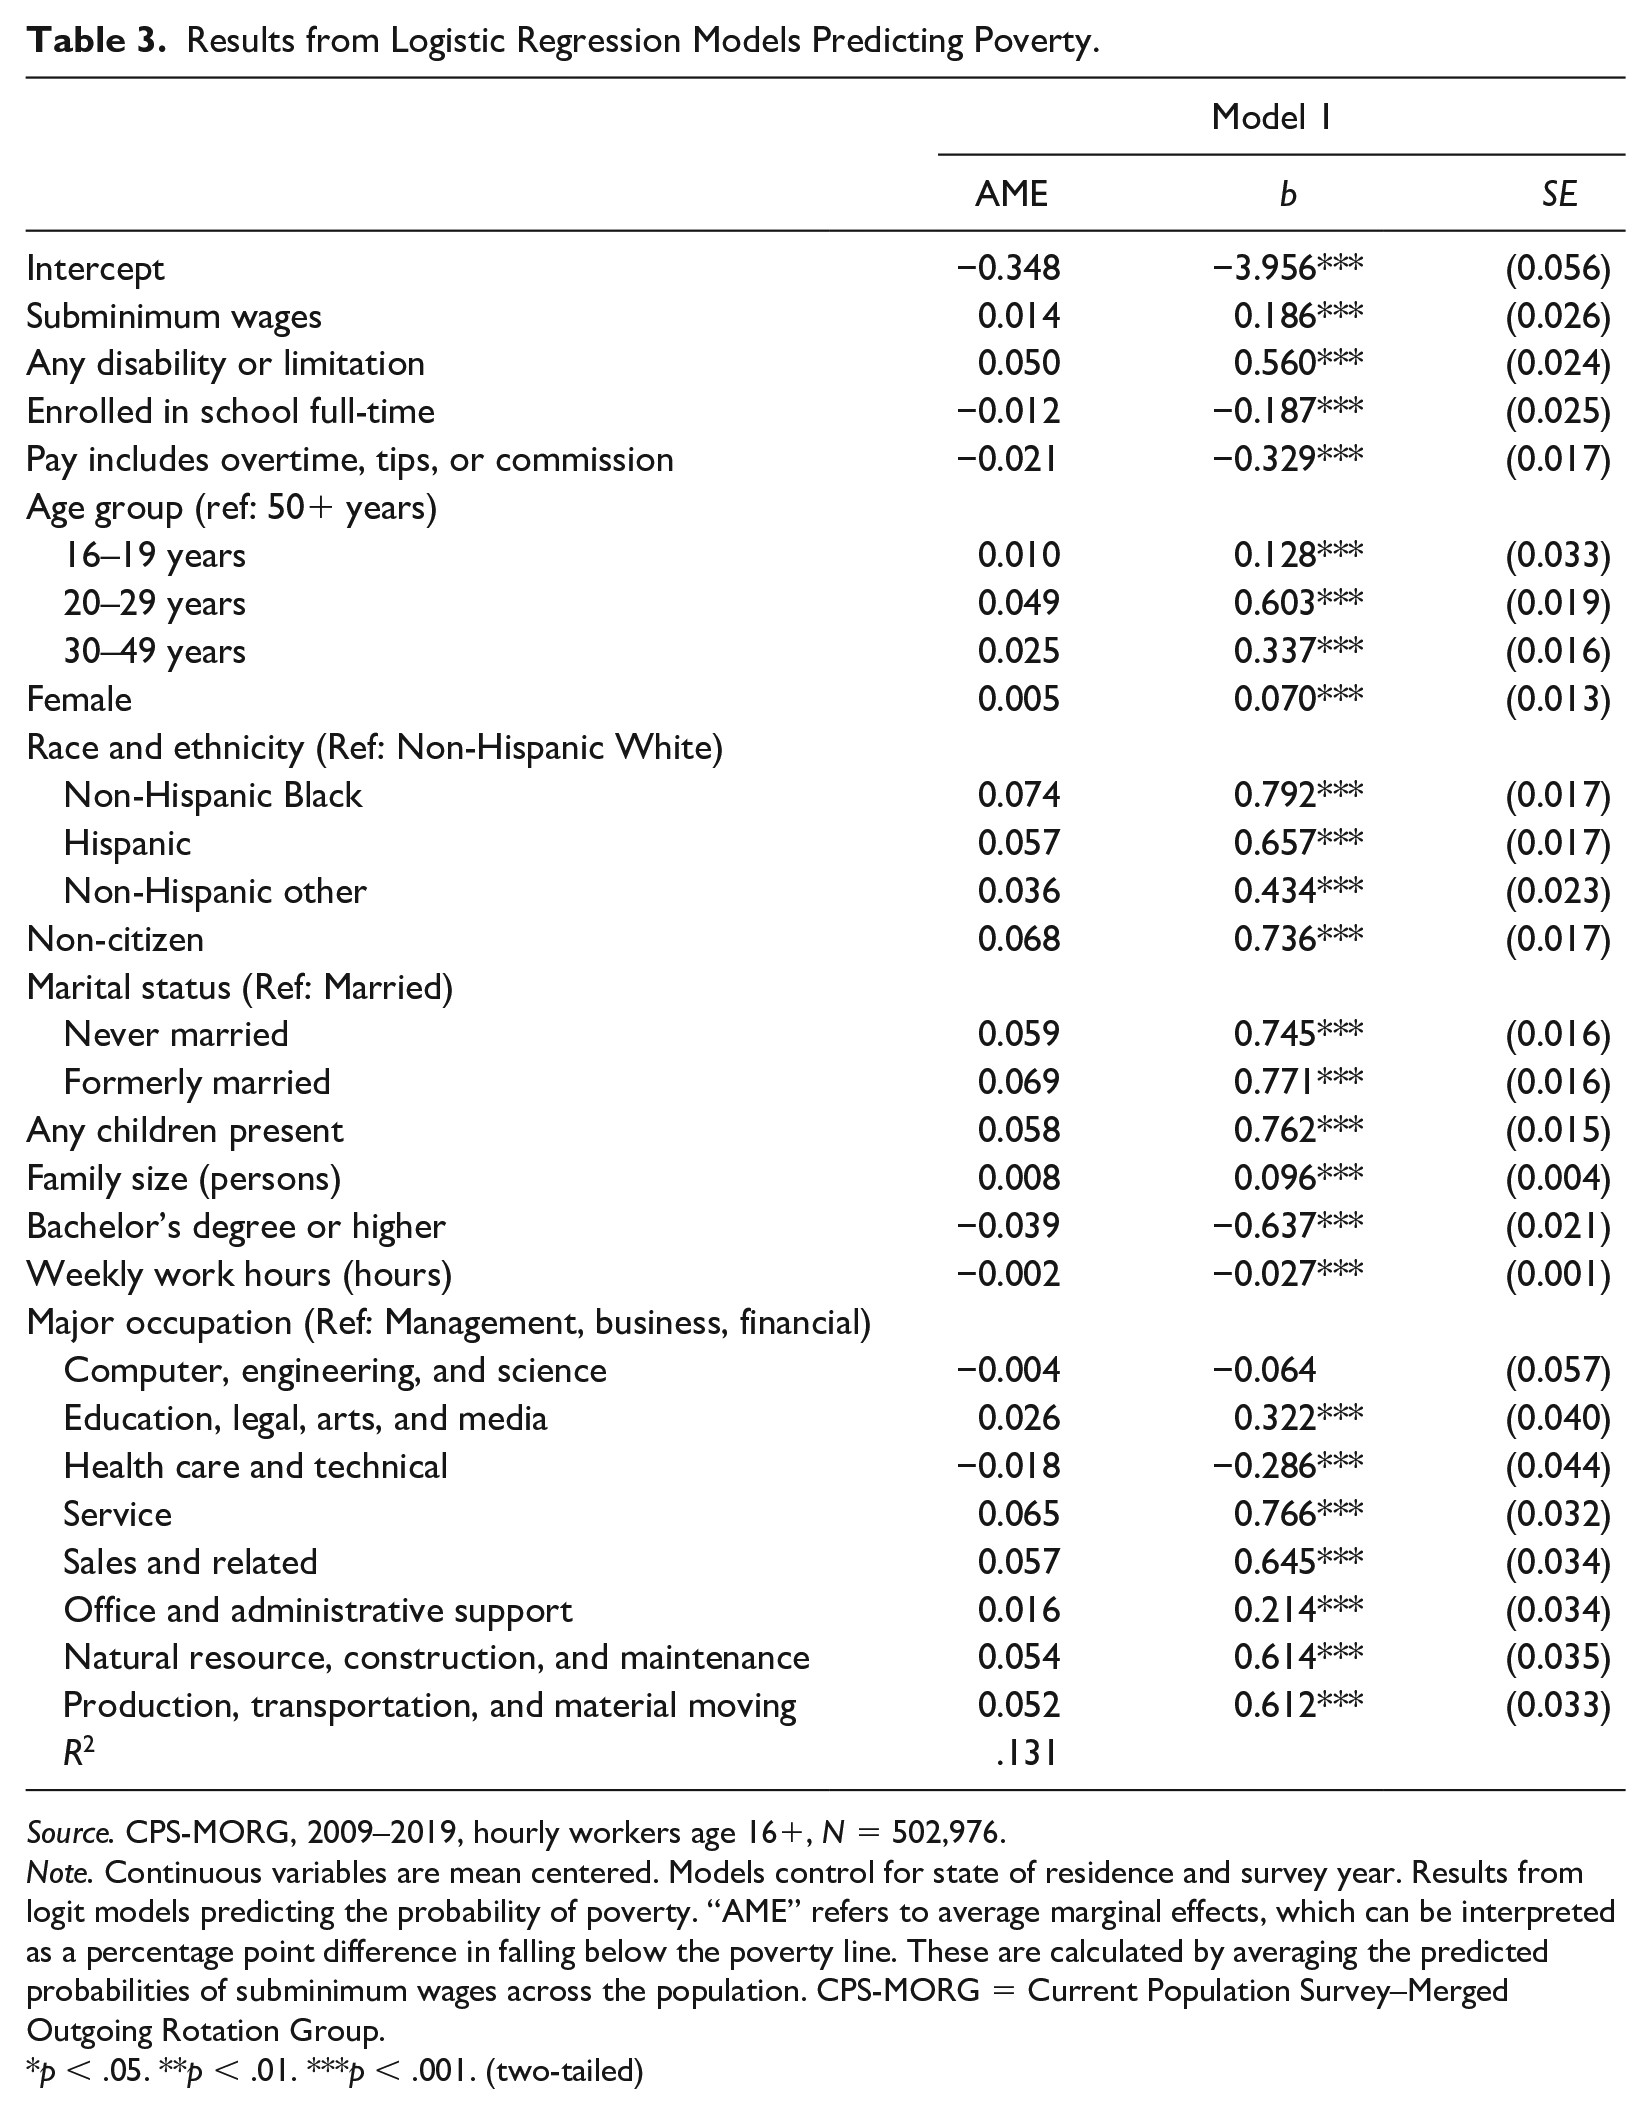
Source. CPS-MORG, 2009–2019, hourly workers age 16+, N = 502,976.
Note. Continuous variables are mean centered. Models control for state of residence and survey year. Results from logit models predicting the probability of poverty. “AME” refers to average marginal effects, which can be interpreted as a percentage point difference in falling below the poverty line. These are calculated by averaging the predicted probabilities of subminimum wages across the population. CPS-MORG = Current Population Survey–Merged Outgoing Rotation Group.
p < .05. **p < .01. ***p < .001. (two-tailed)
Net of controls and membership in groups where subminimum wages are permitted, receiving subminimum wages was associated with an increase in family poverty by 1.4 percentage points or approximately 12 percent over the average poverty rate. Disability was associated with increased poverty where poverty rates were 5 percentage points higher among people with disabilities (Table 3). Youth under age 20 were also more likely than adults age 50 and older to experience poverty by 1.0 percentage point. In contrast, individuals enrolled in school and workers whose pay includes overtime, tips, or commission had lower rates of poverty by 1.2 and 2.1 percentage points, respectively.
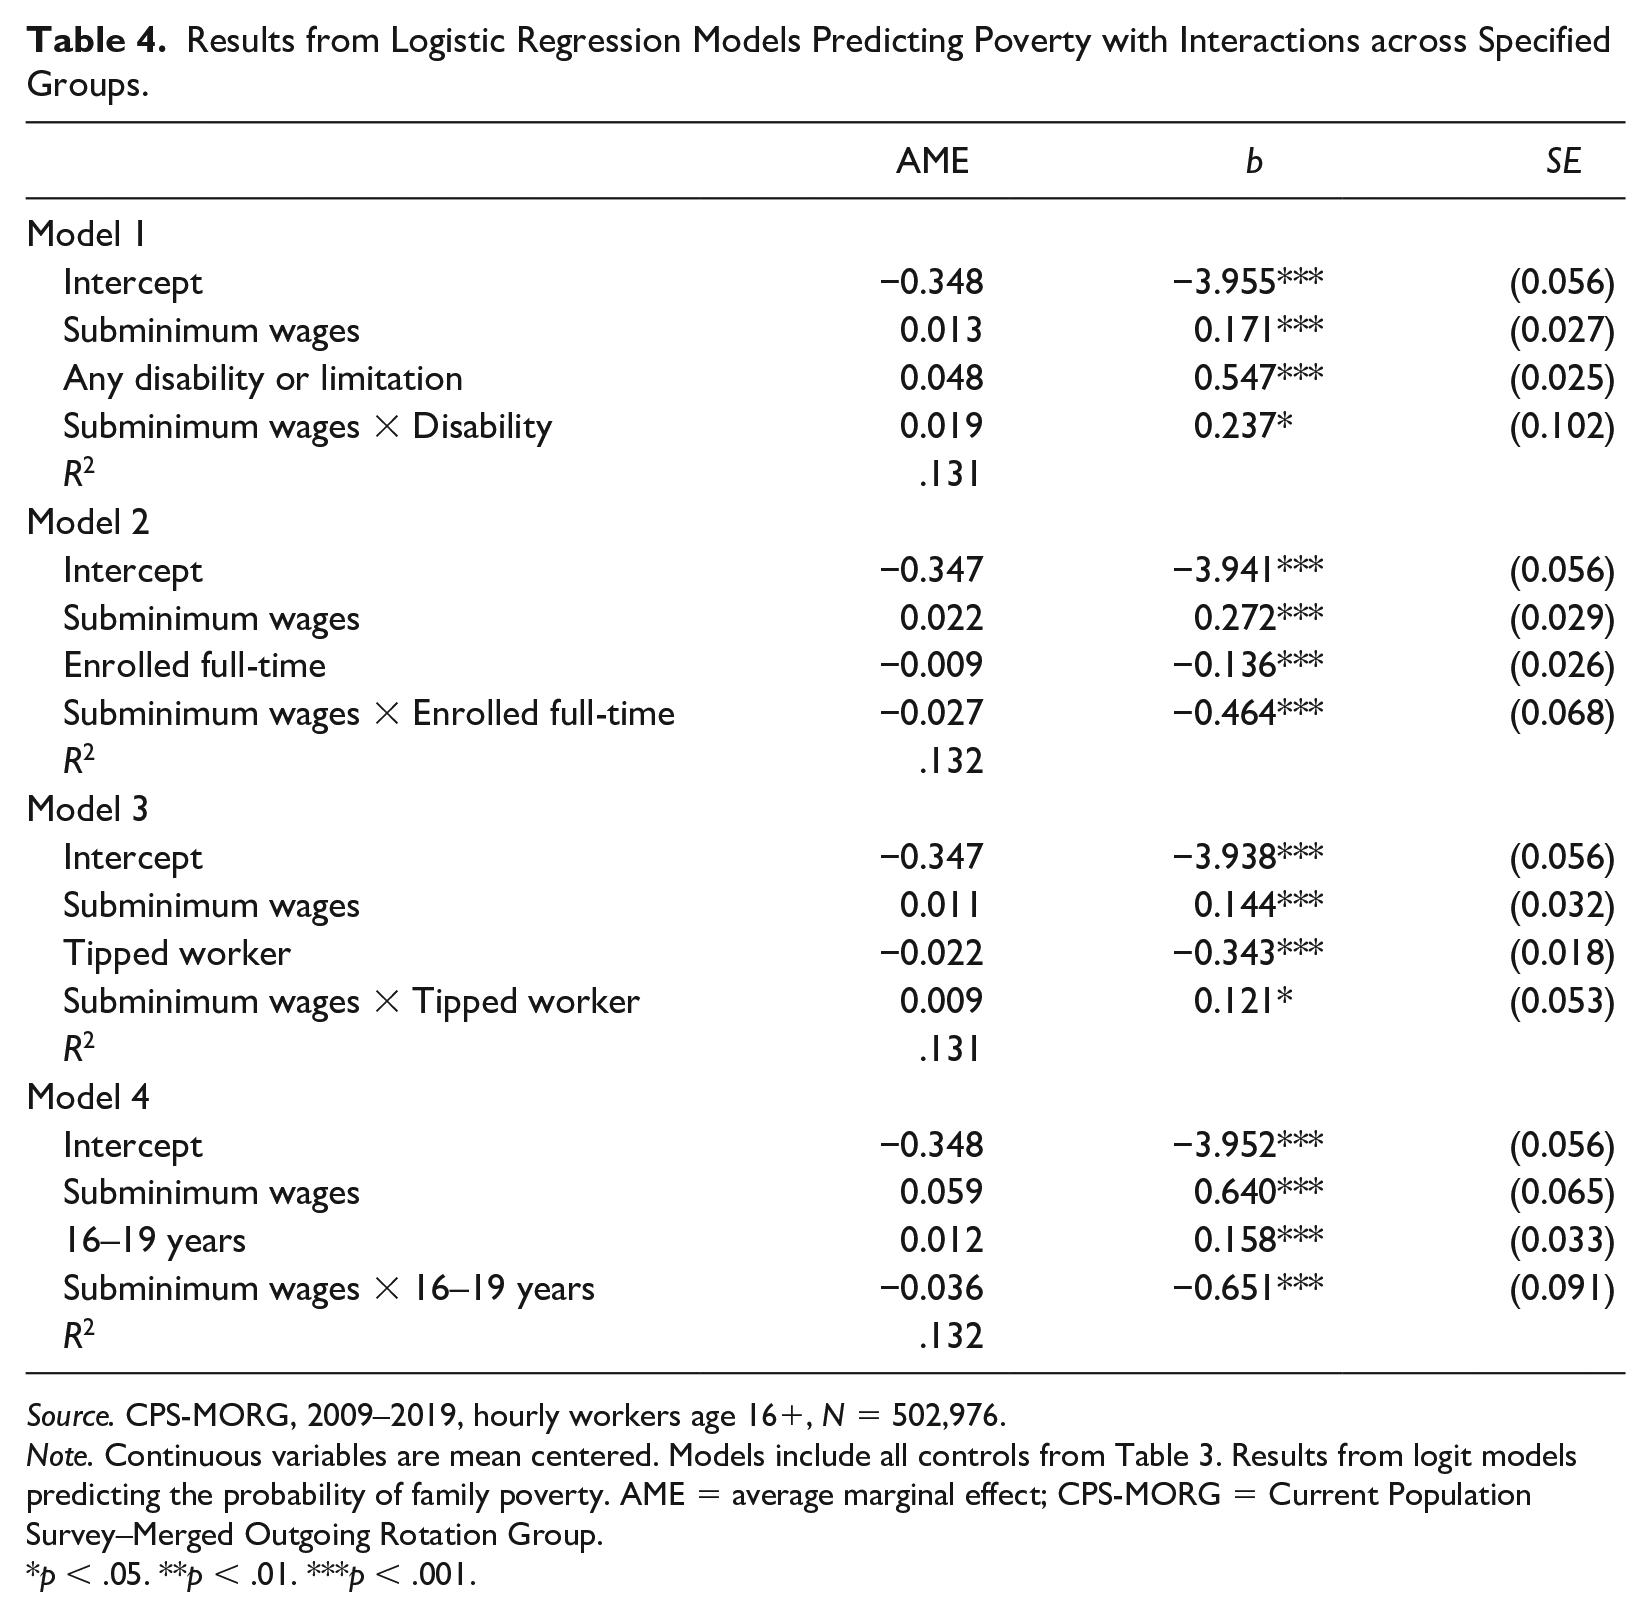
Results from Logistic Regression Models Predicting Poverty with Interactions across Specified Groups.
Source. CPS-MORG, 2009–2019, hourly workers age 16+, N = 502,976.
Note. Continuous variables are mean centered. Models include all controls from Table 3. Results from logit models predicting the probability of family poverty. AME = average marginal effect; CPS-MORG = Current Population Survey–Merged Outgoing Rotation Group.
p < .05. **p < .01. ***p < .001.
These additive results show that subminimum wages can potentially expand poverty for people with disabilities and youth and limit the benefits associated with school enrollment and tipped work. To further examine these relationships, we include a set of interaction models in Table 4 where we interact our four group variables with the receipt of subminimum wages to help understand whether the effects of subminimum wages vary across groups. In addition, we then graph the results of these models in Figure 2, which presents predicted probabilities of poverty across key groups and by subminimum wage receipt.
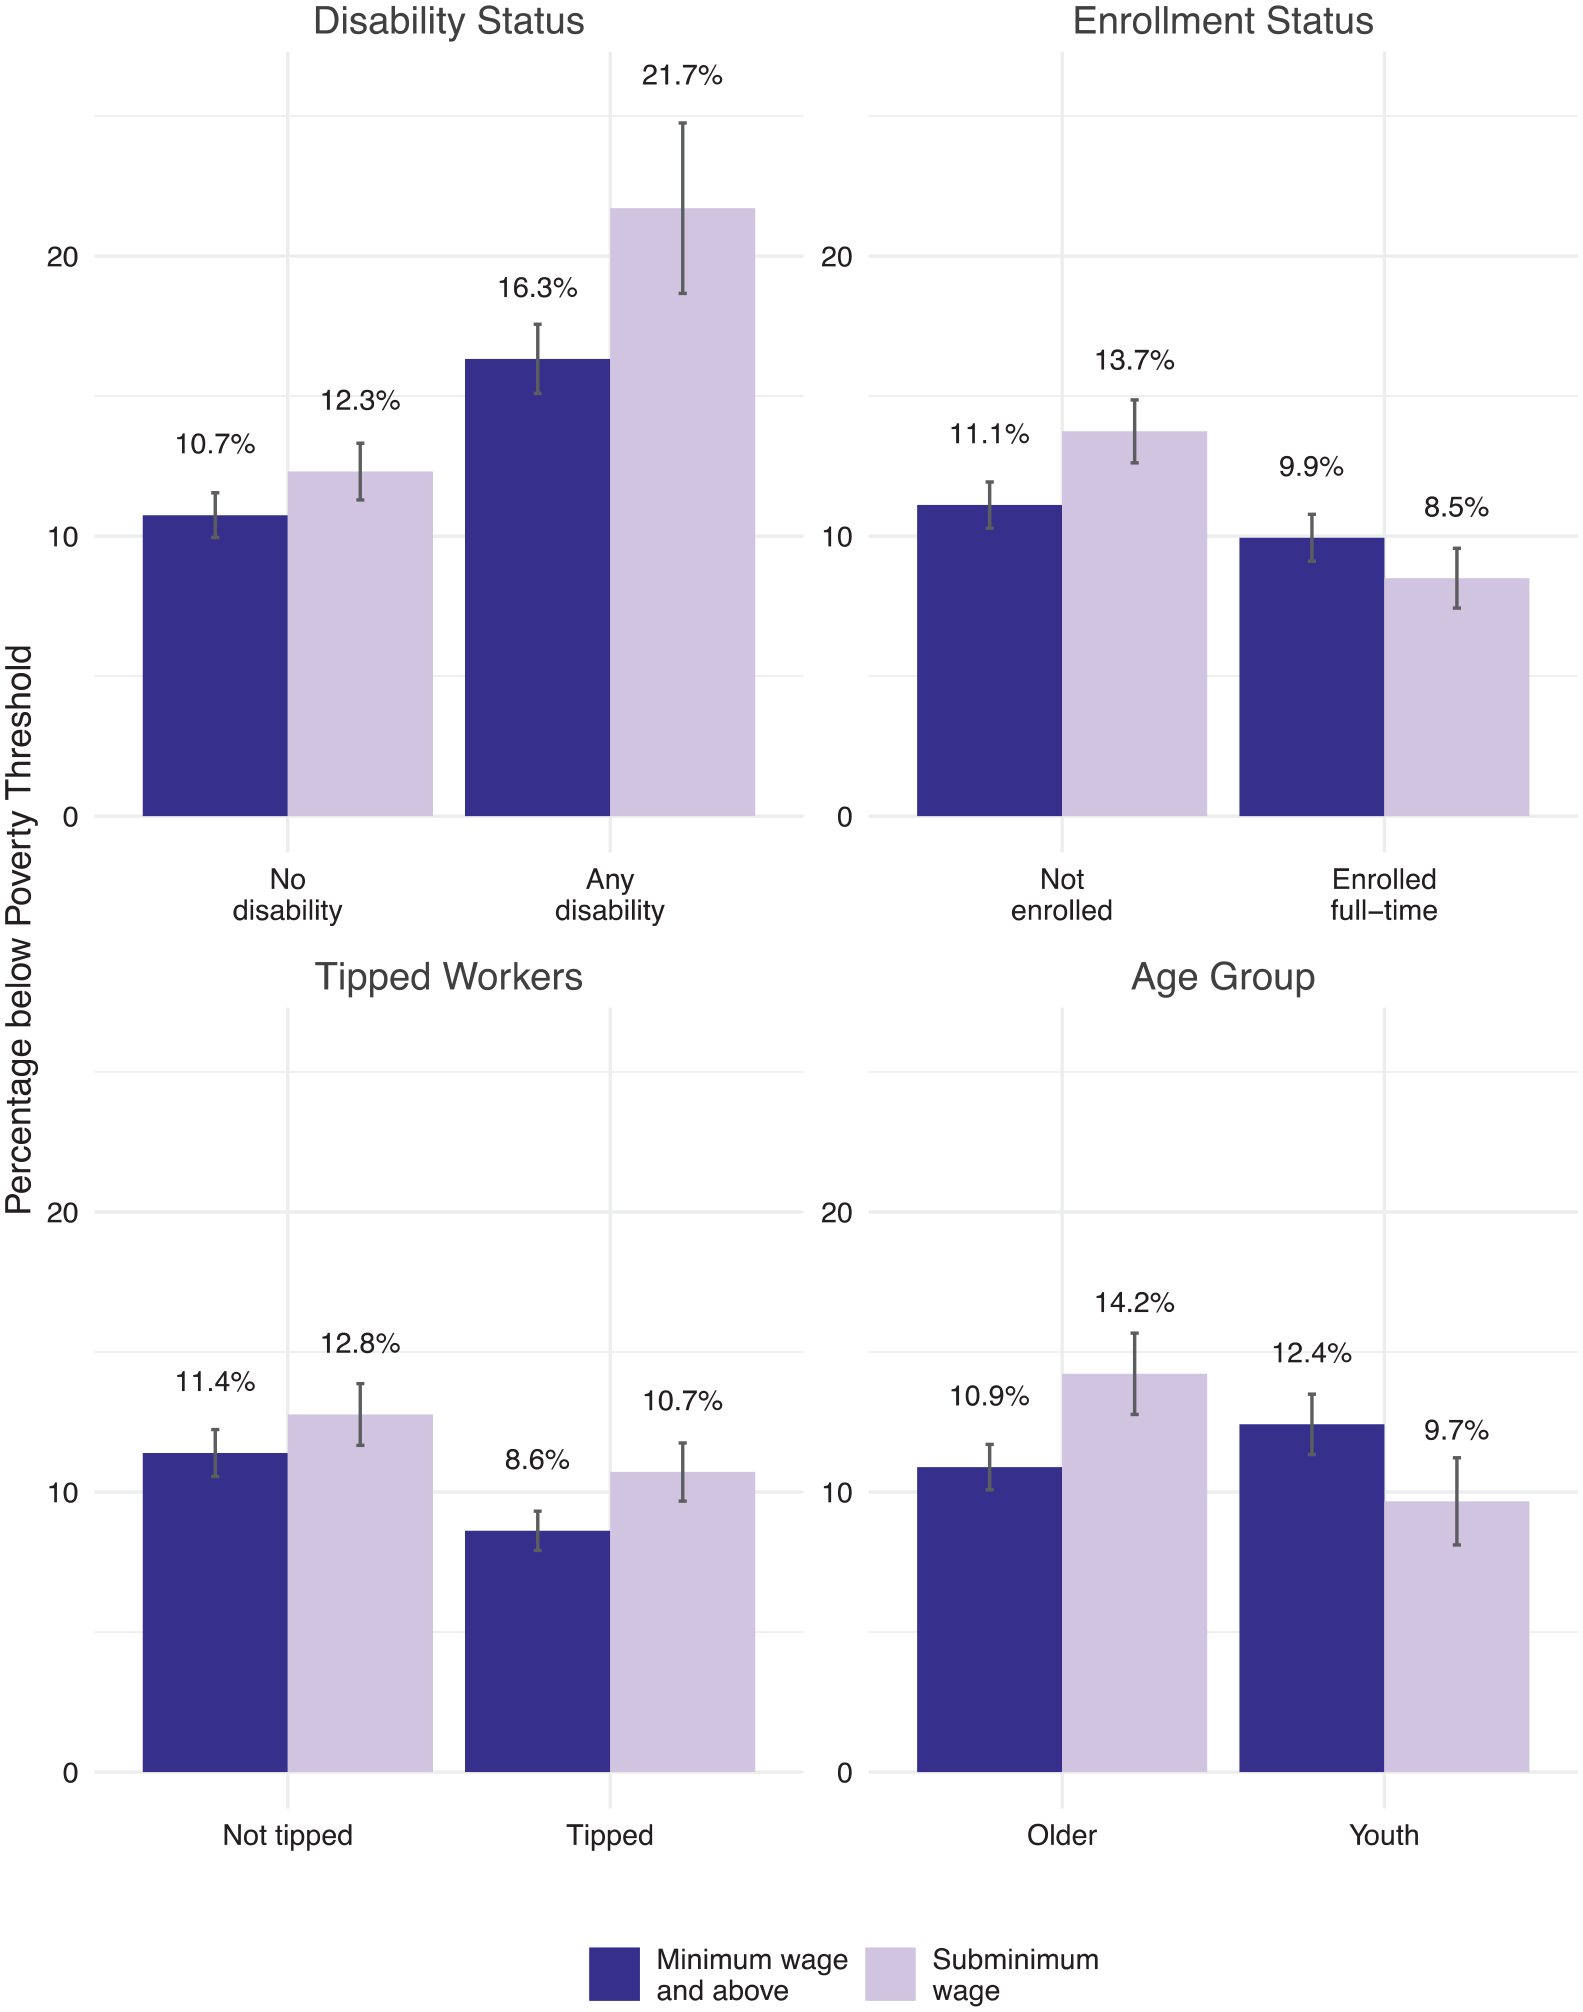
Predicted rates of poverty across groups.
The positive and significant interaction term between disability and subminimum wages indicates that the association between subminimum wages and poverty was greater for people with disabilities. In addition, subminimum wages were also associated with an increased risk of poverty among tipped workers at a greater rate than other workers. However, the negative interaction terms for students and youth show that the relationships between paying subminimum wages and poverty were weaker for people within these groups. This resulted in the varying probabilities of poverty represented in Figure 2.
Across categories, disability was associated with much higher rates of poverty regardless of whether workers received subminimum wages. However, subminimum wages were associated with exacerbated poverty for this group. On average, 21.7 percent of disabled hourly subminimum wage workers had family incomes below the poverty line, compared with 12.3 percent of subminimum wage workers without disabilities and 16.3 percent of workers with disabilities who earned the minimum wage and above. Subminimum wages were also associated with exacerbated poverty among tipped workers, but to a lesser extent with 10.7 percent of tipped subminimum wage workers living below the poverty line.
The trend was reversed for students and youth. Hourly subminimum wage workers enrolled in school full-time had some of the lowest rates of poverty with 8.5 percent falling below the poverty line. Youth receiving subminimum wages also had lower rates of poverty. Only 9.7 percent of workers in this group were experiencing poverty. In fact, subminimum wages presented stronger associations with poverty for individuals who were not enrolled in school and adults over age 20. In the case of students and young adults, contributions from other household members and support for schooling expenses likely offset some of the negative consequences of subminimum wages, which is less likely the case among people with disabilities.
Discussion
Low-wage work, the value of a minimum wage, and their relationships with poverty remain persistent political issues in the United States. Broad conversations about a living wage for all and policy proposals like the Raise the Wage Act are thought to help “the 41 million workers who struggle to make ends meet on low wages.” 12 Much sociological research demonstrates the perils associated with attempting to live on a minimum wage and with the abuses of a low-wage labor market more generally (Edin and Lein 1997; Edin and Shaefer 2016). Even with these discussions, economic and labor sociologists have largely ignored the problems presented by a subminimum wage and the groups most affected by these wage policies. Organizations like the National Federation of the Blind have for years challenged the practice of paying subminimum wages and, over the last few decades, Democratic and Republican members of Congress have sought to address subminimum pay with little success. 13
Our findings based on 11 years of CPS data show that subminimum wages, when measured according to state minimum wage cut-offs, affect 3.7 percent of hourly workers, approximately 1.5 million people. They are most common among youth, student, tipped, and disabled hourly workers, as permitted by the FLSA. For people with disabilities, subminimum wages were especially prevalent among workers with cognitive or IDL disabilities. Subminimum wage workers also tend to work in service and sales occupations and experience higher rates of family poverty with differing consequences across groups. Here, a series of interaction models highlights just how detrimental subminimum wages can be for people with disabilities. Poverty was approximately 33 percent higher among disabled subminimum wage workers compared with disabled workers with higher wages. Even though this is a small group of individuals, the strong relationship between subminimum wages and poverty calls into question the continued use of subminimum wages and broader practices in the low-wage sector more generally.
This study offers important contributions to documenting the prevalence of subminimum wages among low-wage sector workers and their associations with poverty. Despite these contributions, our study was limited by the available data. First, our use of cross-sectional data limited our ability to fully address directionality in the relationship between subminimum wages and poverty. Although previous research and theory indicate that it is likely that subminimum wages contribute to family poverty, individuals living in poverty may also be more likely to accept subminimum wages, creating a more cyclical relationship. Second, our measure of subminimum wages goes beyond measures that simply rely on federal minimum wage standards and still presents results comparable with those based on the federal minimum wage (see Supplemental Appendix C). Yet, it lacks the precision needed to estimate subminimum wage receipt at a more local level. Third, our poverty measure was also based on categorical family income data, which is not ideal. To address potential measurement issues, we include sensitivity analyses within Supplemental Appendix B. Finally, even with a large dataset, sample size limitations precluded our ability to examine how the effects of subminimum wages on poverty vary based on specific types of disabilities.
Our work also presents directions for future study. Although we show important relationships, little is known about the processes involved in assigning subminimum wages across different occupations and, information about the use of DOL certificates by specific occupation is scant. One avenue for future work includes systematically analyzing data on certificates and the firms using them, which could shed more light on variation by occupation and potential underlying motives for their use. Matched employee-employer data would also allow researchers to link workers with firms that use Section 14(c), which would help to further clarify these relationships. In addition, we focused specifically on CPS data of workers paid an hourly wage, which limited our ability to assess how salaried workers are affected by subminimum pay, especially if they are experiencing wage theft and performing unpaid work duties outside their regular hours or not being paid overtime. Future studies should further investigate how wage and salaried individuals put in time with little or entirely without compensation.
Even though subminimum wages may create new work opportunities for some groups, their usage is still problematic, especially when considering the situations of workers with disabilities. By emphasizing the negative associations between subminimum wage labor and family poverty, our research points to the importance of broader policy reforms in the area. Ultimately, however, political efforts to ban sheltered workshops and further constrain employers from finding ways around paying employees full wages in the competitive labor market will require both institutional and attitudinal transformations.
Supplemental Material
sj-docx-1-spx-10.1177_07311214221124630 – Supplemental material for Worth Less? Exploring the Effects of Subminimum Wages on Poverty among U.S. Hourly Workers
Supplemental material, sj-docx-1-spx-10.1177_07311214221124630 for Worth Less? Exploring the Effects of Subminimum Wages on Poverty among U.S. Hourly Workers by Michelle Maroto and David Pettinicchio in Sociological Perspectives
Footnotes
Declaration of Conflicting Interests
The author(s) declared no potential conflicts of interest with respect to the research, authorship, and/or publication of this article.
Funding
The author(s) received no financial support for the research, authorship, and/or publication of this article.
Supplemental Material
Supplemental material for this article is available online.
Notes
Author Biographies
References
Supplementary Material
Please find the following supplemental material available below.
For Open Access articles published under a Creative Commons License, all supplemental material carries the same license as the article it is associated with.
For non-Open Access articles published, all supplemental material carries a non-exclusive license, and permission requests for re-use of supplemental material or any part of supplemental material shall be sent directly to the copyright owner as specified in the copyright notice associated with the article.