
Abstract
Over 36% of post–9/11 era veterans have a disability, but little research has examined wounded veterans’ finances. We investigated main and interaction effects of income sources and demographic, military, and mental health characteristics on household poverty and deep poverty to better understand wounded veterans’ financial outcomes. Data were drawn from the 2018 Wounded Warrior Survey (n = 33,067). Two logistic regression models investigated direct associations between independent variables and poverty outcomes; predictive margins and average marginal effects were calculated for employment and cash transfers on outcomes. 56% of respondents reported full- or part-time employment, and 17% met criteria for household poverty. Of those, 75% met criteria for deep poverty. Cash transfers were negatively associated with poverty and deep poverty, and part-time employment was positively associated with poverty compared with not working. Employment was insufficient protection against poverty in this sample of wounded veterans—transfers were a critical bulwark.
Substantial research has been conducted with U.S. military veterans across physical, psychological, and behavioral health domains, but relatively few studies have investigated wounded or disabled veterans’ financial outcomes, including risk for poverty and deep poverty, despite links between financial and overall well-being (Oster et al., 2017; Vogt et al., 2018). Poverty thresholds are defined by the U.S. Census Bureau (Fontenot et al., 2018) and represent income levels beneath which individuals or families lack adequate financial resources to provide the necessities of life, like food and shelter. For U.S. adults in the general population who live with a disability, the risk of poverty is substantial; the National Council on Disability’s (NCD) 2018 progress report showed that 29% of people with disabilities live in poverty compared with 12% of people without disabilities (NCD, 2018). In contrast, a 2015 U.S. Department of Veterans Affairs (VA) report demonstrated veterans with a service-connected disability have a significantly lower poverty rate when compared with civilians with a disability, likely due to income from VA cash transfers and additional benefits (U.S. Department of VA, 2015). Wounded veterans can apply to be evaluated following discharge by the VA to determine their percentage of service-connected disability, ranging from 0% to 100%, which may entitle them to monthly cash compensation (U.S. Department of VA, 2020). In addition, VA administers six categories of (nonmedical) benefits, including pension and burial services, education grants, insurance, home loans, veteran readiness and employment programs, and transition and economic development programs, but the largest outlay is in the form of cash transfers to military veterans who have been injured as a result of their service.
According to the U.S. Census Bureau data, post–9/11 era veterans are significantly more likely to have a service-connected disability and a disability rating of 70% or more when compared with veterans from other time periods (Vespa, 2020). In addition, research suggests that post 9/11 era veterans have a higher burden of mental health symptoms than veterans of previous eras; 41% of post 9/11 era veterans have some need for mental health services, and those who experienced combat or have a disability demonstrate increased risk for mental health disorders (Waszak & Holmes, 2017). This burden of psychological distress and service-connected disability is associated with financial hardships, including difficulty finding employment (National Academies of Sciences, Engineering, and Medicine, 2018). About 53% of post–9/11 veterans report trouble finding employment after leaving the military, with younger veterans experiencing higher rates of unemployment, homelessness, and poverty (U.S. Department of VA, 2015). A 2017 report from the National Center for Veterans Analysis and Statistics showed that 7.6% of all post–9/11 veterans lived in poverty compared with 6.8% of all other veterans.
A wide array of research efforts with military veterans has rightly targeted psychosocial outcomes like mental and physical health, while studies related to veterans’ financial well-being have chiefly focused on homelessness (Tanielian et al., 2008). Fewer studies have investigated associations between income sources that comprise wounded veterans’ total household income, including cash transfers delivered through VA or other government entities, veteran and spousal income earned through work, and associations with household poverty. Such investigations are of value for two key reasons. First, as in the general population, veterans’ financial health and stability are inextricably linked to broader health outcomes, particularly mental health and well-being (Elbogen et al., 2020). Financial stressors (e.g., inability to pay bills or afford essential goods) along with deficits in money management skills (e.g., high debt) are linked to a range of negative outcomes from suicide to substance misuse and homelessness (Elbogen et al., 2020). Improving veterans’ financial outcomes can thus provide an efficient pathway to reducing additional domains of vulnerability. Second, a better understanding of how poverty is affected by income sources, including cash transfers and employment, could help in developing interventions and policies to better target veteran subgroups at greatest risk for poverty. Thus, empirical research investigating wounded veterans’ financial outcomes is crucial to supporting the overall health and well-being of this population in the aftermath of two decades of war.
U.S. Military Veterans and Disability Status
Research shows that military service members experience a broad range of stressors in the scope of their service, beginning with high intensity, physically and emotionally demanding basic and occupational training (Bray et al., 2001). Even when not deployed, service members may be expected to work in austere conditions with unpredictable schedules while maintaining a high level of physical fitness. Perhaps due to the more frequent and concurrent deployments and combat zone exposure that characterized the post–9/11 era conflicts in Afghanistan and Iraq, veterans of these conflicts experience a higher risk for severe injuries compared with veterans of previous conflict eras. About three quarters of post–9/11 era veterans were deployed compared with 58% of pre–9/11 era veterans; post–9/11 era veterans were also twice as likely to have served in a combat zone (Parker et al., 2019). As a result, VA data (U.S. Department of VA, 2018) show that a higher percentage of post–9/11 era veterans have a service-connected disability (35.9%) compared with veterans of other eras (18.6%). In 2020, VA reported that the most common service-connected disabilities among veterans were hearing problems, musculoskeletal problems, posttraumatic stress disorder (PTSD), scars, and migraines (U.S. Department of VA, 2020). About one third of post–9/11 era veterans say they have suffered from posttraumatic stress as a result of military service compared with about 14% of pre–9/11 era service members.
Disability and Poverty
Post–9/11 veterans are more likely to report readjustment to civilian life as difficult compared with pre–9/11 veteran (Parker et al., 2019). Re-integration into civilian life can be challenging due to sense of loss and psychosocial trauma experienced during service, creating additional obstacles to finding and maintaining civilian employment (Waszak & Holmes, 2017). From 2005 to 2013, veterans aged 18 to 34 had the highest unemployment rate for the post–9/11 era (U.S. Department of VA, 2015). In addition, compared with other veterans, post–9/11 era veterans were more likely to be in a home receiving supplemental nutrition benefits (7.1% vs. 6.1%), be without health insurance (5.6% vs. 2.3%) and be in poverty (7.6 vs. 6.8%; Parker et al., 2019).
Disability is often both a cause and a consequence of poverty in the general population. In the United States, cash assistance provided through Social Security Disability Income (SSDI) to workers with a work-limiting disability is difficult to obtain and subject to narrow eligibility criteria. Without income from work or SSDI, individuals with disabilities are likely to live in poverty, which in turn raises additional barriers to care for health and mental health conditions that, when untreated or undertreated, may contribute to a cycle of disability and unemployment. Conversely, being employed or living in a household where the head of household is employed full-time has traditionally kept many people out of poverty. Research shows that in the general population, those who work less than full-time have a poverty rate of 27%, while those without a job have a poverty rate of 52% (Haveman et al., 2015). Thus, poor health and the presence of work-limiting disability increase the risk of economic hardship (Heflin et al., 2012).
Military veterans with service-connected disabilities represent a unique population for several reasons, including their access to comprehensive, affordable health care from the U.S. Veterans Health Administration (VHA) and their entitlement to cash transfers based on their disability status. However, research examining the economic well-being of veterans in the United States, particularly disabled veterans, is in short supply, and the interplay between veteran status, disability, and poverty is both complex and underexplored in the veteran literature. Studies show that veteran households overall are less likely to be in poverty than nonveteran households or households with nonveteran disabled family member (London et al., 2011). However, for households with a disabled veteran or other family member, this protective effect is substantially diminished, and households with a disabled veteran endorse the highest odds of material hardship among households with a disabled nonveteran and households with no disabled members and no veterans (Wilmoth et al., 2015). This finding is unexpected, as veterans with service-connected disabilities ought to have greater access to cash transfers and other resources and benefits through the VA.
Although most earlier studies of veterans’ financial outcomes did not examine poverty status and its correlates among disabled veterans, one important study by Heflin and colleagues (2012) compared four different hardships among disabled and nondisabled veterans, including home, medical, bill paying and food insufficiency. Independent variables in this study were disability status of the veterans and personal characteristics like race or ethnicity, highest education in the household, marital status, age of the children and whether the household lived in an urban setting. This study’s key finding was that disabled veterans experienced each type of hardship more so than nondisabled veterans.
However, the Heflin and colleagues (2012) study relied on participant’s perceptions of the type of hardships they experienced rather than using the total amount of annual income participants received during the previous year. In contrast, our study uses the measure of annual income rather than perceived hardship, which can be considered a more objective measure. Moreover, and very importantly, the earlier study did not measure transfer income or control for other VA benefits. This limitation was acknowledged by the authors who realized that income sources and benefits received from the VA are important determinants of hardship. In contrast, our study accounts for income sources and controls for noncash benefits from the VA. Finally, while the earlier study controlled for some personal characteristics aside from disability, it failed to control for mental health problems such as PTSD or depression. Depression or other mental health factors can affect employment and in turn the ability to make ends meet. Thus, earlier findings of related research laid the foundation for our study’s objectives, research questions, and independent variable selection.
Specific Aims
This study aimed to build knowledge related to associations among poverty and deep poverty outcomes and demographic characteristics, military-specific characteristics, mental health conditions, and income sources in wounded post–9/11 era military veterans. To achieve this aim, we investigated two related research questions:
Deep poverty, often referred to as extreme poverty, is an underexplored issue, particularly for wounded veterans. Deep poverty reminds us that there are gradations of poverty. Among other hardships, deep poverty may lead to homelessness, food insecurity, and major health problems (Cuddy et al., 2015).
Method
Participants and Procedures
The study sample comprised military veterans who completed Wounded Warrior Project’s (WWP) Annual Warrior Survey (AWS) in 2018 (n = 33,067). The AWS was developed by WWP to measure a series of outcomes within domains including military experiences, physical and mental well-being, and financial wellness. The AWS allows WWP to identify trends among the population it serves, compare outcomes to other military populations, and inform program and policy efforts. Veterans and military service members registered with WWP on or before January 31, 2018 (“warriors”) were invited via email to participate in the annual web-based census survey. Eligibility criteria for membership in WWP include serving in the military on or after September 11, 2001, and incurring a service-connected physical or mental injury, illnesses, or wound. A total of 98,055 warriors in the WWP member database with a valid email address were eligible for the survey. Data collection was conducted for 8 weeks, from March 20, 2018, to May 14, 2018. Of the eligible warriors, 33,067 voluntarily completed the survey yielding a 33.7% response rate. Participants who completed the survey were offered a WWP-branded Swiss Army multitool. This analysis was exempted from full review by the university Institutional Review Board because it employs deidentified secondary data provided by WWP.
Dependent Variables
Poverty and Deep Poverty
We used the Official Poverty Measure (OPM) to determine how far below the poverty threshold veterans’ pretax family income fell. The Census Bureau provides poverty thresholds each year adjusted by family size and age of family members. When the OPM was created in the 1960s, the poverty thresholds by family size and various other configurations were calculated as three times the subsistence of a food budget (the Economy Food Plan) as defined by the U.S. Department of Agriculture. The factor of three was used because at the time the average family of two or more spent one-third of their income on food (Haveman et al., 2015). Deep poverty for an individual or family is calculated as 50% of the poverty threshold for that year.
Dependent Variable Calculations
Because the U.S. census determines the poverty threshold by family size, it was necessary to first calculate total family income and then determine whether family income fell below the poverty line. When there was only one individual’s income present (no spouse and no spousal income reported), then family size was coded as one. We used three income variables to estimate participants’ total family income, including the individual veteran’s income earned through work, spousal income, and cash transfers received through VA or non-VA sources like SSDI, Supplemental Security Income, or Worker’s Compensation.
It was not possible to determine precise total family income with the raw data in hand because each of the three above income variables was recorded as an interval (e.g., US$1,000 to US$4,999). Thus, our best estimation was to assign a midpoint value to each of the three income variables. For example, if an individual’s income belonged to the interval of US$1,000 and US$4,999, then the midpoint assigned was US$2,999. After assigning a midpoint value to individual veteran’s earned income, spouse’s income, and veteran’s transfer income, we were able to estimate each family’s total income. To be included in the final sample, at least one member in the family (veteran or spouse) needed to have a recorded income value through work or transfers. For example, if the veteran’s income was left blank but the spouse had some income, the total income included the spouses’ income only and the veteran was included in the sample. If the veteran’s earned income, spouse, and transfer incomes were all left blank, then the veteran was not included in the sample.
In sum, total family income by family size was estimated in three steps. First, we estimated each veteran’s gross income earned from work in the past 12 months based on the veteran’s selected income interval for this variable. The variable captured gross wages, bonuses, overtime earnings, tips, commission, and profit from self-employment. Second, we estimated how much income the veterans’ spouse received from work in the previous 12 months based on the selected income interval for the spousal income variable. Finally, we estimated how much income the veteran received from cash transfers including military service-connected compensation and government transfer programs.
To determine whether a family’s income fell below the poverty threshold, we generated a variable capturing totally family income by family size. Family size was determined by the item “Including yourself, how many people in your household are supported by your household income (your own income plus your spouse’s or partner’s income if any)?” After estimating total family income by family size, we generated a dichotomous variable capturing whether a family’s income fell below the poverty threshold by using the 2017 U.S. Census Bureau poverty thresholds (the year referenced by the survey items). To determine whether a family was in deep poverty in 2017, we calculated deep poverty by family size as 50% of the poverty threshold consistent with the U.S. Census Bureau’s definition.
Independent Variables
Sample Characteristics
Participant-reported categorical variables included age; race; gender; marital status; level of education; service-connected disability rating; National Guard or Reserve status; full-time, part-time, or no employment in the past year; and whether or not they received transfer income in the last year.
Depression
The Patient Health Questionnaire–8 (PHQ-8; Kroenke et al., 2009) dichotomized at the recommended cut score of 10 was used to capture probable depression. The PHQ-8 is a brief measure of the severity of depression. The measure contains eight items rated on a four-option scale from “not at all” to “nearly every day” using a timeframe of “over the previous 2 weeks,” and the sum of the items is retained as a measure of depression severity. PHQ-8 total score for the eight items ranges from 0 to 24. Scores of 5, 10, 15, and 20 represent cut points for mild, moderate, moderately severe, and severe depression, respectively. A cutoff score of 10 was used in this study. Cronbach’s alpha in the current sample was .92.
Posttraumatic Stress Disorder
The Primary Care PTSD Screen for Diagnostic and Statistical Manual of Mental Disorders (4th ed.; DSM-IV; American Psychiatric Association, 1994; PC-PTSD-4; Prins et al., 2016) dichotomized at the recommended cut score of 3 was used to capture probable PTSD. The measure asks respondents who indicate they have been exposure to a traumatic event to answer four yes/no questions about how exposure to that event has affected them over the past month. Examples of questions include “In the past month have you had nightmares about the event(s) or thought about the event(s) when you did not want to and have you felt numb or detached from people, activities or your surroundings?” Results from validation studies suggest a score of 3 or above indicates probable PTSD (Prins et al., 2016). Cronbach’s alpha in the current sample was .86.
Analyses
We first computed a range of sample descriptive statistics and frequencies for poverty and deep poverty outcomes by family size. Next, we employed a logistic regression modeling strategy to investigate associations between the independent variables age, gender, race, education, marital status, National Guard or Reserves status, VA disability rating, PSTD and depression screens, employment status, receipt of cash transfers in the last 12 months, and family poverty and deep poverty outcomes. Model one examined associations between independent variables and family poverty. After examining main effects, predictive margins for employment status on the probability of poverty when receiving transfers versus not and average marginal effects (AMEs) on the probability of poverty for receiving cash transfers across employment categories were also modeled. Model two retained independent variables from Model 1 and examined associations between independent variables and the outcome family income below the deep poverty threshold in the subsample of those in poverty. All statistical analyses were conducted in STATA 14.2.
Results
Sample Characteristics
The final analytic sample with estimated family income values comprised 33,016 respondents. Table 1 summarizes the sample characteristics for the full sample and the subsample (n = 5,456) of veterans with estimated household income below the poverty threshold. Respondents ranged from 20 to 76 years of age with a mean age of 41 (SD = 8.49). Respondents were predominantly male (84%), White (58%), married (68%) and had completed at least some college (90%). About 7% of the sample was employed part-time, with the majority reporting either full-time (47%) or no employment (46%). The average family size was three (SD = 1.65). A high degree of mental health burden was evident in the sample; 63% of respondents screened positive for depression while 74% screened positive for PTSD. About 73% received some form of cash transfers in the past year. About 9% reported income above US$80,000, and about 6% reported over US$80,000 in spousal income. About 7% of the sample had income from cash transfers of less than US$10,000 during the past 12 months. About 4% reported transfer income over US$75,000.
Sample Characteristics.
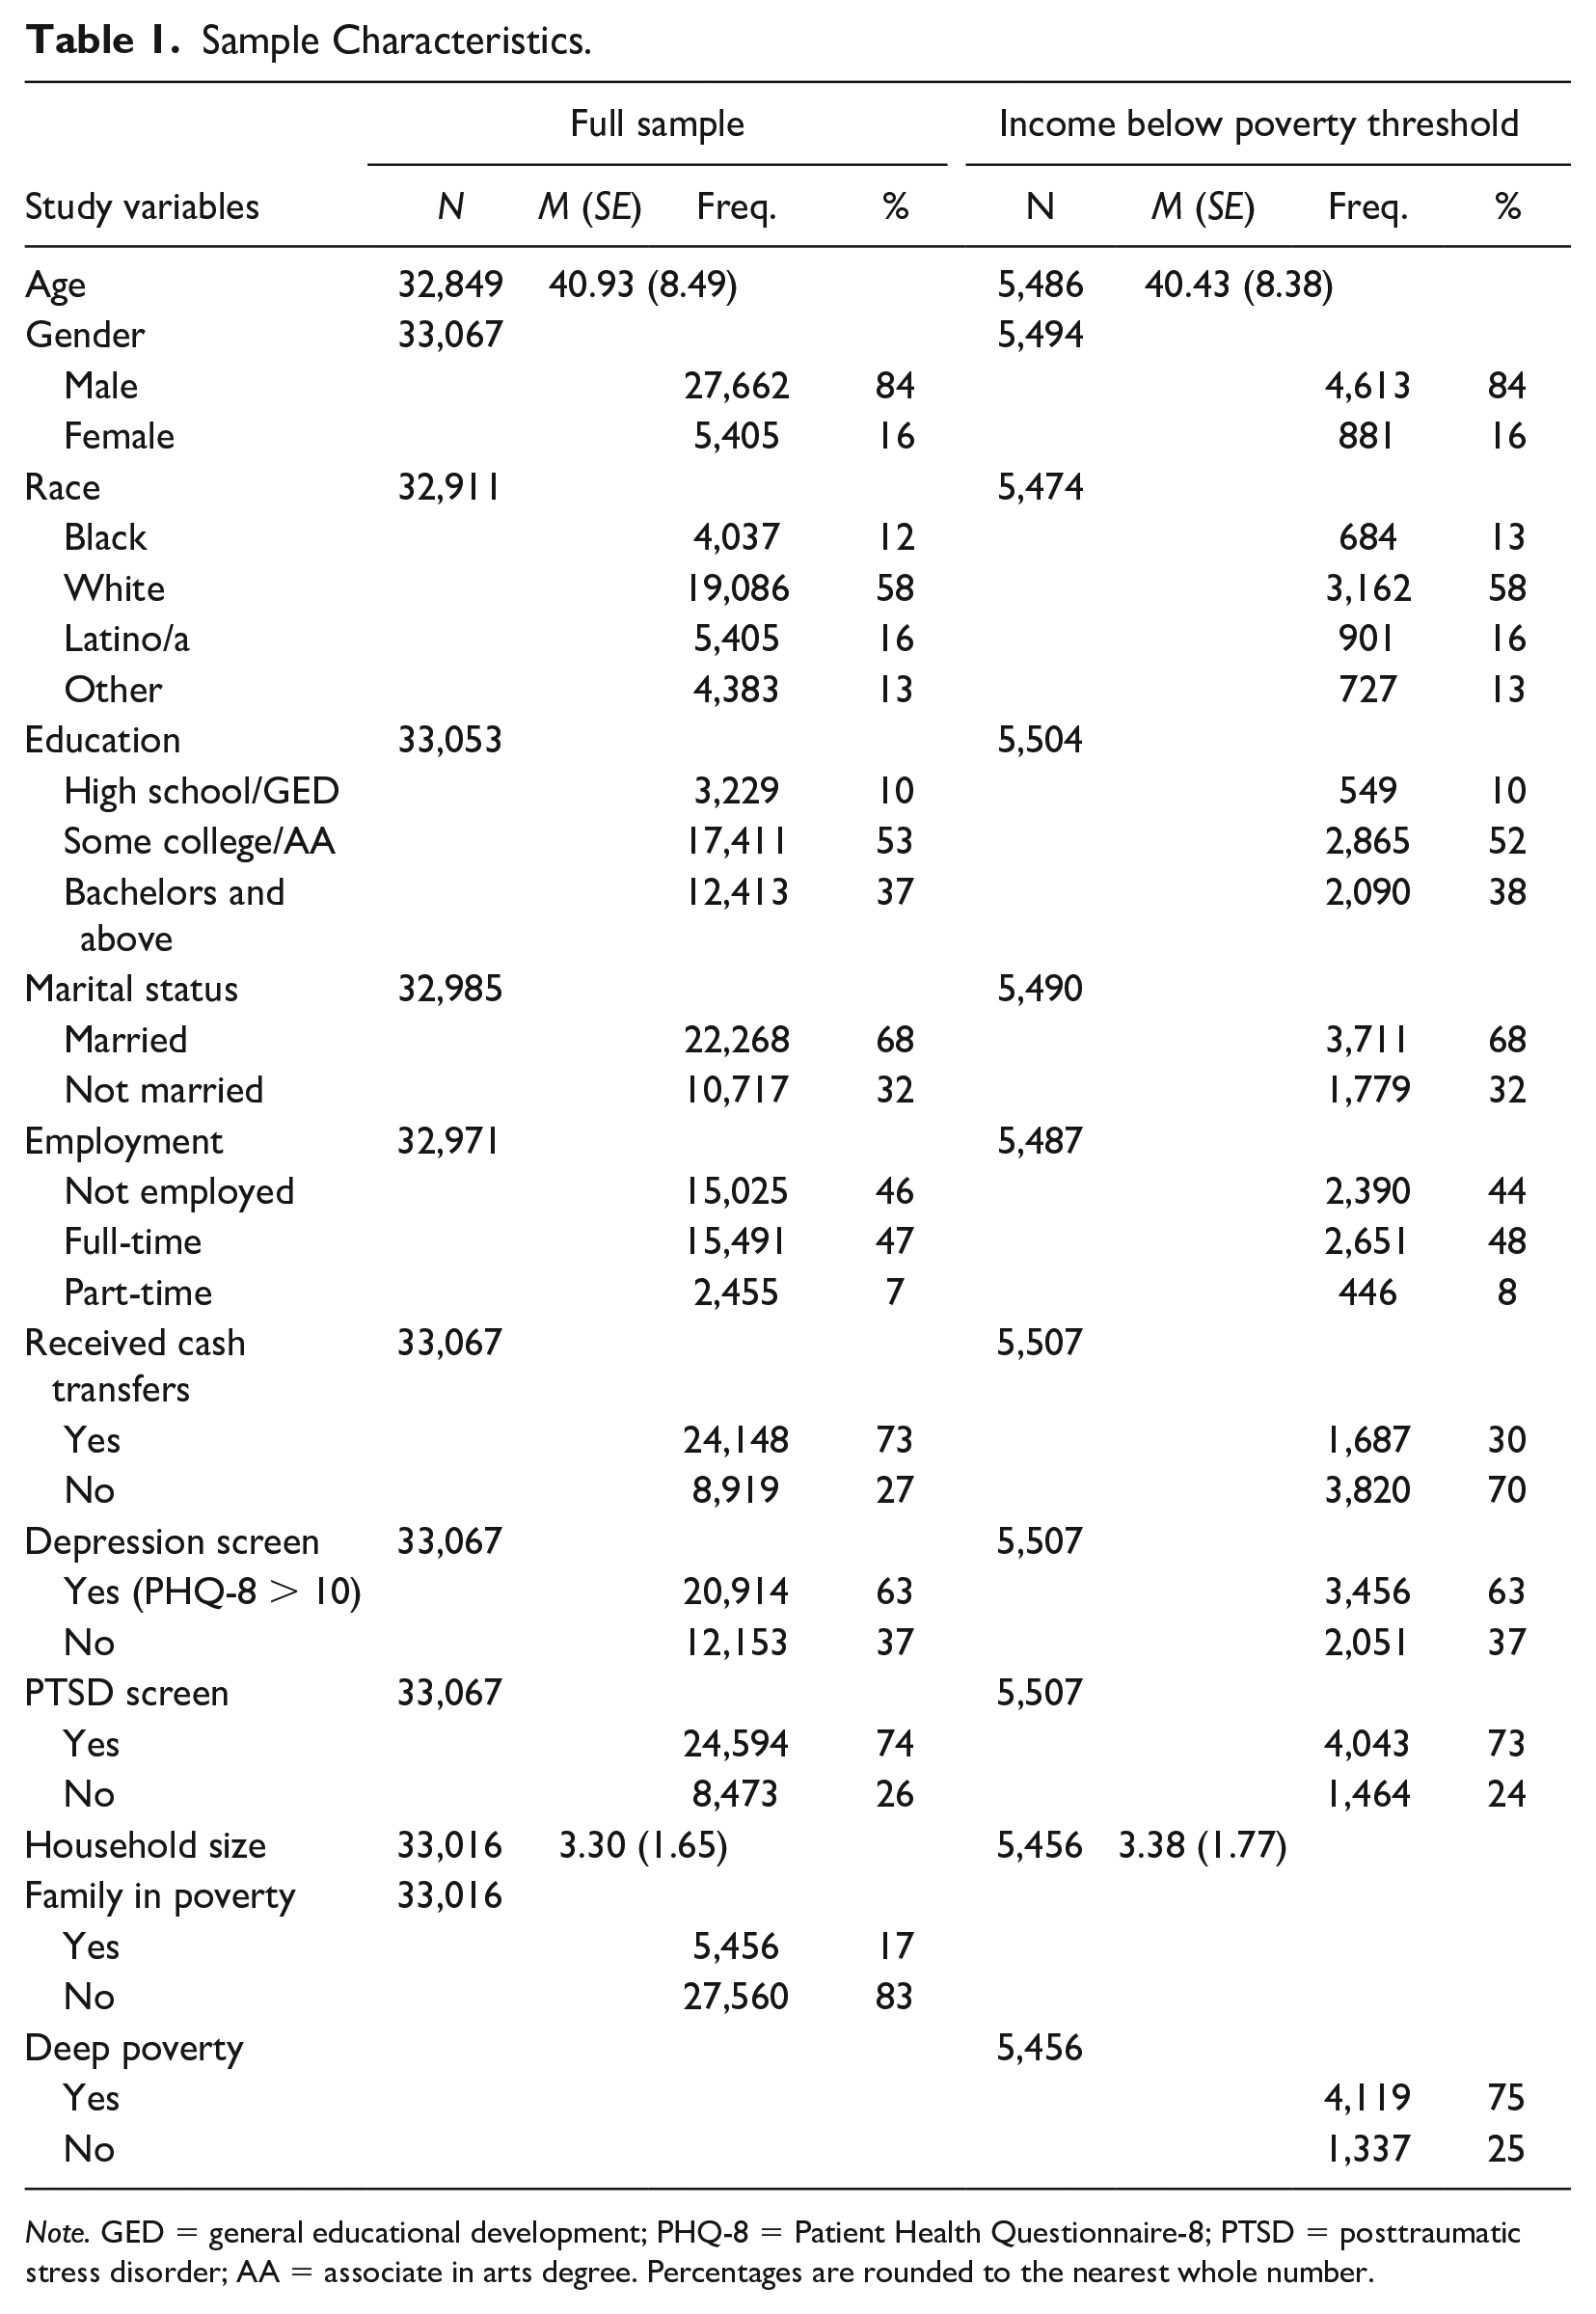
Note. GED = general educational development; PHQ-8 = Patient Health Questionnaire-8; PTSD = posttraumatic stress disorder; AA = associate in arts degree. Percentages are rounded to the nearest whole number.
Family Income and Poverty
Overall, the demographic characteristics of those estimated to be in poverty resembled the characteristics of the full sample. Those in poverty were predominately male (84%), White (58%), married (68%), and most had completed at least some post high school education (90%). The average age was 41 (SD = 8.38). Eight percent were employed part-time, with the majority reporting either full-time (48%) or no employment (44%). Average household size was three people. However, while 73% of individuals in the full sample reported receiving cash transfers in the previous year, only about 31% of those in poverty reported receiving cash transfers. Those in poverty had nearly identical rates of positive PTSD and depression screens compared with those overall sample; 63% of those in poverty met the diagnostic criteria for depression and 73% met the diagnostic criteria for PTSD. Notably, 75% of those in poverty also met the criteria for living in deep poverty.
Table 2 shows the percentage of families with incomes falling below the poverty threshold and the fraction of those in deep poverty by family size.
Poverty and Deep Poverty by Family Size.
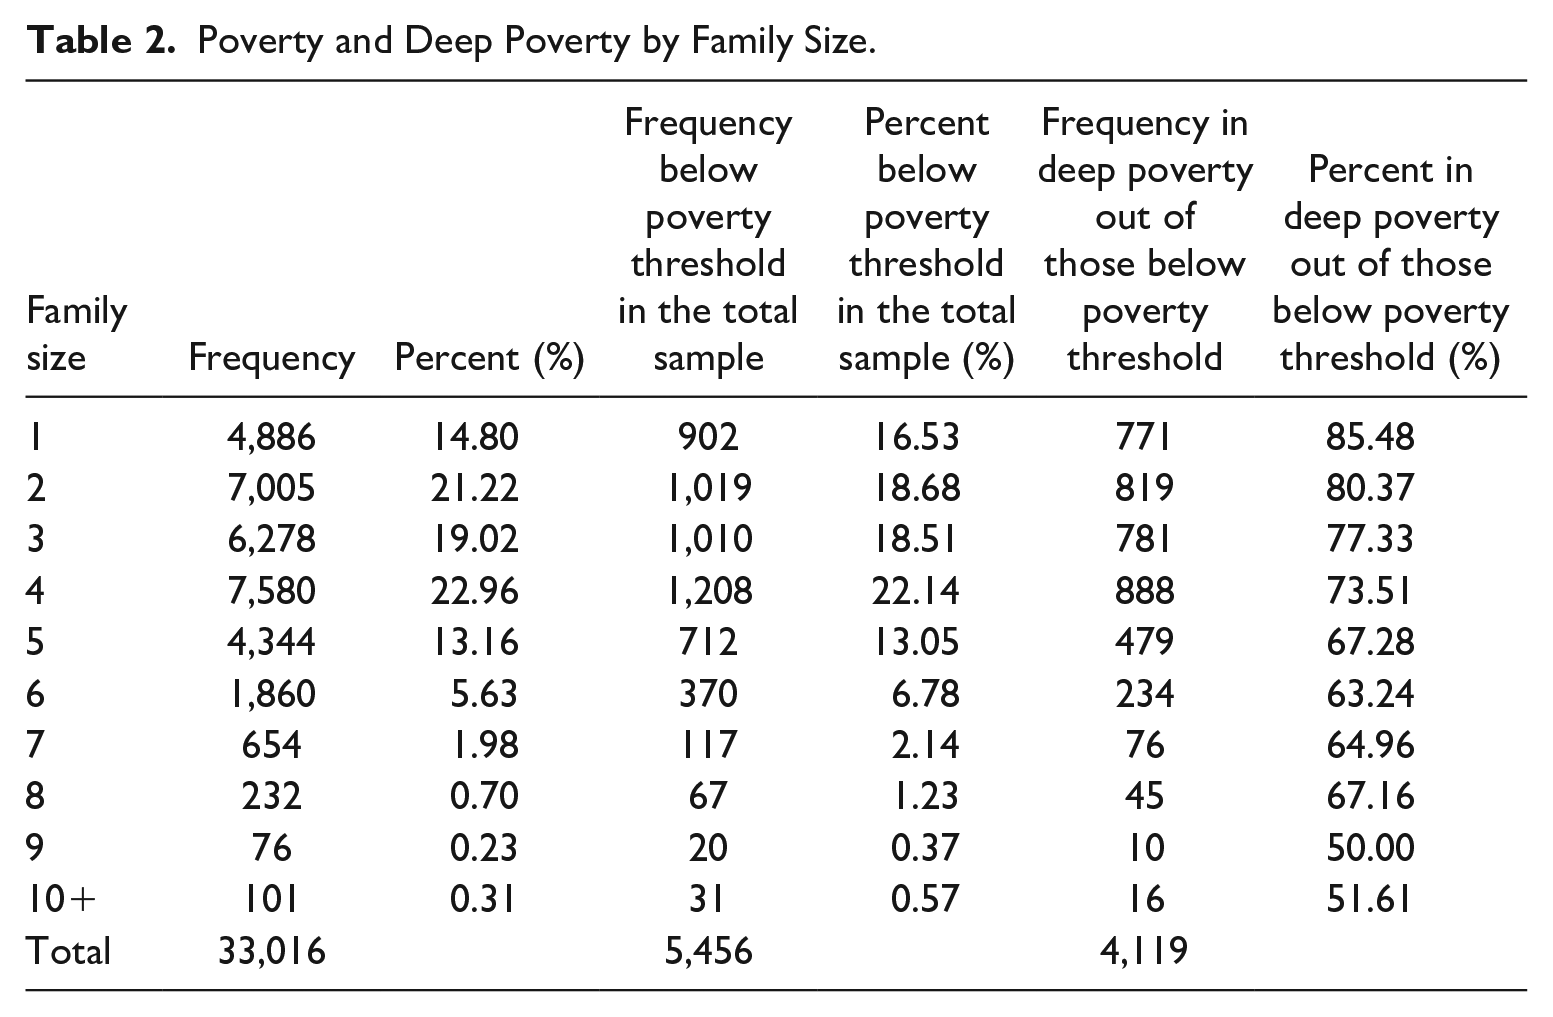
Most families (73%) had four or fewer members and less than 1% had 10 or more members. About 17% of families had incomes falling under the poverty threshold; in comparison, the figure for the general population in 2017 was about 12% (Fontenot et al., 2018). However, compared with the figure for general population individuals with a disability living in poverty, about 25% in 2017 (Fontenot et al., 2018), the sample estimate is considerably lower. The 75% of families in poverty who were also in deep poverty represents a much larger percentage than the one found in the general population, where only 44% of households in poverty fall under the deep poverty threshold (Haveman et al., 2015). As Table 2 shows, the percentage of those in poverty who were also in deep poverty decreased with family size, from 85% for a family of one to about 50% for large families of nine or more.
Multivariable Results
Model 1 (Table 3) demonstrated significant associations for the outcome family poverty and age (odds ratio [OR] = 0.993, 95% confidence interval [CI] = [0.989, 0.997]) receiving cash transfers (OR = 0.098, 95% CI = [0.091, 0.104]) and part-time employment relative to not being employed (OR = 1.156, 95% CI = [1.018, 1.313]).
Odds Ratios and 95% Confidence Intervals for Independent Variables and Household Income Below the Poverty Threshold.
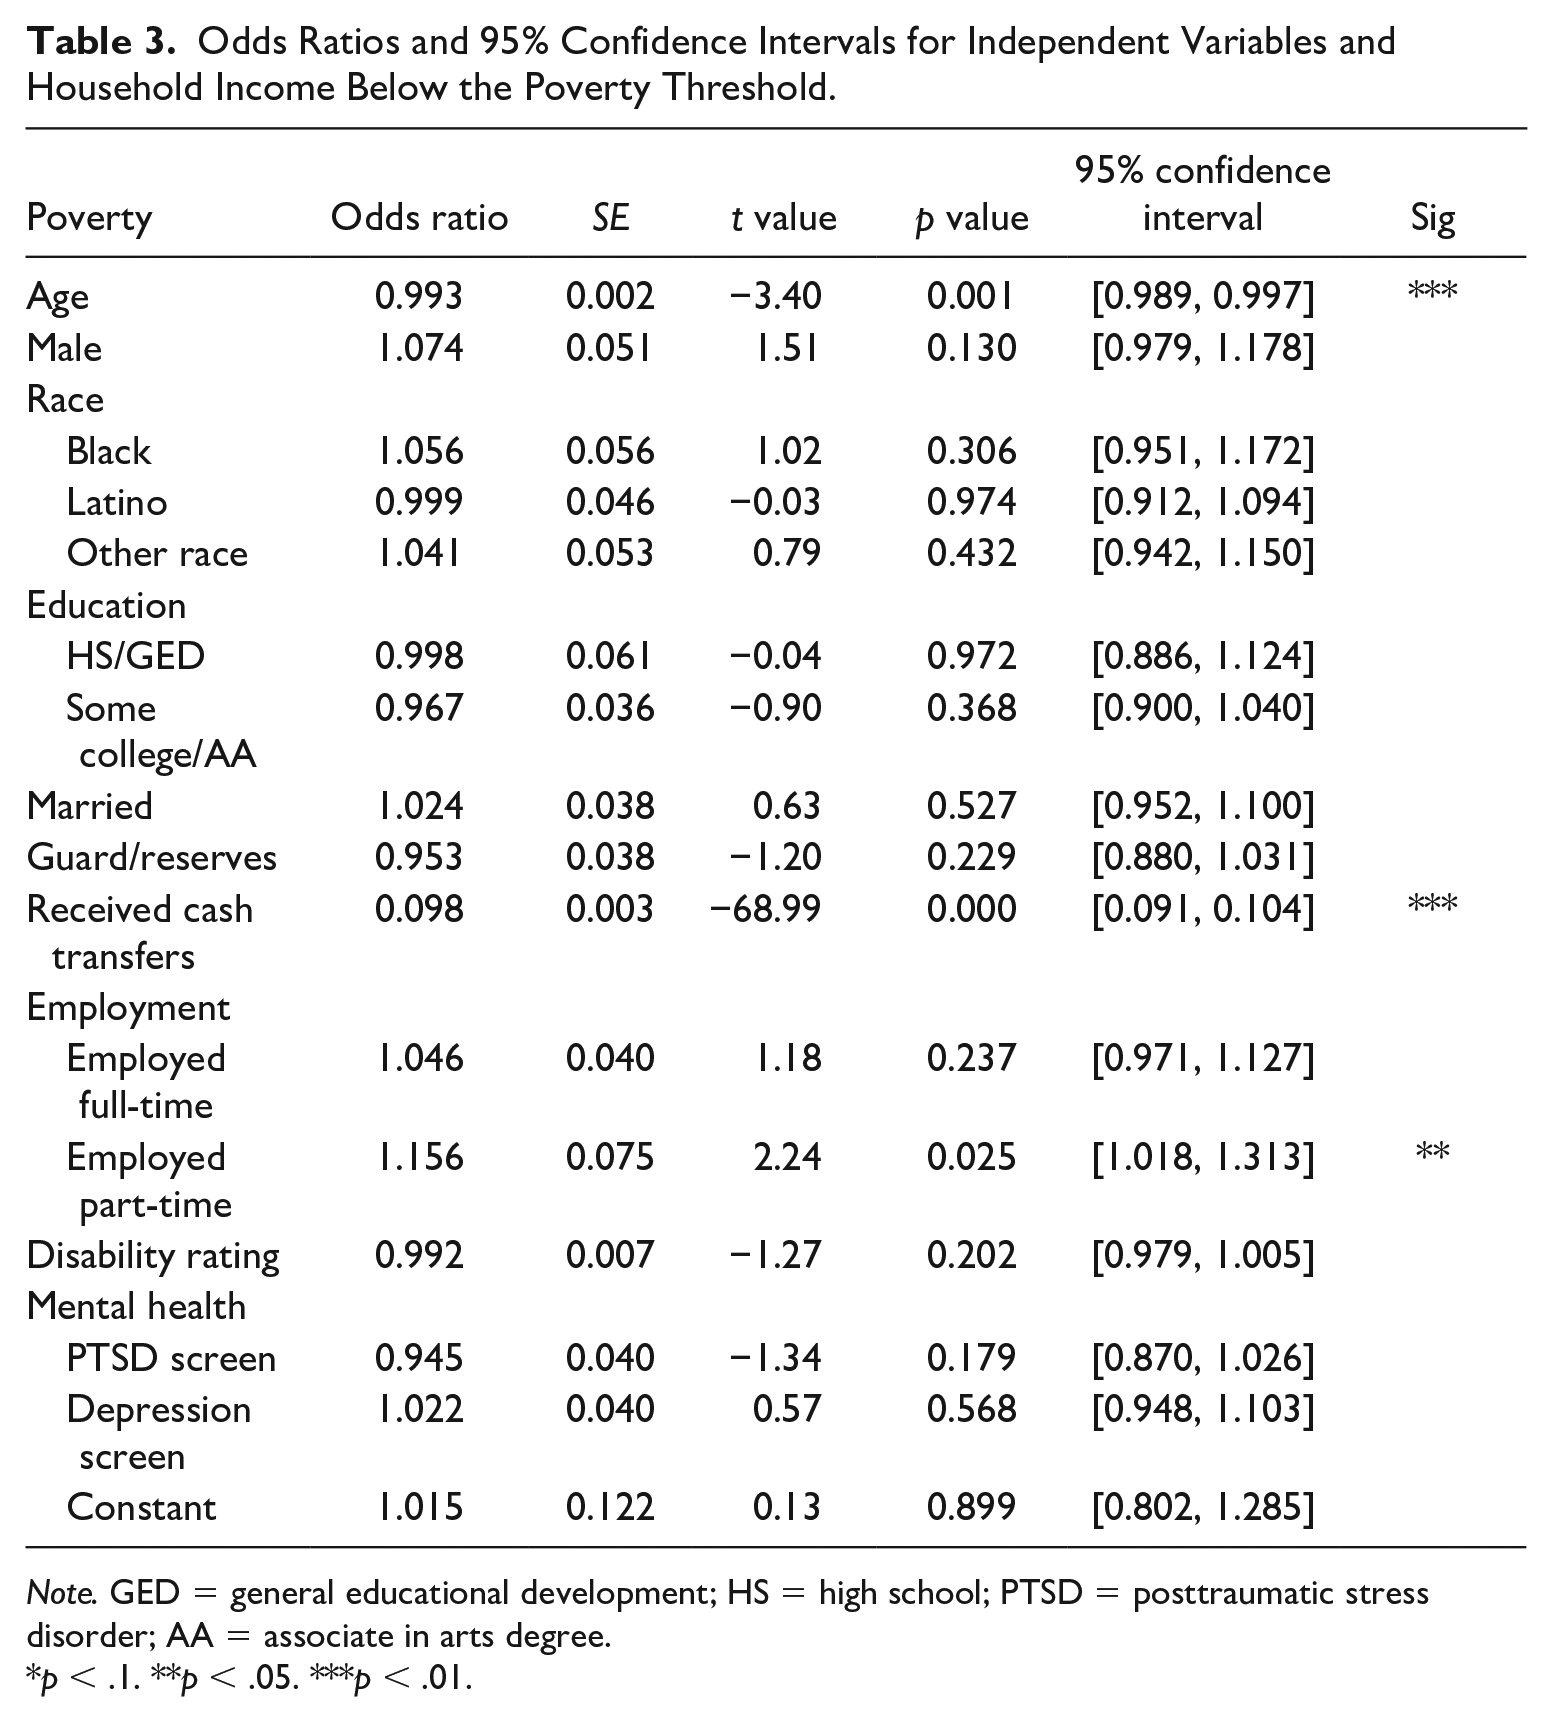
Note. GED = general educational development; HS = high school; PTSD = posttraumatic stress disorder; AA = associate in arts degree.
p < .1. **p < .05. ***p < .01.
Predictive margins for the interaction of transfers and employment status on the probability of poverty highlight the key role of transfer income in reducing the probability of poverty (Table 4).
Predictive Margins for Cash Transfers and Employment Status on the Probability of Family Poverty.
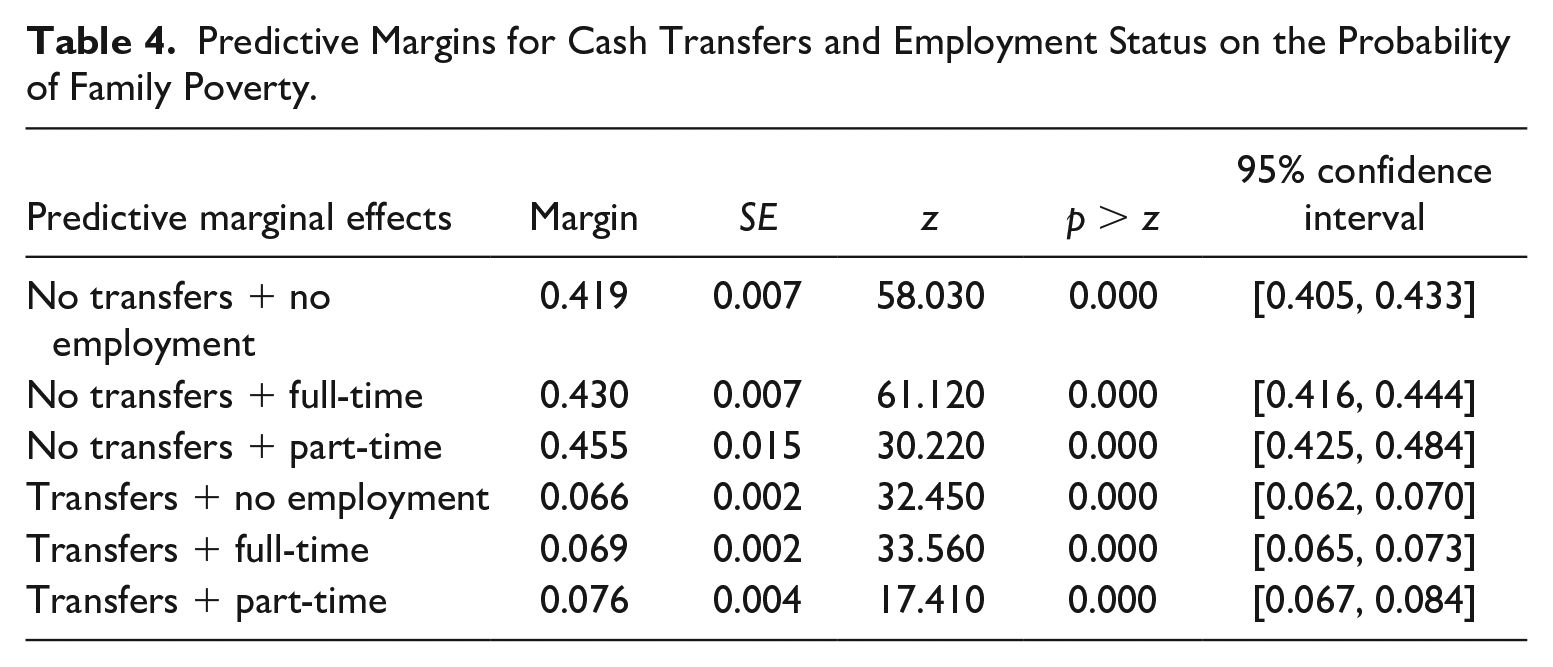
Retaining parameter estimates from the fitted model for all other independent variables, the probability of poverty across employment categories without cash transfer income ranged from p = .46 to p = .42 and was highest for those working part-time with no transfer income (p = .46). In contrast, the probability of poverty across employment categories with transfer income was between p = .07 and p = .08 (see Figure 1).
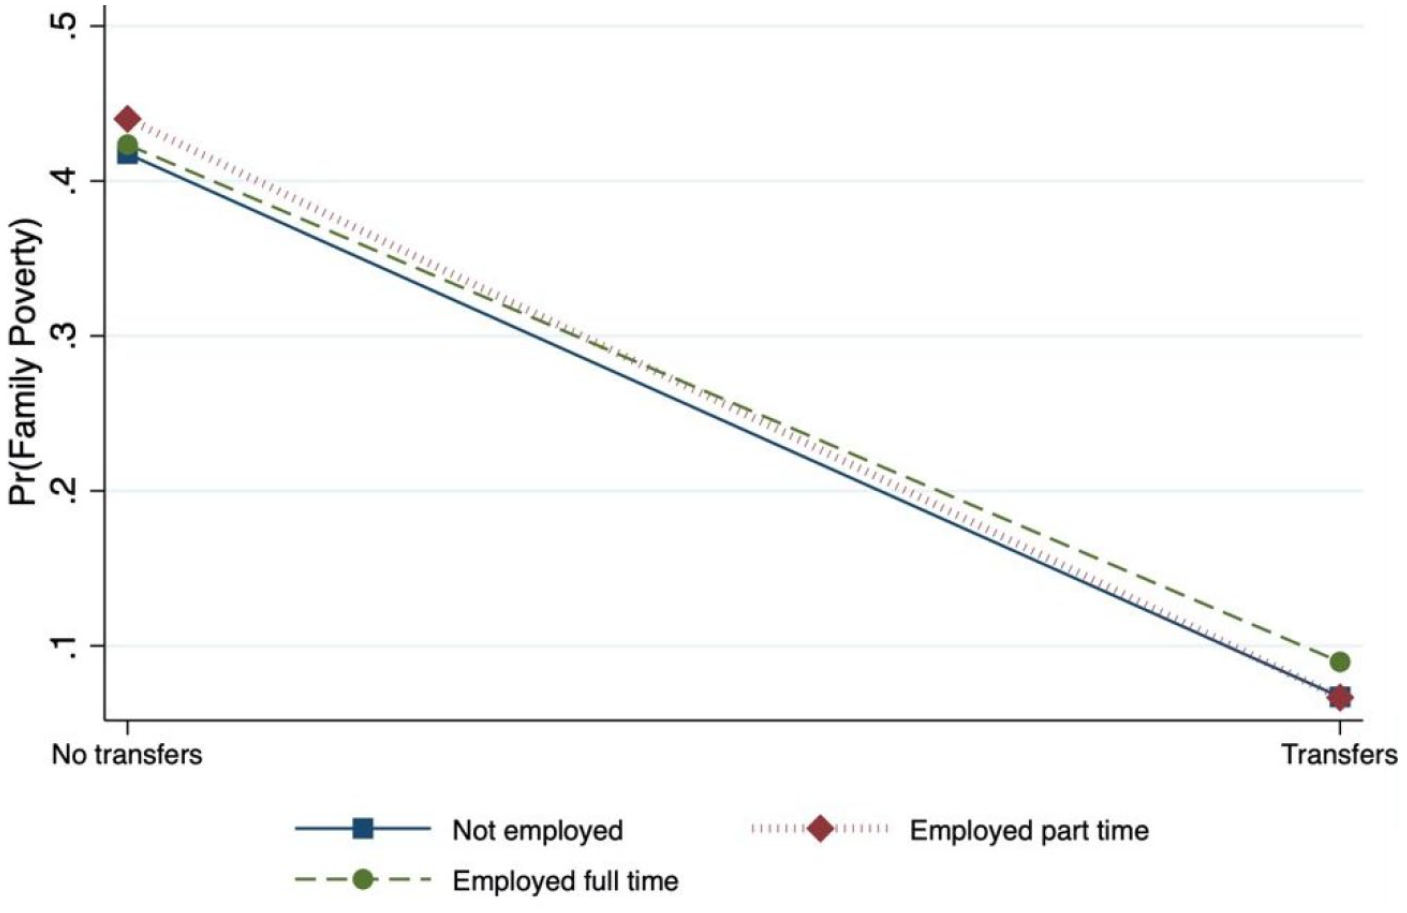
Predictive Margins for Transfers and Employment Categories on the Probability of Family Poverty.
To further investigate the effects of transfer income across employment categories, we calculated AMEs for transfers on the probability of family poverty at no employment, part-time employment, and full-time employment (Table 5).
Average Marginal Effects for Transfers on the Probability of Poverty Across Employment Categories.
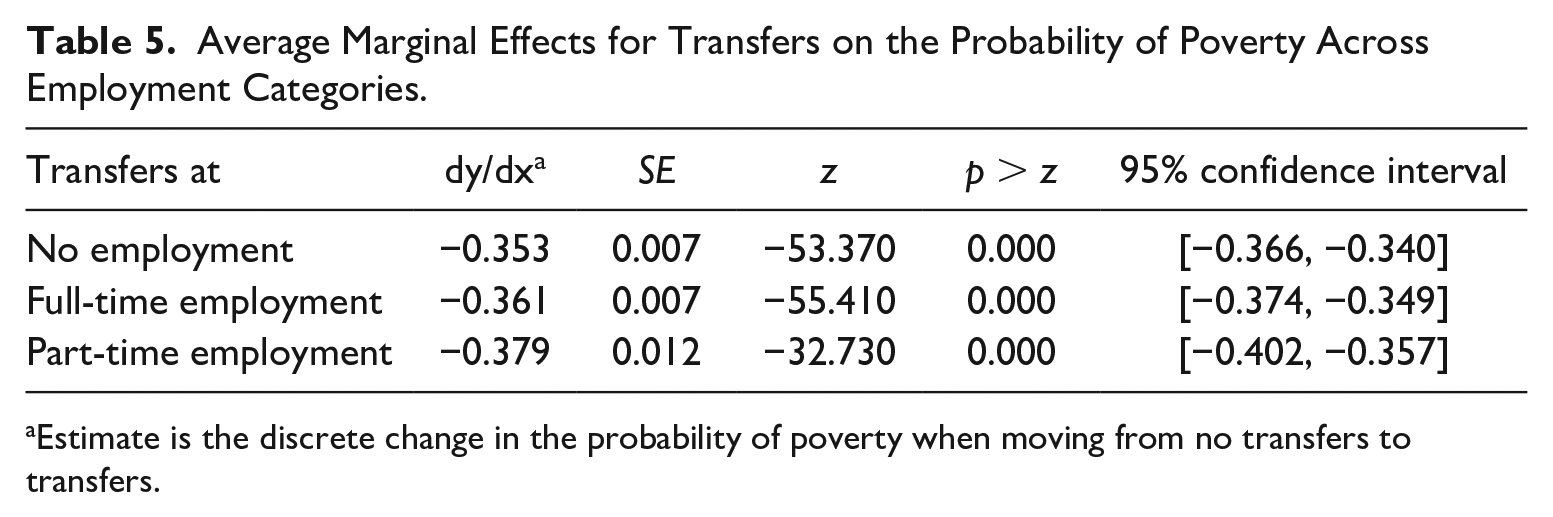
Estimate is the discrete change in the probability of poverty when moving from no transfers to transfers.
The average percentage point reduction in the probability of poverty when moving from no transfers to transfers across employment categories was between 35 and 38 percentage points, with the largest change evident for the part-time employment category (see Figure 2). In Model 2 (Table 6), only transfers demonstrated a significant association with deep poverty (OR = 0.098, 95% CI = [0.085, 0.113]). Multivariable models contained <8% missing data on indicator variables, an amount unlikely to bias parameter estimates particularly in large datasets (Bennett, 2001).
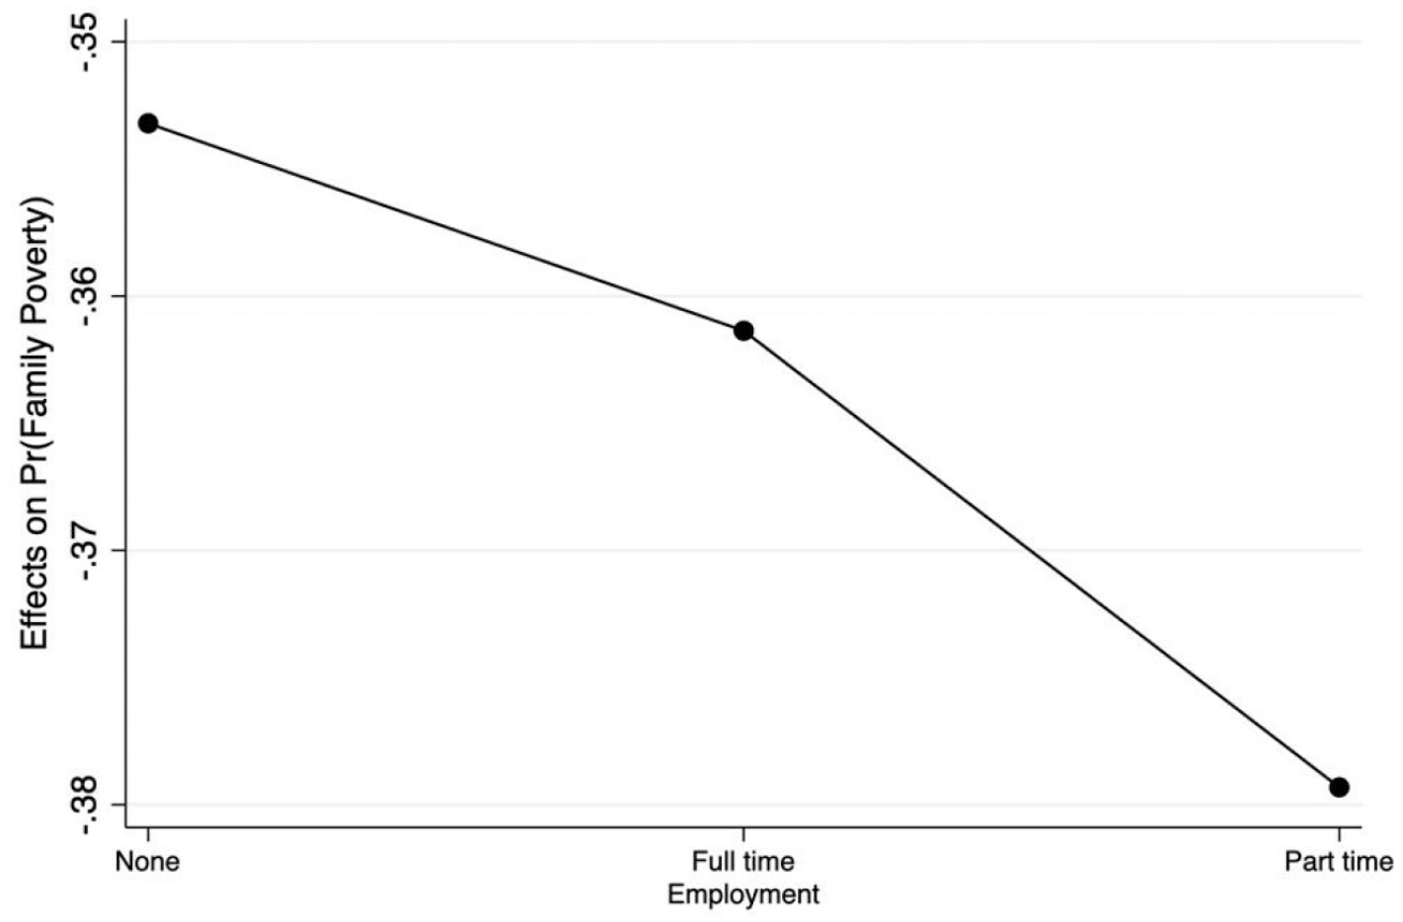
Average Marginal Effects on the Probability of Family Poverty for Transfers Across Employment Categories.
Odds Ratios and 95% Confidence Intervals for Independent Variables and Deep Poverty.
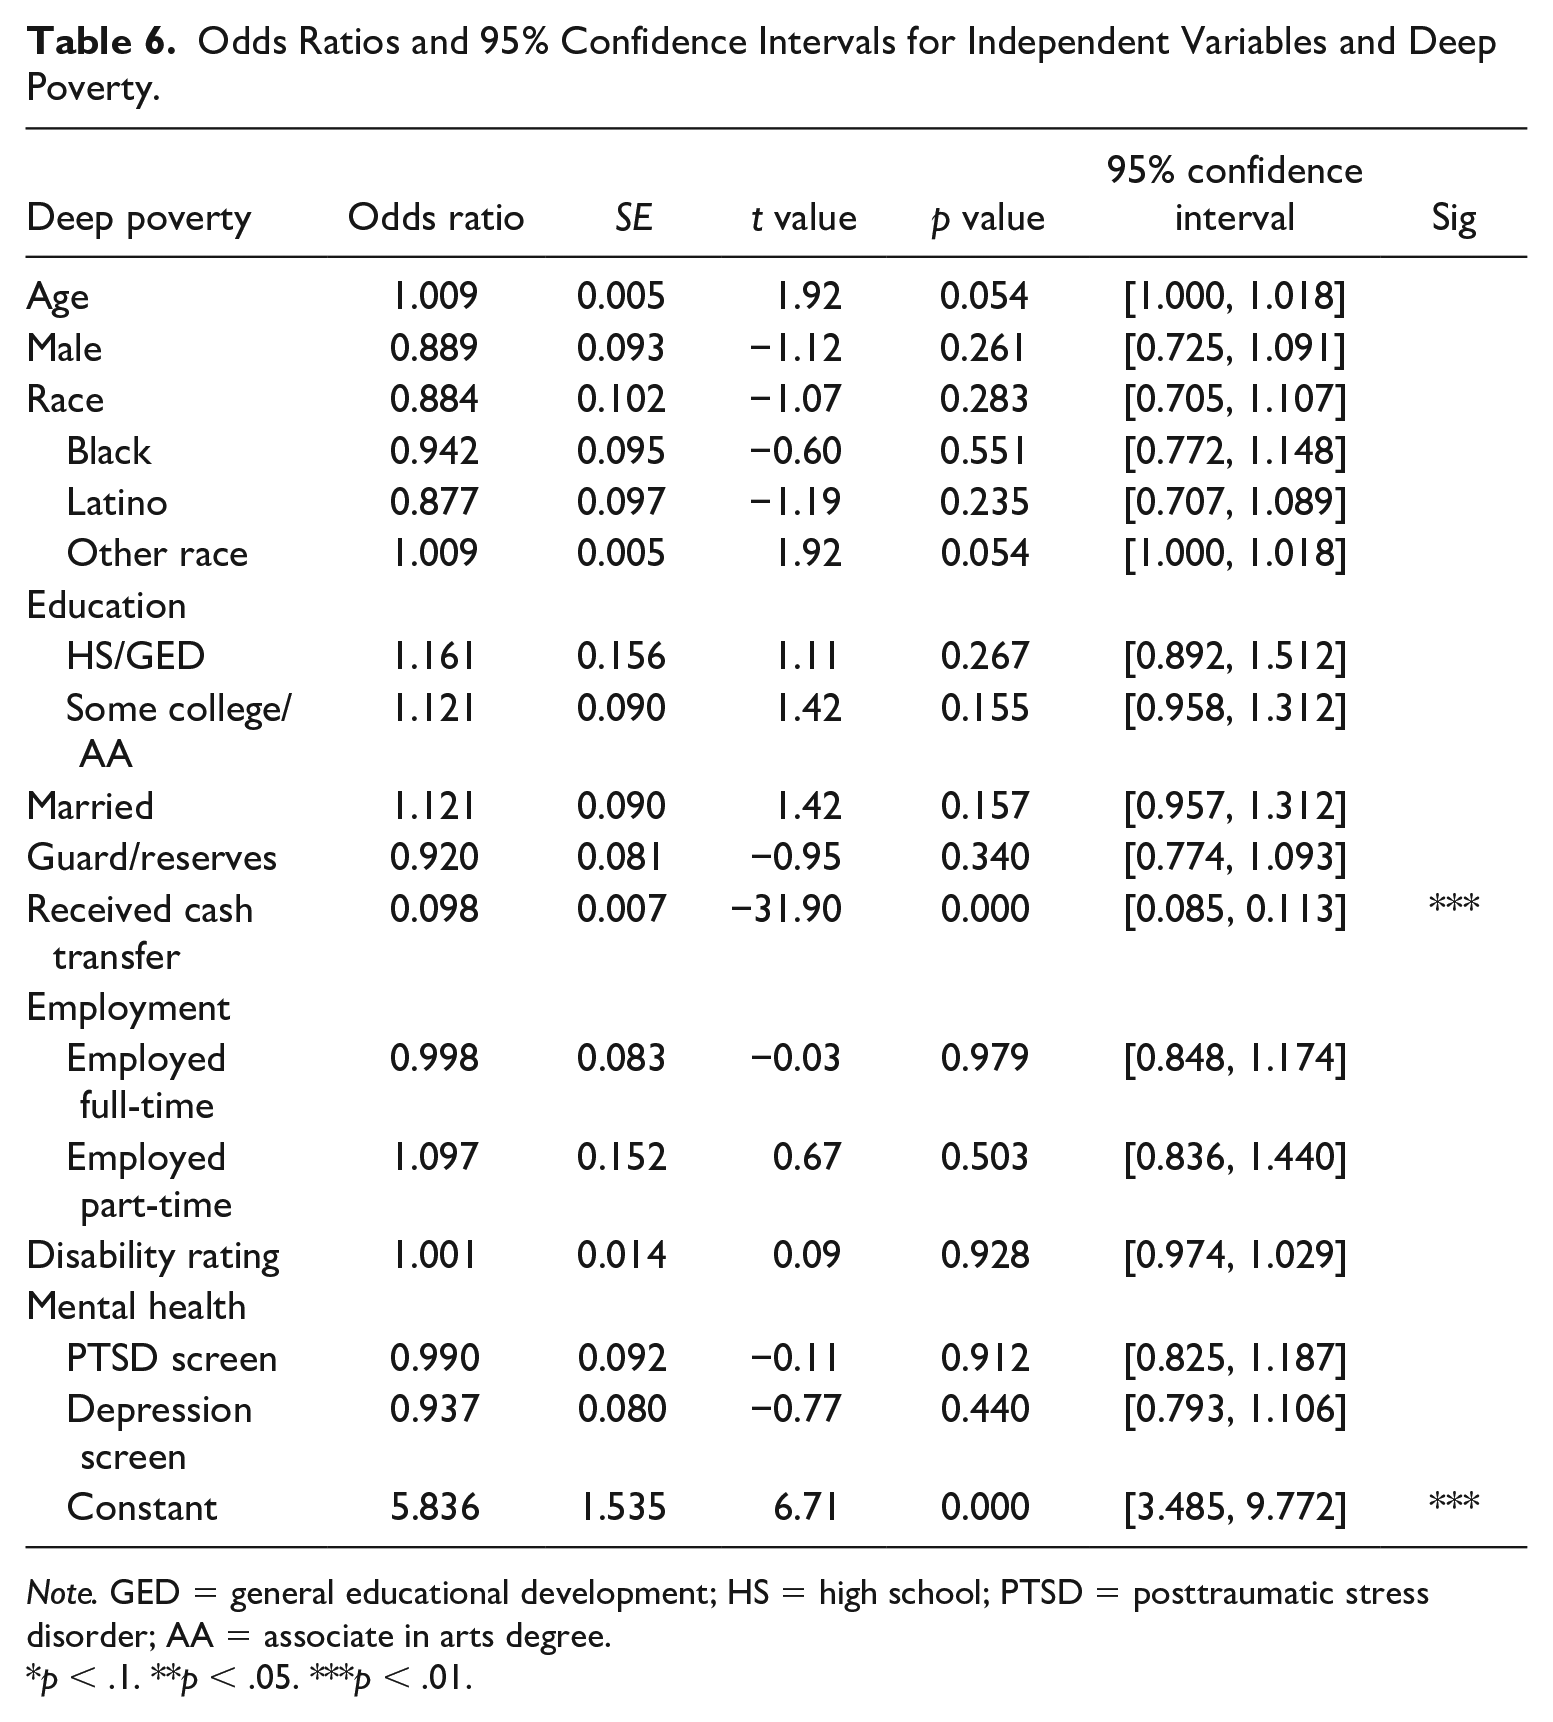
Note. GED = general educational development; HS = high school; PTSD = posttraumatic stress disorder; AA = associate in arts degree.
p < .1. **p < .05. ***p < .01.
Discussion
This study yielded several noteworthy findings related to post–9/11 era wounded veterans’ financial outcomes. About 17% of this sample reported income under the poverty threshold in comparison to civilians with a disability, 25% of whom had income under the poverty threshold in 2017. Although over half the sample was employed part or full-time, main effects for employment and transfer variables showed that employment was not protective against poverty, and part-time employment was associated with greater odds of poverty compared with not working. In contrast, the main effect for cash transfers was substantial; veterans who received transfers in the previous year had 10% of the odds of poverty compared with those who did not receive cash transfers.
Predictive margins showed that the probability of poverty was significantly higher across all employment categories for veterans without transfer income. AMEs for transfers at no employment, full-time, and part-time employment showed that receiving transfers was associated a greater than 30 percentage point reduction in the probability of family poverty regardless of employment status, though the magnitude of this effect was greatest for those working part-time. These findings support the view that the historical protective effect of employment against poverty may not hold in an economic environment characterized by low wages and high costs, particularly for veterans who may not enjoy the full suite of VA benefits and who may have an injury for which they are not compensated sufficiently or at all. In addition to the main and interaction effects of employment and cash transfer variables, age was associated with slightly lower odds of poverty, which could reflect the fact that older veterans in this cohort may have served for longer, thereby achieving higher pay grades at separation, or have worked in civilian careers in which they accrued additional benefits after separation from the military.
Study results also showed that, of those in poverty, three quarters were in deep poverty, a figure substantially higher than the 44% in the general population (Fontenot et al., 2018). In these data, only receiving cash transfers was associated with significantly lower odds of deep poverty. This outcome is of great concern, as deep poverty puts individuals at much higher risk for a host of negative physical and psychosocial outcomes, including mental and physical health problems and homelessness (Blackwell et al., 2014; Chetty et al., 2016). In addition, individuals in deep poverty face increased obstacles to securing employment, further limiting their ability to obtain employment income and work-conditioned cash transfers and contributing to a cycle of chronic poverty and poor health. Furthermore, 85% of single individual households in these data who were poor also had estimated income under the deep poverty threshold. Although our results showed a small negative association between age and poverty, other research suggests that older, single individuals, and women in particular, are less likely to have access to support networks that might contribute to mitigating negative outcomes associated with deep poverty and ought to be targeted for additional outreach and financial assistance to mitigate risk for homelessness and other undesirable outcomes (Kwan & Walsh, 2018).
These findings have important implications for reducing poverty among veterans and demonstrate the critical impact cash transfers have on the financial health of this population. Without cash transfers, wounded veterans in this sample had a 90% increase in the odds of family poverty; 75% of those in poverty were in deep poverty. These data suggest that policy makers concerned with preventing poverty among wounded veterans ought to look carefully at policies and practices that prevent wounded veterans from receiving earned transfer income to minimize inappropriate delay or denial of these benefits. In addition, findings showed that labor market participation among wounded veterans was not enough to prevent poverty; once in poverty veterans were more likely to fall into deep poverty compared with their civilian counterparts whether or not they were employed. This ought to be an unacceptable outcome to policy makers concerned with veteran well-being, and should be targeted for additional research as well as intervention efforts to prevent morally and financially costly mental, physical, and social consequences. Although expensive and the largest share of VA benefits expenditures, cash transfers may prevent even more costly problems associated with poverty and deep poverty, including homelessness and exacerbation of physical and mental health problems.
Military veterans have been the focus of substantial medical, psychological, and behavioral health research, but risk and protective factors for financial outcomes are understudied in this large, complex, heterogeneous population. The preponderance of veteran research related to poverty is focused on risk for homelessness. Although this must remain a critical focus, a more comprehensive approach to understanding financial risks could help prevent homelessness as well as the myriad other outcomes associated with poverty and deep poverty. As post–9/11 era veterans continue to age out of employment and require more health care and support services, it will be crucial to understand how to support their financial health and well-being efficiently and effectively. Future studies with this cohort should endeavor to collect nuanced financial data to better model risks and protective factors as well as support development of a detailed understanding of the role of cash transfers and employment in ameliorating post–9/11 era veterans’ poverty risk.
Limitations
This study was subject to several limitations. First, the data necessitated that we derive total family income from three source variables that measured income across different intervals, so we were not able to produce precise income estimates. Second, we were not able to determine specific sources for veterans’ transfer income, including whether transfers were from VA or non-VA sources, or both, and how much income each source may have provided. In addition, survey data were self-reported, and may reflect respondent bias. Finally, all data were cross sectional, and causal associations between study variables cannot be assumed. Future studies that seek to advance understanding of veterans’ financial outcomes should endeavor to measure veterans’ income sources in a detailed manner, and longitudinally, to support nuanced investigation of risk and protective factors for veterans’ financial well-being.
Footnotes
Declaration of Conflicting Interests
The authors declared no potential conflicts of interest with respect to the research, authorship, and/or publication of this article.
Funding
The authors received no financial support for the research, authorship, and/or publication of this article.
Data Availability
Data are available on request from the corresponding author. The data are not publicly available due to the data set containing information that could compromise the privacy of research participants.