
Abstract
Past research has explored which factors are important in understanding immigration attitudes, incorporating economic, cultural, and political components, among others. Simultaneously, a literature linking local demographic context to immigration attitudes has developed, in part to identify under what conditions demographic change might increase immigration Backlash. I combine these literatures by examining what characteristics and/or contexts for U.S.-born Whites predict Backlash to demographic change. I find evidence that county-level Hispanic growth predicts a preference for reducing immigration among three groups: those without a four-year degree, those identifying as political Independents, and those reporting a decrease in household income. These results provide a framework for understanding how immigration policy attitudes may evolve for different groups in the context of demographic change.
Keywords
Introduction
White public opinion on immigration in the United States has taken various turns across the twentieth and twenty-first centuries. Justin Allen Berg (2009) summarizes these patterns from 1900 to the mid-1990s, drawing on a range of studies (Espenshade 1995, 2001; Espenshade and Calhoun 1993; Simon 1985) and situating the patterns around key historical events and demographic trends. According to the author, negative sentiment coincided with high levels of immigration from 1900 to World War I and persisted through World War II, while the 1950s and 1960s saw more liberal attitudes in the leadup to the passage of the Immigration and Nationality Act of 1965, which helped to usher in a new era of mass migration to the United States. Restrictionist attitudes returned in the 1970s and early 1980s, retreated to a degree around the time of the Immigration Reform and Control Act of 1986 (which included amnesty and enforcement measures), before ticking up again by the 1990s.
Since the mid-1990s, however, White immigration attitudes in the United States have undergone a massive liberalization. Focusing on White likely voters, Michael Hout and Christopher Maggio (2021) show that, from 1994 to 2018, support for reducing the number of immigrants decreased by around 25 percentage points. Other studies have found a similar liberalization in immigration attitudes in recent decades (Gallup 2020; Jones 2019; Saad 2013), with the notable feature of partisan polarization highlighting a divide between liberal Democrats and restrictive Republicans. Despite this liberalization, recent data suggest that White immigration attitudes are more restrictive than those of Blacks, Latinos, and Asians (author’s calculations from the 2018 Cooperative Congressional Election Study [CCES]; Hartig 2018; Saad 2013).
In recent decades, social scientists from various disciplines have contributed greatly to understanding more about what underlies these attitudes. On the economic side, individuals may view immigrants as labor market competitors who drive down wages or drive up unemployment (Bean, Telles, and Lowell 1987). Higher income individuals in particular may fear the fiscal burden of working-class immigrants (Facchini and Mayda 2009), while others may have negative perceptions of the impact of immigration on the economy more generally (Citrin et al. 1997). Alternatively, various scholars have argued that cultural factors are more important in predicting immigration attitudes, with racism, ethnocentrism, and a preference for cultural homogeneity motivating restrictionists (Hainmueller and Hopkins 2014). Right-wing politics tends to be linked to anti-immigrant attitudes, with commitments to ideas such as nationalism and authoritarianism likely playing a role (de Figueiredo and Elkins 2003; Duckitt and Sibley 2010). Particularly in the post-9/11 era, security concerns have become prominent in the immigration literature as well (Powell 2011).
Other research has looked at how demographic patterns may color immigration attitudes (Kaufmann and Goodwin 2018; Pottie-Sherman and Wilkes 2017). Group size is one of the key factors here, with a large immigrant minority population potentially generating threat among local Whites (Blalock 1967), but with increased opportunities for contact providing an alternative prediction, namely diminishing prejudice (Allport 1954). Rapid changes in the demographic context, on the other hand, may generate threat through a disruption of the ethno-racial environment before the positive effects of contact can take root (Kaufmann and Goodwin 2018). Scholars have addressed the relationship between local demographic change and immigration attitudes in particular and how this relationship may change based on other important factors. This includes the pre-existing racial/ethnic makeup of one’s locality (Newman 2013), the salience of immigration in the media (Hopkins 2010), orientation toward uncertainty (Johnston, Newman, and Velez 2015), and political party/ideology (Gravelle 2016; Karreth, Singh, and Stojek 2015). 1 Each of these studies have made important contributions to the literature on immigration attitudes.
However, what is still lacking is a systematic approach to understanding the conditions and/or characteristics for which demographic change may or may not trigger Backlash in terms of immigration attitudes. This study attempts to fill this gap by examining whether respondents are more or less likely to advocate for a reduction of immigration under conditions of demographic change depending on various personal and contextual characteristics. The studies cited above address a relatively small number of these factors, but neglect potentially important ones such as the level of education and income, the pre-existing racial attitudes of respondents, and economic conditions such as the unemployment rate. If, as these studies imply, Backlash to demographic change in terms of immigration attitudes is a group-specific phenomenon, it is vital to determine what groups are most at risk of Backlash. This has tremendous implications for an American future where racial demographics continue to change (Alba and Maggio 2022). I examine how this impact may vary depending on the immigrant-origin group in question, analyzing the growth of the two major immigrant-origin groups in the contemporary United States: Hispanics and Asians (Chishti, Hipsman, and Ball 2015). Importantly, I also use a pseudo-experimental analysis technique not applied in the above literature which will be discussed in more detail below.
I find no evidence of Backlash to Asian growth in terms of preferences for reducing immigration. However, respondents without at least a four-year degree, political Independents, and those reporting a decline in their household income over the past year all show evidence of a negative reaction to Hispanic growth in terms of immigration attitudes. Exploring this final result more fully, among those reporting household income decline, it is those with lower levels of education and those with lower family incomes that have more restrictive attitudes in high Hispanic growth counties. The implications of these results are discussed more fully below. Overall, these findings provide evidence that various factors may be at play in the reaction to demographic change, that some groups may be more malleable on this issue than others, and that the reaction to Asian and Hispanic growth is likely not equal.
Literature Review
Predictors of Immigration Attitudes
In recent years, several rigorous literature reviews of immigration attitudes and/or predictors of immigration attitudes have emerged from various social science disciplines (Berg 2015; Ceobanu and Escandell 2010; Esses 2021; Fussell 2014; Hainmueller and Hopkins 2014). These reviews largely focus on attitudes in Europe and North America, and thus, for the most part, ostensibly or explicitly capture the preferences of native-born Whites and the correlates of these preferences. 2 In her review of the literature, Victoria Esses (2021:506) argues that “Perceptions of threats and competition with immigrants may occur in a variety of domains, including the economic realm, the cultural sphere, safety and security issues, and demographic threat and competition.” Similar frameworks have been used to specifically discuss White attitudes in the United States, primarily among the native-born (Fussell 2014:488).
Some of the scholarly debate on attitudes toward immigration concerns whether anti-immigrant attitudes are driven primarily by cultural or economic factors. Cultural factors refer to those in which immigrants are perceived by the native-born population to be irreconcilably different in language, religion, and other markers (Hainmueller and Hopkins 2014), many of which are perceived as being closely related to race/ethnicity (Schachter 2016). Economic factors can take numerous forms, depending on where one falls in the class hierarchy. As described above, this can include labor market competition, fiscal burden, or the impact on the economy as a whole. This is not to say that these concerns are realistic in all instances, but simply that they may exist among various populations.
In their review of the literature from the United States, Canada, and Western Europe over 20 years focusing on “national majority groups,” Jens Hainmueller and Daniel Hopkins (2014:225) argue that the evidence largely supports the idea that “immigration attitudes are shaped by sociotropic concerns about its cultural impacts-and to a lesser extent its economic impacts-on the nation as a whole” (Ceobanu and Escandell 2010:323 also highlight the primacy of cultural factors). For example, a host of studies have found that attitudes related to symbolic threat (Sears 1993; Stephan and Stephan 2000), such as racial/ethnic bias, perception of cultural threat, and placing a premium on cultural homogeneity, are correlated with more anti-immigrant attitudes, while personal economic circumstances are less important if important at all (Buckler, Swatt, and Salinas 2009; Citrin et al. 1997; Hout and Maggio 2021; McLaren 2003; Miller 2018; Sides and Citrin 2007). This is not to say that there is no evidence that personal economic circumstances matter (Citrin and Sides 2008; Palmer 1996; Sides and Citrin 2007), but simply that the evidence is relatively weak in the overall literature (Hainmueller and Hopkins 2014). Generally, higher education is predictive of more liberal immigration attitudes and could be used as a proxy for “skill.” Using cross-national data, Anna Maria Mayda (2006) finds support for the notion that labor market competition concerns drive immigration attitudes with this idea in mind. The author shows that “skilled individuals are more likely to be pro-immigration in countries where the skill composition of the native-born relative to immigrants is high” (Mayda 2006:510). However, asking about preferences for different types of immigration may tell a different story. For instance, Jens Hainmueller and Michael Hiscox (2010) find that both “high” and “low skilled” native-born respondents prefer “high skilled” immigrants, and the strength of this preference does not vary by native-born skill level at a statistically significant level. In addition, Jens Hainmueller, Michael Hiscox, and Yotam Margalit (2015) find that the positive relationship between education and support for “high” and “low skilled” immigration shows little meaningful variation by the skill intensity or reliance on foreign-born labor for a given industry. Ultimately, there is a lack of clear evidence in these studies that the native-born are more concerned about immigrants who may be more likely to compete with them on the job market. This has led to speculation that the skill preference may capture some other concerns and that the positive relationship between education and liberal immigration attitudes may be more culturally than economically based.
Concern about the fiscal burden of immigrants finds mixed support in the literature (Citrin et al. 1997; Facchini and Mayda 2009; Hainmueller and Hiscox 2010; Hanson, Scheve, and Slaughter 2007; Tingley 2013), but broader economic concerns do seem to be correlated with attitudes toward immigration (McLaren 2003). For example, Jack Citrin et al. (1997) find that negative evaluations about the national economy over the past year predict less support for immigration. Rima Wilkes, Neil Guppy, and Lily Farris (2008) find that poor national economic conditions correlate with restrictionist attitudes. Poor local economic conditions might be important as well, generating a sense of decline that may be blamed on immigration (Gest 2016).
Security concerns may also drive immigration attitudes in a variety of contexts. One avenue through which this might operate is stereotypes about immigrant criminality (Gonzalez 2019). This has a long history in the United States (Lee 2019), targeted historically at the Irish and Italians, for instance, with the most notable contemporary victims of such stereotyping being Latinos (Dingeman and Rumbaut 2009). 3 This is a crucial component of the “Latino threat narrative” and is related to stereotypes of undocumented immigration (L. R. Chavez 2008). Relatedly, various studies have found legal status to be highly salient when assessing attitudes toward immigrant groups (Levy and Wright 2016; Schachter 2016; Taylor-Clark 2008). Concerns about terrorism may also lead to scapegoating and fear of immigrants (Helbling and Meierrieks 2020). In many Western countries, this scapegoating takes the form of Islamophobia (Sides and Gross 2013), particularly after the events of 9/11 (Powell 2011). The actual threat that immigrants pose in these arenas is another matter (Nowrasteh 2018, 2019), but there is evidence that such concerns can be important in terms of immigration-related attitudes (Helbling and Meierrieks 2020; Pew Research Center 2015).
Political orientation is also an important factor to consider. Generally speaking, those on the ideological right tend to hold more restrictive attitudes (Berg 2009; Ceobanu and Escandell 2010; Hout and Maggio 2021; McLaren 2003; Semyonov, Raijman, and Gorodzeisky 2008). Which factors are most important in accounting for this is debatable (Fussell 2014:489), but could include right-wing authoritarianism, social dominance orientation, nationalism, racial resentment, or fiscal conservatism (de Figueiredo and Elkins 2003; Duckitt and Sibley 2010; Facchini and Mayda 2009; Hiel and Mervielde 2002; Hout and Maggio 2021; Miller 2018; Mylonas and Tudor 2021; Pew Research Center 2019a). 4 Of course, messaging of conservative elites can influence immigration attitudes as well (McLaren 2001; Schmuck and Matthes 2017), as would be suggested by elite cues theory (Gilens and Murakawa 2002). Regardless, for the purposes of this study, it is important to note that a clear political divide on immigration has emerged in recent years in the United States, with Democrats, and to a lesser extent Independents, moving toward more liberal immigration attitudes, and Republicans remaining more restrictive (Hout and Maggio 2021).
Demographic Change and Immigration Attitudes
In addition to the research described above, an area of the literature that has recently grown examines the relationship between immigration attitudes and local changes in the composition of the population, whether growth in immigrants or largely immigrant-origin groups such as Hispanics or Asians in the United States. The study of Backlash to the presence or growth of a minority population among Whites has long been an important area of the race/ethnicity literature (Allport 1954; Blalock 1956, 1967; Key 1949; Williams 1947). The group size literature posits that the presence of a large minority population may generate threat among Whites and drive concerns over competition for resources, material or otherwise, and/or access to power (Blalock 1967). 5 However, residential selection limits the efficacy of this literature, given that the demographic makeup of one’s locality will in part be a function of the willingness of Whites to live with certain minority groups, thus biasing the relationship between minority group size and attitudes toward that group. In addition, if Whites live alongside a large minority group, positive contact may arise through increased social interaction (Allport 1954; Pettigrew and Tropp 2006). Overall, the research on group size and immigration attitudes is mixed and may depend on the geographic unit of analysis as well as measurement and modeling issues (Kaufmann and Goodwin 2018; Pottie-Sherman and Wilkes 2017).
Alternatively, various studies have found evidence of the importance of demographic change in promoting Backlash. One strain of this literature includes experimental research that has exposed Whites to information about racial/ethnic demographic change, under the assumption that fear of future loss of power or status will generate Backlash. These studies examine various outcomes, including immigration-related attitudes, usually finding a conservatizing effect (see Craig, Rucker, and Richeson 2018 for a review of the overall literature). For instance, Brenda Major, Alison Blodorn, and Gregory Major Blascovich (2018) link exposure to information about a coming “majority-minority society” to White support for anti-immigration policies, specifically among Whites who placed a high level of importance on their ethnic identity. Maureen Craig and Jennifer Richeson (2014) link the same exposure to more conservative “race-related” attitudes among Whites, using indices including immigration attitude items. However, a framing that highlighted continued White dominance in the racial hierarchy helped assuage such a threat. Evidence of Backlash to demographic change in experimental studies has been identified for racial minority respondents as well (Abascal 2015; Craig and Richeson 2018).
Another strain of this literature looks at actual demographic changes and examines their relationship to immigration attitudes (see Kaufmann and Goodwin 2018 for a meta-analysis). In terms of demographic change at the local level (rather than the country level), while residential selection or adaptation to the local environment over the long-term may lead to more positive attitudes for those living near immigrant-origin groups, the sudden disruption of the demographic status quo may generate resentment and subsequent Backlash (Hopkins 2009). This can take various forms, such as conservative turns in policy and voting (Becker and Fetzer 2017; Enos 2017; Hopkins 2009, 2010; Maggio 2021; Marquez and Schraufnagel 2013; Newman et al. 2012; Pedroza 2019; but see Arzheimer and J. M. Carter 2006; Chavez and Provine 2009), and even hate crimes 6 (Grattet 2009; Green, Strolovitch, and Wong 1998; Lyons 2008; Stacey, Carbone-López, and Rosenfeld 2011). In terms of immigration attitudes and related outcomes, such as attitudes toward immigrant-origin ethnic minorities, various studies have linked these outcomes to local demographic change (Gijsberts and Dagevos 2007; Kawalerowicz 2021; Newman and Johnson 2012), though not in all circumstances (Hjerm 2009; Walker 2014). Other studies, including several from the United States, have demonstrated that the impact of local demographic change on immigration attitudes emerges under specific circumstances in particular. In a study of demographic change over time, Daniel Hopkins (2010) finds that restrictionist immigration attitudes are more common in places undergoing growth in the foreign-born population, but only during times when immigration is particularly salient in the media, such as after the 9/11 attacks. Christopher Johnston et al. (2015) examine variation by personality orientation, finding that those with a greater aversion to uncertainty 7 show a strong positive relationship between county-level Hispanic growth and cultural threat from immigration. Relatedly, research has suggested that Backlash to demographic change may be more common on the political right (Gravelle 2016; Karreth et al. 2015). Benjamin Newman (2013) draws on the defended neighborhood hypothesis (Green et al. 1998; Rieder 1985; Suttles 1972) and acculturative stress literature (Berry 1998) to generate the “acculturating-contexts hypothesis,” arguing that demographic change will be most likely to lead to Backlash among Whites, specifically cultural Backlash, in places with little previous history of non-White immigration. In more racially homogenous places, the stakes of demographic change may appear greater for Whites than in places with higher levels of initial diversity (but see Kawalerowicz 2021 for dissimilar results based on English and Welsh data 8 ).
Contribution
While all of the above research is clearly important to the understanding of immigration attitudes, one gap in the literature is a systematic exploration of how demographic change interacts with personal and contextual characteristics to shape immigration attitudes. One important consideration for this is whether the characteristics that appear important in predicting conservative immigration attitudes more generally will be the important ones in predicting whether demographic change will lead to more conservative attitudes. For instance, based on the literature review presented above, we might predict that those with lower education, Republicans, the most racially resentful, those with more negative assessments of the economy, as well as those living in areas with high unemployment will be more likely to react negatively to demographic change because these groups are more likely to possess negative immigration attitudes. Alternatively, these groups may have already made up their mind about immigration, and demographic change may not be impactful for them at all. For instance, we may expect Whites without college degrees to react more negatively to demographic change than Whites with college degrees, given their more negative outlook on immigration described above. However, it is also possible that, because immigration restrictionism is already more common among Whites without college degrees, Whites with college degrees will actually be more likely to change their views in a conservative direction as a result of demographic change. Pre-existing racial/ethnic context and political identification are likely different than the other variables described above because there is already specific evidence that people living in places with lower Hispanic populations will react more negatively to demographic change (Newman 2013), as will those on the political right (Gravelle 2016; Karreth et al. 2015). Regardless, this article asks whether and in what way are predictors of immigration attitudes moderators of the relationship between demographic change and immigration attitudes.
Another contribution of this study is that it examines two forms of demographic change, which may have different implications for theories of their impact on immigration attitudes. Specifically, I compare the impacts of Hispanic and Asian growth, the growth of the two populations most highly represented among recent immigrant-origin groups (Chishti et al. 2015). Various research has demonstrated that the reception of these groups is likely not equal, generally with a preference for Asian immigration, particularly among Whites, emerging in the literature (Abrajano and Hajnal 2015; Masuoka and Junn 2013; Pew Research Center 2015). Some of this preference may be accounted for by a more general preference for “high-skilled” immigration (Hainmueller and Hiscox 2010; Hainmueller et al. 2015), but this would not explain the lack of a skill-based preference afforded to African and Middle Eastern immigrants (Pew Research Center 2015), nor would it explain the findings by Benjamin Newman and Neil Malhotra (2019), who demonstrate in various ways that the preference for “high-skilled” migration is likely not race neutral. For the purposes of this study, it is worth keeping in mind that characteristics of the White population may be influential in their reaction to Hispanic and Asian growth, respectively. As alluded to above, it may be the case that low-income Whites react negatively to Hispanic growth in viewing the group as economic competitors, while higher income Whites may react negatively to Asian growth for the same reason. Alternatively, Jens Hainmueller et al. (2015) demonstrate that the preference for “high-skill” immigration does not vary at a statistically significant level depending on the skill level of the respondent. In this case, other factors may be at play. For instance, the demonization of Latinx immigrants in politics and media (L. R. Chavez 2008) may frame this group as a broad economic or cultural threat, potentially leading to their scapegoating in times of high unemployment, for instance, or making them particularly vulnerable to targeting from racially resentful Whites. These potentialities will be explored in more detail below.
This study also makes a methodological contribution to the literature on local demographic change. Specifically, where rapid demographic change of certain groups occurs is not random and may be correlated in important ways with the outcome of this study. In other words, in order to better estimate the relationship between demographic change and immigration policy attitudes, one needs to account for the fact that “high growth” and “low growth” counties are different from each other in various ways. In this case, I use augmented inverse-probability-weighting (AIPW) and inverse-probability-weighted regression adjustment (IPWRA) (Huber and Drukker 2015). These techniques inversely weight observations based on their likelihood of “selection” into high growth (from a model described in more detail below), with the ultimate goal of making the high growth and low growth counties more similar on the characteristics predicting selection into treatment. I refer to high growth counties as “treatment” counties and lower growth counties as “control” counties throughout the current study, but they are perhaps better understood as “pseudo-treatment” and “pseudo-control” groups based on these techniques. In theory, if the treatment and control groups are more similar on the characteristics predicting selection into treatment, this can do more to isolate the effect of demographic change, providing for a pseudo-experimental approach. Both techniques accomplish the goal of this analysis slightly differently (Huber and Drukker 2015; StataCorp 2013) and thus it is useful to examine both for a more robust analysis. These techniques are termed “doubly robust” in that they are effective in isolating the treatment effect as long as the model predicting selection into treatment is correctly specified, even if the model predicting the outcome is not, or vice versa (Funk et al. 2011). These models exclude cases that violate the “overlap assumption,” those with very high or low likelihoods of selection into treatment, in order to avoid unstable estimates (StataCorp 2013). They have been used in a number of highly cited studies in a variety of fields (Kangmennaang, Bezner-Kerr, and Luginaah 2018; Rahman, Norton, and Rashid 2018; Witteveen and Attewell 2017). Assuming that these techniques generate superior estimates of the relationship between demographic change and immigration attitudes compared to traditional OLS or logistic regressions, they can provide a better understanding for whom Backlash to demographic change is most likely to occur.
Ultimately, this study will attempt to identify a relationship between Hispanic and/or Asian growth at the county level and immigration attitudes with a pseudo-experimental approach, and to determine whether that relationship is moderated by various personal and contextual characteristics described below. Some of these potential moderators have been examined in previous literature, but many have not, and none of these studies have examined both Hispanic and Asian growth or utilized the pseudo-experimental methodology described above. Because of the limitations of the AIPW and IPWRA methods, moderation analysis will be performed by limiting the analysis sample to subsamples based on key characteristics and determining if that particular subsample demonstrates evidence of Backlash to demographic change in the form of more restrictive immigration attitudes. Ideally I would utilize interaction terms, but AIPW and IPWRA techniques do not converge when these interactions are applied. Non-convergence can occur for a variety of reasons for these models and is quite common in the case of interaction terms. While I will treat all of the key characteristics as potential moderators, some of them may be mediators if included as variables in the models. I will address this potentiality by examining separate models with and without these potential mediators (described in more detail below).
Data
The primary data set for this article is the 2018 CCES. 9 This is a national voting survey that also asks respondents a range of questions on political attitudes, including immigration policy attitudes. This survey also has a variety of demographic and socioeconomic questions, as well as questions on political party affiliation, racial attitudes, and economic assessments. Crucially, the survey also provides information about the county of residence for each respondent, as well as how long they have lived in their current city, allowing analysis at the county level for those that have lived in a particular place for a long time and thus are most likely to have observed demographic changes happening in that place. For the purposes of measuring demographic change as well as other contextual variables, I merge the CCES with the 2000 Census, the 2013-2017 American Community Survey (ACS), and voting data from Election Atlas.
Methodology
The outcome for this study is a question about preferences for levels of legal immigration. Specifically, the question asks: “What do you think the U.S. government should do about immigration?
Reduce legal immigration by eliminating the visa lottery and ending family-based migration
Support Oppose”
I choose this as the outcome because it is similar to commonly used questions in the immigration attitudes literature that ask about preferences for immigration levels to be higher or lower (or remain the same) that have been asked repeatedly in different forms in data sets such as the General Social Survey (GSS) and the American National Election Study (ANES), as well as polls by Gallup and Pew (Gallup 2020; Pew Research Center 2018). “Social scientists have asked about immigration in ways both subtle and blunt, but this simple, direct approach works as well as any and better than most for quantifying positive and negative sentiments” (Hout and Maggio 2021:41). In other words, asking about preferred levels of immigration is about as standard as one can get in terms of understanding immigration policy attitudes, the goal of the current study. Such questions have been used in many studies analyzing predictors of immigration attitudes (Chandler and Tsai 2001; Espenshade and Hempstead 1996; Ilias, Fennelly, and Federico 2008; Miller 2018), including studies specifically examining demographic change as a predictor (Citrin and Sides 2008 10 ; Johnston et al. 2015).
The primary differences between the CCES question and questions from other studies is that the CCES question refers specifically to legal immigration through the visa lottery and family-based migration, and only asks about reduction of immigration, not increasing or keeping immigration levels the same. The reference to types of migration flows is of particular concern because their reference may have a specific effect on the answers of respondents. For instance, family migration may not be viewed as an economic threat in the same way as labor migration. Thus, demographic change might not specifically impact the response to a question highlighting family migration for those with more vulnerability in the labor market, such as the unemployed. In addition, various Latin American and Asian countries are not eligible for the diversity visa due to their large numbers through other streams (U.S. Department of State 2020). Therefore, increases in these populations may not connect directly to the diversity visa lottery in the minds of respondents. These concerns will be addressed in the conclusion.
However, this question, by referring to legal immigration, is still best positioned for the purposes of this study. The other immigration policy questions in the CCES specifically refer to issues around undocumented immigration, which is primarily associated with Hispanic migration in the United States (Massey and Pren 2012). Therefore, in comparing the impacts of Hispanic and Asian growth, it is best to focus on an outcome that would not be heavily biased by toward one or the other group, despite the issues described above. For this reason and the other advantages described above, I choose to analyze this outcome as a measure of immigration policy attitudes.
The main treatment variables for this study are binary variables that are “1” for counties in the top quartile of Hispanic or Asian percentage point growth from 2000 to 2013–2017, and “0” for all other counties. 11 I choose percentage point growth since 2000 for several reasons. First, this matches with comparable studies (Gravelle 2016; Hopkins 2010; Johnston et al. 2015; Karreth et al. 2015; Newman 2013). Second, this allows demographic change to build over a generous period of time. For instance, if 2010 was the starting point, the average percentage point Hispanic growth in the top quartile of counties would only be 2.2, while when 2000 is the starting point, there is 8.8 percentage points of growth in the top quartile of counties. I also use 1990 as the starting point for a robustness check. I choose county level as the unit of analysis given that Benjamin Newman and Yamil Velez (2014) find that respondents do indeed notice rapid demographic change at this level. I employ alternative cut points (top 20 percent and top 30 percent) as robustness checks on the key results below.
The primary analysis sample for this study is U.S.-born non-Hispanic Whites who have lived in their current city for at least 18 years. The idea here is to examine those who are most likely to have “received the treatment” in terms of demographic change: those who have lived in their current city since around 2000. 12 The models presented in this study control for various factors that are likely to be correlated with both the outcomes and the treatment variables. At the individual level, this includes education, family income, employment status, immigrant generation, gender, birth year, current/former union status, number of children under 18, marital status, and length of time living in their current city. At the county level, this includes the percentage that voted for George Bush in 2000 as a way to gain a sense of the political environment at the beginning of the demographic growth period, the percent non-Hispanic White in 2000 as a way to gauge the racial environment, as well as logged population density in 2013–2017 to gain a picture of how urban their current county is. In addition, I control for the percent Hispanic or Asian in 2000 at the county level depending on the model, and the growth of the non-Hispanic or non-Asian populations from 2000 to 2013–2017 to account for other population changes that may be occurring. Lastly, I control for state of residence in most cases, but control for region of residence in cases where the analysis sample is below 1,000 for the purpose of ease of convergence for the AIPW and IPWRA models. 13 These are the only controls for the primary models, but I add several controls in a robustness check: the county-level unemployment rate, political party identification, racial resentment, national and household economic assessments, and state law enforcement spending preference. These are controls that may, in theory, be mediators between demographic change and immigration attitudes. 14
As stated above, the AIPW and IPWRA methodologies predict selection into treatment, in this case high growth in the Hispanic or Asian populations, then inversely weight by the likelihood of treatment in order to “balance” the treatment and control groups on key characteristics. For this study, I use several variables to predict selection into treatment. These include the percent voting for Bush in 2000, logged median income in 2000, median income growth from 2000 to 2013–2017, and logged population size in 2000, all at the county level. These are employed because the political, economic, and demographic environment will be important in predicting where Hispanic and Asian populations grow (Borjas 2014; Leach and Bean 2008; Leerkes, Bachmeier, and Leach 2013). I also predict selection into treatment using state of residence, again substituting region of residence in cases where the sample size is below 1,000. 15 Lastly, and perhaps most importantly, I predict demographic growth using percent Hispanic and Asian in 2000, respectively, under the assumption that for many, social, familial, cultural, and linguistic networks and cumulative causation will be an important factor in determining where to move and/or settle and have a family (Bachmeier 2013).
Subsamples
I examine various subsamples in this study in order to determine among whom and/or where Backlash against demographic change in the form of immigration policy attitudes is likely to occur. These factors are as follows:
Education (four-year degree+ vs. no four-year degree)
Family income ($80,000 or greater vs. less than $80,000) 16
Employment (full-time vs. part-time vs. unemployed)
County-level racial/ethnic makeup in 2000 (top vs. bottom half of percent Hispanic or Asian) 17
County-level unemployment rate in 2013–2017 (top vs. bottom half)
County-level non-Hispanic White population change 2000 to 2013–2017 (positive vs. negative)
Political party identification (Democrat vs. Republican vs. Independent)
Racial resentment scale (top vs. bottom half) 18
Assessment of national economy over the past year (gotten better vs. gotten worse vs. stayed the same)
Assessment of household income over the past year (increased vs. decreased vs. stayed the same)
Preference for state spending on law enforcement (increase vs. decrease vs. maintain) 19
Hypotheses
Below I state the outcomes that might be predicted for different subsamples based on the theoretical and empirical frameworks described above. These hypotheses will not necessarily be mutually exclusive, as certain frameworks may lead to contradictory predictions. The purpose is simply to generate a reasonable set of hypotheses based on what is known from the immigration attitudes literature.
The labor market competition hypothesis (Scheve and Slaughter 2001) would predict that Whites with lower levels of income or education would react negatively to Hispanic growth in particular as the relatively “low-skilled” group most likely to compete with them on the labor market, while the same framework would predict that higher income or education Whites would react more negatively to Asian growth due to its relatively “high-skilled” composition (Krogstad and Radford 2018). Unemployed and part-time worker Whites may react negatively to both Hispanic and Asian growth from a competitive standpoint due to their relatively precarious positions in the labor market, and those whose household income has decreased in the past year may similarly scapegoat immigration-origin groups for this downturn. From a fiscal burden perspective (Facchini and Mayda 2009), high-income Whites may react negatively to Hispanic growth given the perception that they will be relatively more likely to utilize certain public resources (Burns and Gimpel 2000). From a more sociotropic perspective, broader economic concerns may lead to a negative reaction to Hispanic or Asian growth when the county-level unemployment rate is high (Wilkes et al. 2008) 20 or when perceptions of the national economy are worse (Citrin et al. 1997). More symbolic/cultural concerns (Buckler et al. 2009) may drive a negative reaction to either Hispanic or Asian growth among lower educated or more racially resentful Whites, given that non-White and/or culturally distinct migrant groups might be perceived as threatening to these particular categories of Whites. The defended neighborhood hypothesis (Green et al. 1998) predicts a similar threat for Whites living in counties with lower Hispanic or Asian populations, or in counties where the White population is in decline, due to the perceived demographic threat to White dominance (Blalock 1967; Newman 2013). For those who are more concerned about crime, and thus advocate for more law enforcement spending, the Latino threat narrative (L. R. Chavez 2008) may prime them for a more negative reaction to Hispanic growth, given that this group is more stereotypically linked to criminal activity (Dingeman and Rumbaut 2009). Lastly, conservative ideology in the contemporary United States has taken a relatively negative perspective on both Hispanic and Asian growth (Bu and Borgida 2020), so increases in either of these groups could be more likely to drive negative attitudes among White Republicans compared with Whites identifying as Independents or Democrats (Gravelle 2016; Karreth et al. 2015).
It should be noted that the hypotheses described above mostly, though not entirely, assume a “galvanizing effect” (see Sniderman, Hagendoorn, and Prior 2004 for a discussion of galvanizing effects). That is, those predisposed to have more negative attitudes toward immigration are more likely to react negatively when confronted with Hispanic/Asian growth in their local area. However, it is also possible that, since many of these groups may have already developed a relatively negative attitude toward immigration, they may not be swayed by demographic change. For instance, Republicans may react more negatively to demographic change in terms of their immigration attitudes, or they may have already formed strong attitudes on this issue, and Independents or Democrats are more likely to have their opinion altered by demographic change. The analyses below will help to address these possibilities.
Analytical Strategy
I first examine descriptive statistics for the key variables of the study, in part to examine how they differ for the long-term resident U.S.-born White population (those living in their current city for at least 18 years) and all U.S.-born Whites. This will help to determine whether there are major differences between the two populations that would leave us concerned that the long-term resident population is biased in some way that would impact the results of the study. I then examine the relationship between Hispanic/Asian growth and the immigration policy outcome for the long-term resident U.S.-born White sample using the AIPW and IPWRA methods, with the various controls and predictors of selection into treatment described above. Next, I continue with these pseudo-experimental methods to determine, as is shown in several of the studies described above, whether the relationship between demographic change and immigration policy attitudes applies to specific groups by individually examining each of the subsamples described above. Some of these potential moderators have not been examined previously, while the current study can serve as a robustness check on others. From there, I execute several robustness checks on the key results, most notably:
Do these results hold if I adjust the threshold for “high growth” to the top 20 percent or top 30 percent instead of the top quartile?
Do these results hold if I begin the demographic change period in 1990 instead of 2000?
Do these results hold if I include potential mediators between demographic change and immigration policy attitudes in the model (county-level unemployment rate, political party identification, racial resentment, national and household economic assessments, and state law enforcement spending preference)?
Do these results hold if I examine all U.S.-born Whites, not just those living in their current city since 2000?
In addition, given that I find a relationship between Hispanic growth and immigration attitude Backlash for those whose household incomes have decreased in the previous year, I interrogate this result further by breaking this group down by education and family income level, with the goal of gaining a more nuanced understanding.
Descriptive Statistics
Table 1 provides descriptive statistics. I describe the characteristics and context for the primary analysis sample in this study: U.S.-born Whites who have lived in their current city for at least 18 years. I also include all U.S.-born Whites as a comparison group to ensure that this “long-term resident” group is not especially different in terms of key characteristics and contextual factors.
Descriptive Statistics for U.S.-Born Whites, Long-Term Residents and All (Percentages are Weighted, Observations are Not).
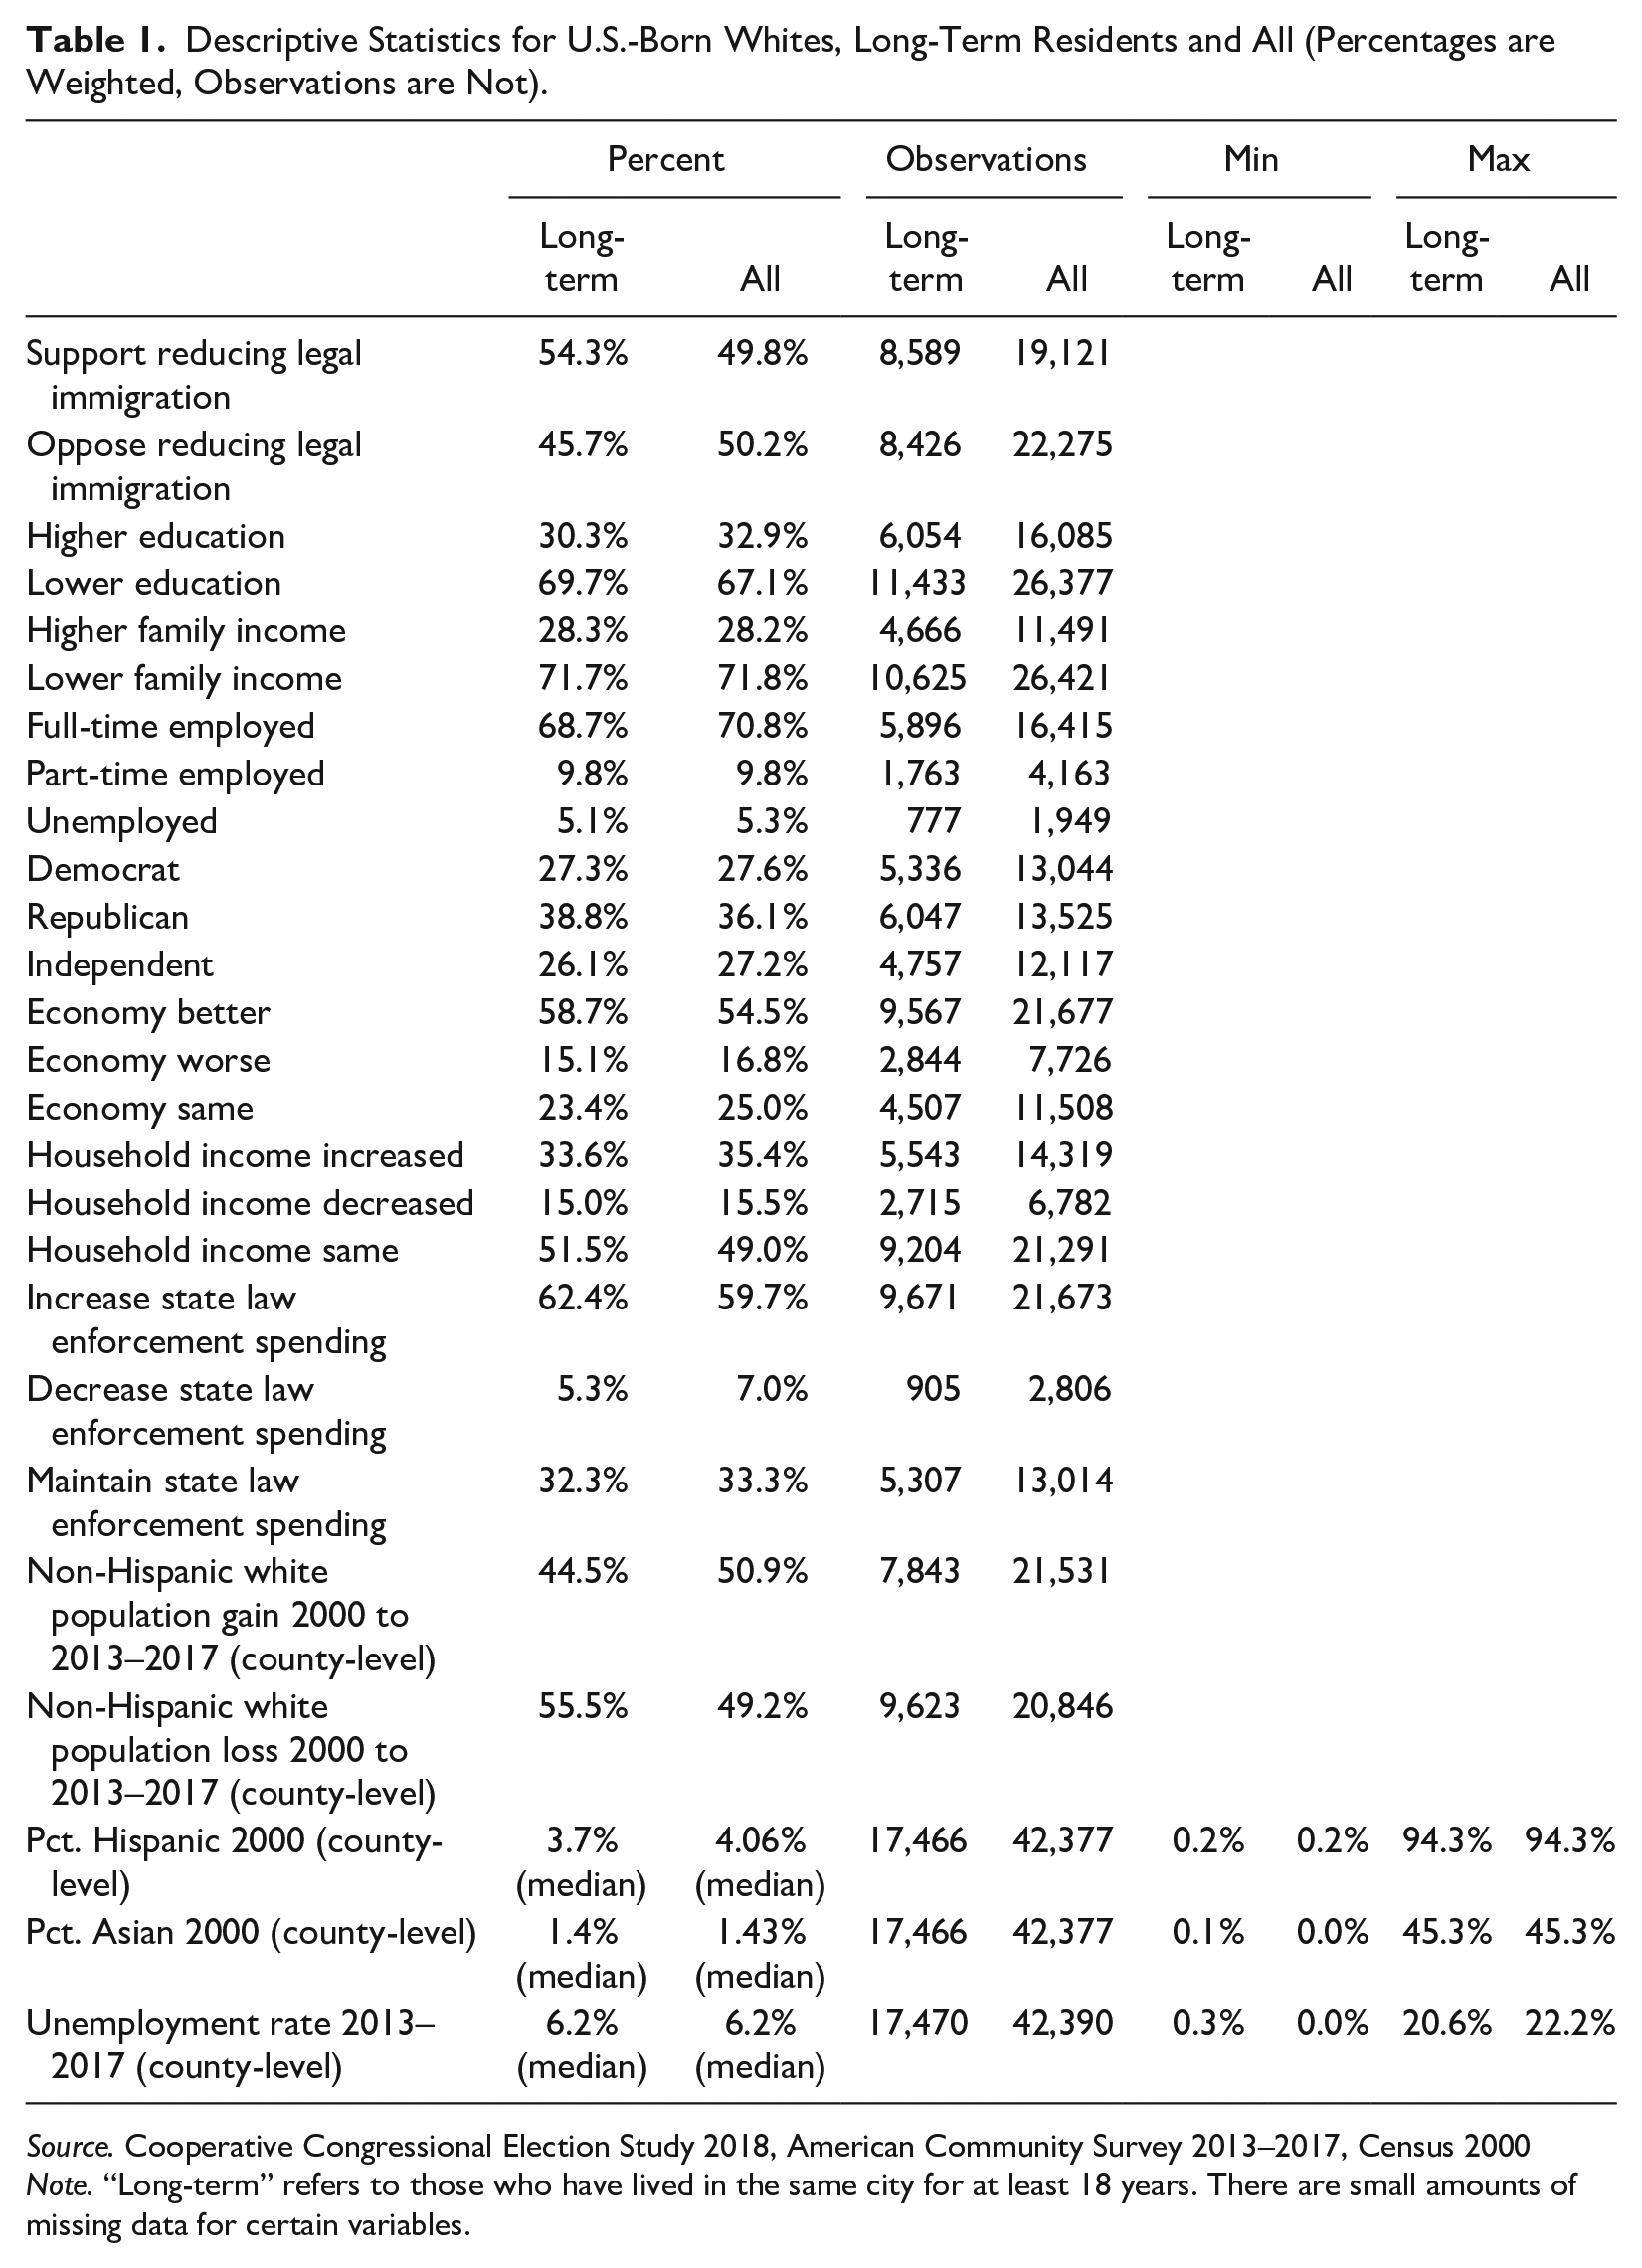
Source. Cooperative Congressional Election Study 2018, American Community Survey 2013–2017, Census 2000
Note. “Long-term” refers to those who have lived in the same city for at least 18 years. There are small amounts of missing data for certain variables.
To start, I focus on the long-term residents. First, there are large numbers of these respondents who support reducing legal immigration (8,589, 54.3 percent), and there are large numbers who oppose this (8,426, 45.7 percent). Unsurprisingly, the large majority of these respondents are on the lower end of education and family income (less than a four-year degree and less than $80,000 in family income). The large majority are also full-time employed, with less than 10 percent part-time employed and only 5 percent unemployed. Over a quarter of respondents are Democrats and Independents, while closer to 40 percent are Republicans. Given the long-term economic growth occurring prior to the interview date in 2018 (The World Bank 2020), it is unsurprising that nearly 60 percent thought the national economy had improved over the prior year, while only 15 percent said it was worse. Alternatively, many fewer respondents said that their household income had increased relative to the prior year (33.6 percent), and most said it had stayed the same (51.5 percent). In terms of crime concerns, 62.4 percent wanted to increase state law enforcement spending, only 5.3 percent wanted to decrease it, and 32.3 percent wanted to maintain these spending levels. About 55.5 percent of respondents lived in a county that lost non-Hispanic White population since 2000, and 44.5 percent lived in a county that gained non-Hispanic White population.
The median respondent lived in a county that was 3.7 percent Hispanic in 2000, but the range of values here is remarkable, with some respondents living in a county with almost no Hispanics, and others living in counties where the vast majority of residents are Hispanic. It should be noted, however, that 99 percent of respondents lived in a county that was under 50 percent Hispanic. The median Asian population was lower (1.4 percent), and the range is narrower as well. Lastly, the median county-level unemployment rate was around 6 percent at this time, though some counties had practically no unemployment and others had substantially higher unemployment. Overall, 99 percent of respondents lived in counties with less than 12 percent unemployment.
There are a few notable differences between the long-term resident group and the full sample of U.S.-born Whites. The long-term residents are about 4.5 percentage points more likely to support reducing legal immigration and around 4 percentage points more likely to say that the national economy had improved over that past year. They are also around 6 percentage points less likely to live in a county that gained White population since 2000. These differences are not massive, however, and moreover these groups are quite similar in terms of all other factors, including education, income, political alignment, and their racial/ethnic context. Therefore, there should not be a massive concern that by primarily addressing long-term residents, I am addressing a vastly different group from the U.S.-born White population as a whole. Regardless, a robustness check using this full U.S.-born White sample for key results will be implemented as well.
Results
Table 2 displays AIPW and IPWRA models predicting support for a reduction in legal immigration through the means mentioned above. The main predictors are binary variables where “1” represents the top quartile of Hispanic and Asian growth at the county level from 2000 to 2013–2017, and “0” represents the bottom three quartiles. This is done first in the full sample, then for the various subsamples described above. I choose linear probability models here for ease of model convergence. 21 I include all the controls mentioned above and predict selection into treatment with the predictors mentioned above. Statistical significance is presented at the 0.1 percent, 1 percent, and 5 percent levels.
AIPW and IPWRA Regressions Predicting Support for Reducing Legal Immigration with County-Level Demographic Change Variables and Controls (U.S.-Born Whites Who Have Lived in Their Current City for at Least 18 Years).
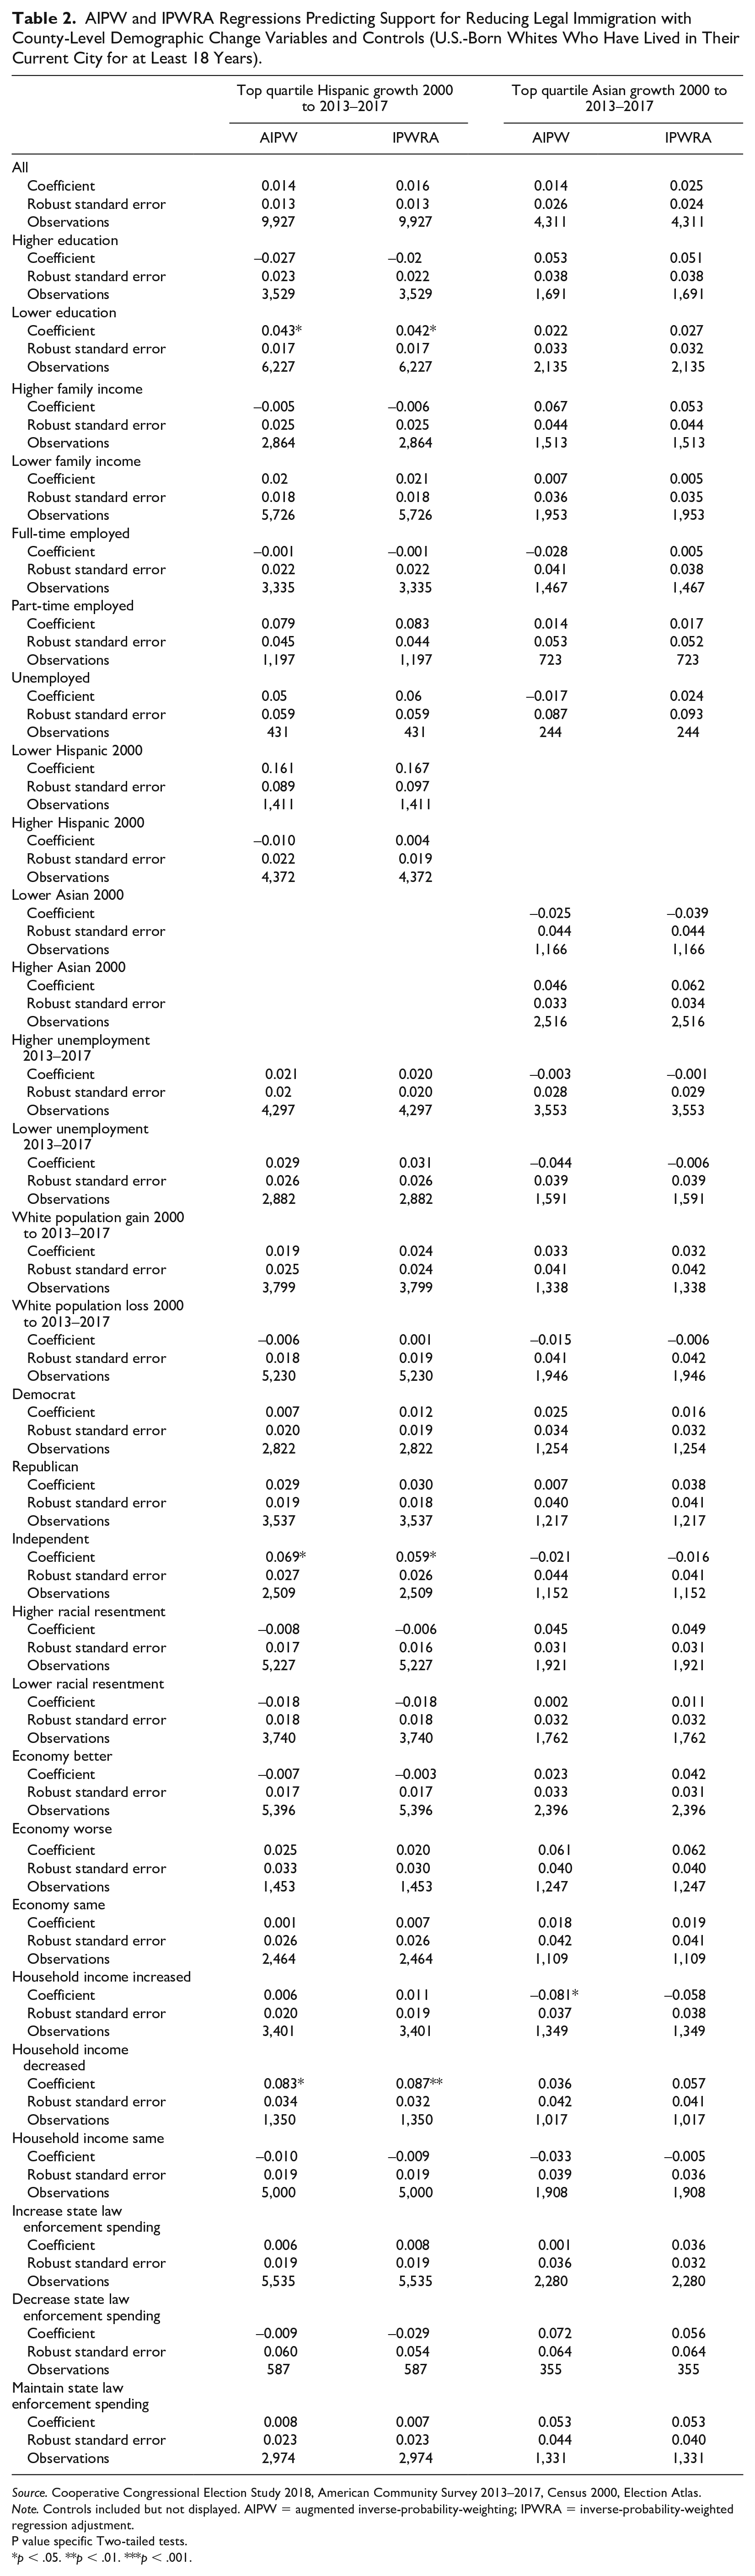
Source. Cooperative Congressional Election Study 2018, American Community Survey 2013–2017, Census 2000, Election Atlas.
Note. Controls included but not displayed. AIPW = augmented inverse-probability-weighting; IPWRA = inverse-probability-weighted regression adjustment.
p < .05. **p < .01. ***p < .001.
The results for the full sample show no statistically significant relationship between Hispanic or Asian growth and support for a reduction in legal immigration. It should be noted that logistic regressions (not displayed) examining the relationship between demographic change and immigration policy attitudes for the full sample also do not yield statistically significant results at the 5 percent level. These models look at Hispanic and Asian growth operationalized as continuous variables as well as the top quartile of growth, and cluster standard errors by county of residence. The relationship between continuous Hispanic growth and immigration policy attitudes is close to statistical significance at the 5 percent level (p value = .066) and positive, indicating some evidence of Backlash to Hispanic growth. I rely, however, on the pseudo-experimental analyses as the primary focus of this study for the reasons described above.
The null results in the full sample from Table 2 may mask heterogeneity in terms of what groups are most likely to react to demographic change in the form of changes in immigration policy attitudes. Table 2 provides no evidence of any Backlash to Asian growth, regardless of the subsample in question. In fact, among U.S.-born Whites whose household income has increased over the past year, Asian growth predicts more liberal attitudes in terms of opposing a reduction in legal immigration, though this only holds in the AIPW model. Alternatively, several subsamples show evidence of Backlash to Hispanic growth. At first glance, this provides evidence that Hispanic growth may provoke a negative reaction in some quarters, while Asian growth does not, again potentially highlighting differential receptions for these groups. More will be said about this below.
For now, I focus on the groups that demonstrate Backlash to Hispanic growth. Perhaps as expected, those with less than a four-year degree have more restrictive views on legal immigration in counties in the top quartile of Hispanic growth compared with the bottom three quartiles. Specifically, top quartile Hispanic growth is associated with approximately a 4-percentage point increase in support for a reduction of legal immigration. There is no such relationship for those with at least a four-year degree. As described above, lower education is generally associated with more restrictive immigration attitudes and appears to be important in predicting reactions to Hispanic, though not Asian, growth. It is possible that this equates to a reaction among “lower-skilled” Americans to “lower-skilled” immigrant-origin groups as an economic competitor, but it is important to note that I find no statistically significant results for those with lower (or higher) family incomes. In addition, in an analysis not presented, Whites without a four-year degree appear to react negatively to demographic change regardless of whether they have a higher or lower family income. Lastly, again as described above, there is evidence in the literature more broadly that suggests that the relationship between education and immigration attitudes may be accounted for more by cultural factors than personal economic factors (Hainmueller and Hiscox 2010; Hainmueller et al. 2015).
Alternatively, the assessment of one’s household economic circumstances does seem important in understanding reactions to demographic change. Specifically, those who say that their household income has decreased over the past year, either “somewhat” or “a lot,” show a positive relationship between Hispanic growth and preference for a reduction in legal immigration, while those whose household income has increased or stayed the same do not. Those reporting a decrease in household income are around 8 to 9 percentage points more likely to support a reduction in legal immigration in counties in the top quartile of Hispanic growth since 2000 compared with all other counties. While other economic circumstances seem to be less important, assessments of changes of economic circumstances for oneself and/or their family may provoke Backlash against local demographic change. However, it is again important to note that this is specifically the case for Hispanic migration. Why might this be?
Analyses presented in Table 3 may shed more light on this. Specifically, I subdivide those who reported a decrease in household income into those with higher and lower education and family income 22 and examine the relationship between Hispanic growth and support for reduction in immigration.
AIPW and IPWRA Regressions Predicting Support for Reducing Legal Immigration with Top Quartile of Hispanic Growth and Controls (U.S.-Born Whites Who Have Lived in Their Current City for at Least 18 Years, Reported Decreased Household Income in the Past Year).
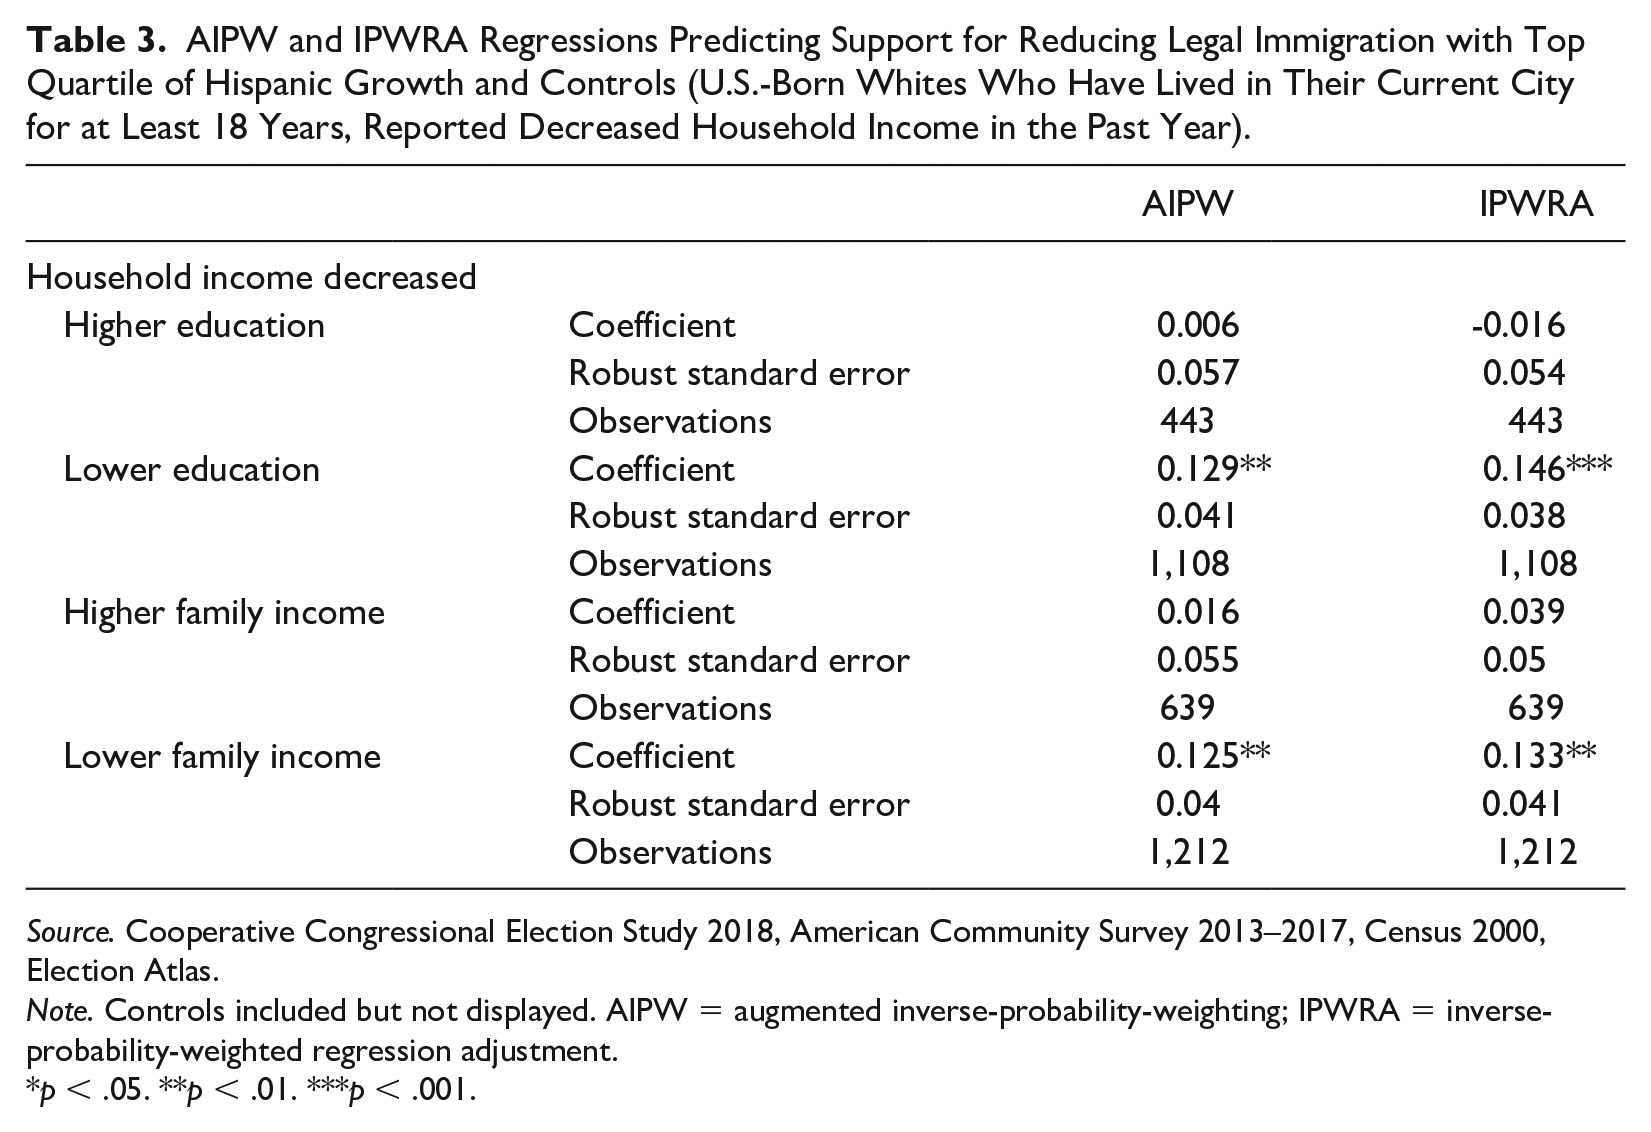
Source. Cooperative Congressional Election Study 2018, American Community Survey 2013–2017, Census 2000, Election Atlas.
Note. Controls included but not displayed. AIPW = augmented inverse-probability-weighting; IPWRA = inverse-probability-weighted regression adjustment.
p < .05. **p < .01. ***p < .001.
This analysis finds that, among those reporting a decrease in household income, two groups demonstrate evidence of a Backlash to Hispanic growth: those with lower levels of education and those with lower levels of family income. This suggests that those in the most disadvantaged positions in the labor market, and thus those most likely to perceive competition with Hispanics, are the ones who, under circumstances of relative economic distress, are the most likely to react negatively to demographic change in terms of immigration attitudes. Again, this is not necessarily to say that Hispanic migration is a labor market threat for this group, but these perceptions may go a long way. Cultural aversion to immigration among those with lower education may also play a role in terms of the likelihood of immigration scapegoating, but the results around family income also suggest that personal economic circumstances are indeed important in understanding reactions to demographic change.
Finally, returning to Table 2, I find that Hispanic growth predicts support for a reduction in legal immigration for Independents, and not for Democrats and Republicans. This result suggests that, as the research on polarization would imply (Hout and Maggio 2021), Democrats and Republicans are firmly placed in ideological camps on immigration and are perhaps less likely to be swayed by local demographic changes (but see Gravelle [2016]). On the other hand, Independents may be more persuadable, and thus more likely to be swayed by local demographic change, in this case to the tune of a 6 or 7 percentage point increase in the likelihood of supporting a reduction in legal immigration. However, again, this is only the case for Hispanic growth, and there is no obvious reason to believe that Independents would perceive a personal economic threat from Hispanics but not from Asians, indicating that other issues related to the stigmatization of Hispanic migration may be at play. 23
I also examine standard logistic regression models interacting Hispanic growth (continuous and top quartile) with the variables representing the key findings (education, political identification, and household income change in the past year). I find no statistically significant interactions, but again choose to focus on the AIPW and IPWRA models due to their advantages discussed in the current study, despite the inability for these analyses to converge with interaction terms as the treatment.
It is important to note that I generally find similar results for Hispanic growth among the key finding subsamples from Table 2 when I adjust the definition of “high growth” to the top 20 percent or top 30 percent 24 and when I adjust the demographic growth period to start in 1990. 25 I also find similar results for the “lower education” subsample when I restrict the sample to those born in 1993 or earlier, approximately age 25 or older at the time of the interview, in order to provide a reasonable amount of time to earn a four-year degree. There is evidence of Backlash to Hispanic growth regardless of nativity and citizenship. 26 The results for those without a four-year degree and Independents hold when expanding the sample to all U.S.-born Whites. The results for those with a decline in household income do not hold (p values = 0.163 and 0.199), but do hold when I limit the analysis to the lower education and lower income subsamples of this group (p values all less than 0.05), matching what was found in Table 3. Lastly, the models above do not control for various factors that have a reasonable possibility of being impacted by Hispanic growth and subsequently indirectly impacting immigration policy attitudes (mediators): the county-level unemployment rate, political party identification, racial resentment, national and household economic assessments, and state law enforcement spending preference. However, when controlling for these factors as appropriate, 27 I find similar results for the key subsamples described in Table 2, though at slightly smaller magnitudes and higher p values. 28
Another important question to answer is whether there is a high correlation between any of the characteristics for these key subsamples, and whether or not this may be at play in explaining the results above. Therefore, Table A2 in the appendix examines the correlation between having a four-year degree, being a political Independent, and reporting decreased household income over the past year. The results demonstrate that the correlations are not strong (−0.0055, −0.0351, 0.016). This allays concern that the results for one key subgroup can be explained by the fact that this characteristic is highly correlated with that of another key subgroup.
It also worth noting several subsamples that did not reveal statistically significant results in Table 2. Firstly, in contrast to Benjamin J. Newman (2013), I do not find statistically significant evidence that Backlash to Hispanic growth occurs in places with lower Hispanic populations to begin with. It should be noted, however, that Newman (2013) examines cultural Backlash, rather than immigration policy Backlash. I also find no evidence that broader economic circumstances, as measured by the county-level unemployment rate or assessments of the national economy, are important moderators of Backlash to demographic change, despite evidence that these may be important factors influencing immigration attitudes more generally (Citrin et al. 1997; Wilkes et al. 2008). Perhaps these broader circumstances are less relevant in tying immigration attitudes to local demographic change, which is observed on a personal level. Despite racial resentment being a strong predictor of immigration attitudes (Miller 2018), there is no evidence that higher (or lower) racial resentment is tied to reactions to demographic change. This might be a result of the fact that racial ideology is an already established set of beliefs that may not adjust in response to demographic change. Lastly, I find no statistically significant results for Republicans. This is in contrast with Timothy Gravelle’s (2016) findings, which suggests that Backlash to Hispanic growth is more likely to occur among Republicans than Democrats or Independents. Differences in data and/or methodology, such as the selection techniques described above, may be important here.
Conclusion
Local change in the ethno-racial composition is clearly an important trend in the contemporary United States and will continue to be so going forward. How White people react to this trend may well determine much about social and political life in this era of mass migration. However, as demonstrated above, there is little reason to believe that different subsets of White people will react uniformly to demographic change, and the characteristics of the White population are an important and understudied factor in the immigration Backlash literature. This study shows that there are particular groups of U.S.-born Whites for whom Hispanic population growth predicts increased support for reductions in legal immigration. I find that those with less than a four-year degree, political Independents, and those reporting decreased household income over the past year are more likely to express a preference for reduced legal immigration in counties where the Hispanic population has grown rapidly since 2000.
Those with lower levels of education are generally found to have more conservative immigration attitudes (Hainmueller and Hiscox 2010; Hainmueller et al. 2015), so it is perhaps not surprising, at least from a “galvanizing effects” perspective, that they are also more likely to react negatively to demographic change. There is a lively debate in the literature over whether the relationship between education and immigration attitudes is driven by personal economic concerns or some relationship between education and cultural attitudes that are strong predictors of immigration attitudes, such as cosmopolitanism (Hainmueller and Hopkins 2014). The results here could indicate either, particularly given the working-class character of the Hispanic population generally (Zong and Batalova 2019), but family income shows no importance in relation to demographic change on average, and there is evidence that Whites without college degrees react negatively to Hispanic growth regardless of the level of their family income, indicating that non-economic factors may be important here.
However, the result for those reporting a decrease in household income is concentrated among those likely at the lower end of the labor market: those with lower family incomes and those with lower levels of education. One interpretation of this result is that those suffering a disruptive economic change may blame migration for their circumstances, but only if they are among the most vulnerable workers. There still may be a cultural aspect at play, whereby anti-immigrant scapegoating is more likely among those with lower levels of education, but the situation of deteriorating household economic circumstances and lower family incomes in fostering this reaction does suggest that demographic change may be linked to economic vulnerability in the minds of these respondents. This highlights the importance of personal economic circumstances in predicting reactions to demographic change, even if these circumstances are not as important in the overall immigration attitudes literature (Hainmueller and Hopkins 2014). Moreover, it seems plausible that changes in economic circumstances may be tied to rapid demographic change in the minds of respondents in ways that overall economic circumstances are not, which perhaps makes sense given the potentially disruptive nature of both rapid demographic change and decreases in household income. In other words, White respondents may link these two simultaneous changes in their minds in a way that they might not link demographic change to their more general and longer-term economic circumstances, whose basic origins may pre-date these local demographic changes.
As described above, Democrats and Republicans have taken clearly divergent trajectories on immigration attitudes in recent times, with Democrats landing on much more liberal positions (Hout and Maggio 2021). Independents have also liberalized their attitudes, but to a lesser extent than Democrats, landing somewhere between the two poles. This intermediate position is perhaps most ripe for influence by demographic change, as captured in the results described above, while Republicans and Democrats remain more strongly in ideological camps, unswayed by local demographic changes. 29 This is in contrast to past research (Gravelle 2016; Karreth et al. 2015) which has highlighted the conservative predisposition to potentially react negatively to demographic change, which may be rooted in a variety of factors (de Figueiredo and Elkins 2003; Duckitt and Sibley 2010; Facchini and Mayda 2009; Hout and Maggio 2021; Miller 2018). This contrast in results demonstrates the possibility that galvanizing effects may not always be the most relevant framework for understanding the relationship between demographic change and immigration policy attitudes, and instead that the level of political malleability may play a crucial role.
As mentioned throughout this article, there is a clear distinction between Hispanic and Asian growth in the results of this study, with no evidence of Backlash to Asian growth, and strong evidence of Backlash to Hispanic growth for certain subgroups. Perceptions of economic competition could be at play for those with lower levels of education, but past research challenges this interpretation (Hainmueller et al. 2015). Those reporting decreased household incomes as well as lower educational and/or family income status may have the strongest claim to an economic competition argument with Hispanics, whether it is perceived or real. There is no obvious reason, however, to believe that Independents would be more likely to perceive economic competition with Hispanics rather than Asians, and yet they appear to adjust their immigration preference in contexts of growth of the former and not the latter. Based on an analysis not presented, the relative rapidity of Hispanic growth compared with Asian growth may be at play, but it is difficult to ignore the growing evidence that there is a relative preference for Asian migration (Abrajano and Hajnal 2015; Masuoka and Junn 2013; Pew Research Center 2015), and that economic competition may not be the only reason why. At the same time, given that the “forever foreigner” stereotype is most often applied to Asians (Tuan 1998), we might expect culturally driven Backlash to apply more to this group. This leaves open the possibility that belonging to a global middle class (Koo 2016), for instance, may be a more important signifier of cultural congruence in this case (but see Schachter [2016]). Future research should address these questions more fully.
In addition, I mentioned above that the results of the current study may be influenced by the specificities of the outcome in question. For instance, an outcome that touches on the visa lottery and family migration may be less likely to be impacted by demographic change for those that feel economically threatened. However, this seems unlikely given the evidence of Backlash response for those whose household incomes decreased recently, specifically among those more likely to be relatively vulnerable in the labor market. There was also a concern that Hispanic growth may not trigger Backlash for an outcome discussing the visa lottery since many Latin American countries are not eligible, but this is clearly not the case based on the results presented above. The fact that the question focuses on legal migration does not seem to be especially important either, again considering the results around Hispanic growth, despite the fact that Hispanics are often associated with undocumented immigration. Overall, I find evidence of Backlash to Hispanic growth for an educational group, an economic group, and a political group, indicating that the specificities of the outcome are likely not especially influential in terms of the results of the study.
What are the policy implications of the above results? There is some hope among immigration progressives that, if the level of education among Americans continues to increase (U.S. Census Bureau 2019), anti-immigration attitudes will continue to fall by the wayside. This argument assumes that the relationship between education and immigration attitudes is causal (Cavaille and Marshall 2019), which it may not be (Lancee and Sarrasin 2015), but the results in this article add to the evidence that education may provide a protective effect against immigrant scapegoating, perhaps highlighting the relevance of education policy in this area. In addition, while absolute economic circumstances do not provide a clear platform for Backlash, relative economic circumstances may, specifically current economic circumstances relative to past economic circumstances. Therefore, policymakers will do well to understand that fighting economic instability (Hardy 2017), for instance, could have implications beyond the economic circumstances themselves. In addition, over a quarter of White respondents in the CCES identify as Independents. According to Pew Research Center (2020), 34 percent of registered voters in the U.S. identify as Independents. Of course this group has long been perceived as politically persuadable and thus politically important, even though most actually lean toward one of the major political parties Pew Research Center (2019a, 2019b). Regardless, the specific role that local demographic change might play in this process has been less acknowledged, though perhaps should receive more attention from those invested in the political preferences of this population. Lastly, it is also important to remember that there is obviously not a perfect correlation between immigration policy preferences and immigration policy (Facchini and Mayda 2008; Gilligan 2015). The long-term liberalization of immigration attitudes followed by the election of a highly restrictive candidate in Donald Trump speaks very clearly to this. Regardless, insofar as attitudes do inform policy, it would be wise to keep in mind the role of local demographic change in shaping said attitudes, and the potentially uneven distribution of this effect across socioeconomic and political categories.
Footnotes
Appendix
Correlations between Key Characteristics (U.S.-born Whites Who Have Lived in Their Current City for at Least 18 Years, Survey Weighted).
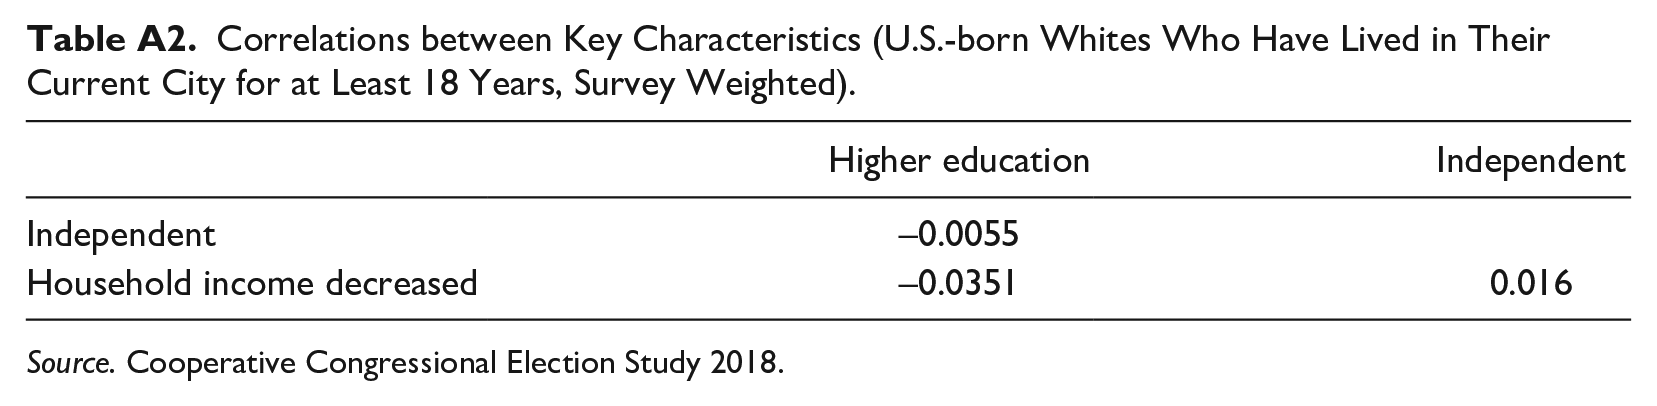
| Higher education | Independent | |
|---|---|---|
| Independent | –0.0055 | |
| Household income decreased | –0.0351 | 0.016 |
Source. Cooperative Congressional Election Study 2018.
Author’s Note
Christopher Maggio is now newly affiliated to Department of Criminology, Law and Justice, the University of Illinois Chicago, Chicago, IL, USA.
Declaration of Conflicting Interests
The author(s) declared no potential conflicts of interest with respect to the research, authorship, and/or publication of this article.
Funding
The author(s) received no financial support for the research, authorship, and/or publication of this article.