
Abstract
Objectives
To understand the mental health distress, demographics and service utilization patterns among South Asian and non-South Asian youth accessing integrated youth services (IYS) in British Columbia (BC), Canada.
Methods
This study used data from youth accessing services at the BC-IYS (Foundry) between April 2018 and October 2023. Descriptive statistics summarized demographic and service utilization data, with categorical variables compared using chi-squared tests and continuous variables using t-tests. A linear regression model examined the relationship between ethnicity (South Asian vs. non-South Asian) and mental health distress measured by Kessler Distress Scale (K10), stratified by gender [cisgender and transgender and non-conforming (TGNC)].
Results
The study included 30,016 youth, among whom 5.5% (n = 1,652) were South Asian. South Asian youth had higher distress levels (Average K10 score: 32.1 vs. 31.3, P < 0.001) and lower mental health service utilization within the past year (57.1% vs. 48.4%) compared to non-south Asian youth. They were also more likely to use virtual services (30.2% vs. 19.4%). For gender, 94.5% of South Asian youth identified as cisgender and 5.1% as TGNC, compared to 14% TGNC in non-South Asians (P < 0.001). Regression analyses showed a significant association between ethnicity and mental health distress. This was amplified within the TGNC strata for South Asian participants compared to non-South Asian youth (B = 2.00, 95% CI, 0.35 to 3.66, P = 0.018). Younger age was associated with higher levels of mental health distress among South Asian youth in both gender strata: cisgender (B = –0.07, 95% CI, –0.10 to −0.03, P < 0.001) and TGNC (B = –0.14, 95% CI, –0.21 to −0.06, P < 0.001).
Conclusion
This study reveals that South Asian youth accessing services from the BC-IYS experience higher levels of mental distress compared to non-South Asian youth. The findings highlight the need for culturally sensitive mental health services, education and policies to improve outcomes for South Asian youth in BC.
Plain Language Summary Title
Understanding the Needs of South Asian Youth Accessing Integrated Youth Services in British Columbia, Canada
Plain Language Summary
This study explored the mental health needs of South Asian youth accessing Integrated Youth Services (IYS) in British Columbia, Canada, between 2018 and 2023. Data from over 30,000 youth, including 1,652 (4.9%) South Asian youth, were collected through intake forms completed at Foundry centers or via virtual services. The data included demographic information, mental health distress levels, and service usage patterns. South Asian youth reported higher mental distress levels than their peers, with an average Kessler Distress Score (K10) of 32.1 compared to 31.3 among non-South Asians. Despite experiencing greater distress, South Asian youth were less likely to access in-person services (57.1% vs. 48.4%) and more likely to use virtual services (30.2% vs. 19.4%). Differences in gender identity and sexual orientation were also noted. Among South Asian youth, 94.5% identified as cisgender, and 5.1% identified as transgender or non-conforming, compared to 14% among non-South Asians. Younger South Asian youth and those identifying as transgender or non-conforming reported the highest levels of mental distress, highlighting the intersection of age, identity, and ethnicity in shaping mental health experiences. These findings underscore the urgent need for culturally sensitive mental health services that address the unique challenges faced by South Asian youth.
Introduction
The prevalence of mental illness among Canadian youth (defined here as 12–24 years) is concerning, with one in four youth reporting mental health concerns by the age of 25.1–3 Mental health services are consistently characterized as fragmented, under-resourced, hard to access and not adequately meeting the needs of diverse youth.1,4 Among the various demographics affected by mental health conditions and service access gaps, racialized and immigrant youth may face additional systemic and structural barriers, such as stigma, poverty, low primary education and discrimination. 5 To understand how to improve access to mental health services for all youth, research aiming to understand the experiences and perspectives of diverse youth related to their mental health care is necessary.
Recently, there has been a notable increase in the South Asian population in British Columbia (BC), Canada. 6 Since the 1980s, there has been a 743% increase in the population, growing from 56,210 in 1981 to 473,965 in 2021. 6 Children and youth (0–24 years) comprise 33.6% of the South Asian population, the highest proportion of any visible minority in BC. 6 By 2041, South Asians are projected to become the largest visible minority in BC, inclusive of immigrants and non-permanent residents. 7 While youth in general have identified numerous barriers to mental health services, South Asian youth have highlighted several distinct barriers specific to their culture, including intergenerational stigma, familial conflicts, and a shortage of culturally tailored services.8–10 As a result of these barriers, research has documented limited access and use of mental health services by South Asian populations.8–13
In the last decade, the necessity of youth mental health system reform has been emphasized by researchers, policy makers and the community – and integrated youth services (IYS) have been highlighted as a potential model to improve service access in Canada.2,14 IYS provide youth with a single point of access to multiple service streams, such as primary care, mental health services, peer support and work/study services, with the overarching aim of meeting the wellness needs of youth who live in diverse communities across Canada.2,15,16
Foundry is the IYS initiative in BC (also called the BC-IYS). It currently operates virtually and in 17 physical centres across the province, offering mental health, substance use health, physical and sexual health, youth and family peer support, and social services for youth ages 12–24. 2 As noted in the 2023/2024 Foundry Impact Report, Foundry is currently expanding and there are 17 centres, along with Foundry Virtual BC, and 18 centres in development. 17 Since 2021, over 45,000 youth have accessed Foundry, and over 33,000 virtual appointments through the Foundry BC app since 2020. 17 In 2023/2024 alone, over 16,000 youth accessed Foundry, totalling 78,690 visits to Foundry. 17 However, as IYS is a relatively new model of care, little is known about how South Asian communities’ access to and experiences of IYS differ from those of other communities’ demographics. Given that South Asian communities are growing in BC and have been shown to face unique challenges and barriers when it comes to mental health conditions and accessing related supports, it is imperative to understand South Asian youths’ IYS service access patterns, experiences and outcomes. To address this gap, the objectives of this study were to: (i) understand the demographic characteristics and service access patterns for South Asian compared to non-South Asian youth accessing IYS in BC and (ii) explore how the levels of mental health distress differ between South Asian and non-South Asian youth accessing IYS in BC.
Methods
Data Source
Data are routinely collected through intake forms and end of visit forms when youth access services at Foundry and stored in a data platform called Toolbox. The forms consist of closed-ended multiple-choice questions and open-ended short answers. The intake forms are completed by youth and service providers, either in person at Foundry centres through secure data-encrypted tablets or via the Foundry BC app. These data include a self-reported registration form containing youth age; an optional self-reported demographic survey containing information on gender and sexuality, citizenship, ethnic or cultural background, mental health or substance use service access history, and a self-reported health survey containing several patient-reported outcome measures including the Kessler Distress Scale (K10), Self-Reported Health and Self-Reported Mental Health. These voluntary surveys are not required to receive services and therefore are completed by a non-random sample. Youth can opt out of any survey(s) without it impacting the services they receive. Provider-reported services data from the end-of-visit (EOV) form, which are collected at the end of each service visit, detail service type, date of visit and number of services received. This study drew on data from the demographic survey; the K10, Self-Reported Health, and Self-Reported Mental Health surveys; and the EOV form.
Toolbox data were available for n = 33,905 youth who accessed one of the 16 Foundry centres across BC and/or Foundry's provincial virtual service that were in operation between April 1, 2018, and November 12, 2023. With the research question focused on ethnicity as a primary variable of interest, individuals who did not provide information on their ethnic background in the demographic survey (n = 3,889) were excluded from the sample. The final analytic sample size for this study was n = 30,016 unique youth.
Survey Variables (Explanatory Variable)
Ethnicity was the explanatory variable for this study. The data source defined ethnic or cultural background (hereafter simplified as “ethnicity”) as the following categories: Indigenous, White, Chinese, South Asian (e.g., East Indian, Pakistani, Punjabi, Sri Lankan), Southeast Asian (e.g., Indonesian, Vietnamese), West Asian (e.g., Afghan, Iranian), Filipino, Japanese, Korean, Black (e.g., African, Haitian, Jamaican), Latin American, and Arab. When responding to this question, individuals can select all ethnic identities that apply to them (e.g., South Asian and White). For this study, ethnicity was examined as a binary variable with levels: “South Asian” (i.e., any individual who selected “South Asian” as one of their ethnic identities) and “non-South Asian” (i.e., individuals who did not select “South Asian” as one of their ethnic identities). As noted, individuals who did not respond to this question were excluded from the analytic sample.
Survey Variables (Outcome Variable)
The outcome variable for this study was “mental health distress,” as measured by the K10. The K10 is a self-reported questionnaire consisting of 10 questions, answered on a 5-point scale, with the points associated with each item summed for a final score. 18 The questions of the K10 focus on the anxiety and depressive symptoms experienced in the most recent 4-week period. 18 Toolbox data scores K10 on a continuous scale of 10–50, representing increasing levels of distress. K10 scores can also be categorized and interpreted as follows: scores of 10–15 = “low distress,” 16–21 = “moderate distress,” 22–29 = “high distress” and 30–50 = “very high distress.” 18
Analysis
All demographic variables, including service utilization variables, were summarized descriptively, both overall and by ethnic group (i.e., South Asian and non-South Asian). For categorical variables, demographic characteristics between the two ethnic groups were compared using chi-squared tests. A two-sided t-test was used to analyze differences in continuous variables. Results were considered statistically significant when P < 0.05.
The relationship between ethnicity (binary explanatory variable) and mental distress (continuous outcome variable) was examined using a linear regression model, stratified by gender [cisgender vs. transgender and gender non-conforming (TGNC)]. The TGNC strata included those who identified as transgender, agender, Two-Spirit, not sure, questioning and those who did not identify with any of the options. The cisgender strata included those who identified as male and female. The decision to stratify by gender was informed by previous literature indicating the high prevalence of adverse health outcomes, particularly mental health among individuals identifying as TGNC.19–23 Most of this work, however, has been focused on non-South Asian populations or has included South Asian populations in a general Asian American population. In South Asian communities, there is some research that has found that TGNC individuals have higher psychological distress.24–27 However, there is a notable lack of research exploring the intersection of TGNC youth and mental illness within South Asian communities and we therefore deemed this an important area for analysis.
Within each gender stratum, the linear regression was conducted both unadjusted and adjusted for age (continuous variable) to further explore the potential relationship between ethnicity and mental distress. Age has previously been associated with mental health outcomes, with younger youth experiencing higher levels of distress, with most mental health disorders having an onset before the age of 25.1,28–32 For this portion of the analyses, only individuals with complete data for gender and sexuality, age and K10 score were included (n = 27,415).
Results
Of the 30,016 unique youth included in this study, 5.5% (n = 1,652) were South Asian and 94.5% (n = 28,364) were non-South Asian (Table 1). Within the South Asian group, the mean age was 19.5 years (SD = 3.0), which was slightly higher than the non-South Asian group (18.9, SD = 3.2, P≤0.001). Amongst the South Asian group, 94.5% (n = 1,553) identified as cisgender and 5.0% (n = 83) identified as TGNC. This distribution differed from the non-South Asian group, where 85.1% (n = 24,073) reported being cisgender and 14.0% (n = 3,955) reported that they identified as TGNC (P < 0.001).
Demographic Characteristics of the Study Sample (n = 30,016).
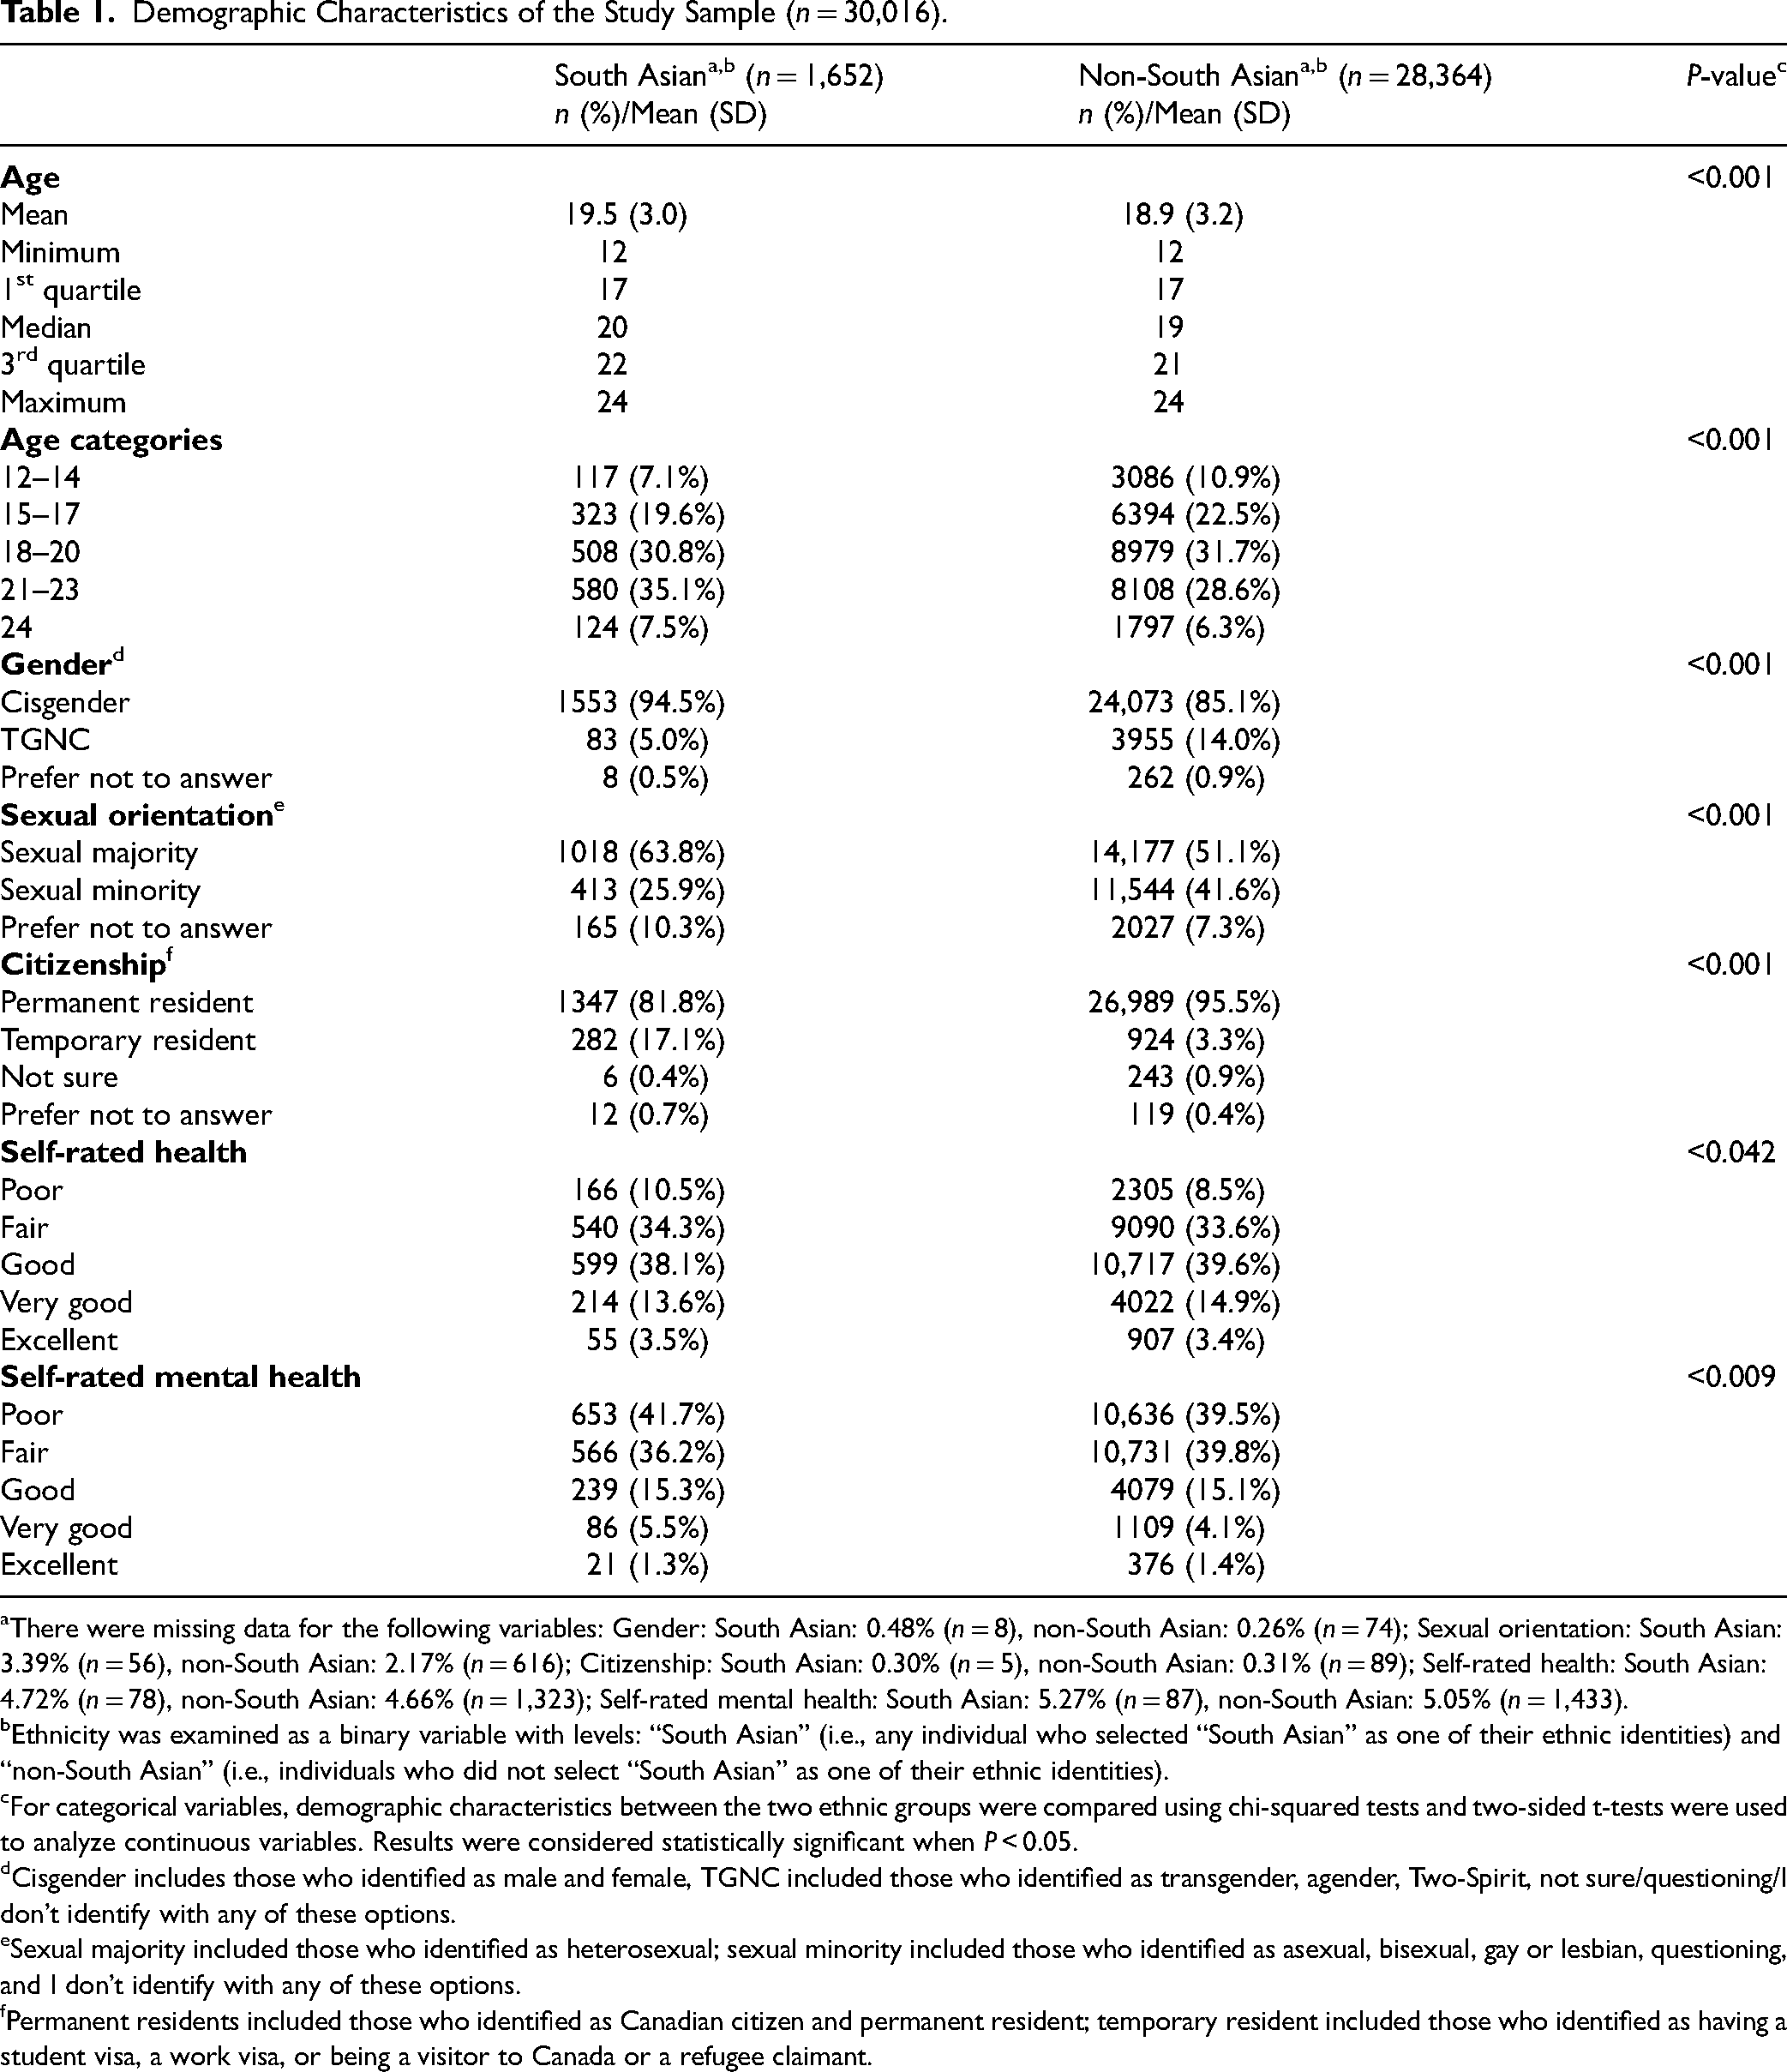
aThere were missing data for the following variables: Gender: South Asian: 0.48% (n = 8), non-South Asian: 0.26% (n = 74); Sexual orientation: South Asian: 3.39% (n = 56), non-South Asian: 2.17% (n = 616); Citizenship: South Asian: 0.30% (n = 5), non-South Asian: 0.31% (n = 89); Self-rated health: South Asian: 4.72% (n = 78), non-South Asian: 4.66% (n = 1,323); Self-rated mental health: South Asian: 5.27% (n = 87), non-South Asian: 5.05% (n = 1,433).
bEthnicity was examined as a binary variable with levels: “South Asian” (i.e., any individual who selected “South Asian” as one of their ethnic identities) and “non-South Asian” (i.e., individuals who did not select “South Asian” as one of their ethnic identities).
cFor categorical variables, demographic characteristics between the two ethnic groups were compared using chi-squared tests and two-sided t-tests were used to analyze continuous variables. Results were considered statistically significant when P < 0.05.
dCisgender includes those who identified as male and female, TGNC included those who identified as transgender, agender, Two-Spirit, not sure/questioning/I don’t identify with any of these options.
eSexual majority included those who identified as heterosexual; sexual minority included those who identified as asexual, bisexual, gay or lesbian, questioning, and I don’t identify with any of these options.
fPermanent residents included those who identified as Canadian citizen and permanent resident; temporary resident included those who identified as having a student visa, a work visa, or being a visitor to Canada or a refugee claimant.
In the South Asian group, 63.8% (n = 1,018) identified as a sexual majority and 25.9% (n = 413) identified as a sexual minority, which differed from the non-South Asian group, where 51.1% (n = 14,177) identified as a sexual majority and 41.6% (n = 11,544) identified as a sexual minority (P < 0.001).
When examining self-rated health, in the South Asian group 44.8% (n = 706) reported their health to be “Poor” or “Fair” and 55.2% (n = 868) rated it as “Good,” “Very good,” or “Excellent.” These results were statistically significant in comparison to the non-South Asian group, where 42.1% (n = 11,395) rated their health as “Poor” or “Fair” and 57.9% (n = 15,646) rated their health as “Good,” “Very good,” or “Excellent” (P = 0.04).
Our results also showed significant differences in self-rated mental health between the two groups. In the South Asian group, 77.9% (n = 1,219) reported “Poor” or “Fair” mental health and 22.1% (n = 346) reported “Good,” “Very good,” or “Excellent” mental health. These results were significant to the non-South Asian group, which had 79.3% (n = 21,367) report their mental health as “Poor” or “Fair” and 20.7% (n = 5,564) report “Good,” “Very good,” or “Excellent” mental health (P = 0.009).
Trends in service utilization characteristics were similar between ethnic groups (Table 2). Key differences were observed in “Access to Mental Health or Substance Use Services in Past Year” and “Mode of Service Delivery.” Of South Asian youth, 57.3% (n = 929) had not accessed any mental health or substance use services in the past year before accessing IYS, compared to 48.4% (n = 13,563) of non-South Asian youth. In terms of “Mode of Service Delivery,” 30.2% (n = 2536) of the visits from the South Asian group were virtual, compared to 19.4% (n = 34,819) in the non-South Asian group.
Service Utilization Characteristics of Sample (n = 30,016).
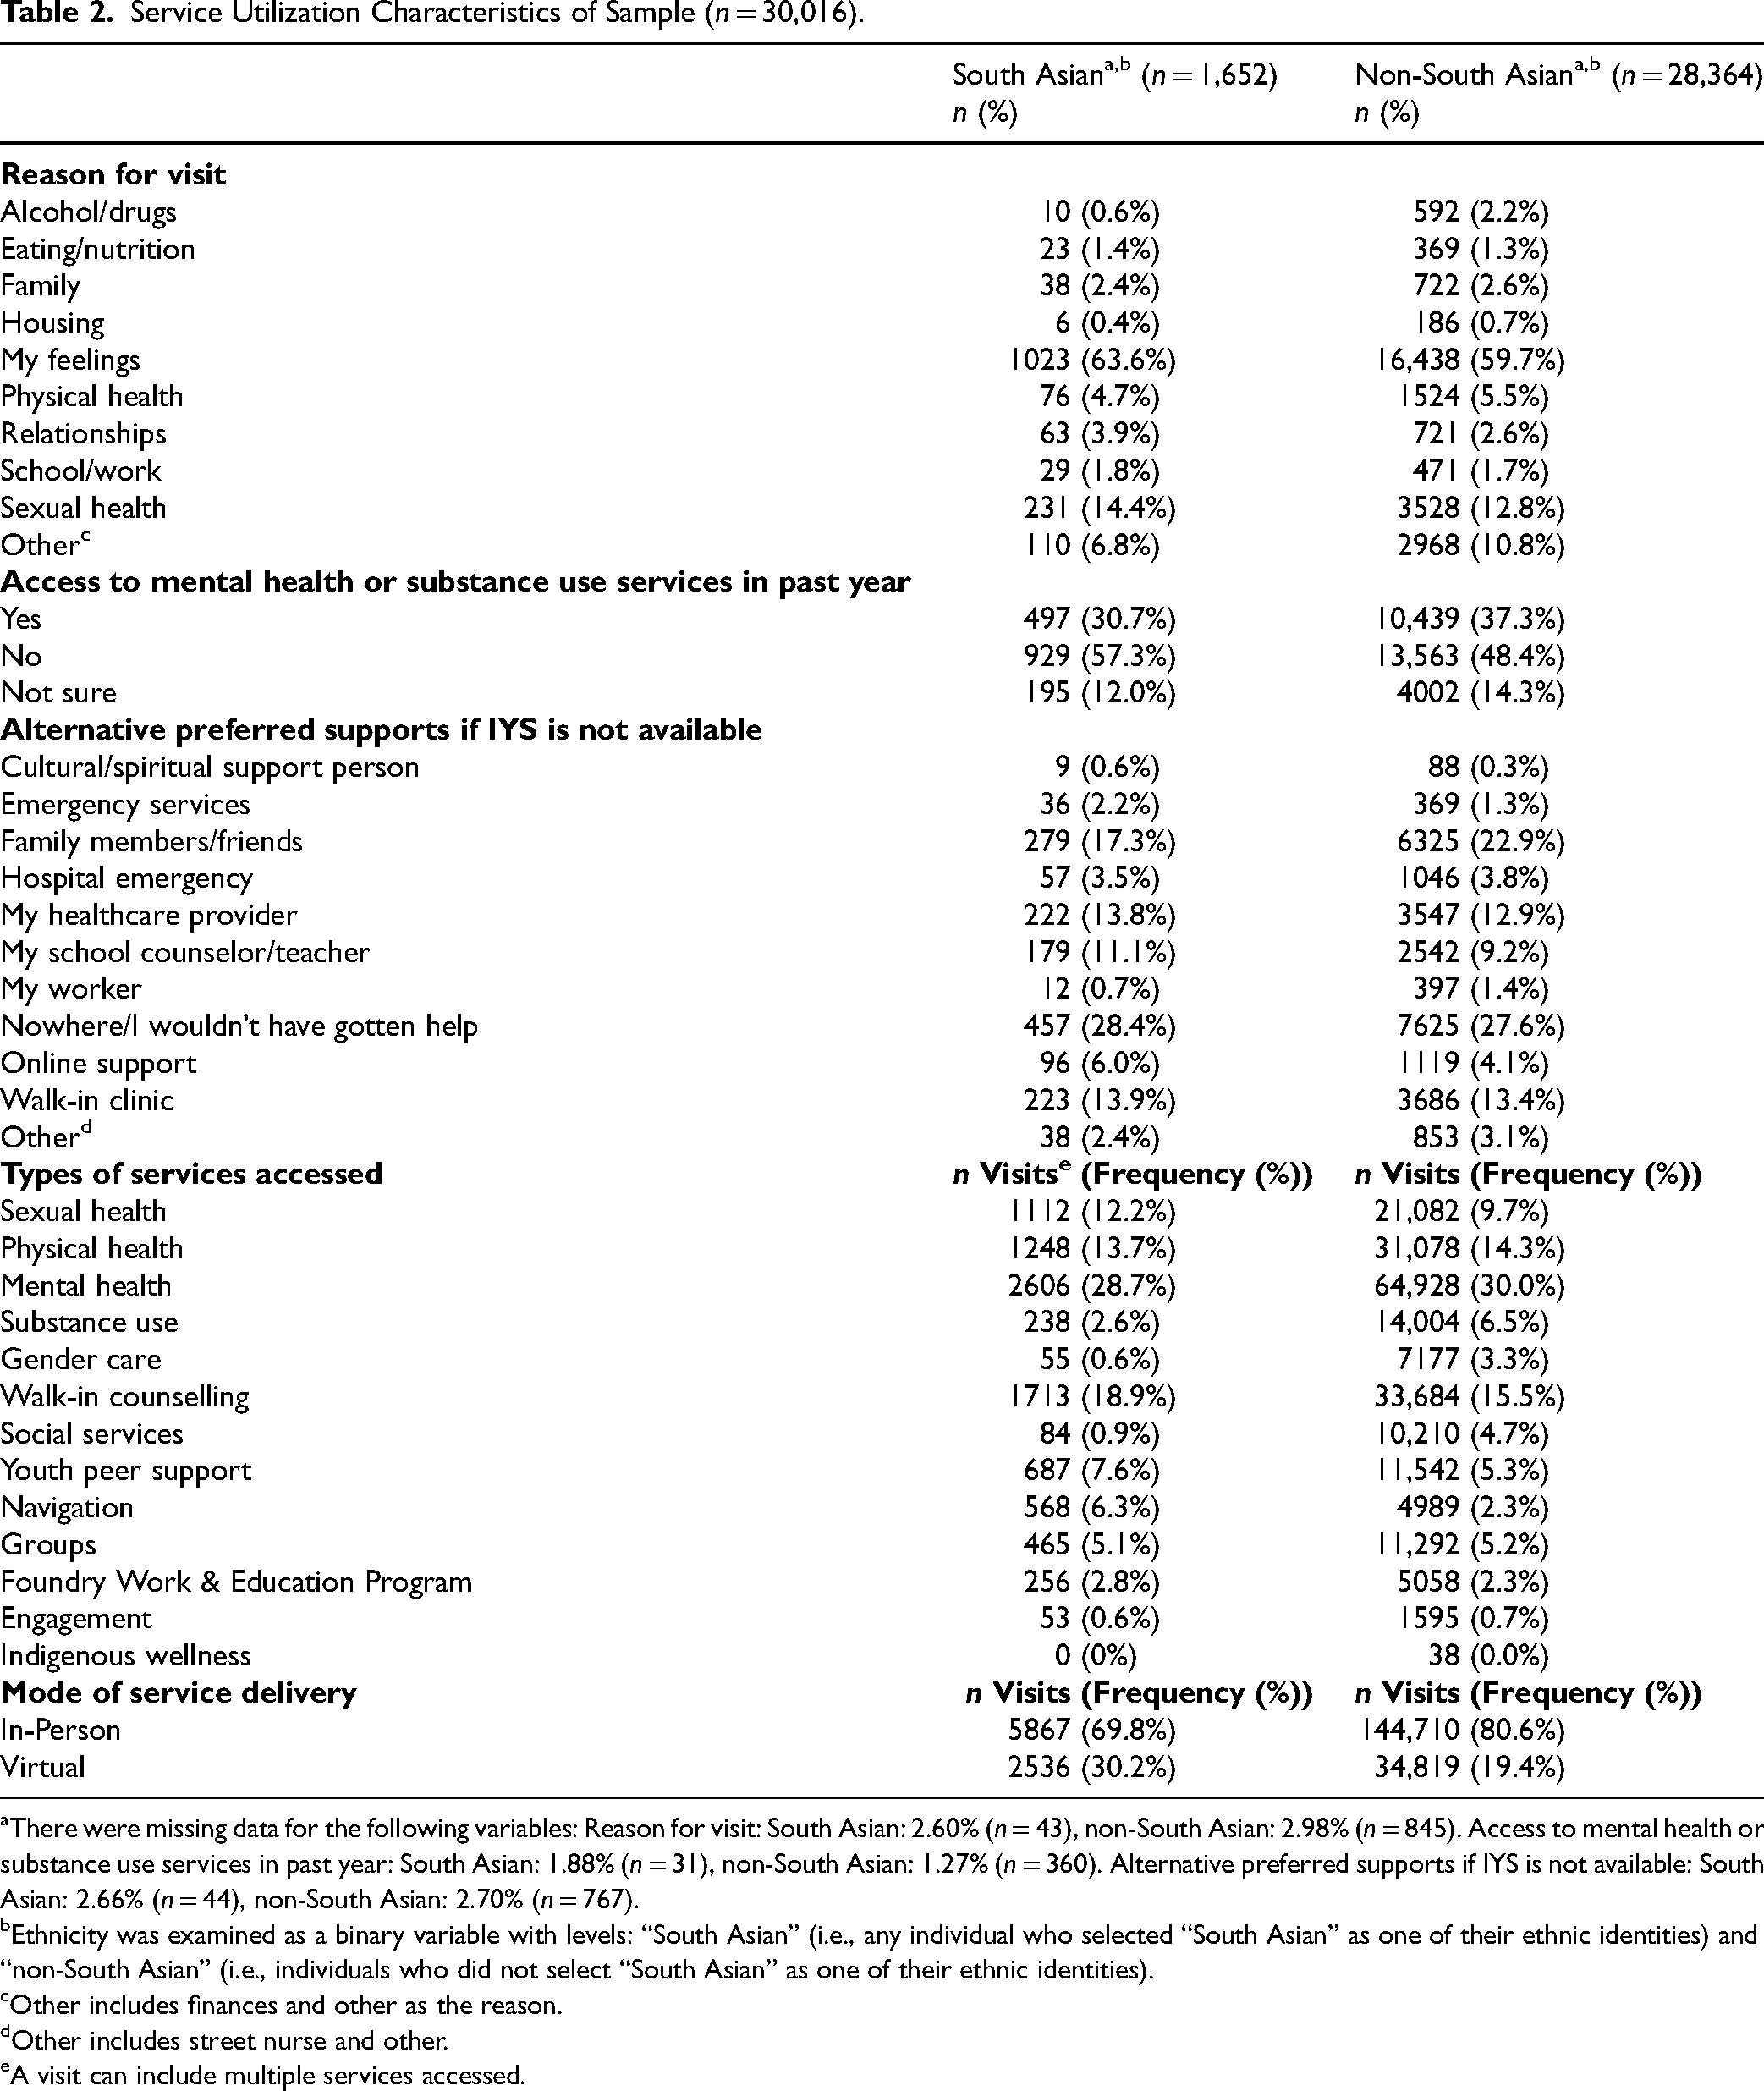
aThere were missing data for the following variables: Reason for visit: South Asian: 2.60% (n = 43), non-South Asian: 2.98% (n = 845). Access to mental health or substance use services in past year: South Asian: 1.88% (n = 31), non-South Asian: 1.27% (n = 360). Alternative preferred supports if IYS is not available: South Asian: 2.66% (n = 44), non-South Asian: 2.70% (n = 767).
bEthnicity was examined as a binary variable with levels: “South Asian” (i.e., any individual who selected “South Asian” as one of their ethnic identities) and “non-South Asian” (i.e., individuals who did not select “South Asian” as one of their ethnic identities).
cOther includes finances and other as the reason.
dOther includes street nurse and other.
eA visit can include multiple services accessed.
South Asian youth reported significantly higher mean K10 scores than non-South Asian youth [32.1 (SD = 9.20) vs. 31.3 (SD = 8.64), P < 0.001] (Table 3). When looking at the categorical distribution of K10 scores, chi-square analyses revealed that ethnicity was associated with mental distress severity (P = 0.005). For instance, more South Asian youth (64.5%) reported experiencing “very high distress” (score 30–50) compared to non-South Asian youth (61.0%).
Mental Health Distress Characteristics of the Study Sample (n = 30,016) as Measured by the Kessler Distress Scale (K10).
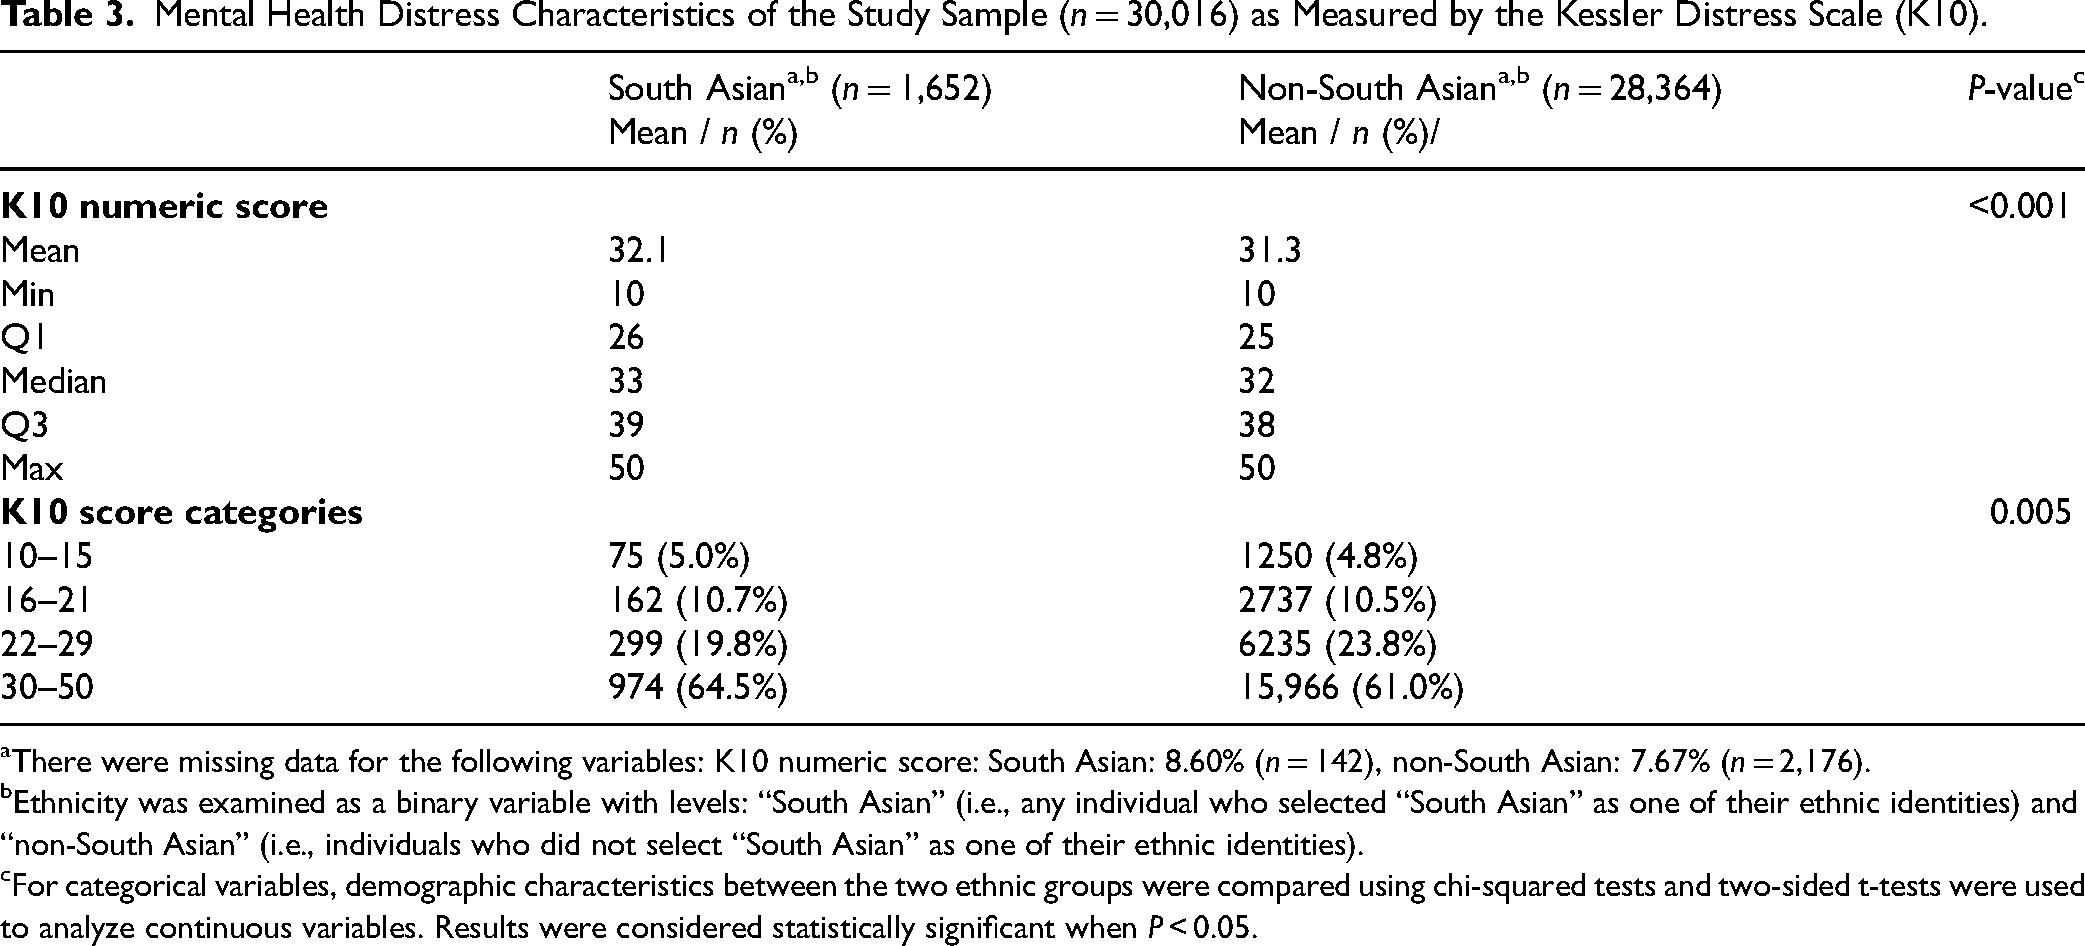
aThere were missing data for the following variables: K10 numeric score: South Asian: 8.60% (n = 142), non-South Asian: 7.67% (n = 2,176).
bEthnicity was examined as a binary variable with levels: “South Asian” (i.e., any individual who selected “South Asian” as one of their ethnic identities) and “non-South Asian” (i.e., individuals who did not select “South Asian” as one of their ethnic identities).
cFor categorical variables, demographic characteristics between the two ethnic groups were compared using chi-squared tests and two-sided t-tests were used to analyze continuous variables. Results were considered statistically significant when P < 0.05.
The results of the regression analysis (unadjusted) revealed a significant relationship between ethnicity and mental distress, with a more substantial effect seen in the TGNC strata (Table 4). For youth identifying as cisgender, being South Asian was found to be associated with a 1.13 (95% CI, 0.66 to 1.60) point increase in K10 score (P < 0.001) compared to non-South Asian cisgender youth. For youth identifying as TGNC, being South Asian was associated with a 2.00 (95% CI, 0.35 to 3.66) point K10 score increase (P = 0.018). The results from the age-adjusted model were similar; however, they did indicate that age slightly modifies the relationship between ethnicity and mental distress. These results were seen across both gender strata, with a younger age being associated with reporting higher levels of mental distress (cisgender: −0.07 (−0.10, −0.03), P < 0.001; TGNC: −0.14 (−0.21, −0.06), P < 0.001).
Regression Analysis of the Relationship Between Ethnicity and Mental Health Distress as Measured by the K10 Score, Stratified by Gender Identity, and Unadjusted (Model 1) or Adjusted (Model 2) for Age.
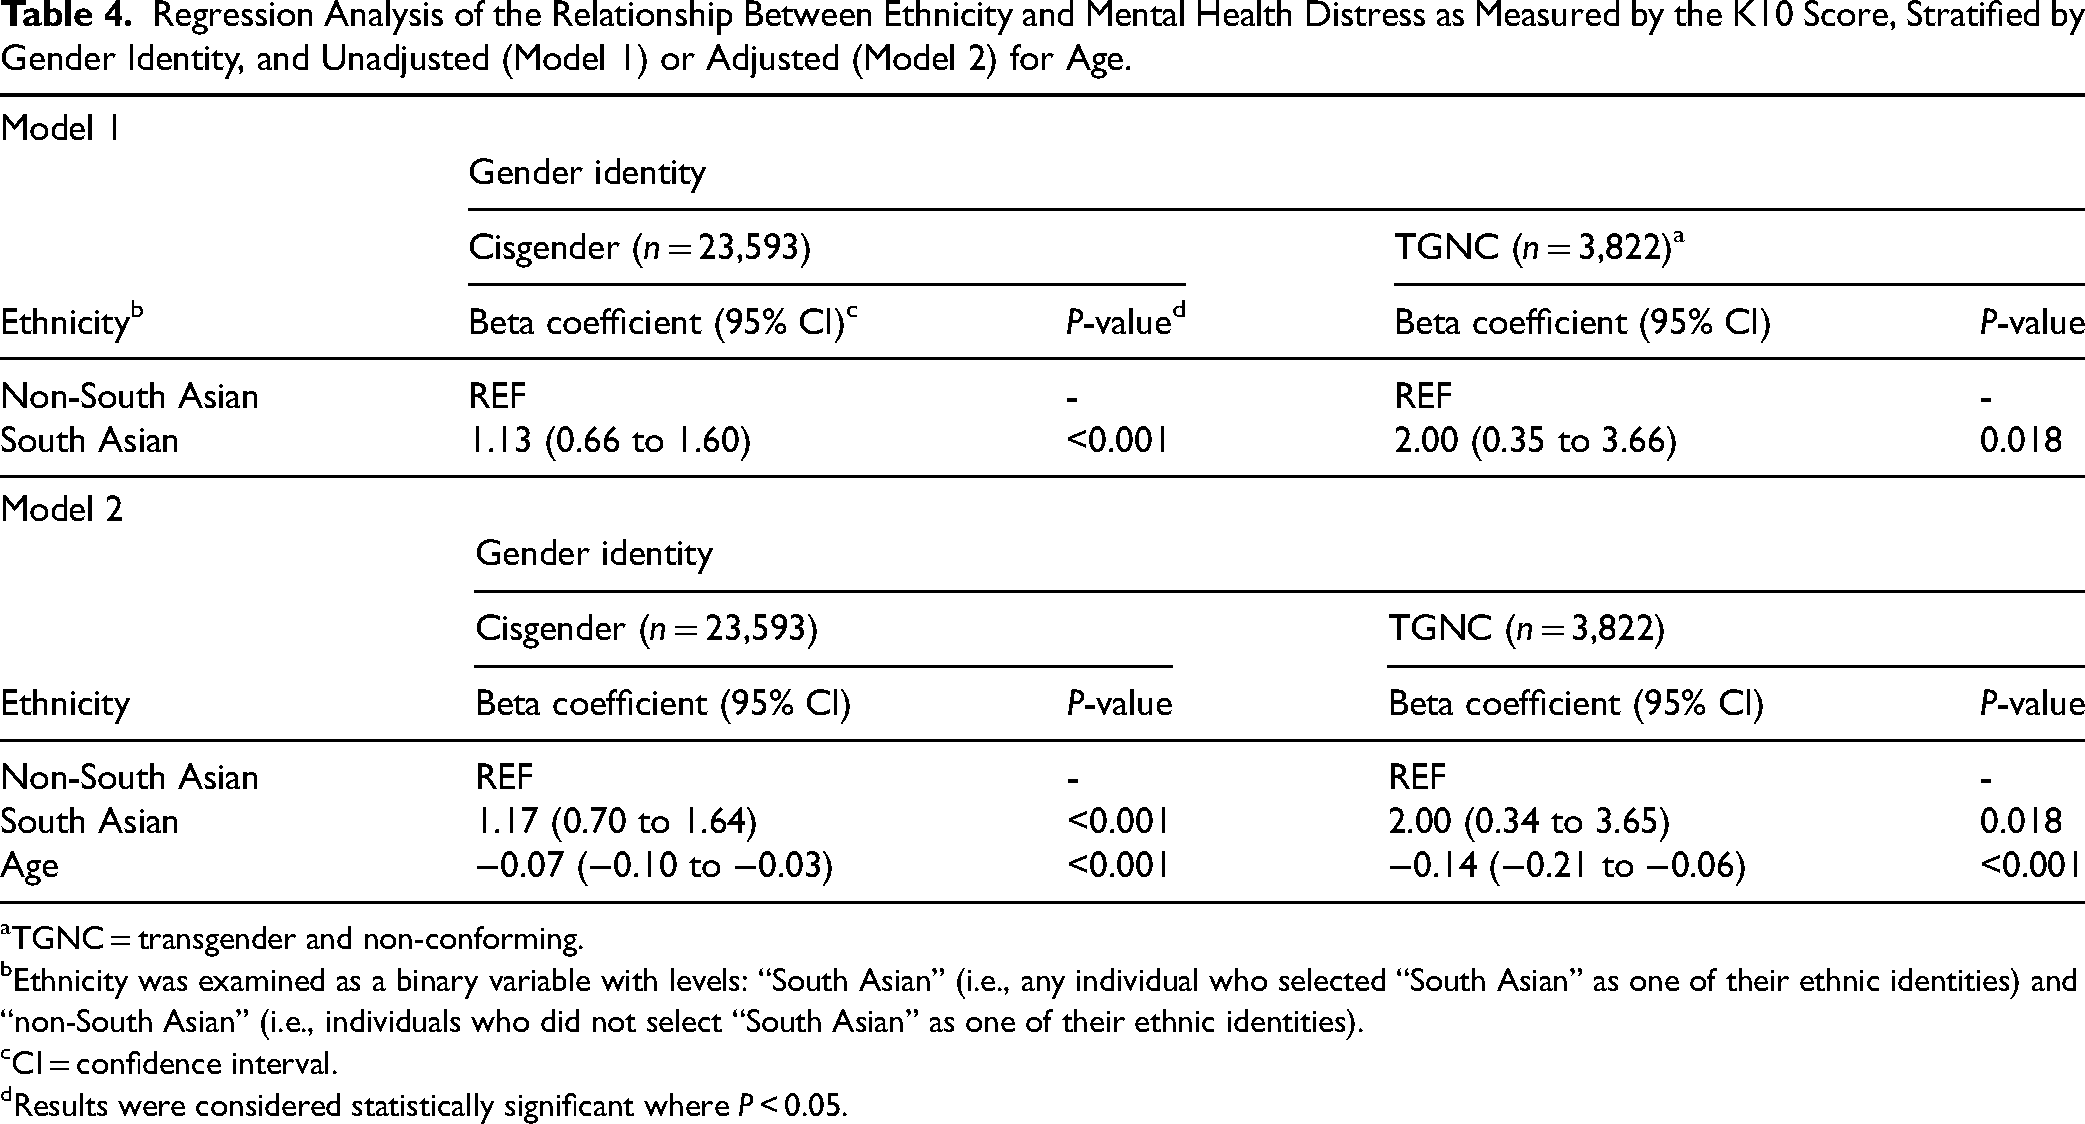
aTGNC = transgender and non-conforming.
bEthnicity was examined as a binary variable with levels: “South Asian” (i.e., any individual who selected “South Asian” as one of their ethnic identities) and “non-South Asian” (i.e., individuals who did not select “South Asian” as one of their ethnic identities).
cCI = confidence interval.
dResults were considered statistically significant where P < 0.05.
Discussion
The study objective was to explore and understand differences in mental health distress, demographic characteristics and patterns of service utilization between South Asian and non-South Asian youth accessing IYS in BC. Our results showed that South Asian youth who accessed IYS in BC reported higher levels of mental distress than non-South Asian youth. We also found that, compared to non-South Asians, South Asian youth reported less gender diversity and less diversity in sexuality, lower access to mental health or substance uses services prior to accessing Foundry and higher rates of using Foundry's provincial virtual service. This pattern was observed across both examined gender strata (i.e., cisgender, TGNC). These findings contribute to the emerging body of literature surrounding the differential mental health experiences of racialized populations in Canada.5,33,34 For instance, a 2018 study examined self-reported mental health status, service utilization, and unmet needs when accessing mental health services in diverse populations from the Canadian Community Health Survey from 2001 to 2014. 5 Results suggested that South Asian, Chinese and Black respondents were significantly less likely to report either lifetime suicidal ideation or a lifetime mood or anxiety disorder diagnosis than white respondents. A lower prevalence of diagnosed mood and anxiety disorders due to not seeking care was also found among South Asian, Chinese and Black respondents compared to white respondents. The results suggested that ethnicity was an independent risk factor in mental health experiences and prevalence. 5 Our findings compare to data collected through Statistics Canada's crowdsource survey during the COVID-19 pandemic. 35 This survey found that the South Asian participants had worse mental health outcomes and a higher likelihood of exhibiting symptoms consistent with moderate/severe generalized anxiety disorder compared to other visible minority groups. 35
The results of our study also suggest that age may play a role in the relationship between ethnicity and mental health distress, with results showing younger youth reported higher levels of mental health distress, in line with previous literature. 34 However, given that the differences observed when adjusting for age were modest, further investigation into the influence of age on mental health distress is needed in general, but also specifically within the South Asian population. While this study's findings are consistent with existing literature, it is important to note that most of the current body of research does not explicitly focus on youth and/or the South Asian community. Our study also highlighted some preliminary results related to gender and sexual diversity and experiences of distress among South Asian youth accessing IYS in BC. We found that while South Asian youth reported less sexual diversity (i.e., sexual minority) and gender diversity (i.e., TGNC), those who did identify as TGNC experienced higher levels of distress than non-South Asian TGNC youth. These results indicate that the intersection of ethnicity and gender identity may be crucial in this population. Our results align with existing evidence showing higher rates of mental health challenges among gender-diverse populations. However, our results do not explain the underlying causes of these disparities. Based on previous literature, we hypothesize that contributing factors may include stigma, shame and a lack of accessible or appropriate services.19–21,23,26,27 It is important to note that TGNC youth only accounted for a small percentage of the analytic sample, resulting in less certainty around these results (as seen in the large confidence intervals in the regression models). This is, therefore, a critical area for future research. Recognizing and understanding the distinct mental health outcomes and needs of the ethnically diverse lesbian, gay, bisexual, transgender and trans, queer and questioning, intersex, asexual or agender, and two-spirit (LGBTQIA2S+) communities, particularly in the South Asian LGBTQIA2S+ communities, is critical to ensure that mental health services, such as IYS, can adequately support these demographics.
This study provided a preliminary examination of the service use characteristics of South Asian youth accessing IYS in BC. Firstly, worth noting is that, while representing 12.5% of the youth population of BC, South Asian youth represented only 4.9% of the total study sample, indicating that South Asian youth are accessing IYS in BC at disproportionately lower rates than other demographics. 6 These findings echo previous literature on low mental health service utilization rates by South Asian and other visible minority communities.8,11,33,35–37 Other key differences between ethnic groups were observed, such as a higher proportion of South Asian youth reporting that they had never accessed mental health or substance use services in the past year and South Asian youth being more likely to have accessed Foundry's provincial virtual service than the non-South Asian group. While the findings of this study provide only a high-level overview of the service use characteristics of South Asian youth, the results do nevertheless suggest that IYS in BC has an opportunity to tailor services to increase accessibility and better support South Asian youth.
Our study was strengthened by its use of a large dataset, which allowed for a broad analysis of demographic, mental distress and service use characteristics. However, some limitations should be acknowledged within the research and secondary data set. The results do not represent all youth presenting to the IYS. The data set only reports on youth who opted in for the survey and not those who accessed health services but opted out of the survey. Alongside this limitation it is important to note the data collected are primarily for the youth and their care and research is a secondary priority.
There are many limitations in relation to the categories used in the secondary data set specifically for ethnicity and gender. The survey asks about identification and includes both sex and gender options. Hence, the data may not accurately reflect the true gender identities of participants. Due to the small sample sizes of the category responses when parsed out and limited statistical power, the responses for identification (Trans female, Trans male, Non-Binary, Agender, Two-Spirit, Not Sure / Questioning, Prefer not to answer, and I don’t identify with any of these options) were grouped together as TGNC. This is a limitation that results in a heterogeneous category that does not accurately reflect each subgroup's experiences. Individuals who identified as “male” or “female” were grouped to be cisgender, which may not be accurate, as some TGNC youth may also identify as “male” or “female” and vice versa. The dataset currently lacks the necessary detail to make these distinctions and is being updated by the partner organization to better reflect best practices and support research. The demographic survey did not allow for the granular examination of sub-demographics (e.g., Pakistani, Sri Lankan, Punjabi) within the South Asian demographic. These sub-demographics have unique cultural characteristics and may have different experiences related to mental health. For this analysis, ethnicity was analyzed as a binary variable and, therefore, did not explore or compare characteristics within the non-South Asian group, such as between white individuals or other ethnic minorities (e.g., Black, Indigenous) specifically. It is important to recognize that although the results were statistically significant, they may not be clinically significant due to the difference in sample sizes between both groups. Future research should study the relationship between ethnicity, mental health outcomes and characteristics amongst these smaller sub-groups. Another limitation worth noting is that the representativeness of our data may have been limited due to the current geographic locations of Foundry centres. For instance, at the time of the study, there was no IYS centre in Surrey, BC, one of the areas most densely populated by the South Asian community. While individuals can visit any Foundry centre, regardless of where they reside, not having a centre in proximity may limit access to IYS for some South Asian youth. Finally, it is important to acknowledge that our findings are limited to youth who have accessed IYS in BC. IYS service models differ slightly between jurisdictions and are also not the only avenue through which youth can access mental health services. Our findings may not be generalizable to the experiences and outcomes of youth accessing mental health services outside IYS or BC.
Conclusion
Overall, this study found that South Asian youth have different experiences and outcomes than non-South Asian youth when it comes to their levels of mental health distress, demographic characteristics and service utilization patterns when accessing IYS in BC. These results indicate that there is a need to further tailor IYS services to meet the needs of this demographic and ensure that IYS is accessible and providing adequate support to South Asian youth. As IYS continue to expand across BC, opportunity exists to engage youth and families/caregivers from these communities to understand the unique needs of South Asian communities, including the intersections of ethnicity with other marginalizations, including gender and sexuality. Addressing these specific needs is crucial not only for the South Asian demographic but also to all youth accessing IYS to ensure equitable and accessible care. This information will be critical to help tailor and create culturally responsive and evidence-based services. Importantly, this study provides essential learnings that will inform future efforts to optimize the health outcomes and experiences of South Asian youth in BC and beyond.
Footnotes
Acknowledgments
We acknowledge, with much gratitude, that our work takes place on land steeped in rich Indigenous history and home to many First Nations, Inuit, and Métis Peoples today. We recognize and respect Indigenous People as traditional stewards of this land and the enduring relationship that exists between Indigenous Peoples and their traditional territories. We also wish to thank the many contributors across the Foundry network whose contributions make this work possible.
Data Availability
Access to data provided by Foundry is subject to approval but can be requested for research projects through Foundry Data Stewards. This research project has undergone a thorough review and approval by Foundry Central Office Data Stewards to ensure that the research methods, data collection procedures and data management practices complied with established data governance and stewardship policies and procedures. All inferences, opinions and conclusions drawn in this publication are those of the author(s), and do not necessarily reflect the opinions or policies of Foundry.
Declaration of Conflicting Interests
The authors declared no potential conflicts of interest with respect to the research, authorship, and/or publication of this article.
Ethical Standards
Ethics for this study was approved by the University of British Columbia Providence Health Care Research Ethics Board (H21–01510). All methods were carried out in accordance with relevant guidelines and regulations from this research ethics board to ensure this research meets the highest scientific and ethical standards to protect clients, investigators, and the institution.
Funding
The authors disclosed receipt of the following financial support for the research, authorship, and/or publication of this article: This work was supported by Michael Smith Health Research BC.