
Abstract
A better understanding on the connection between pollen assemblages and the vegetation that produced them is crucial to reconstruct past habitats and vegetation. Hence, it is necessary to comprehend the level of representation of plants in the modern pollen rain in a given study area. To ascertain the composition of pollen deposited on the surface sediments, palynological analysis of 19 surface soil (SS) samples and moss cushions (MSs) taken from various sites on the surface of the Shimla Water Catchment Wildlife Sanctuary (SWCWS), Kufri, Himachal Pradesh (India) was used in the current study. The dominance of arboreal pollen (trees and shrubs) over the non-arboreal pollen (herbs) was observed. Among the trees, conifers such as Cedrus deodara, Pinus wallichiana, Picea smithiana and Abies pindrow were found in MSs as well as in SS samples. The representation of these taxa corresponds with their factual presence in the forest floristics in the region. The moist and shady habitats loving broad-leaved tree elements such as Quercus and Rhododendron were also found in good numbers. Two multivariate statistical methods, cluster analysis and principal components analysis, were used to study the associations of studies pollen taxa and the variability among them. All the 19 samples were clustered into four. This analysis will help to interpret the palaeodata whether the landscape was influenced by anthropogenic activities or not in the recent past.
Introduction
The comparative database has contributed significantly to understand the changing vegetation scenario and climate during the Late-Holocene. Such study earlier carried out on surface samples have enabled the precise appraisal of pollen sequence of the past from Khajiar Lake, situated in the temperate zone of Chamba District, Rewalsar and Parasram Tal (lakes) in the subtropical zone of Mandi and Sirmaur Districts respectively, covering the vegetational history of the Late-Holocene period, that is, 4,000 years BP (Sharma, 1985; Sharma & Singh, 1974a, 1974b). However, information available so far on this aspect from Himachal Pradesh is still inadequate, if seen in context to its much wider geographical area and diverse geological settings. Hence, in the present investigation, it is intended to extent such study in Kufri and nearby area of Shimla, Himachal Pradesh through the meticulous investigation of SS samples and MSs garnered from the temperate conifer and broad-leaved oak forests. This is the first comprehensive attempt on pollen rain and vegetation interplay through surface sediment pollen analysis from the Shimla Water Catchment Wildlife Sanctuary (SWCWS), which is a reserve/protected forest and epitome for the reconstruction of recent pollen vegetation data. This data could be helpful to mark various climatic events happened in Quaternary time span. Similar studies have been conducted on SS samples/MSs from the alpine/subtropical belts of Garhwal Himalaya (Bhattacharyya & Chauhan, 1997; Chauhan & Sharma, 2000), Spiti (Chauhan et al., 2000), alpine belt of Rohtang Pass Bhattacharyya (1988), Parvati Valley Chauhan (2006) in Himachal Pradesh as well as subtropical and temperate belts of Kumaon Himalaya (Chauhan & Sharma, 1991, 1993) with altogether identical floristics, that is, pine and oak dominated forests and climatic conditions. The modern analogue evolved on pollen and vegetation interplay has facilitated the assessment of pollen sequences of sediment deposits from the lakes with precision in terms of past vegetation and climate in a time frame.
This is inevitable for prior the pollen analysis of sediment cores/profiles in order to reconstruct past vegetation and climatic changes in any region. Some studies have been executed concerning pollen deposition pattern in relation to modern vegetation and the regions of Spiti (Chauhan et al., 2000), Parvati valley (Chauhan et al., 2022; Farooqui et al., 2021).
Regional Setting
Study Area
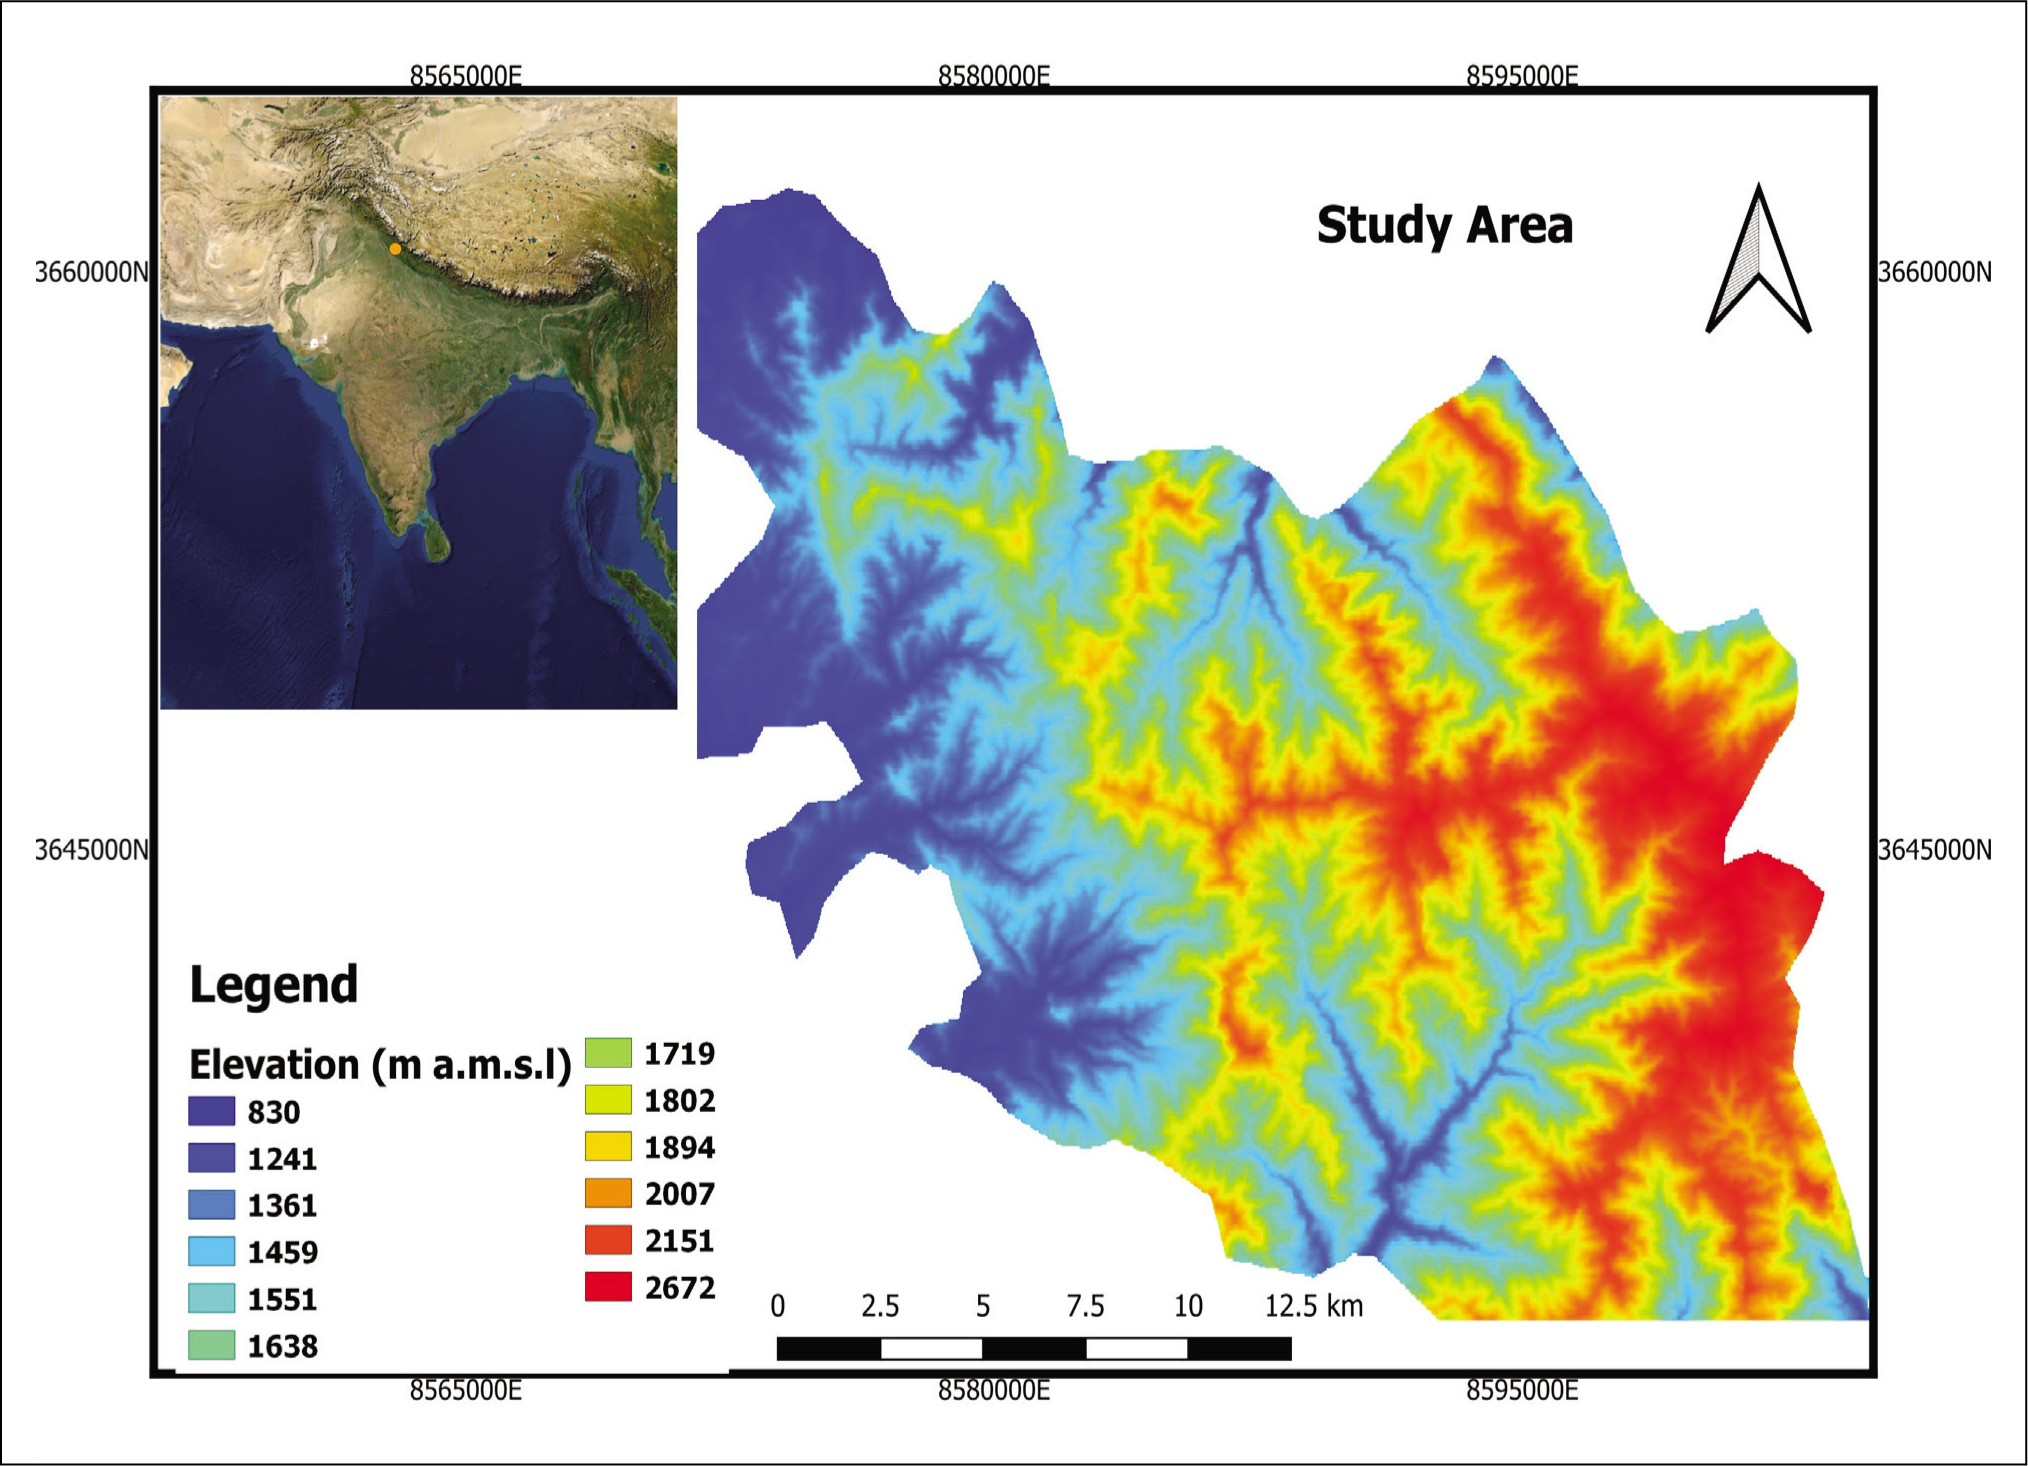
The SWCWS (Figure 1), chosen as our study location, is situated in the Lesser Himalayas between 31º05' and 31º75' North and 77º12' and 77º12' East, including an altitudinal range of 1850 m to 2,750 m. The SWCWS is degraded by sporadic streams that eventually coalesce into permanent streams. The terrain within the region is at times moderately to extremely steep and abrupt. Shimla Water Catchment territory is mainly rectangular and completely surrounded by Shimla Forest Division (Rana & Kapoor, 2015). The region is the primary water catchment area surrounding Shimla and represents the high alpine forest in the western Himalayan foothills (Gaston et al., 1981). The terrain of the sanctuary exhibits Blaine’s geological sequence of metamorphic schist, shales and slates (Rana, 2015).
Map of Kufri region showing the investigation sites.
Climate
The area experiences predominantly cool with average annual temperature of 12.7 °C, in winters and summers being moderately warm. The average temperature ranges from –6°C to 31°C over the course of a year. The summer temperature ranges between 19°C and 28°C (April to mid-June), whereas the winter temperature ranges between –1°C and 10°C (October to March) and precipitation in August is 434 mm more than in November. During winters and springs, the average monthly precipitation is approximately 45 mm but it reaches 175 mm in June as the monsoon approaches, with July and August being the wettest months (Rana, 2015).
Vegetation
The primary vegetation of the SWCWS comprises conifer forests of which Abies pindrow (Fir)-Picea smithiana (Spruce) are major constituents on the higher elevations in the upper temperate zone. On the lower temperate belt, however, pure forests of Cedrus deodara (deodar) and Pinus wallichiana (blue pine) exist. The latter one occurs in the form of secondary formation in the erosion prone hill slopes. The conifer forests are generally devoid of undergrowths. The Oak formations consisting Quercus leochotrichophora, Q. dilitata along with Rhododendron arboretum, Lyonia ovalifolia, Aesculus indica, Cinnamomum zeylenicum, Prunus cerasoides Ilex aquifolium (Holly), Bauhinia varigata, etc., are found in restricted shady hill slopes and moist valleys. The shrubs including Daphne papyracea, Prinsepia utilis, Berberis asiatica, Indigofera gerardiana, Rosa moschata, Rubus ellipticus, R. niveus, Viburnum cotonifolium, Zanthoxylum alatum, Pyracantha crenulata, Carissa opaca, etc., are abundant in the broad-leaved oak forests. The ground flora includes grasses, ferns and vascular herbs. The principal herbaceous elements are Anagallis arvensis, Primula vulgaris, Potentilla fulgans, Geranium nepalense, Anemone coronaria, Thalictrum foliosum, Viola spp., Fragaria nebicula, Impatiens balsamina, Bergenia lingulata, Gerbera gossypiana, etc. Some of the most dominant families recorded among the angiosperms are Asteraceae, Poaceae, Lamiaceae, Fabaceae, Rosaceae, Orchidaceae, Ranunculaceae, Polygonaceae, Apiaceae, Cyperaceae, Liliaceae, Brassicaceae, Caryophyllaceae, Acanthaceae and Solanaceae. Orchids, such as Coelogyne cristata, Luisia zelyanica, Oberonia acaulis, etc., are very frequent. Moist and shady condition-loving ferns like Adiantum capillusveneris, Diplazium esculatum, Dryopteris cochleata, Athyrium pectinatum, Blechnum orientale, Pteris multifida, etc., are common in oak forests. The lower section of the sanctuary is inhabited by Pinus roxburghii and Cupressaceae (Rana, 2015; Rana & Kapoor, 2015).
Materials and Methods
Field Survey and Sample Collection
Surface samples (SS and MSs) were picked by hand with a spatula from the forest floor and wood logs where pollen and spores had recently fallen (Figure 2). In total, 19 samples were taken from the linear transact at an interval of 100 m. The sanctuary has situated in hilly terrain and broadly divided in three parts, that is, habitation, buffer and core zones. The habitation zone is the outermost part of the sanctuary with high human interference. Buffer zone is the designated areas used to protect the sensitive landscape patches and least human interference. Along the core zone referred to as the natural and protected area and human interactions and interference are strictly prohibited.
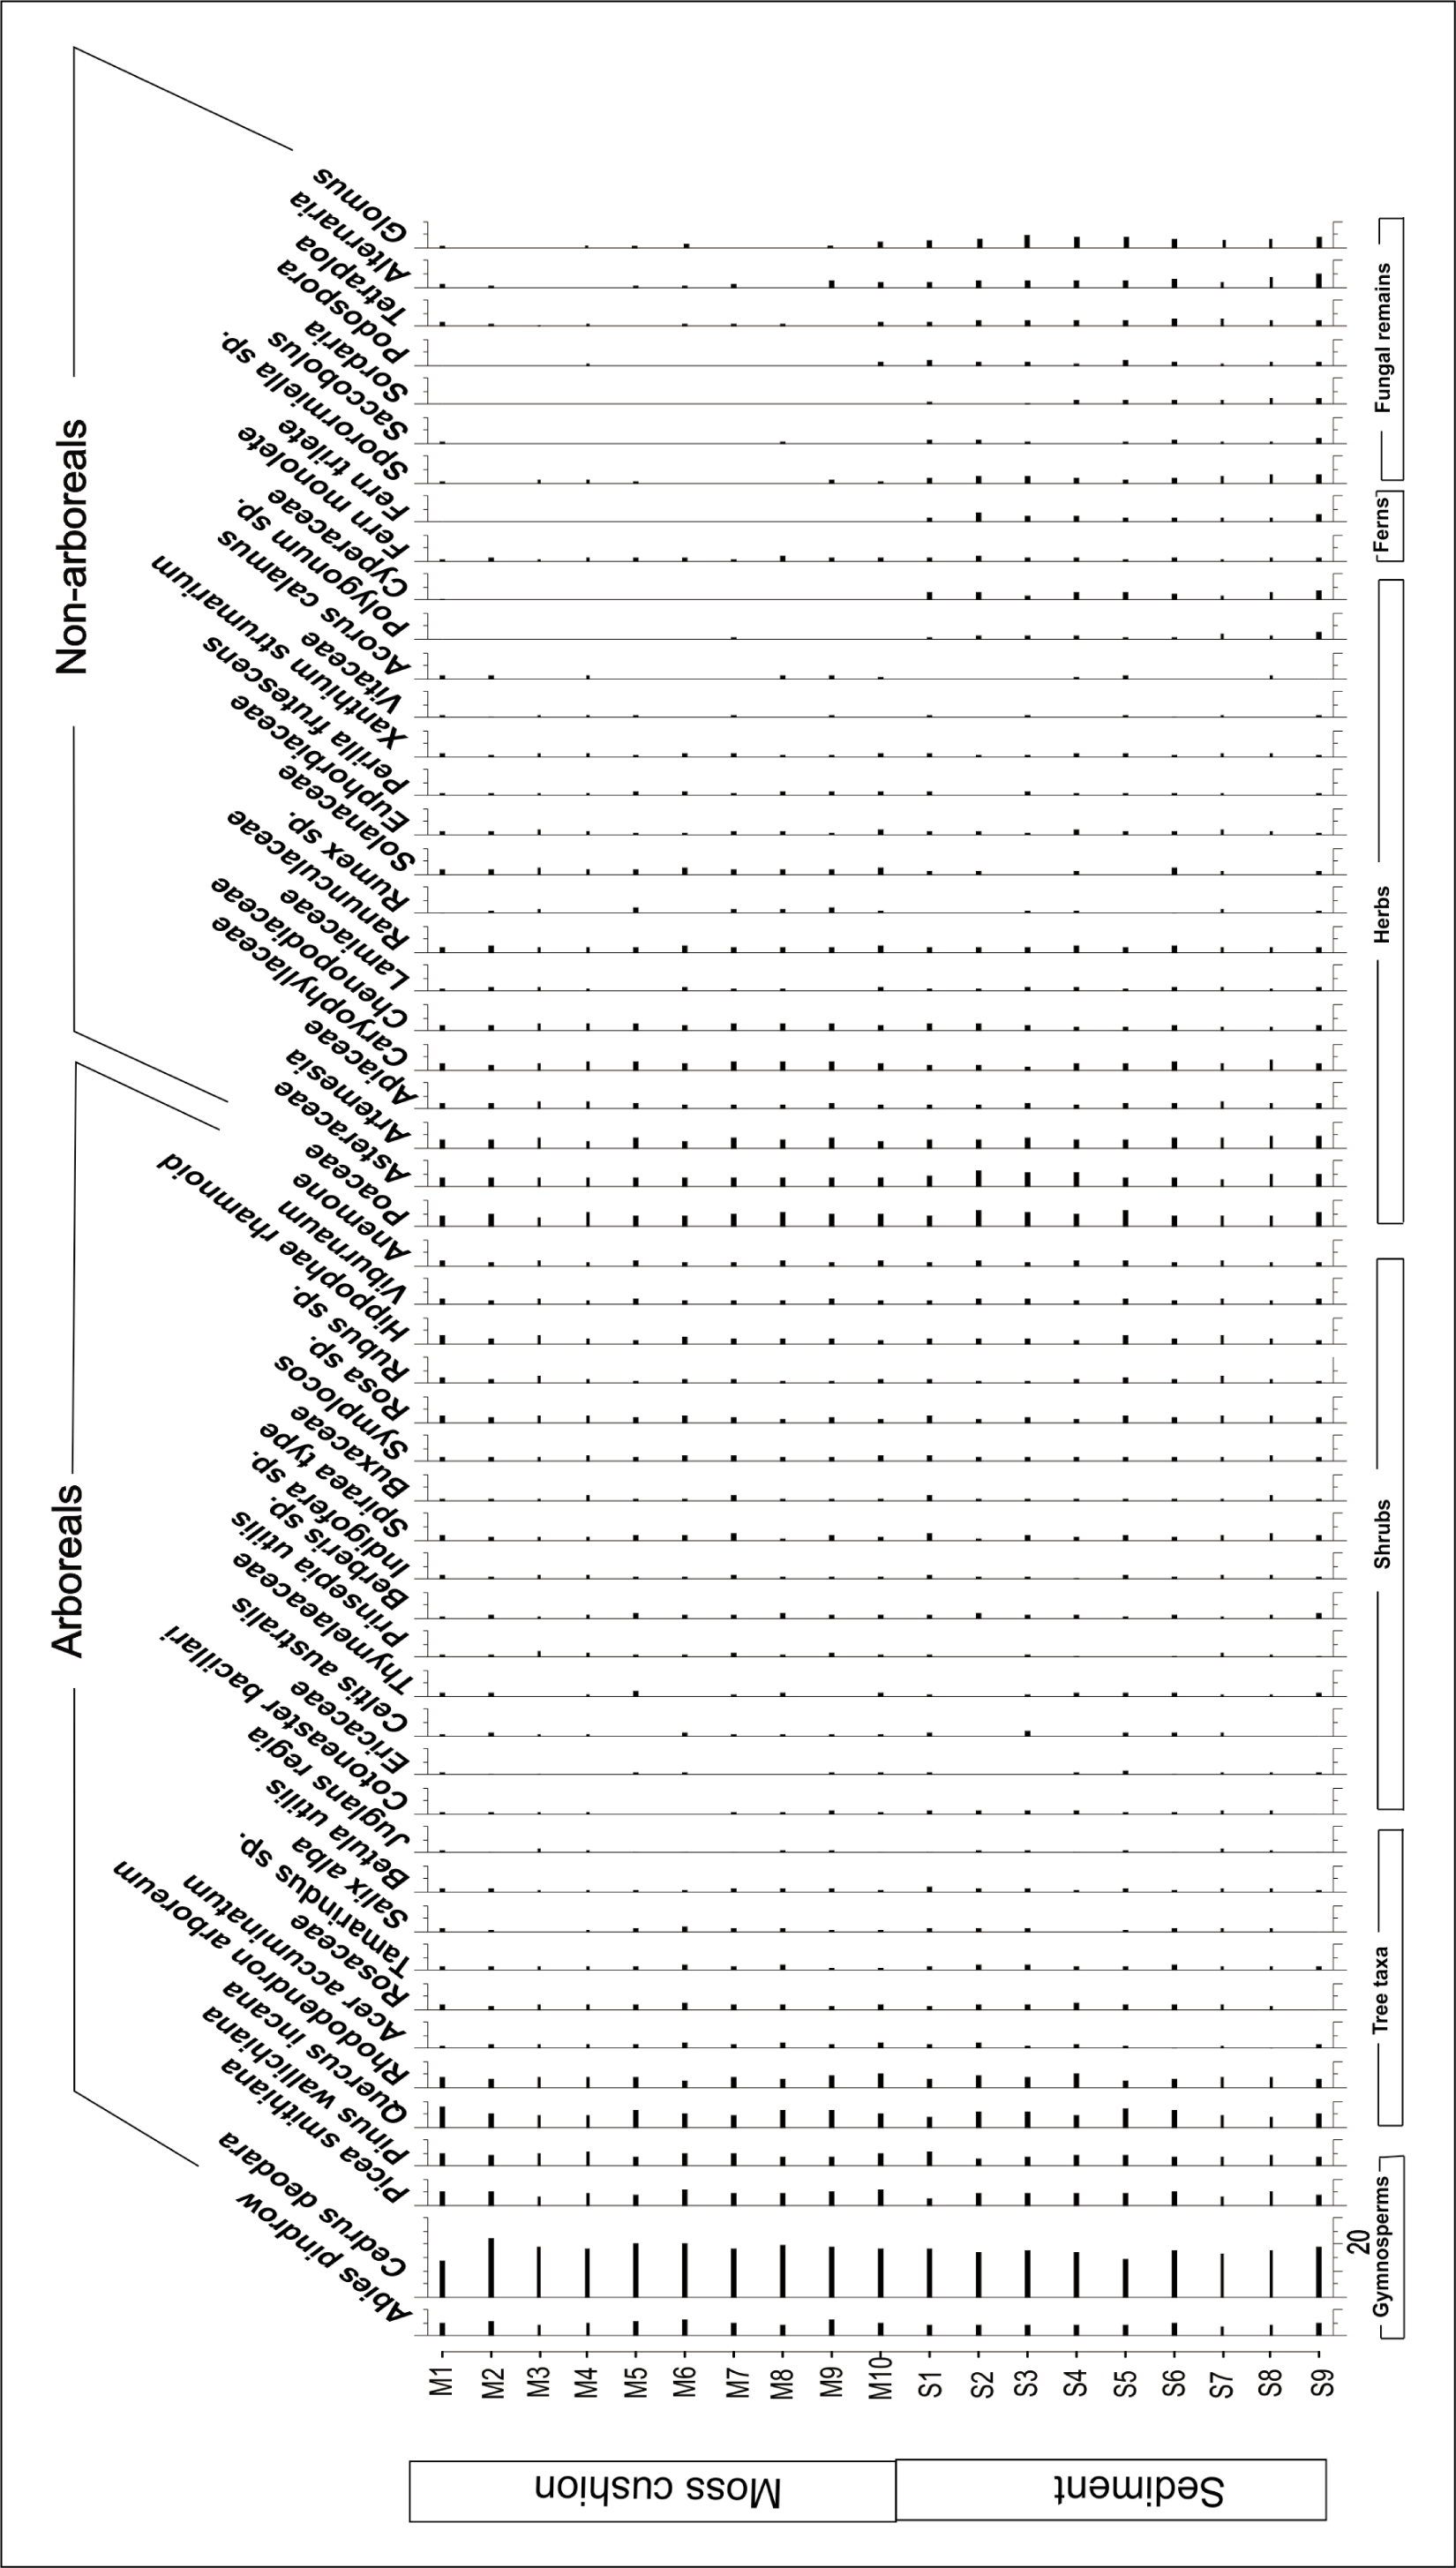
Pollen percentage diagram.
Pollen Extraction
To extract pollen-spores from the sediments, 10 g of sediments were heated in 10% KOH solution for 15 minutes to deflocculate the pollen/spores and dissolve the humus. Following that, the samples were treated with a 40% HF solution to remove the silica. After that, the samples were acetolysed (Erdtman, 1943) with an acetalizing mixture (9:1 ratio of acetic anhydride and concentrated sulphuric acid, respectively).
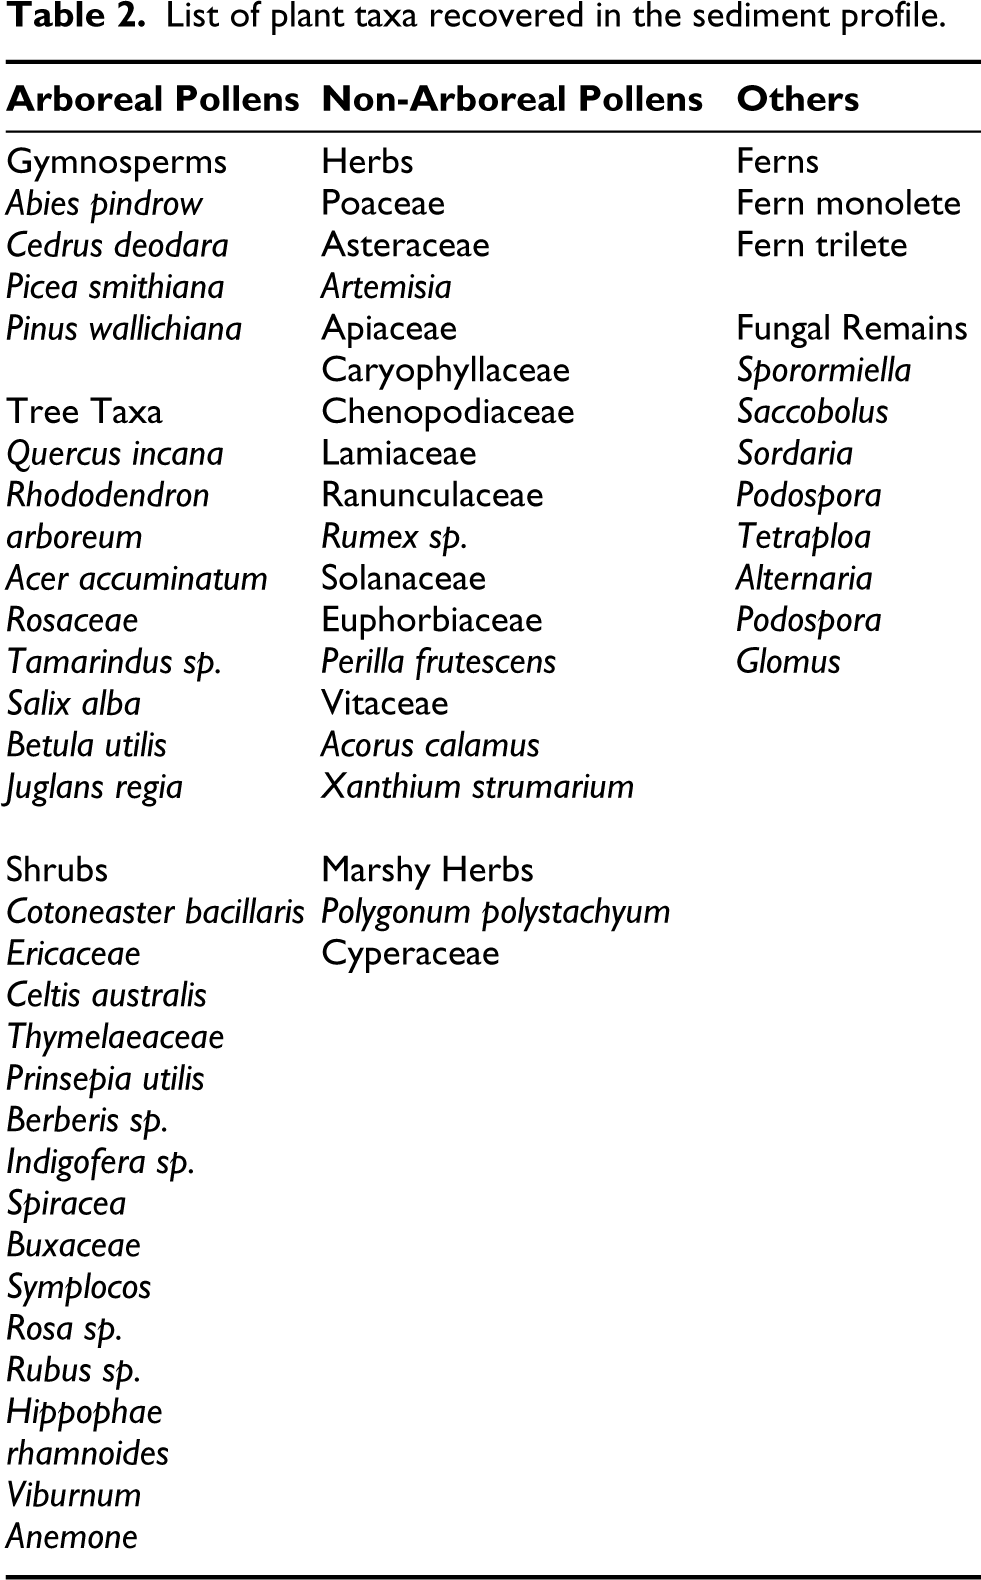
The surface samples extracted pollen-spores were examined on temporary slides placed on glycerine using a 40X Olympus BX53 light microscope. The corresponding pollen diagram depicts the pollen frequency on every taxon (Figures 2 and 3) was prepared by TILIA and TILIA Graph. The pollen sums vary from 300 to 400 depending on the potential of the samples analysed. The pollen sums include only Arboreal Pollen (AP), Non-Arboreal Pollen (NAP) which is considered the Aggregate Pollen Count (APC), Ferns (monolete and trilete) and fungal remains have been debarred from the pollen sums because of their origin from local provenances. The identification of recovered taxa was carried out by consulting reference slides from sporothek of Birbal Sahni Institute of Palaeosciences and published literatures (Chauhan et al., 2000; Demaske et al., 2013; Gupta & Sharma, 1986). Along with depicting ground vegetation, the APC also contains a sizeable volume of pollen grains from plants that do not currently grow close to the sample sites. The recovered pollen taxa are categorised in AP and NAP are arranged in the same sequence in the pollen diagram as well I Pollen Plate. AP includes alpine shrubs, gymnosperms, temperate broad-leaved taxa, shrubs and NAP as herbaceous taxa. Further, trees are placed in the order of their altitudinal distribution, and key plant groups are given in Table 2 and Figure 2.
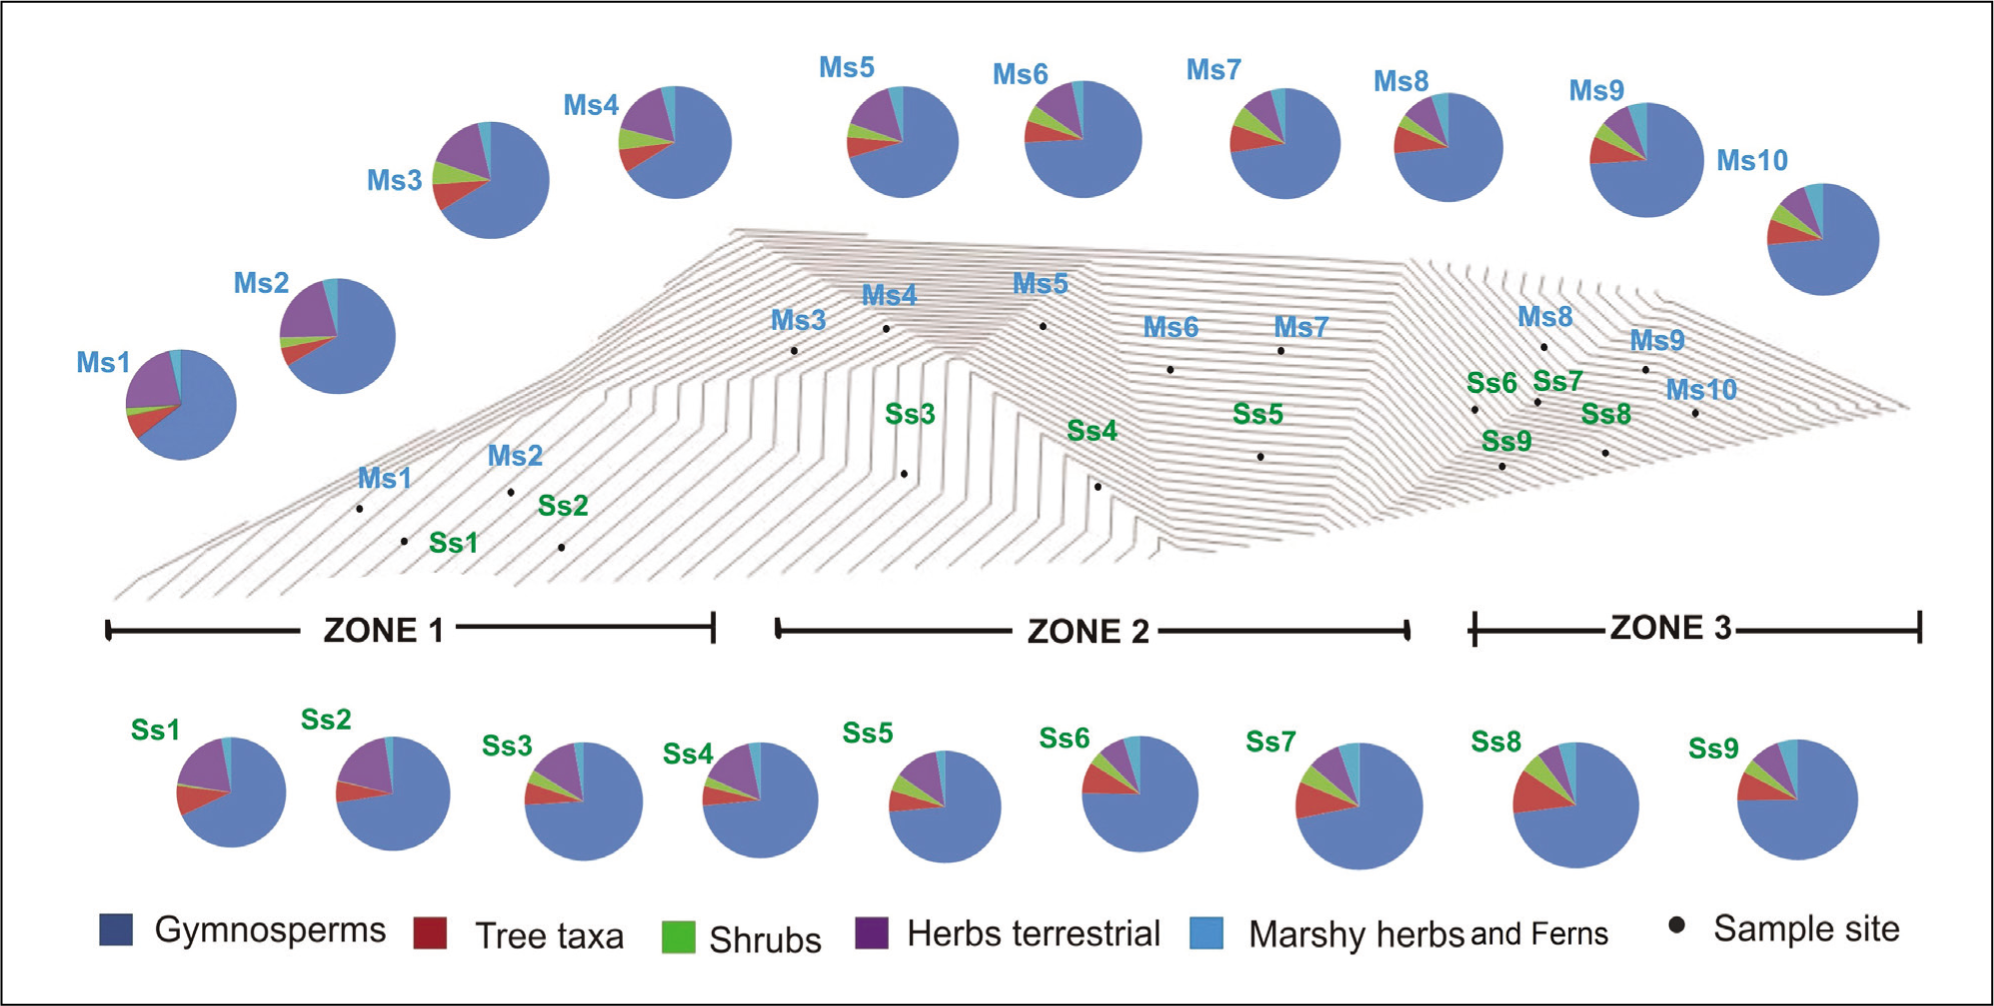
Pie charts showing the percentage contribution of terrestrial pollen ecological groups in different zones.
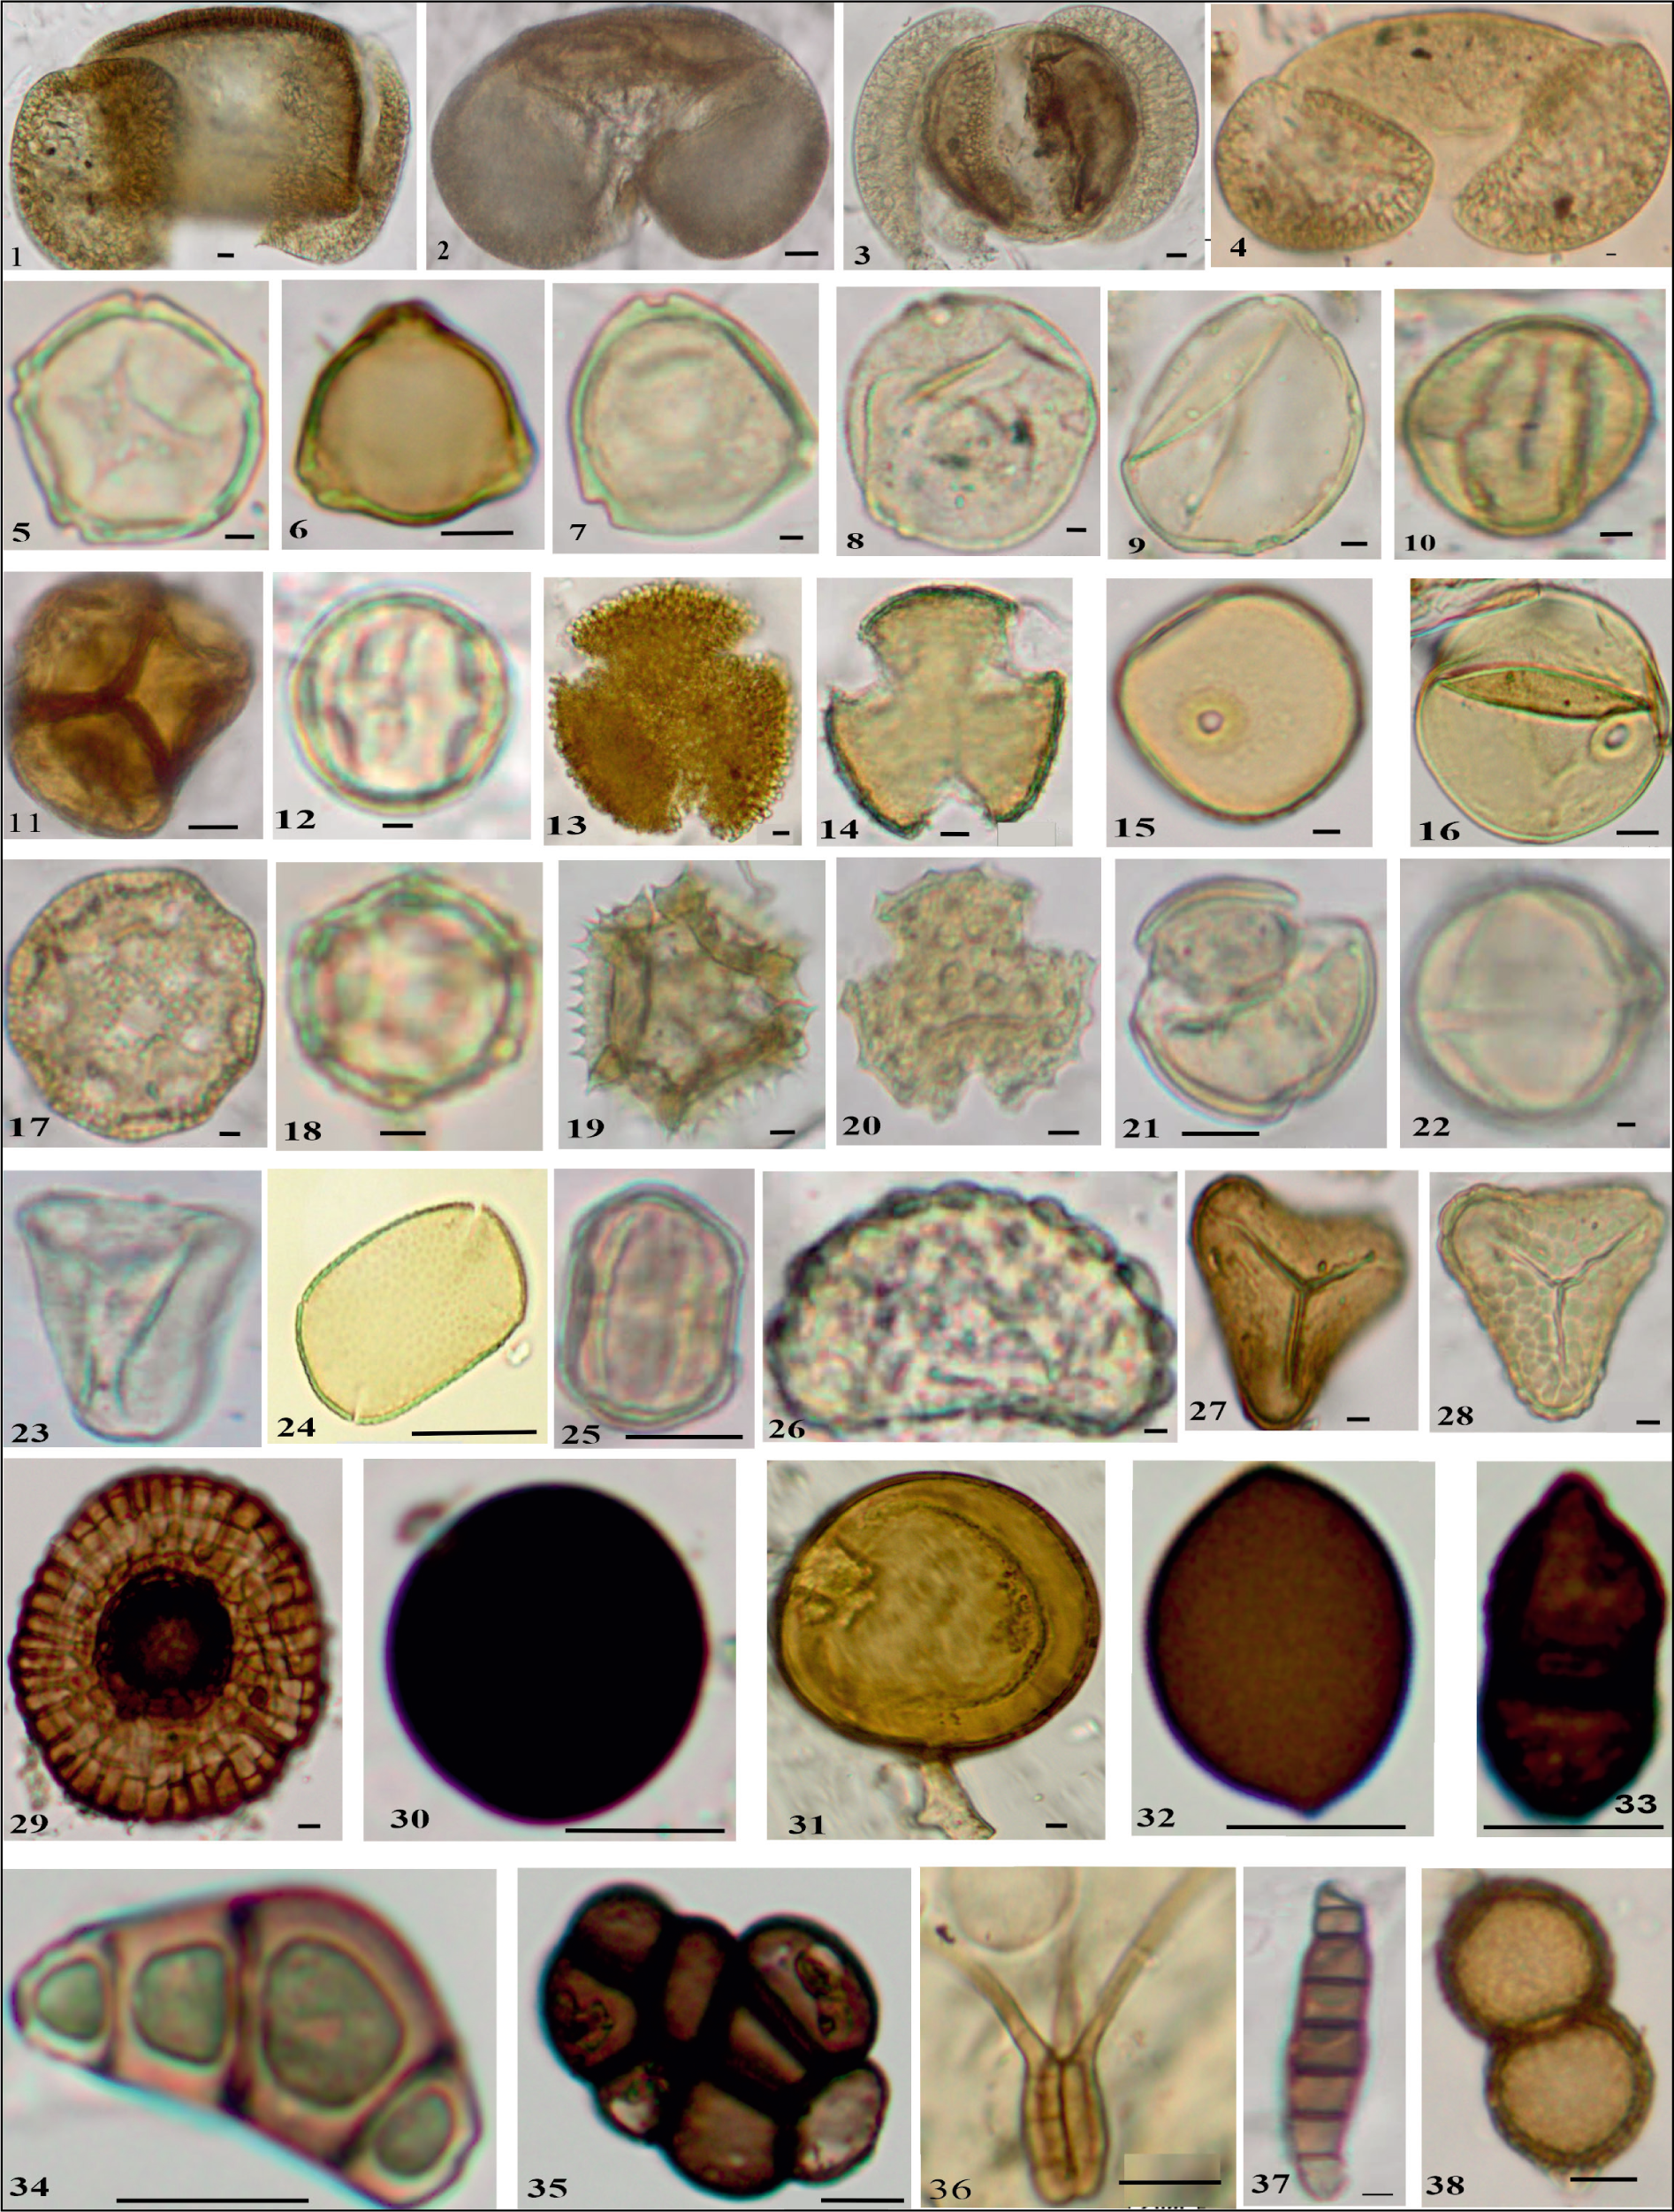
Pollen grains recovered in surface moss cushions/sediments of the Kufri surface sediment samples; 1. Abies; 2. Picea; 3. Cedrus; 4. Pinus; 5. Alnus; 6. Betula; 7. Corylus; 8. Carpinus; 9. Juglans; 10. Quercus; 11. Rhododendron; 12. Crataegus; 13. Oleaceae; 14. Lonicera; 15. Poaceae; 16. Cerealia; 17. Caryophyllaceae; 18. Alternanthera; 19. Asteraceae; 20. Tubuliflorae; 21. Ranunculus; 22. Solanum; 23. Cyperaceae; 24. Impatiens; 25. Polygonum plebeium; 26. Fern monolete; 27. Fern trilete; 28. Fern trilete; 29. Microthyriaceae; 30. Nigrospora; 31. Glomus; 32. Ascospore; 33. Two celled fungal spore; 34. Fungal spore Type I; 35 Multi celled fungal spore; 36. Curvularia; 36. Tetraploa.; 37. Helminthosporium; 38. Diplodia.
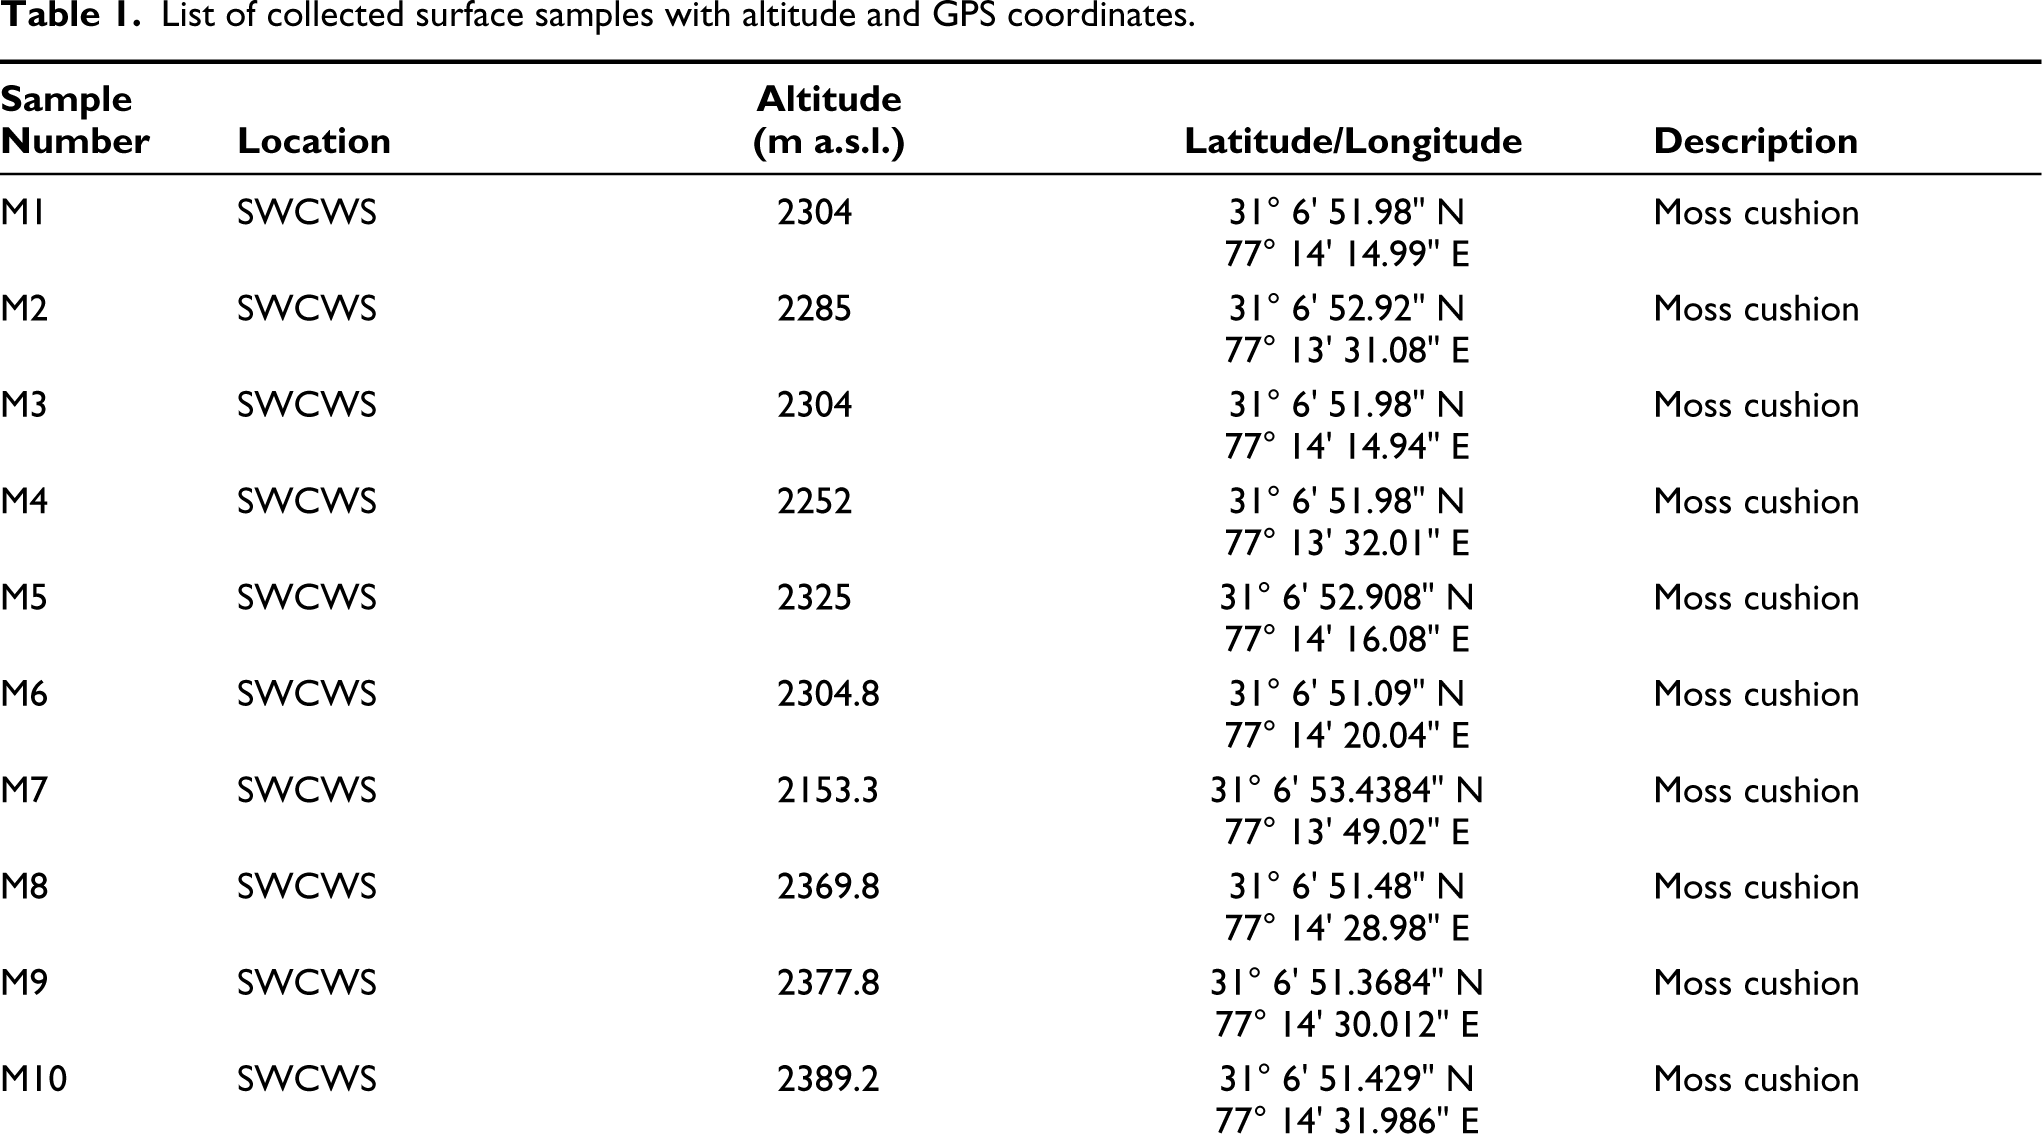
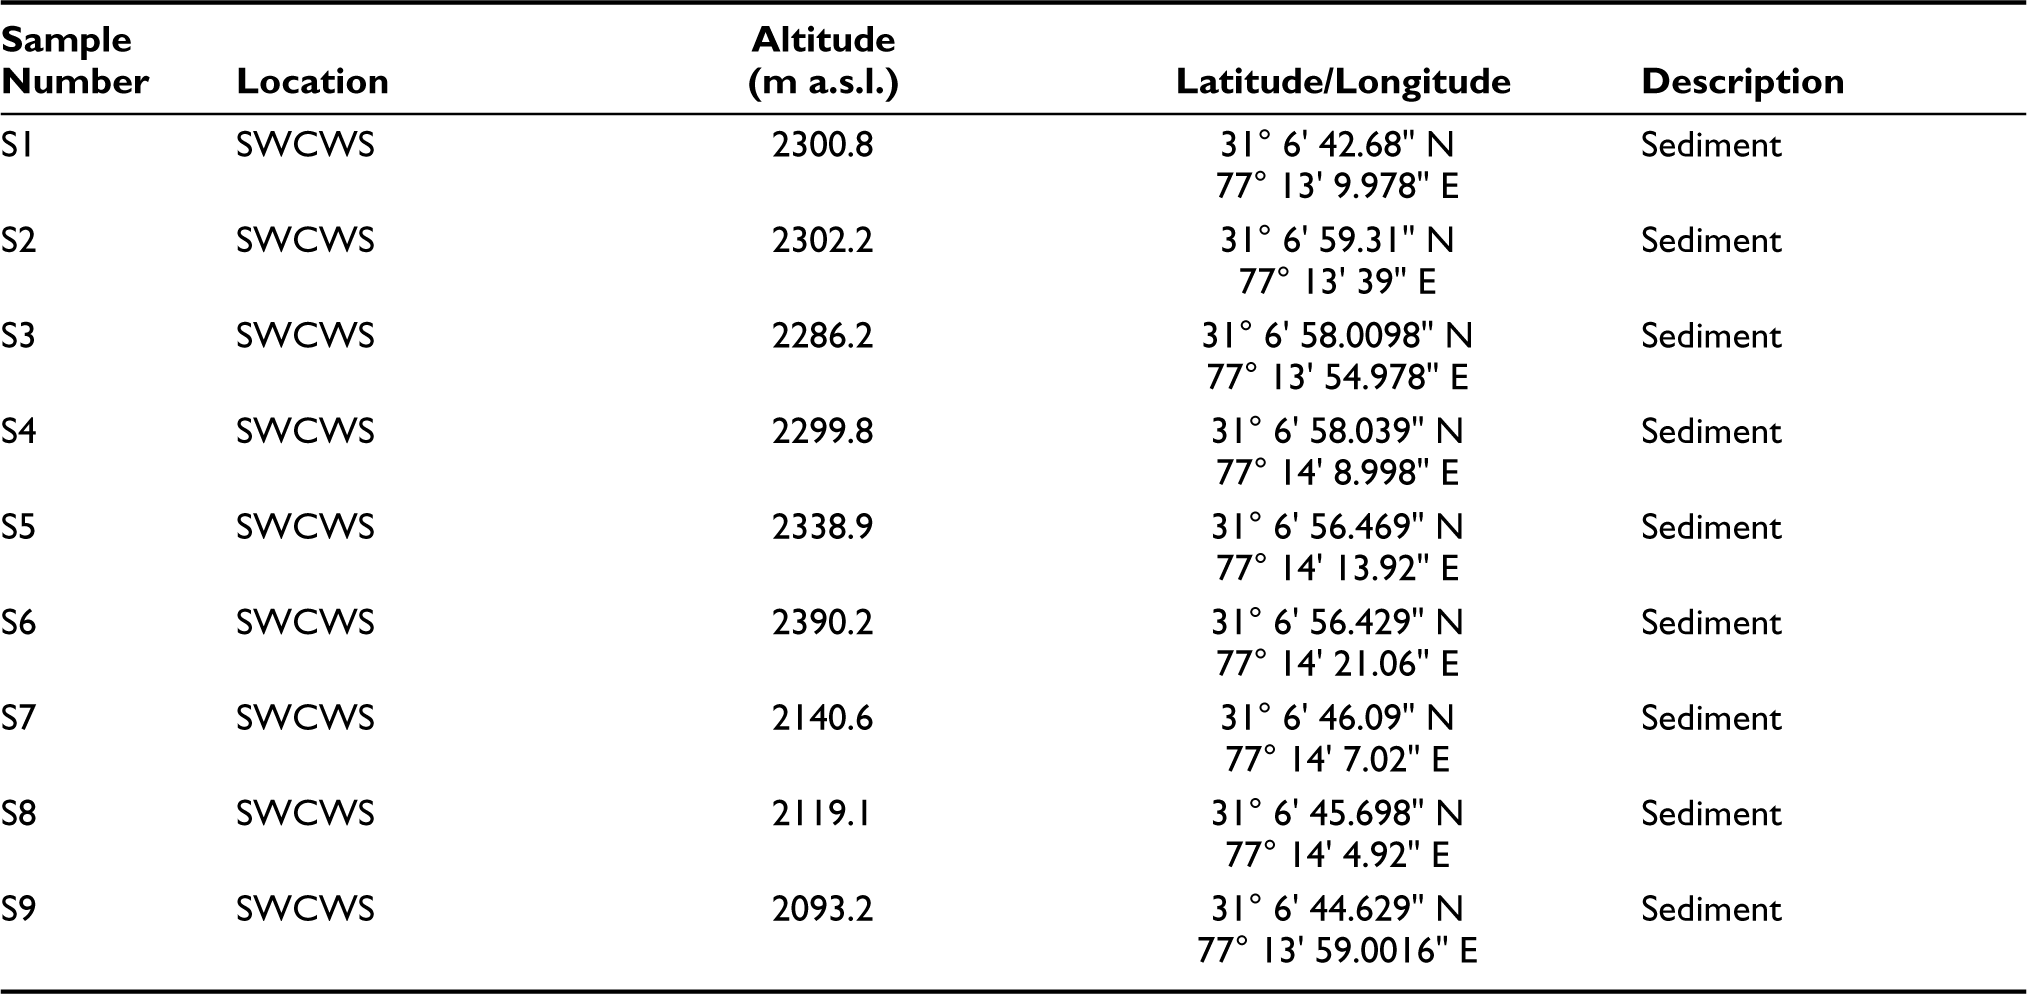
List of collected surface samples with altitude and GPS coordinates.
List of plant taxa recovered in the sediment profile.
Statistical Approach
Statistical analysis is crucial for palynological surface samples for quantitative assessment of pollen and spore data. Together, it is also helpful in identifying significant associations or correlations between pollen/spore assemblages and environmental variables, such as vegetation type, climate conditions or land use—land cover (Birks, 1973; Birks et al., 1975).
Unconstrained ordination analysis was performed in our study to place the samples based on their pollen composition. Detrended correspondence analysis (DCA) was done to decide whether to use linear or non-linear ordination analysis to be employed. Because the axis length that DCA calculates inform on the environmental gradient. If the environmental gradient is shorter, linear ordination analysis is to be employed, otherwise non-linear one is to be applied. Hierarchical cluster analysis (HCA) was used to see how close (or distant) these samples are to each other based on the pollen composition. The dissimilarities between the samples were calculated using Bray–Curtis method and categorised them into clusters. The ‘average’ linkage method was used and cophenetic correlation coefficient (correlation between the dissimilarity values from dendrogram and that of the data) was used to check the correctness of the analysis. Finally, the results of unconstrained ordination analysis and HCA were combined together for better understanding (Figure 4a–c).
Principal component analysis; (a), hierarchical cluster analysis (b) and the combination of both (c) are shown.
Results
To better understand the pollen-vegetation relationship at the study site, 19 surface samples were collected along a linear transect of the Sanctuary to determine the frequency of the presence of distinct species of the predominant vegetation in the pollen rain. For sampling purposes from SWCWS was separated into the following three zones: Zone I at the habitation, Zone II in buffer zone and Zone III is core zone towards the centre of the Forest all along the transversal (Figure 1 and Table 1). Frequency distribution of pollen taxa reveals an overall abundance of AP over NAP in both MS and SS samples.
Habitation Zone
Pollen assemblages from Zone I (Sample no. MS1-MS2, SS1-SS2) reflect an overall dominance of arboreals over the non-arboreal elements with a prevalence of conifers. The arboreals, included P. wallichiana, P. smithiana, A. pindrow, Betula utilis, Alnus, Corylus sp. and Ulmus sp., are documented at high values. P. wallichiana (47–52%) constitutes the most common conifer and is found at significant concentrations through all samples. Cedrus and Abies is similarly well-represented (6.6–10.2%), although P. smithiana fluctuates between 1% and 2.4%. Quercus incana is the best-represented temperate broad-leaved taxon, with occurrences between 2.1% and 3.8%. Rhododendron is found, with occurrences between 1.4% and 2.9%; but B. utilis and Corylus spp. have low and sporadic occurrences. Temperate deciduous trees like Acer, Salix, Betula and Juglans (0.3–0.6%) are recovered in low frequencies. Shrubs like Cotoneaster, Ericaceae, Celtis, Berberis, Indigofera, Symplocos, Rosa, Rubus, Hippophae and Viburnum (0.1–0.3%) are found in very low to negligible amounts.
NAP assemblages are dominated by Poaceae (4.0%). Asteraceae, Artemesia, Cerealia type Poaceae and Xanthium (0.8–2.9%) are found in moderate frequencies. Marshy herbs and ferns (0.6–1.1%) are present in low to moderate frequencies. Glomus in this zone was found to be abundant among fungal spores followed by Alternaria, Tetraploa and Sporormiella while Podospora and Saccobolus were found to be in very little amount.
Buffer Zone
In this zone (Sample numbers: MS3–MS6, SS3–SS5), again Pinus (47–54%) is found in the highest frequency while Cedrus, Abies and Picea (2.1–12.6%) are found in moderate to high frequency. Quercus and Rhododendron (1.2–2.4%) are found to be dominant. Other tree taxa like Acer, Salix, Betula and Juglans (0.3–0.8%) are found to be sparse. Shrubs like Cotoneaster, Ericaceae and Celtis (0.2–0.3%) were also found in very low to negligible amounts followed by Berberis, Indigofera, Symplocos, Rosa, Rubus, Hippophae, Viburnum and Anemone (0.5–0.7%). Artemesia (3.1%) was found in higher abundance followed by Poaceae (2.9%). While Caryophyllaceae, Chenopodiaceae, Lamiaceae, Ranunculaceae, Rumex, Solanaceae, Euphorbiaceae and Xanthium (0.3–1.5%) are found in low to a negligible amount. Glomus show relatively lesser abundance compared to the habitation zone.
Core Zone
The pollen spectra from Core Zone II (Sample number: MS7–MS10, SS7–SS9) show that arboreals outnumber non-arboreals overall. Conifers predominate, as evidenced by high Cedrus (47–67%) values. Poaceae (2.3%) are found in the highest frequency. Other conifers like Cedrus, Abies, Pinus and Picea (2.4–16.4%) were found in moderate frequency. Marshy herbs like Caryophyllaceae, Chenopodiaceae, Lamiaceae, Ranunculaceae, Rumex, Solanaceae, Euphorbiaceae and Xanthium (0.2–0.5%) are found in very low to negligible amounts. Tree taxa are dominated by Quercus and Rhododendron (1.3–5%) while others like Acer, Salix, Betula, Rosaceae and Juglans (0.3–0.6%) are found in low percentages. Shrubs are also found in a very little amount ranging from 0.1% to 0.7%, which includes Cotoneaster, Ericaceae, Celtis, Daphne, Prinsepia, Berberis, Indigofera, Spiracea, Sarcococca, Symplocos, Rosa, Rubus, Hippophae, Viburnum and Anemone. Marshy herbs (1%), ferns (1.3–1.6%) and fungal remains like Sporormiella, Saccobolus, Sordaria, Podospora, Tetraploa, Alternaria, Podospora and Glomus all are found in very low frequency.
Statistical Analysis
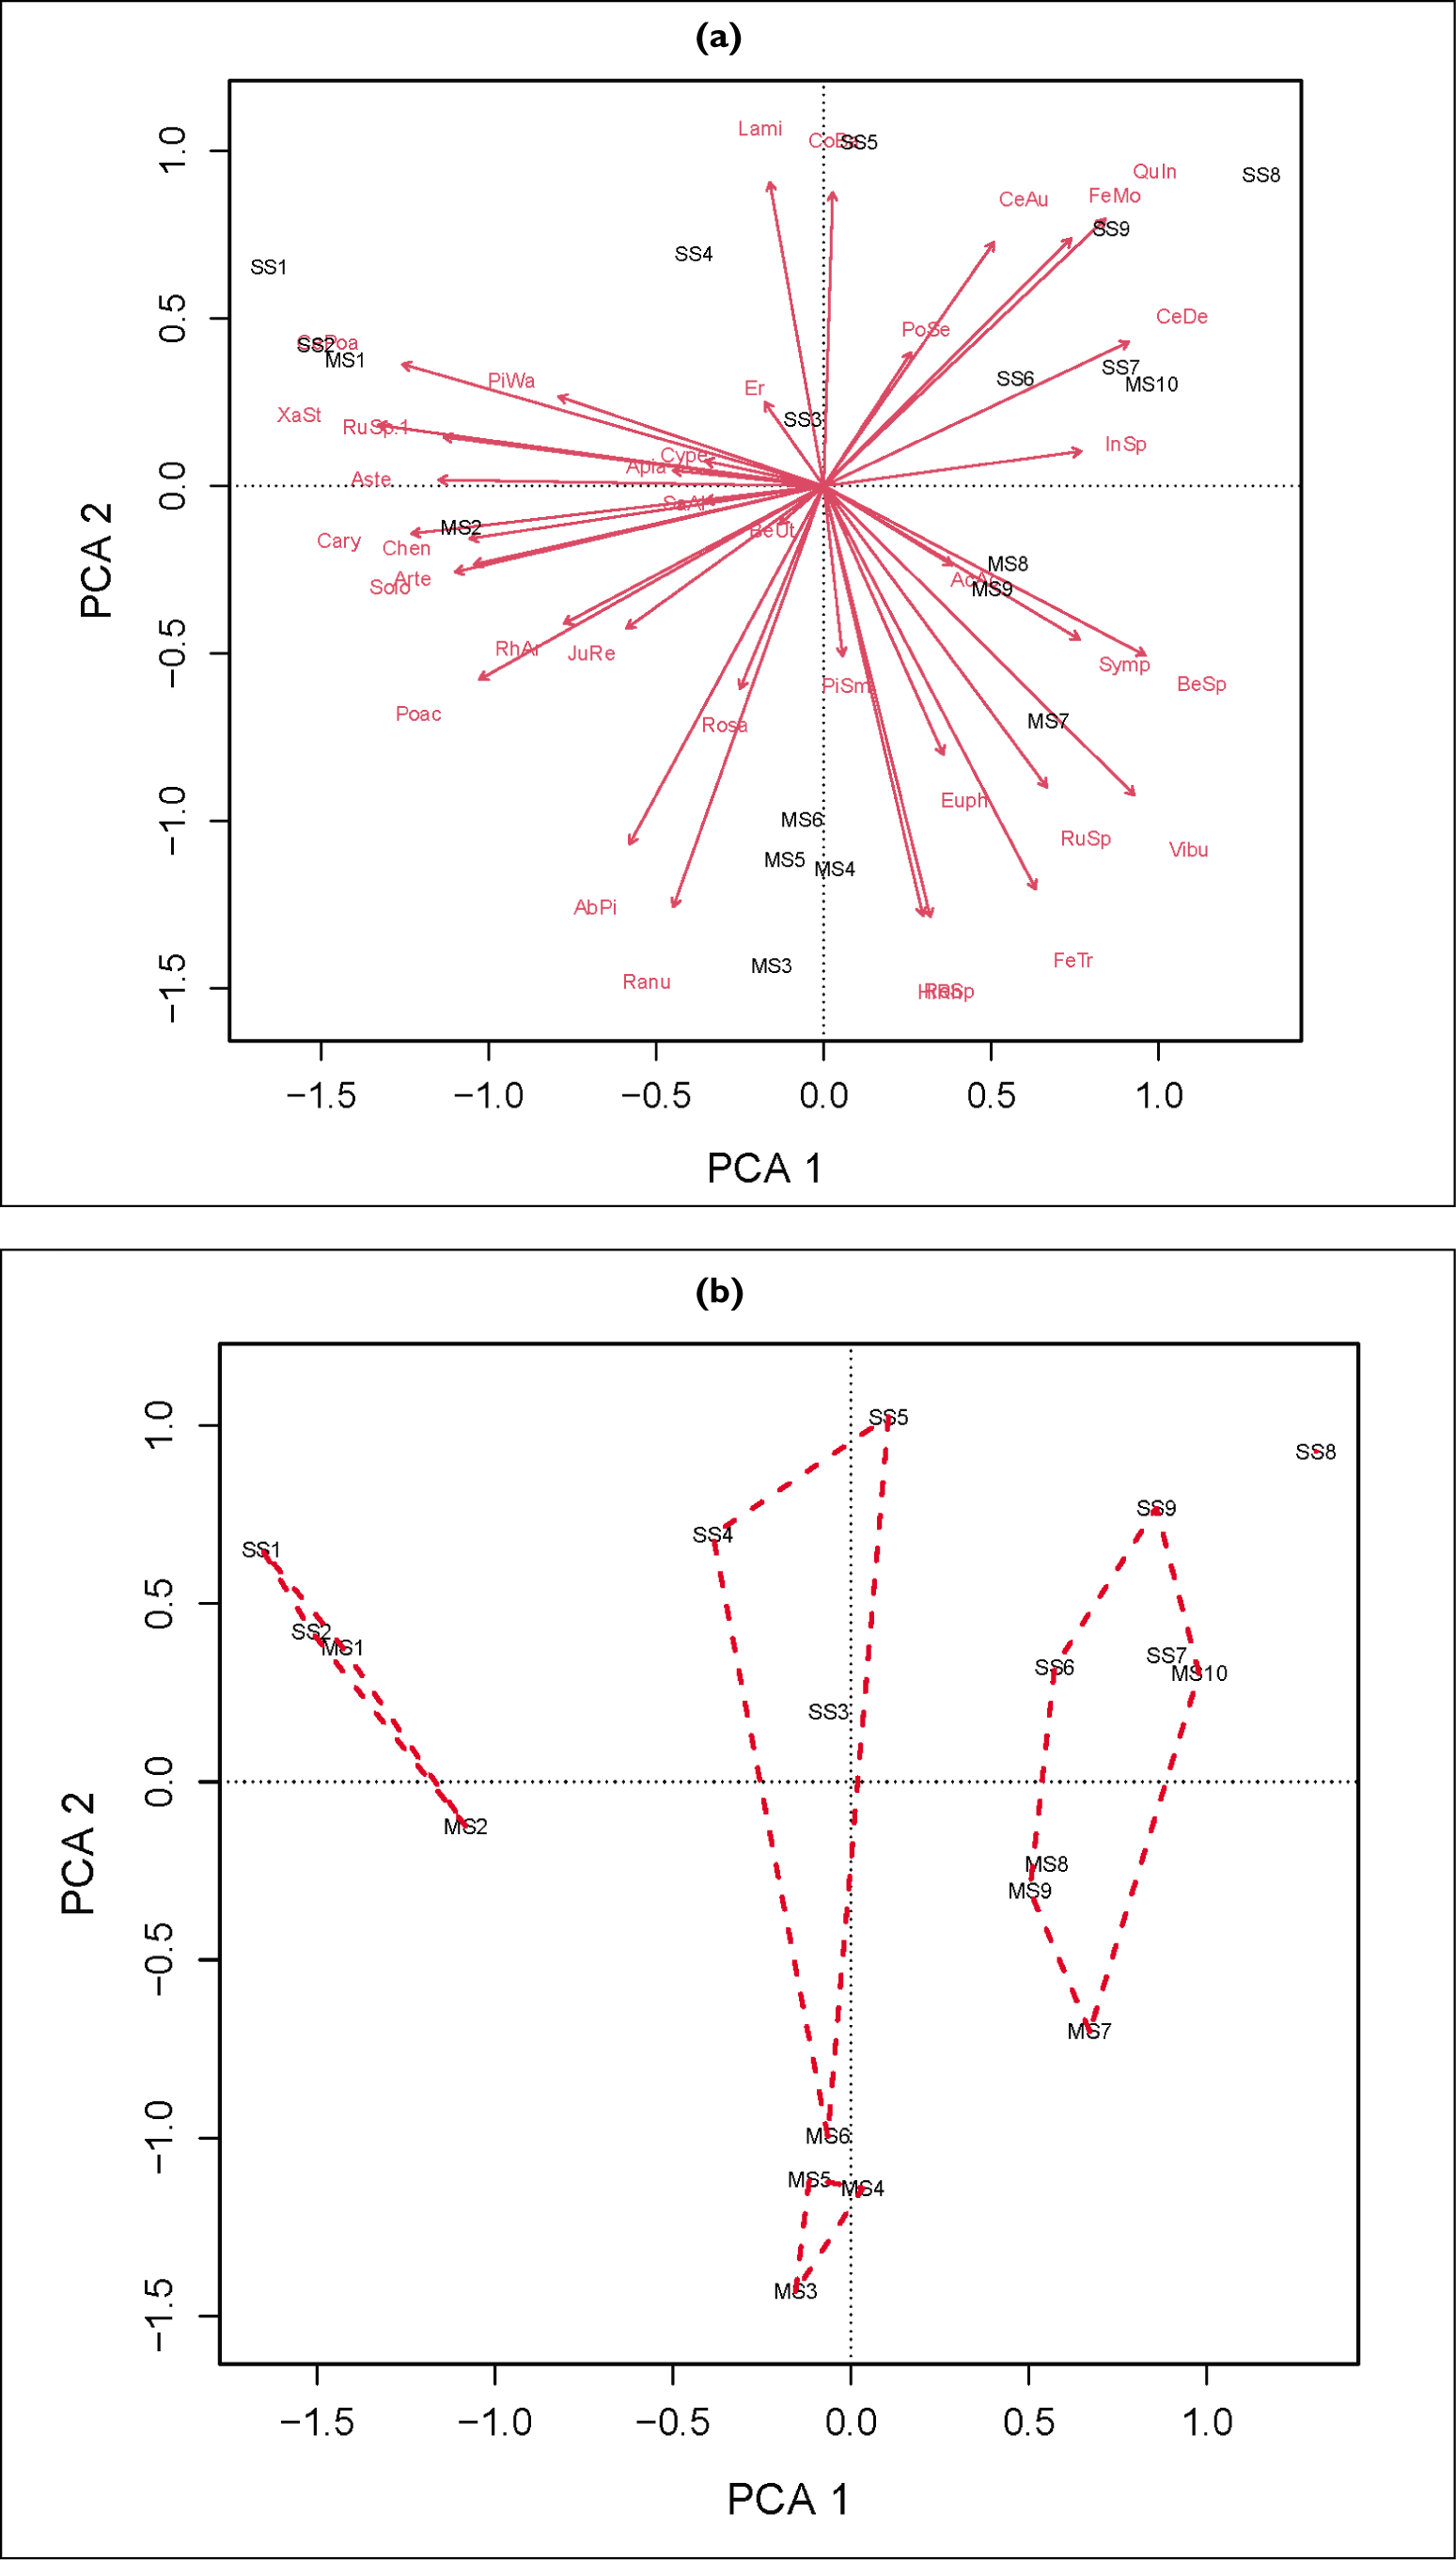
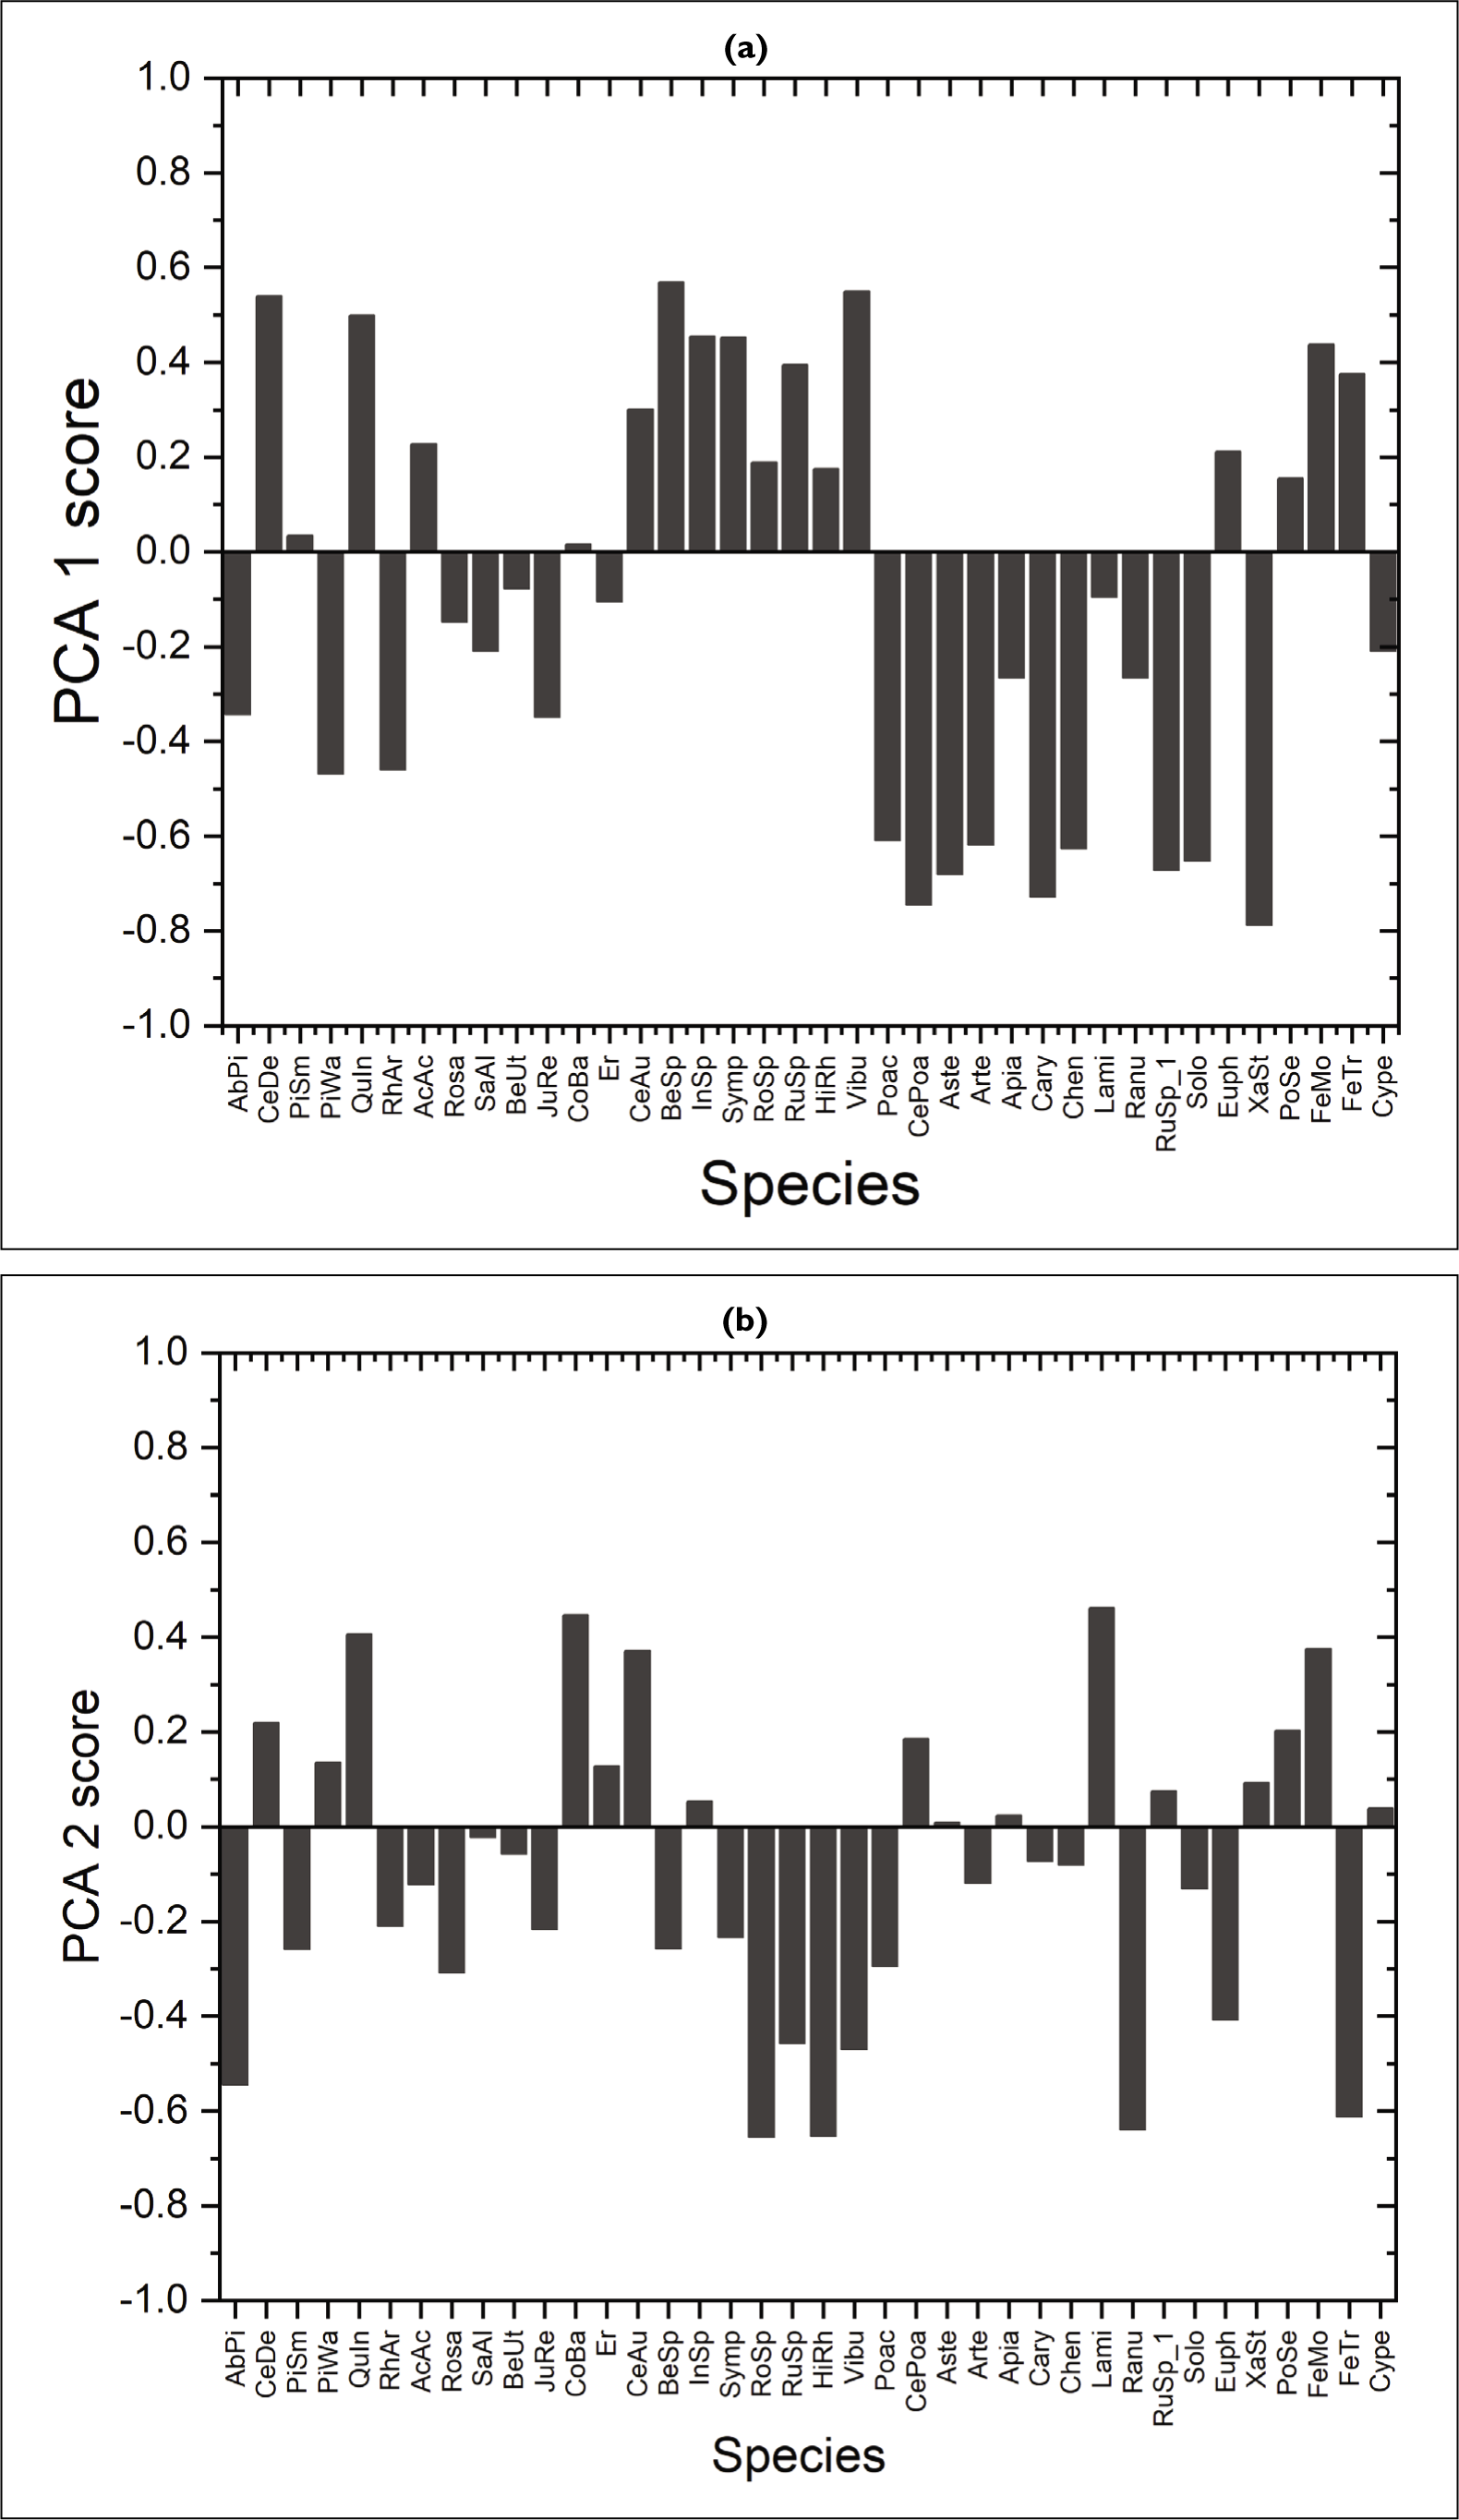
The first DCA axis length is 0.594 × s.d. (standard deviation) and it suggest the environment gradient is shorter. Hence a linear ordination analysis such as principal component analysis (PCA) was employed. The first four PCA axes cumulatively account for the observed 66.6% of variability among the samples (Figure 4a). The screeplot also suggests four PCA components are significant. The first axis of PCA is governed by Viburnum and Betula, C. deodara and, Berberis spirarea (positive side) and Xanthium, Cedrus, Poaceae, Caryophyllaceae and Asteraceae (negative side) as shown in Figure 5a. The taxa Quercus, Lamiaceae, Fabaceae and Cotoneaster, Berberis (positive side) and Rosaceae Simplocos, Ranunculceae Hippophae and fern trilete (negative side) governed the second axis of PCA (Figure 5b).
Principal Component Analysis (a) axis 1 (PCA 1 score) and (b) axis 2 (PCA 2 score) of 19 surface samples of study area.
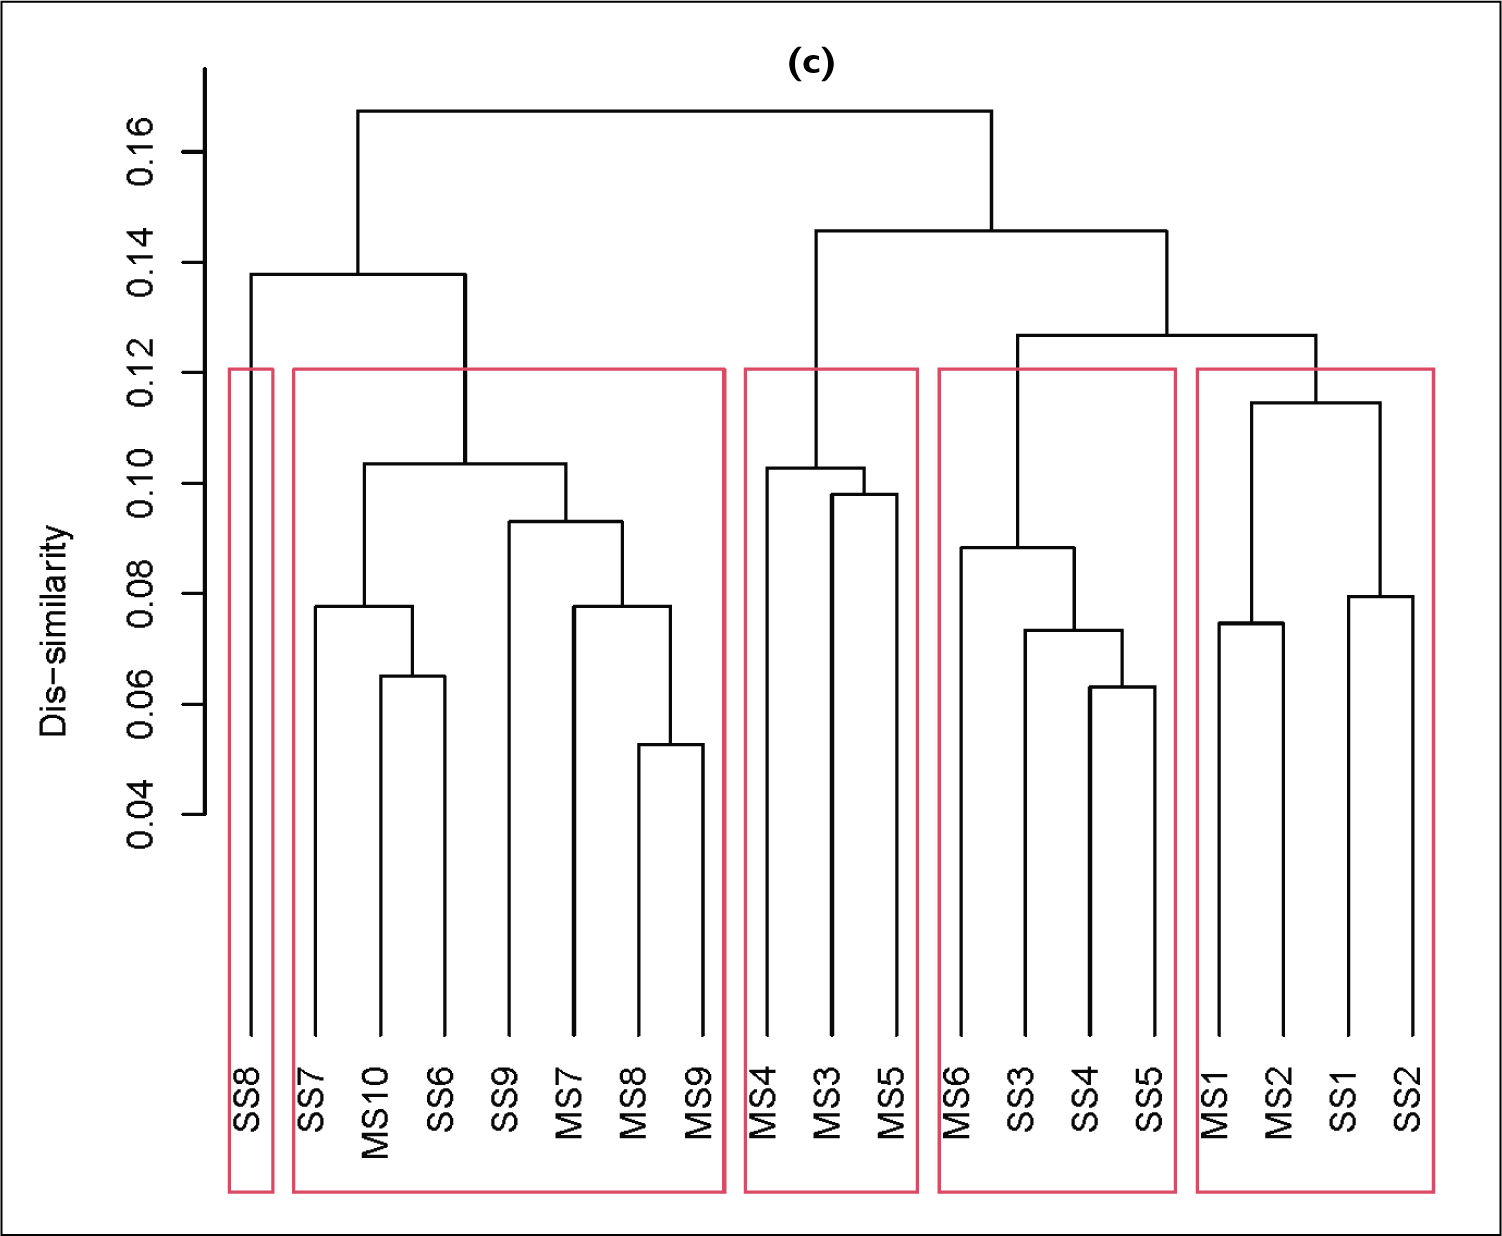
The HCA categorised the samples into four clusters and one sample (SS8) as unique at a dissimilarity value of 0.1145 (68.4 % of information explained). The observed cophenetic correlation coefficient is 67.8%.
The Cluster 1 has SS6, SS7, and MS7-10; Cluster 2 has SS1, SS2, MS1, and MS2; Cluster 3 has SS3-5, and MS-6 and MS3-5 are in the last cluster as shown in Figure 4b, c.
Discussion and Conclusions
The pollen assemblage derived through the investigation of the samples has demonstrated that most of the area in the temperate belt of the study site in Kufri, Himachal Pradesh supports vast stretches of open conifer forests on the dry mountain slopes of which C. deodara was the most prominent element as evident from its relatively much high frequencies compared to other conifers. This is as a result of the sampling location having a pure Cedrus canopy (Khanduri et al., 2002; Şenkul & Kılıç, 2019). The appreciable encounter of P. smithiana (West Himalayan Spruce) and A. pindrow (Fir) pollen suggest their good occurrence in almost pure formations in the higher reaches. This is likely owing to their larger and heavier pollen, which inhibits their distribution by wind over long distances and deposited nearby (Vishnu-Mittre & Robert, 1971). However, P. wallichiana (Blue pine) grows in confined small pockets, as seen today, and is distinguished by its lower frequency than other conifers. Pinus pollen has good buoyancy and is consequently susceptible to efficient air dispersion and long-distance transport by upthermic winds (Vishnu-Mittre & Robert, 1971; Vishnu-Mittre & Sharma, 1966). Therefore, it must have been established that it could not be preserved across dense forest study sites.
On the other hand, the oak-broad-leaved forests are mainly constituted of Quercus, therefore its pollen are retrieved in the majority compared to other broad-leaved elements. Rhododendron, Betula, Juglans and Salix alba occur in appreciable number together with Quercus in shady and moist valleys/depressions around the study site, therefore their pollen met with in low to moderate values in the pollen rain only in the samples gathered from such provenances The partial preservation of their pollen in the sediment also cannot ruled out. However, they are either feebly recorded or untraceable in the samples analysed from the adjoining conifer dominated areas, possibly because of poor dispersal efficiency of their pollen. Thus, the overall dominance of conifers and relatively reduced frequencies of most of the broad-leaved elements in the pollen assemblage demonstrates that the region is under a regime of cold climatic conditions, which has also been noticed in the pollen sequence of past from subtropical and temperate lakes of Jammu region too (Trivedi & Chauhan, 2008, 2009). The ground flora on the forest floor is very less-diversified in case of pollen spectra from conifer forests, which altogether devoid undergrowth, except for grasses and few others viz., Artemisia, and other members of Tubuliflorae and Liguliflorae. On the other hand, in the pollen spectra from broad-leaved oak forests, the diverse herbaceous elements comprising grasses, members of Rosaceae, Ranunculaceae, Polygonaceae, Caryophyllaceae, Rumex, etc., are more frequent, reflecting their factual presence in such forests. The sporadic presence of ruderal taxa such as Artemisia, members of Chenopodiaceae and Brassicaceae depicts some kind of human activities because they commonly occur around the habitation in the region. Also, the recovery of pollen of Asteraceae (Tubuliflorae and Liguliflorae) is indicative for some pastoral activities in the form of grazing and browsing by cattle and goats respectively (Trivedi et al., 2014). The open nature of vegetation is also validated by the encounter of fungi viz., Glomus, Alternaria and Tetraploa, which are the common pathogens of grasses and other herbaceous taxa. Their presence also indicates both rich plant diversity and available water in the region around the provenance of the sampling (Ellis, 1971; Tanaka et al., 2009). The fungal spores belonging to Sporormiella were also recorded in sufficient amounts, which are indicative of presence of herbivore species (van Asperen, 2017) around the provenance of sampling.
The availability of humidity and marshy conditions are the important factors for the germination and sporulation and dissemination of Sporormiella (Basumatary et al., 2020; Ingold & Marshall, 1962; Kuthubutheen & Webster, 1986a, 1986b). The frequent encounter of saprophytic fungi such as Podospora, Sordaria, Sporormiella, etc., implies the availability of ample coprolites and cow dungs in the forest region, which offer conducive condition for their propagation. This happened due to frequent use of the area by wild herbivores like deer. Further, the appreciable retrieval of Glomus, mycorrhizal fungi is attributed to its close association with the higher plants, particularly conifers viz., Pinus roxburghii, C. deodara, etc. occurring gregariously as pure crops in the study area. The record of sedges (Cyperaceae) and Polygonum sp. suggests the existence of some marshes interspersed in the forests or near the investigation site. The ferns and their allies inhabit abundantly along the margin of marshes, brooks and in the shady habitats, particularly in rock crevices. Thus, the much higher frequencies of fern spores in the samples depict their emanation from local sources. The three ecosystem that are studied are shown internally diverse in some degree. Classification and ordination (Figure 4a, 4b, 4c, 5a, 5b) of modern pollen samples indicated the existence of five major vegetation compositions. The habitation zone, that is, outer part of the forest is clearly discriminated from human imprints in Cluster 1. The buffer zone falls in Cluster 2 and 3, we conclude that it is certainly possible to obtain distinct pollen markers of human and animal interaction zone. These results will also improve the reconstruction of ancient human and animal relationship as far as modern pollen rain studies are carried out in specific regions. The core zone, as represented by Clusters 4 and 5, reflects the actual reserve forest picture of the temperate region. This method can be applied to other plant formations regardless of the territory involved. As a result, we strongly advise against focusing solely on the dominant arboreal pollen taxa or keystone species (‘trees’), as this may lead to a loss of perspective on the true typology of the various types of plant communities (‘forests’).
Pollen qualitative approach of surface sediments and mosses, particularly from undisturbed forest regions, has evolved into the most widely used and relevant technique for determining past vegetation dynamics over time. Pollen analysis results have also been used to estimate past climate crisis and human impact on vegetation. Numerical models of pollen dispersal are becoming more sophisticated, and are being used to help determine the relative proportions of woodland and open vegetation in past landscapes using only fossil pollen data. By identifying the major guidance of variation in datasets, numerical analyses aid in the interpretation of fossil pollen. Taxonomy and taphonomy have concerns, but pollen analysis remains a leading technique in past environmental reconstruction.
Footnotes
Acknowledgements
The authors are grateful to Dr Vandana Prasad, Director BSIP for permission and consistent support. Dr K.P.N. Kumaran, Dr Su-Ping-Li from China and another anonymous reviewer are thanked for their reviews that helped improving the manuscript.
Declaration of Conflicting Interests
The authors declared no potential conflicts of interest with respect to the research, authorship and/or publication of this article.
Funding
The authors received no financial support for the research, authorship and/or publication of this article.