
Abstract
Introduction
Liver cancer, an asymptomatic disease. It is the fourth most common cancer and the second most common cause of cancer-related deaths globally.1,2 Hepatocellular carcinoma (HCC) is one of the most common primary liver cancers. 3 It is the third leading cause of death worldwide and is usually the result of chronic liver disease, fibrosis, and cirrhosis. 4 HCC is also associated with inflammation and oxidative stress. 5 Unfortunately, there are few effective treatments for HCC, and surgical intervention usually has a poor prognosis. Chemoprevention is often the best approach to combat HCC, 6 and nanoparticle-mediated targeted therapy is a promising new option. 7 Nanoparticles have unique properties that make them potentially more effective than traditional chemotherapeutics, 8 due to their small size and high surface area to volume ratio. 9 Silver nanoparticles (AgNPs), in particular, have exceptional antimicrobial and antibacterial properties, making them an ideal material for medical products.10,11 They also offer a novel approach to treating hepatic carcinoma. 12 AgNPs are less toxic to normal cells and have a wide range of applications. 13 Gamma irradiation (γ-irradiation) is a powerful technique for synthesizing nanoparticles, and it is particularly effective for producing silver nanoparticles of controlled size and shape.14,15 Gemcitabine (GEM; 2′-deoxy-2′, 2′- difluorocytidine) is a nucleoside analog that is commonly used to treat various cancers; ovarian, bladder, non-small cell lung, pancreatic, and breast carcinoma 15 and promising therapy for HCC. 16 In this study, HCC was induced by the carcinogen diethyl-nitrosamine (DEN), which can cause severe liver damage leading to the accumulation of reactive oxygen species (ROS), oxidative DNA damage, and ultimately lead to cancer. 17 The combination of AgNPs and GEM has not been studied before in the treatment of HCC. Combining nanoparticles with traditional chemotherapy can improve treatment outcomes. 18 This study aims to investigate the potential of this combination therapy to manage the drawbacks associated with traditional chemotherapeutic drugs like Gemcitabine, using nanoparticles that are synthesized by a unique and eco-friendly method.
Materials and methods
Materials
Chemicals
Gemcitabine [C9H11F2N3O4], obtained from Eli Lilly Company. Indianapolis, Indiana 46285 USA. Silver nitrate (MW 169.87), PVP (MW ≈ 40,000), isopropyl alcohol, and diethyl-nitrosamine (DEN) were acquired from Sigma-Aldrich Corporation (USA). Normal human fibroblast cells (Wi-38) and human liver cancer cells (HepG2) were obtained from the National Research Center, (the tissue culture unit of the Holding Company for Biological Products and Vaccines (VACSERA), Giza, Egypt.
Gamma irradiation source
Irradiation was performed at NCRRT, EAEA, Cairo; within a γ-irradiation system using Canadian Gamma cell-40 (60Co source) as a reducing source, with a dose rate of 1.06 kGy/h at irradiation dose 25 kGy.
Animals
Fifty-six male albino rats according to (Song et al. and Kerdput et al.,)19,20 weighing between 110 and 130 g, were acquired from the National Center for Radiation Research and Technology (NCCRT). They were kept in a clean-air room with controlled environmental conditions and a standard 12-h light/dark cycle. The rats were fed standard food pellets with all necessary nutrients and had access to water ad libitum as described by (MS et al. and Charan and Kantharia).21,22 All animal procedures were conducted following NCCRT guidelines and the appropriate treatment and use of laboratory animals.
Synthesis and characterization of the AgNPs
AgNPs were manufactured using 60Co- γ-irradiation as a clean tool for synthesis. Silver nitrate (AgNO3) was used as an Ag+ ions precursor, PVP as a stabilizer, and 2-propanol as a scavenging oxidizing agent. Typically, (5 mL) of 0.1 M AgNO3 was added to 50 mL of 1% PVP solution and 0.5 mL isopropanol then the mixture was stirred well. After being purged by N2 for 20 min, the mixture was sealed and exposed to a 25 kGy dose using γ-rays at room temperature. Following irradiation, AgoNPs were separated by centrifugation, to remove the free PVP and excess silver ions. The precipitated AgoNPs were thoroughly washed with ethanol, dried at room temperature then stored for further investigations. X-ray diffraction (XRD) patterns of the obtained AgoNPs were studied using XRD 6000 diffractometer with a Cu target. The XRD runs were carried out over 2θ ranging from 10° to 80° at a scan speed of 8°/min. The UV-visible wavelength scan for the absorption spectra was obtained using a UV/Vis spectrometer model UV-Analytic Jena AG specord 210 plus (Germany) at a wavelength of (190−900) nm. EDX analysis was performed using energy dispersive X-ray unit microprobe EDX (Oxford, England - ISIS). The size of AgoNPs was estimated using transmission electron microscopy (TEM) (JEOL, JEM 100CX, Japan). The obtained AgoNPs were dispersed in methanol followed by sonication then a drop of the obtained solution was dropped on an ultrathin carbon-supported Cu grid and air-dried at room temperature.
Methods
MTT cytotoxicity assay
Cell cytotoxicity was measured using the MTT assay on two cell lines, Wi-38 and HepG2, following the method described by van de Loosdrecht et al.
23
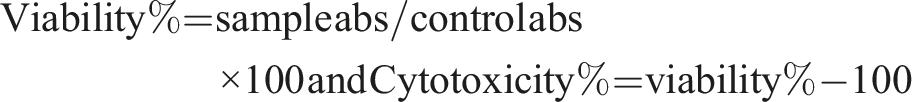
and MTT reagent [3-(4,5-dimethyl-thiazol-2-yl)-2,5-diphenyl-tetrazolium bromide] was used. Initially, 1 × 10⁵ cells were seeded and incubated at 37°C, 10% CO2 for 24 h to develop a complete monolayer sheet. Next,100 μL of various concentrations of drugs, including Gemcitabine (GEM) Doxorubicin (Doxo), and Cyclophosphamide (Cyclo) (ranging from1000 - 7.81 μg/mL) were added to RPMI 1640 complete media in a 96-well -plate. The plate was incubated for 24 h at 37°C, 10% CO2. For control purposes, HepG2 and Wi38 cells in RPMI media were considered as control (100% viable). Then, 10 μL of freshly prepared MTT solution (0.5 mg/mL) was added to each well. The plate was incubated in the dark for 4 h to develop color. Finally, 200 μL of DMSO/well was added to dissolve MTT formazan, and the absorbance was measured at 570 nm. The percentage of cell cytotoxicity was calculated using the following equation:
Experimental design
In this study, rats were randomly assigned to eight groups (n = 7), with each group receiving different treatments. The purpose was to determine statistically significant differences (p < .05) between the treatments using the G-power. 22 The groups were as follows: (1) Control group (C); normal male rats were injected intraperitoneally (i.p.) with 0.9% saline solution. (2) AgNPs group (Ag); animals were i. p. injected with AgNPs (10 μg/g)/b. wt 3 times a week, for 4 weeks with some modifications.24,25 (3) GEM (G); rats of this group were injected (i.p.) with GEM 5 mg/kg twice weekly, for 4 weeks with some modifications. 26 (4) Rats treated with AgNPs and GEM (AgG); rats of this group were injected with both AgNPs and GEM. (5) HCC group (T); rats were orally administered with 20 mg/kg b. wt. of DEN (dissolved in 0.9% normal saline), five times a week for 8 weeks, followed by 10 mg/kg for another two successive weeks according to the modified method.27,28 (6) HCC-AgNPs treated rat group (TAg); rats were injected with AgNPs and then treated as in group 2 (7) HCC- GEM treated rat group (TG); rats developed HCC as in group 5 and were treated with GEM. (8) HCC-AgNPs-G treated rat group (TAgG); rats developed HCC as in group 5, were injected with AgNPs and treated with GEM.
Samples collection and preparation
After the treatments, blood and liver samples were collected for analysis. Blood was drawn from the heart and separated into two parts; whole EDTA blood for flow cytometry analysis and serum for other biochemical investigations. Liver tissues were excised and dissected for assessment of RT-qPCR and western blotting analysis. Another part of the liver was preserved in 10% formalin for histopathological studies.
Flow cytometry analysis
Apoptosis was measured as a FITC Annexin V Apoptosis Detection Kit I (Cat. No: 556547), according to Casciola-Rosen, et al. 29 Whole blood samples from EDTA collection tubes were directly processed according to Yakimov et al. 30
Quantitative real-time PCR
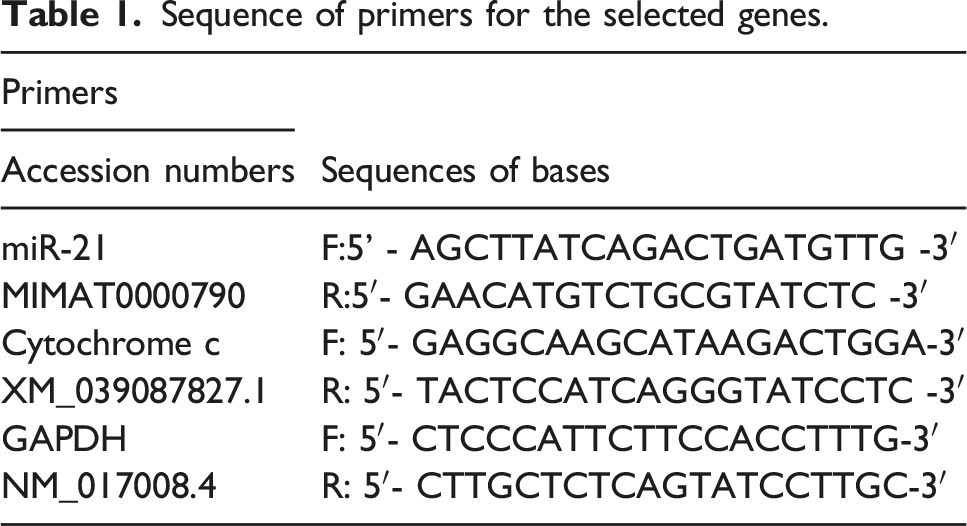
Sequence of primers for the selected genes.
Western blot analysis
The protein expression of BCL2 (Cat. No: ab194583∼ 26kD a), Bax (Cat. No: ab182733∼ 21 kDa), SMAD4 (Cat. No: AF5247 ∼65 kDa), and Caspase-9 (Cat. No: AF6348 ∼46 kDa) was estimated in liver tissue. Data of the obtained protein levels were estimated using β-actin as a housekeeping arbitrary unit (A.U) β-actin (Cat. No: ab8227∼42 kDa).
Histopathological investigations
Specimen from liver tissue of all studied groups was washed, dehydrated in ascending grades of ethyl alcohol, cleared in xylene, and embedded in paraffin wax. Sections of 5–6 mm in thickness were cut out, deparaffinized, and stained with Hematoxylin and Eosin (H & E) for examination under the light microscope. 32
Statistical analysis
Statistical analysis of results was executed via SPSS version 20.0. All data are given as means ± standard error (SE). Differences were considered significant at p < .05, and Data were analyzed statistically using one-way ANOVA followed by Tukey as Post Hoc analysis.
Results
Radiation synthesis of silver nanoparticles Ago NPs
The irradiation preparation method has numerous advantages such as saving energy and materials, as well as being environmentally friendly. When Ag+ aqueous solution is exposed to gamma irradiation, the main initiating chemical step is radiolysis of water molecules. This results in the formation of hydrated electrons (
These radicals can oxidize ions or atoms into a higher oxidation state, and thus compensate for the reduction reactions. In addition to hydrated electrons (


Characterization of the radiation-synthesized AgNPs
UV–vis spectrosecopy analysis
AgoNPs are readily detectable by UV-Vis spectroscopy because of their characteristic absorption maximum ranging between 380 and 430 nm. Figure 1 shows the UV/V absorption spectrum of the obtained colloidal AgoNPs. As clear, a characteristic absorption band of metallic AgoNPs surface plasmon resonance (SPR) absorption band appears at λmax (420 nm) which is compatible with the reported spherical AgNPs absorption band.
35
Interestingly, AgoNPs have a conduction band and a valence band that is very close to each other, allowing electrons to move freely between them. Owing to the collective oscillation of electrons of AgNPs in resonance with the light wave, the characteristic surface plasmon resonance (SPR) absorption occurs.
36
UV absorption spectrum of the obtained AgoNPs.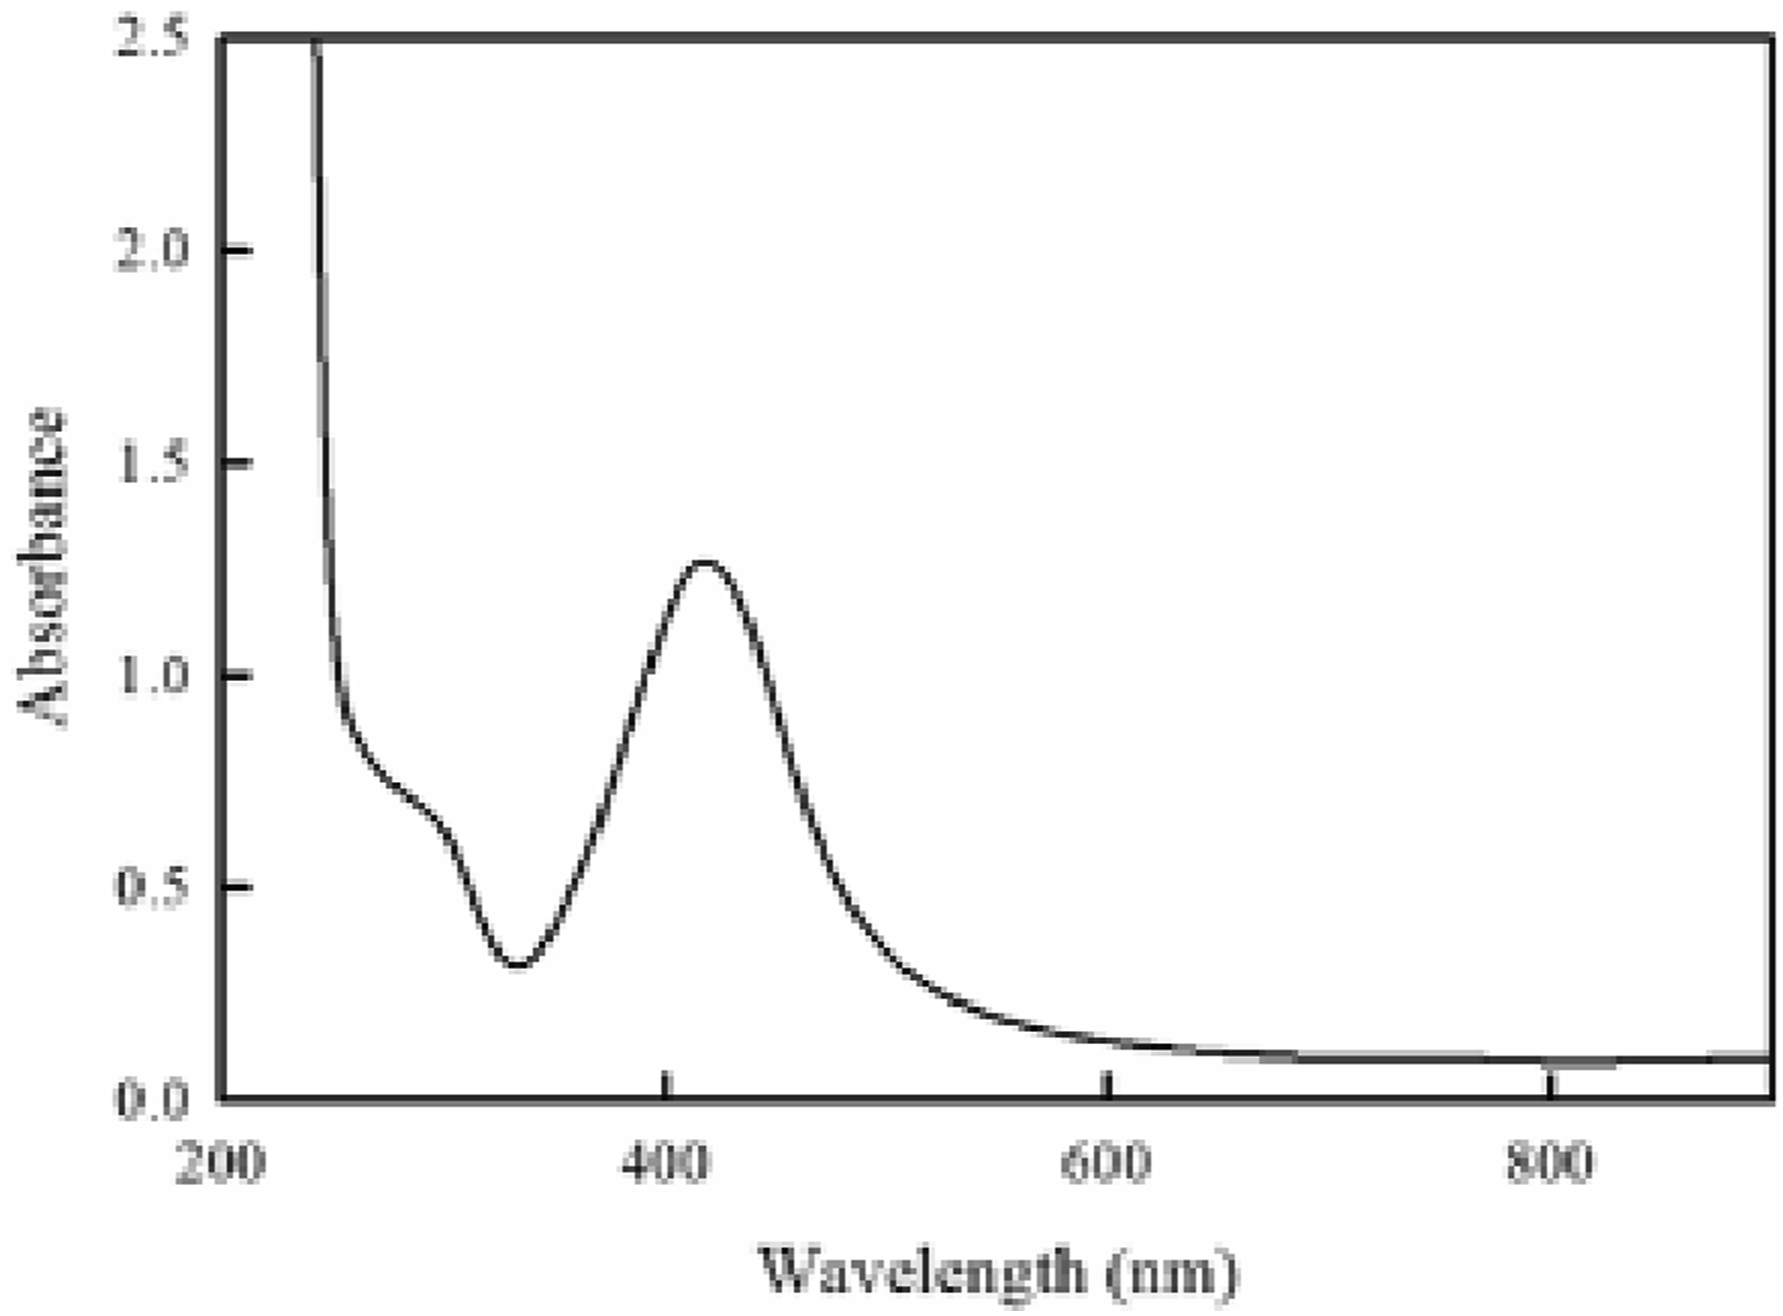
X-ray diffraction (XRD) analysis
As clear from Figure 2(a), the XRD spectrum of the obtained AgoNPs shows well-defined characteristic diffraction peaks at 2θ values at 37.9°, 44.26°, 64.50°, and 77.29 assigned to diffractions planes (111), (200), (220), and (311), respectively confirming the formation of face centered cubic (fcc) structure of AgoNPs. The average crystallite size of the developed AgoNPs was calculated from XRD pattern using Scherrer’s equation
37
: (a) X-ray diffraction patterns of the obtained (b) TEM image of the prepared Ago NPs.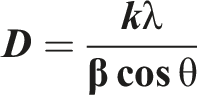
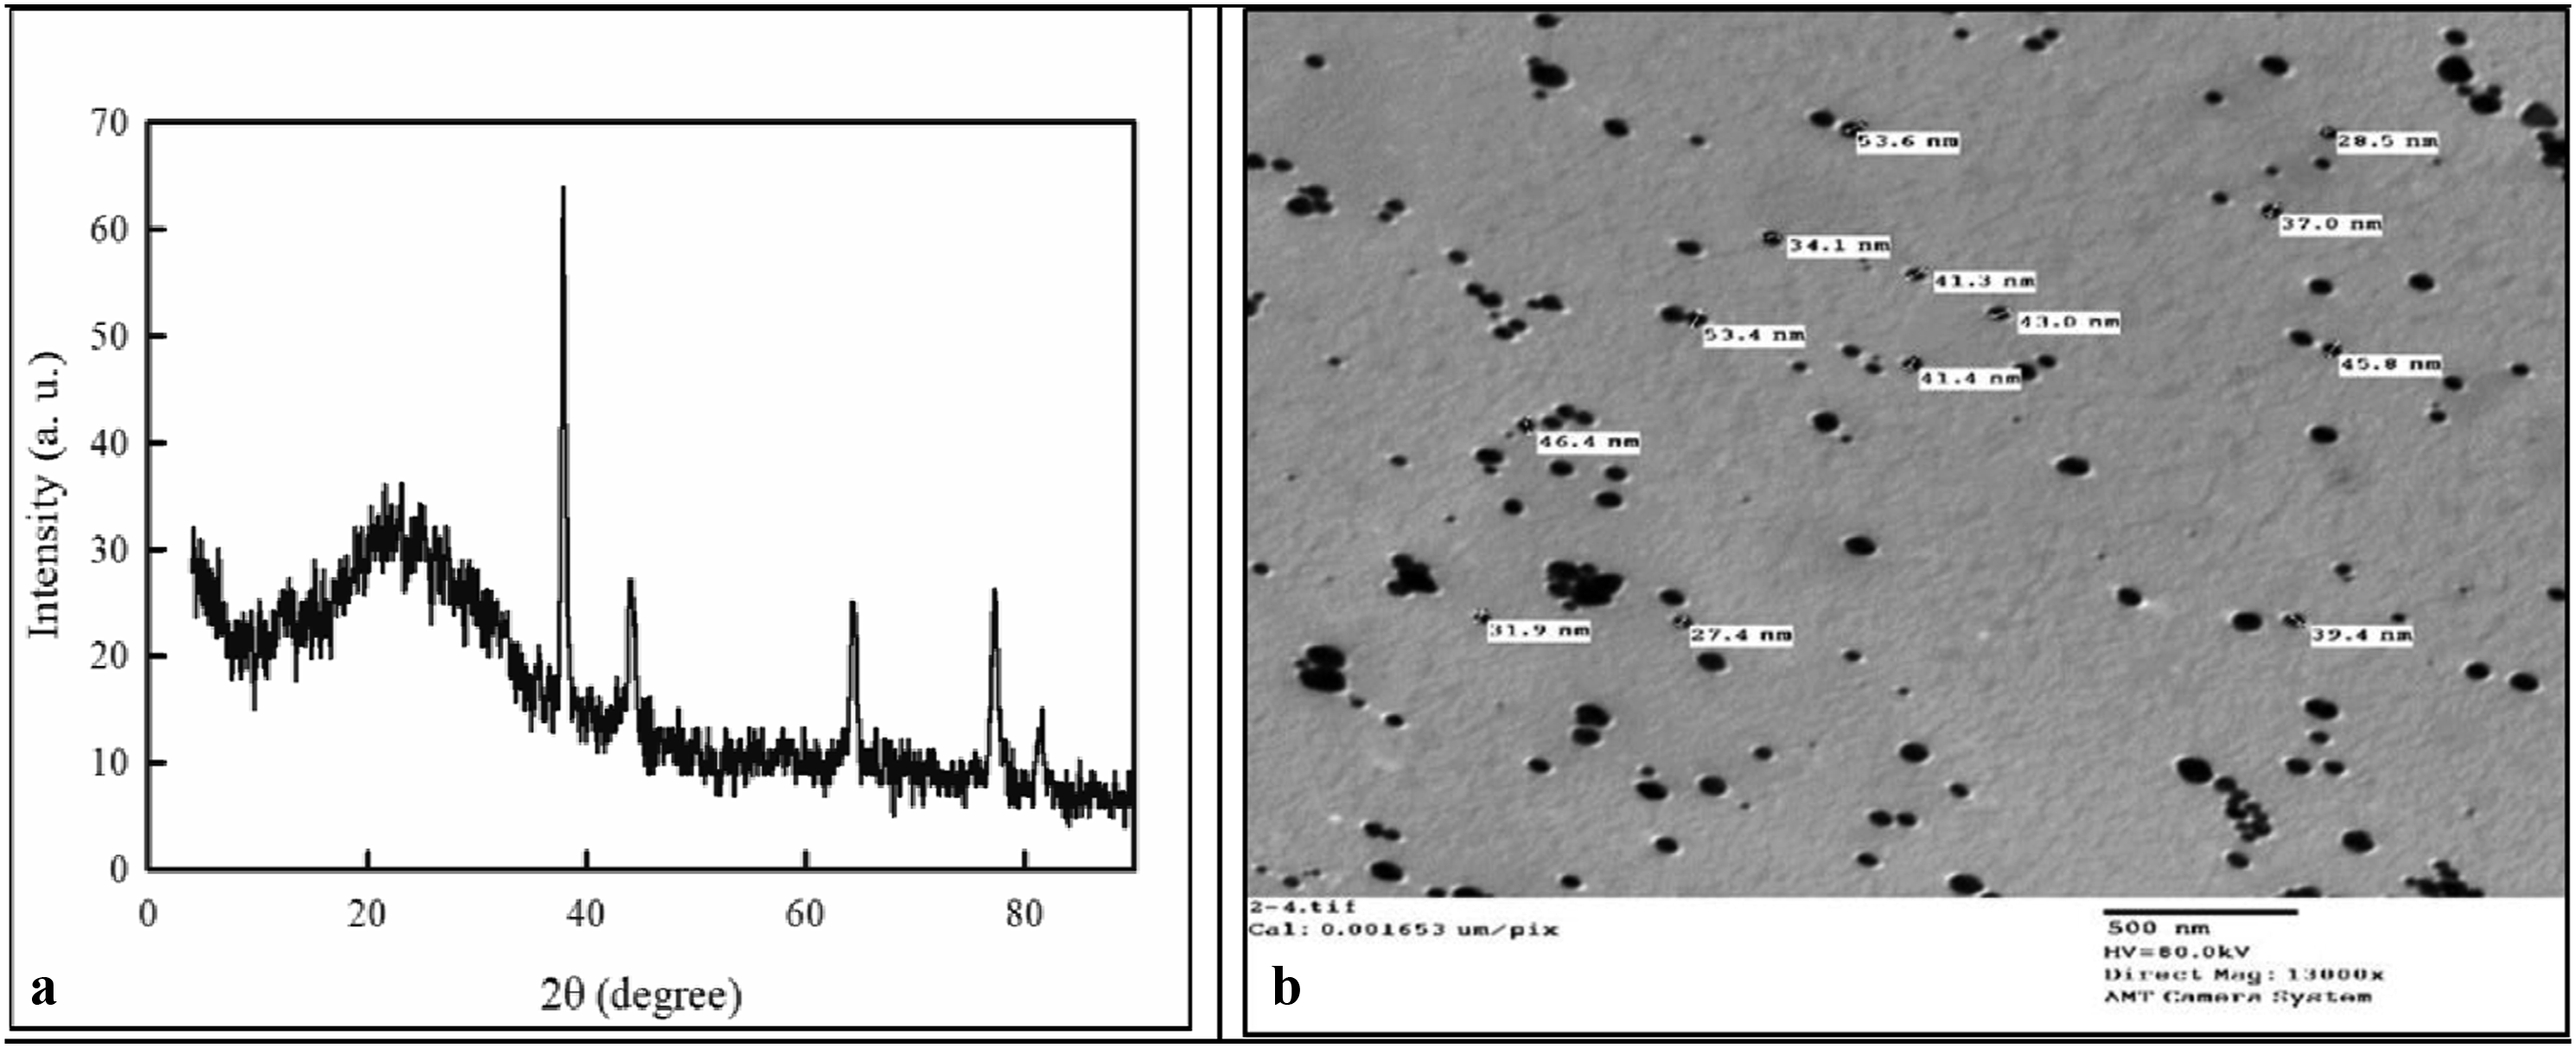
Transmission electron microscopy (TEM)
As clear from Figure 2(b), the TEM image confirmed the nanoscale size of the obtained AgoNPs. The AgoNPs were found to be spherical and a relatively narrow size distribution with an approximate average size ranged between 30 and 50 nm which correlates with the XRD measurements.
In addition, The XRD spectrum and TEM image confirmed the nanoscale size of the obtained Ago nanoparticles, which was in good agreement with the particle sizes calculated according to Scherrer’s equation. Finally, the successful preparation was confirmed by EDX analysis which showed the sharp signal peak of silver powerfully established the reduction of silver nitrate to Ag-NPs. 38
Energy dispersive X-ray spectroscopy (EDX)
As clear from Figure 3, the appearance of a strong signal for Ag atoms in the range of 3 keV, which is a typical signal of the absorption of metallic and spherical silver nanocrystals due to surface plasmon resonance, confirmed the elemental composition of the prepared AgoNPs according to the EDX analysis profile and attested to the success of the AgoNPs preparation.
39
EDX spectrum of the obtained Ago NPs.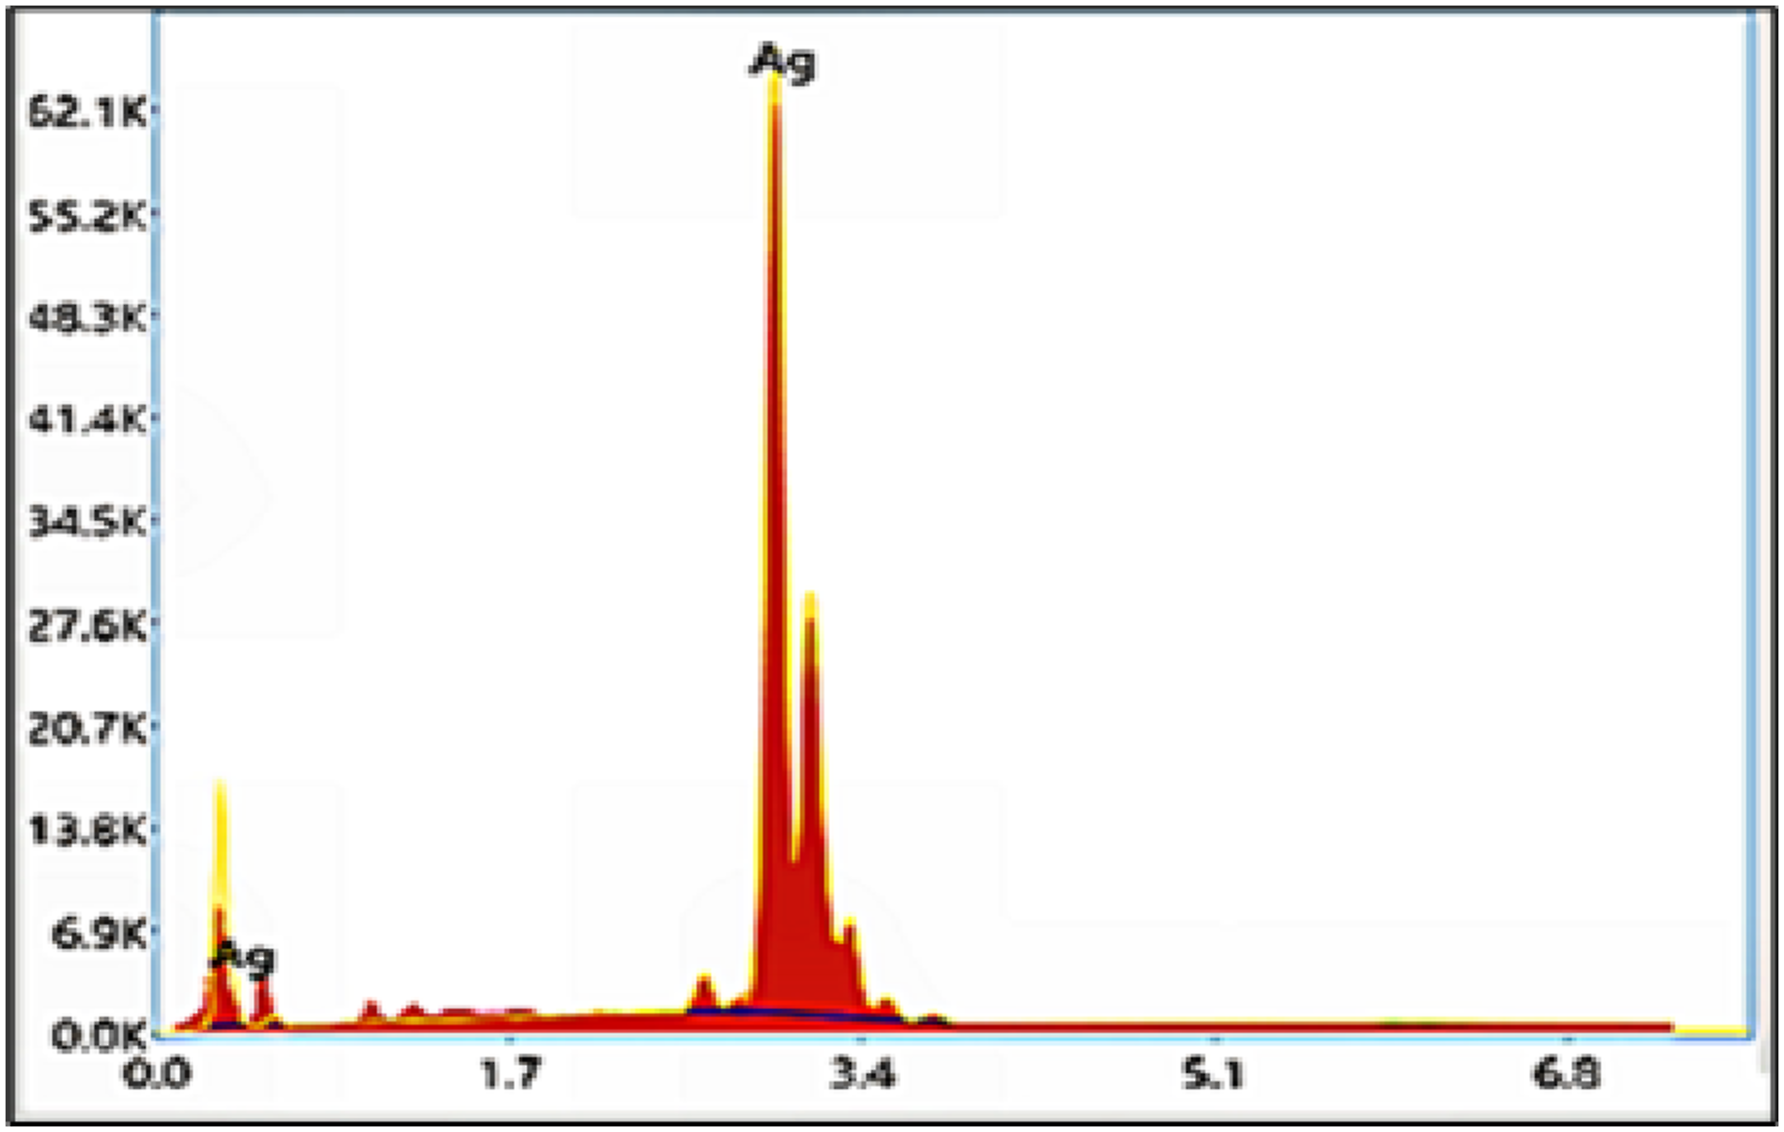
MTT cytotoxicity assay
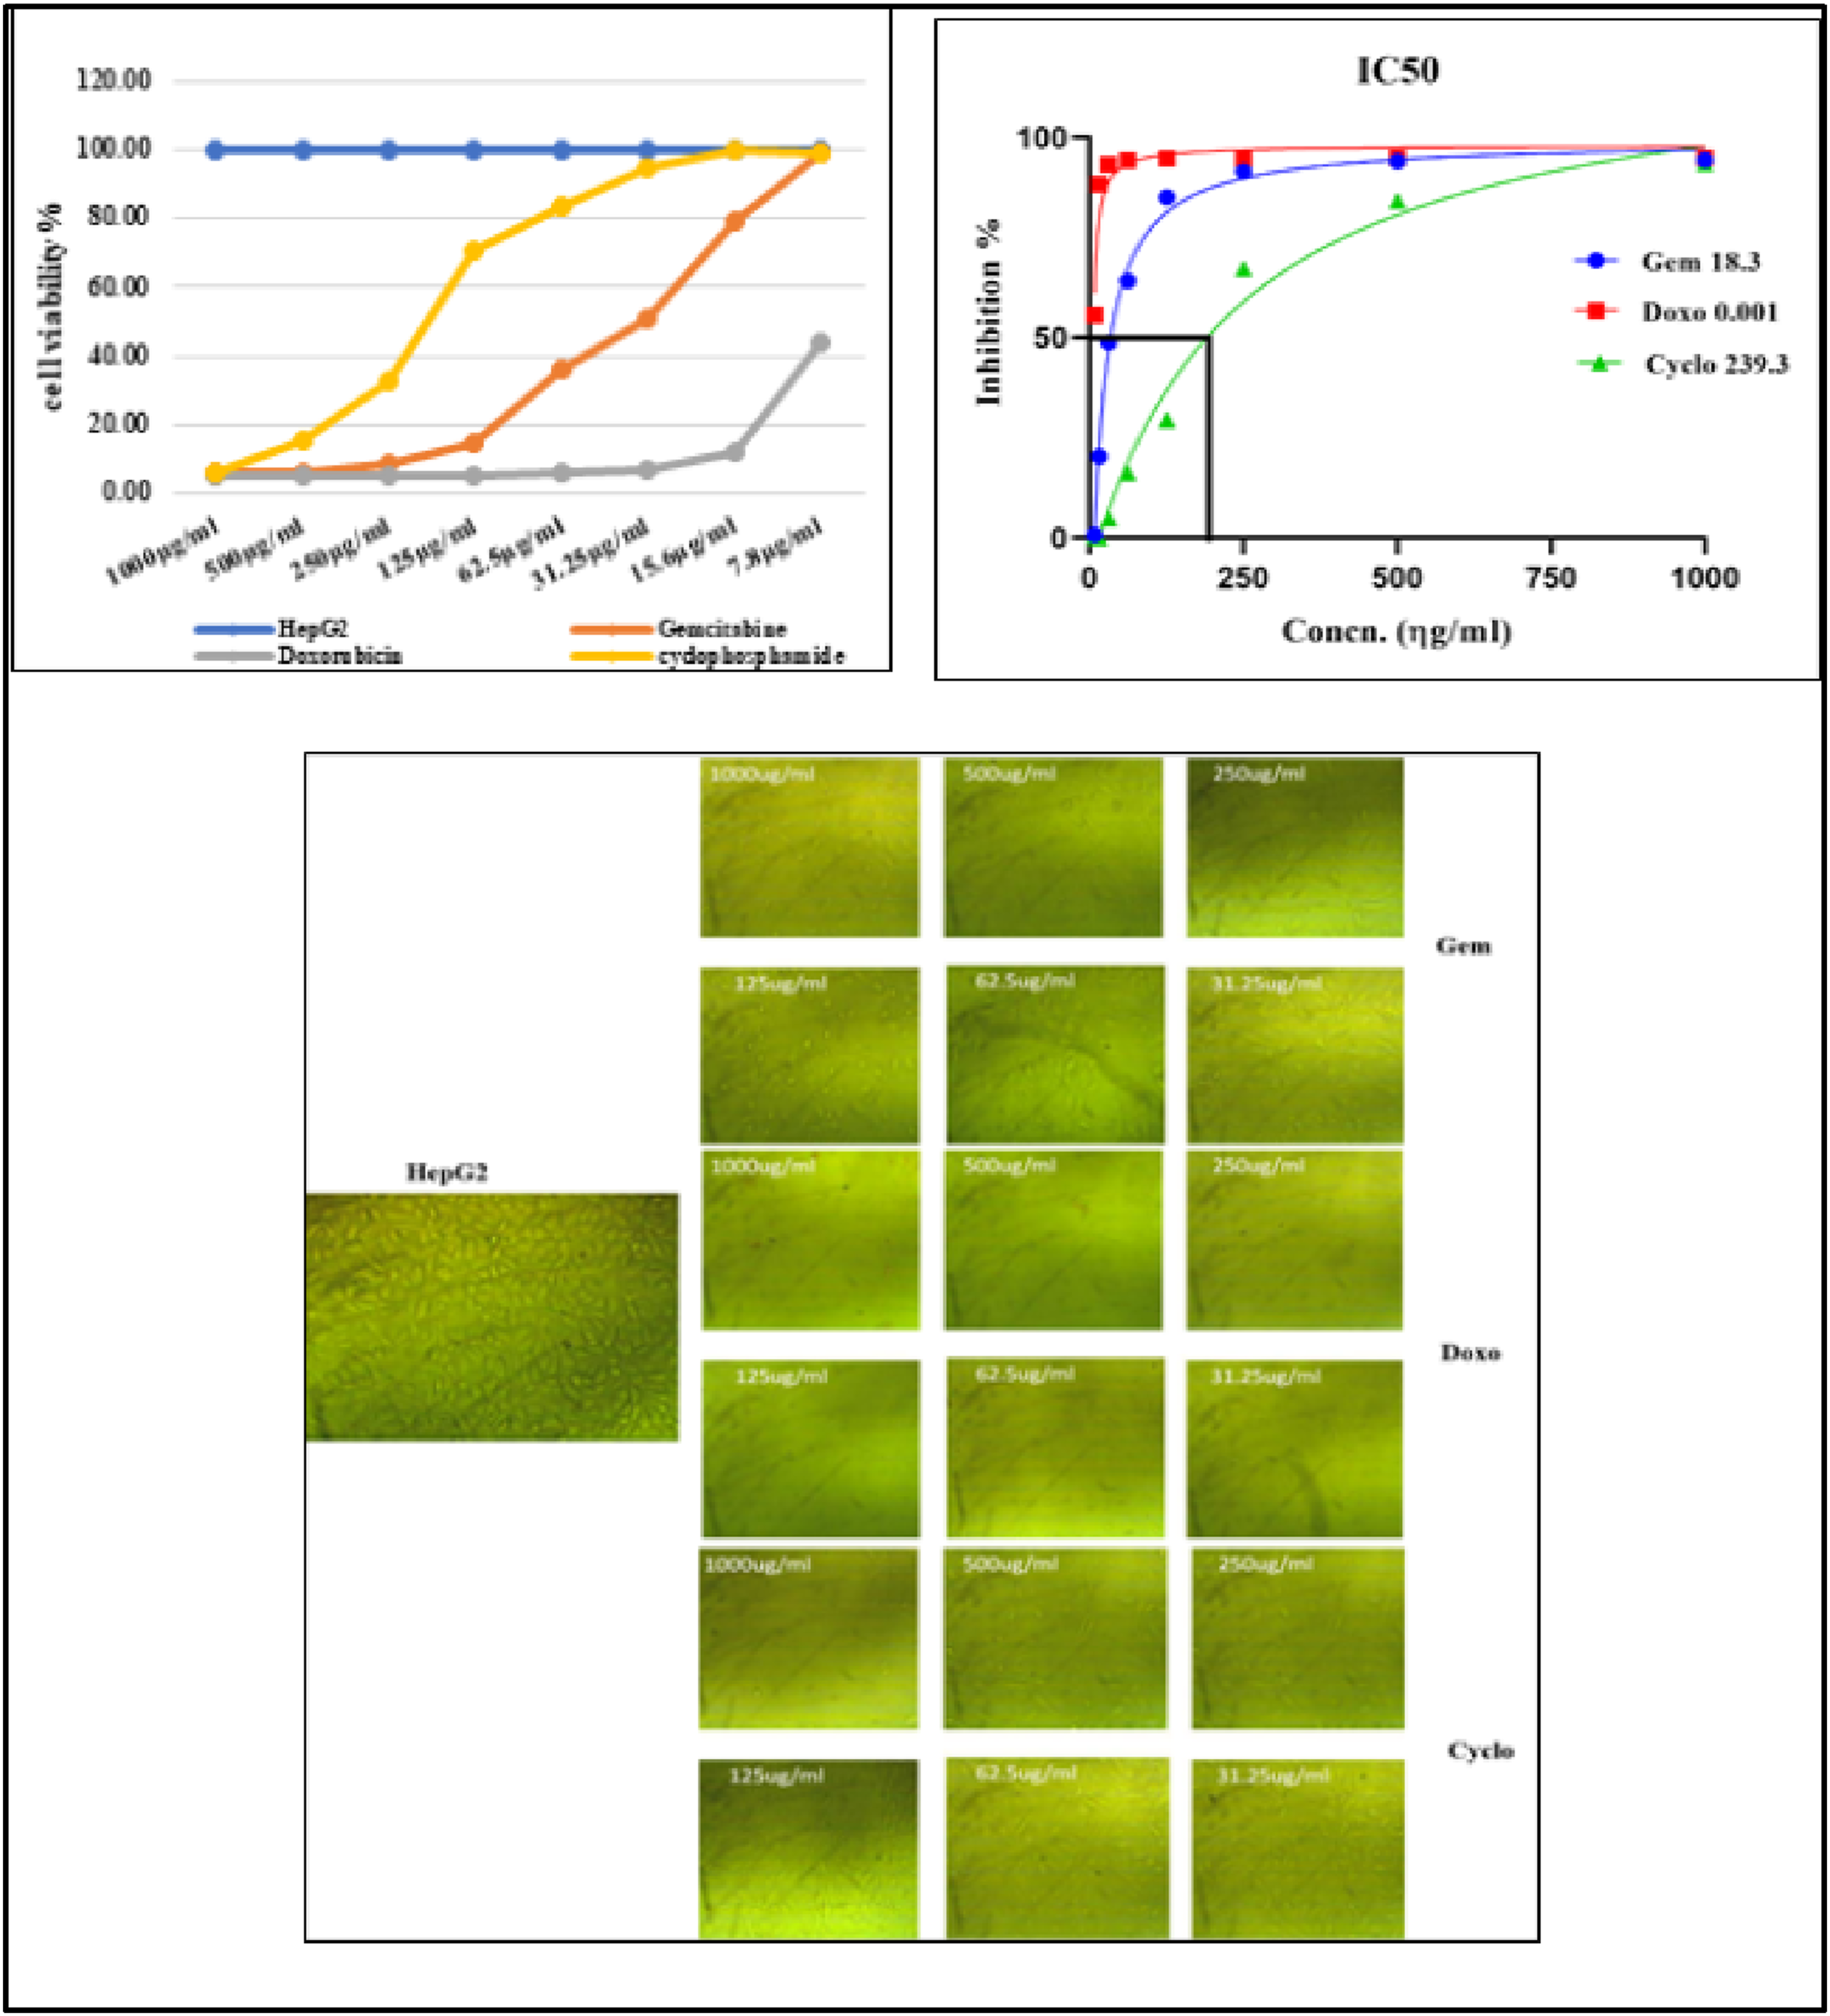
The mitochondrial activity of Wi38 and HepG2 cell lines was evaluated through an in vitro MTT assay. The control group consisted of Wi38 and HepG2 cells in RPMI media and was considered to have 100% viability and 0% toxicity. Drug concentrations ranging from 7.8 to 1000 µg/ml was used. The cytotoxicity of all drugs was estimated first on the normal cell line Figure 4. The results showed that doxorubicin exhibited the highest cytotoxic effect on Wi38 cells (48.7%), followed by cyclophosphamide (30.6%), while gemcitabine recorded a cytotoxic effect of 34.65%. More interestingly, cyclophosphamide has a lesser cytotoxic effect on the HepG2 cells Oppositely, doxorubicin is the most cytotoxic drug among them but it is also the most cytotoxic drug to the normal cells. IC50 was assessed for the three drugs (Gemcitabine 44.5, Doxorubicin 6.45, and Cyclophosphamide 190.56 µg/ml) (Figure 5). Interestingly, cyclophosphamide had a lesser cytotoxic effect on the HepG2 cells. In contrast, doxorubicin was the most cytotoxic drug among them, but it also had the most cytotoxic effect on normal cells. The IC50 values for the three drugs were assessed as follows: Gemcitabine 44.5 µg/ml, Doxorubicin 6.45 µg/ml, and Cyclophosphamide 190.56 µg/ml (Figure 5). MTT cytotoxicity assay (% of cell viability, % of cell toxicity and IC50) of the chemotherapeutic drugs on Wi38 cell (the value displayed as means ± SE (n = 3) of two independent experiments. MTT cytotoxicity assay (% of cell viability) and IC50 of different chemotherapeutic drugs on HepG2 cells (the value displayed as means ± SE (n = 3) of two independent experiments.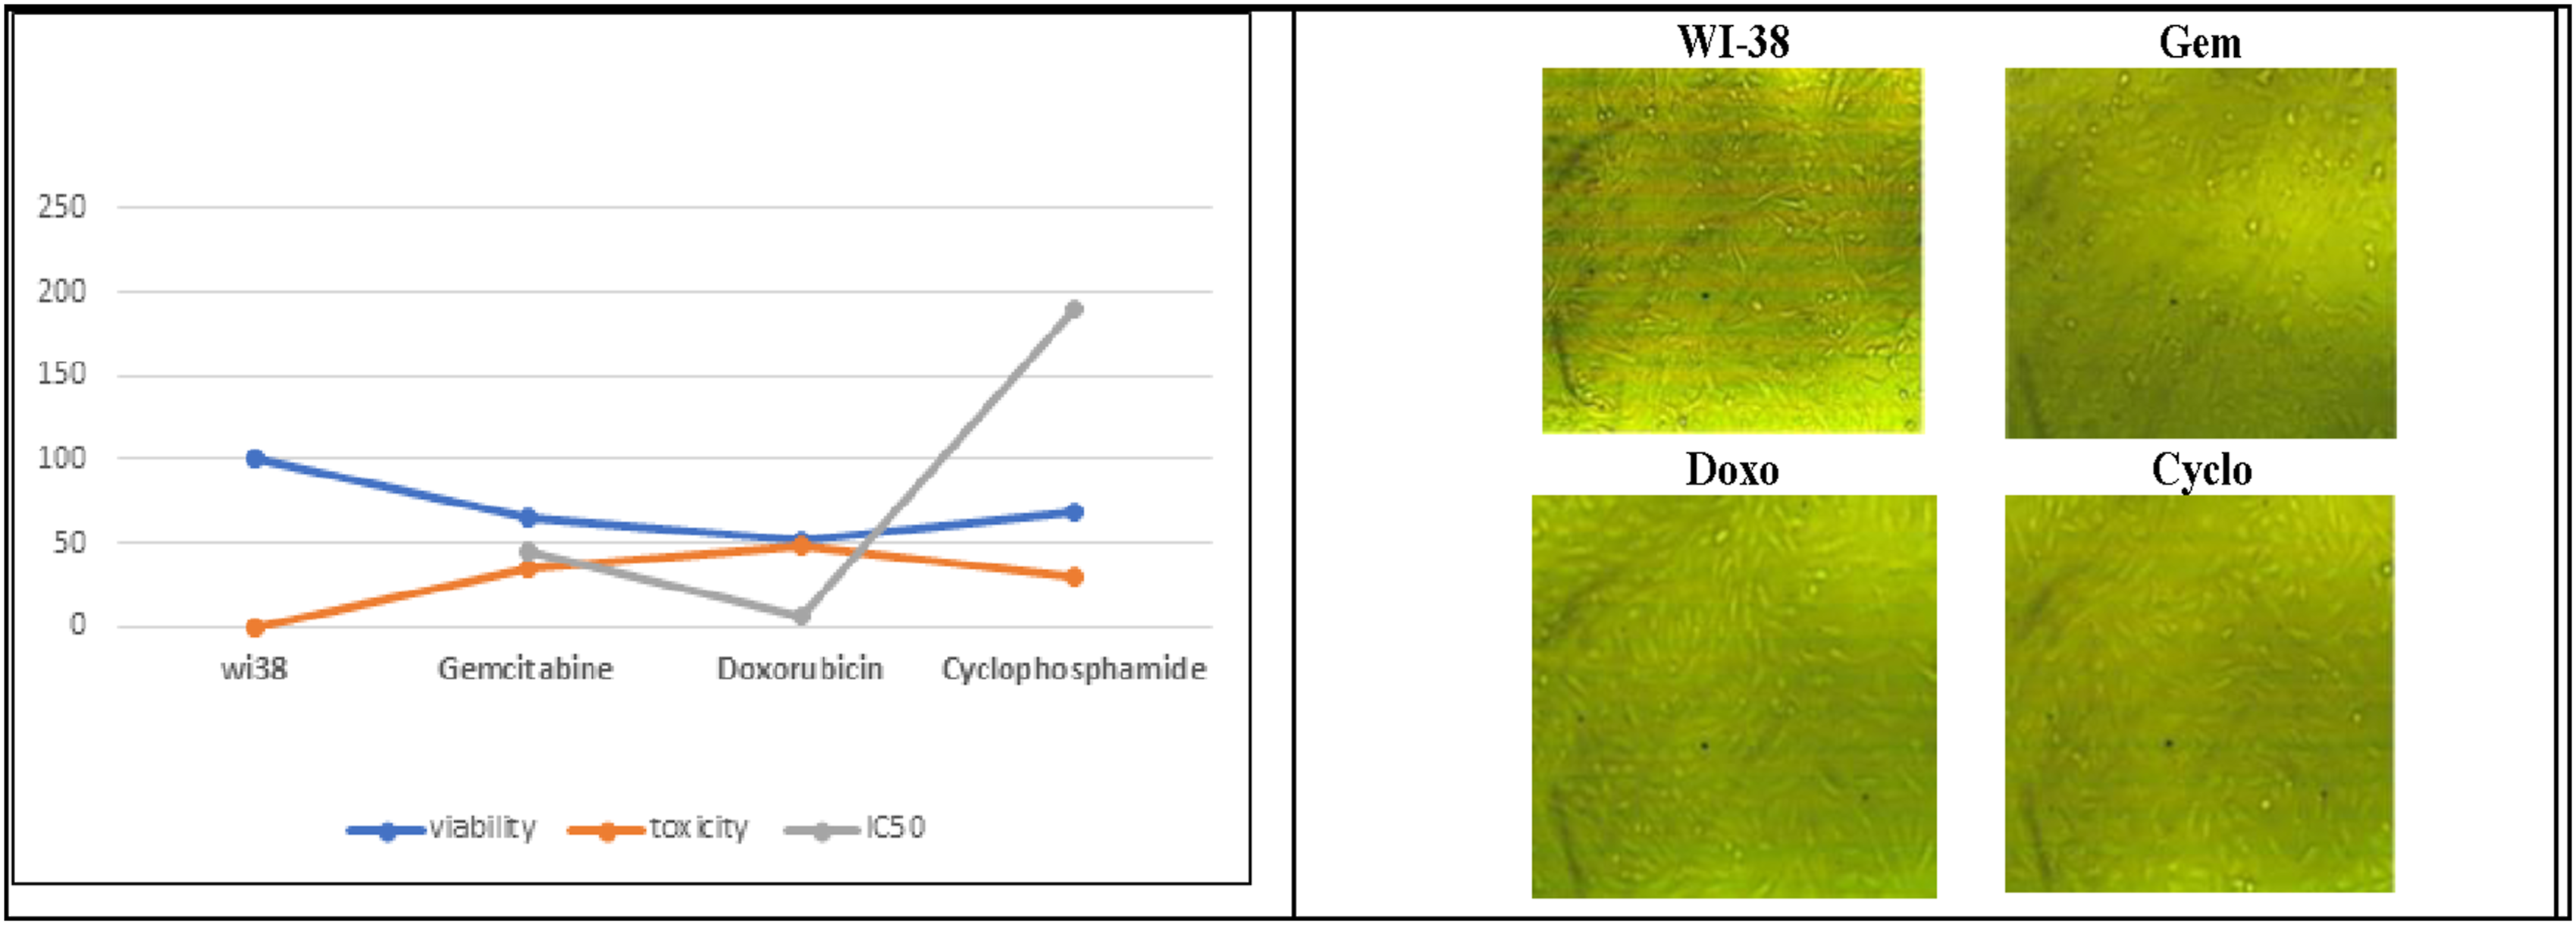
Liver function enzymes examination
The enzyme activities related to liver function were examined in all groups that were tested (Figure 6). In the HCC (T) group, there were significant elevations (p < .05) compared to their equivalent values in the control group. However, treatment with Gem exhibited a potent decrease compared to the T group. In contrast, associated treatment with AgNPs showed a significant improvement (p < .05) in their activities in the TAg group compared to the T group. There was a synergistic impact between Gem and AgNPs observed in all enzyme activities. Liver function enzyme activities of serum (AST, ALT, and ALP (U/L)) in different male rat groups. Each value represents the mean ± SE (n = 7). Columns over headed with different letters are considered significantly different (p < .05). (a): Different from control, (b): Different from Ag, (c): Different from G; and (d): Different from T.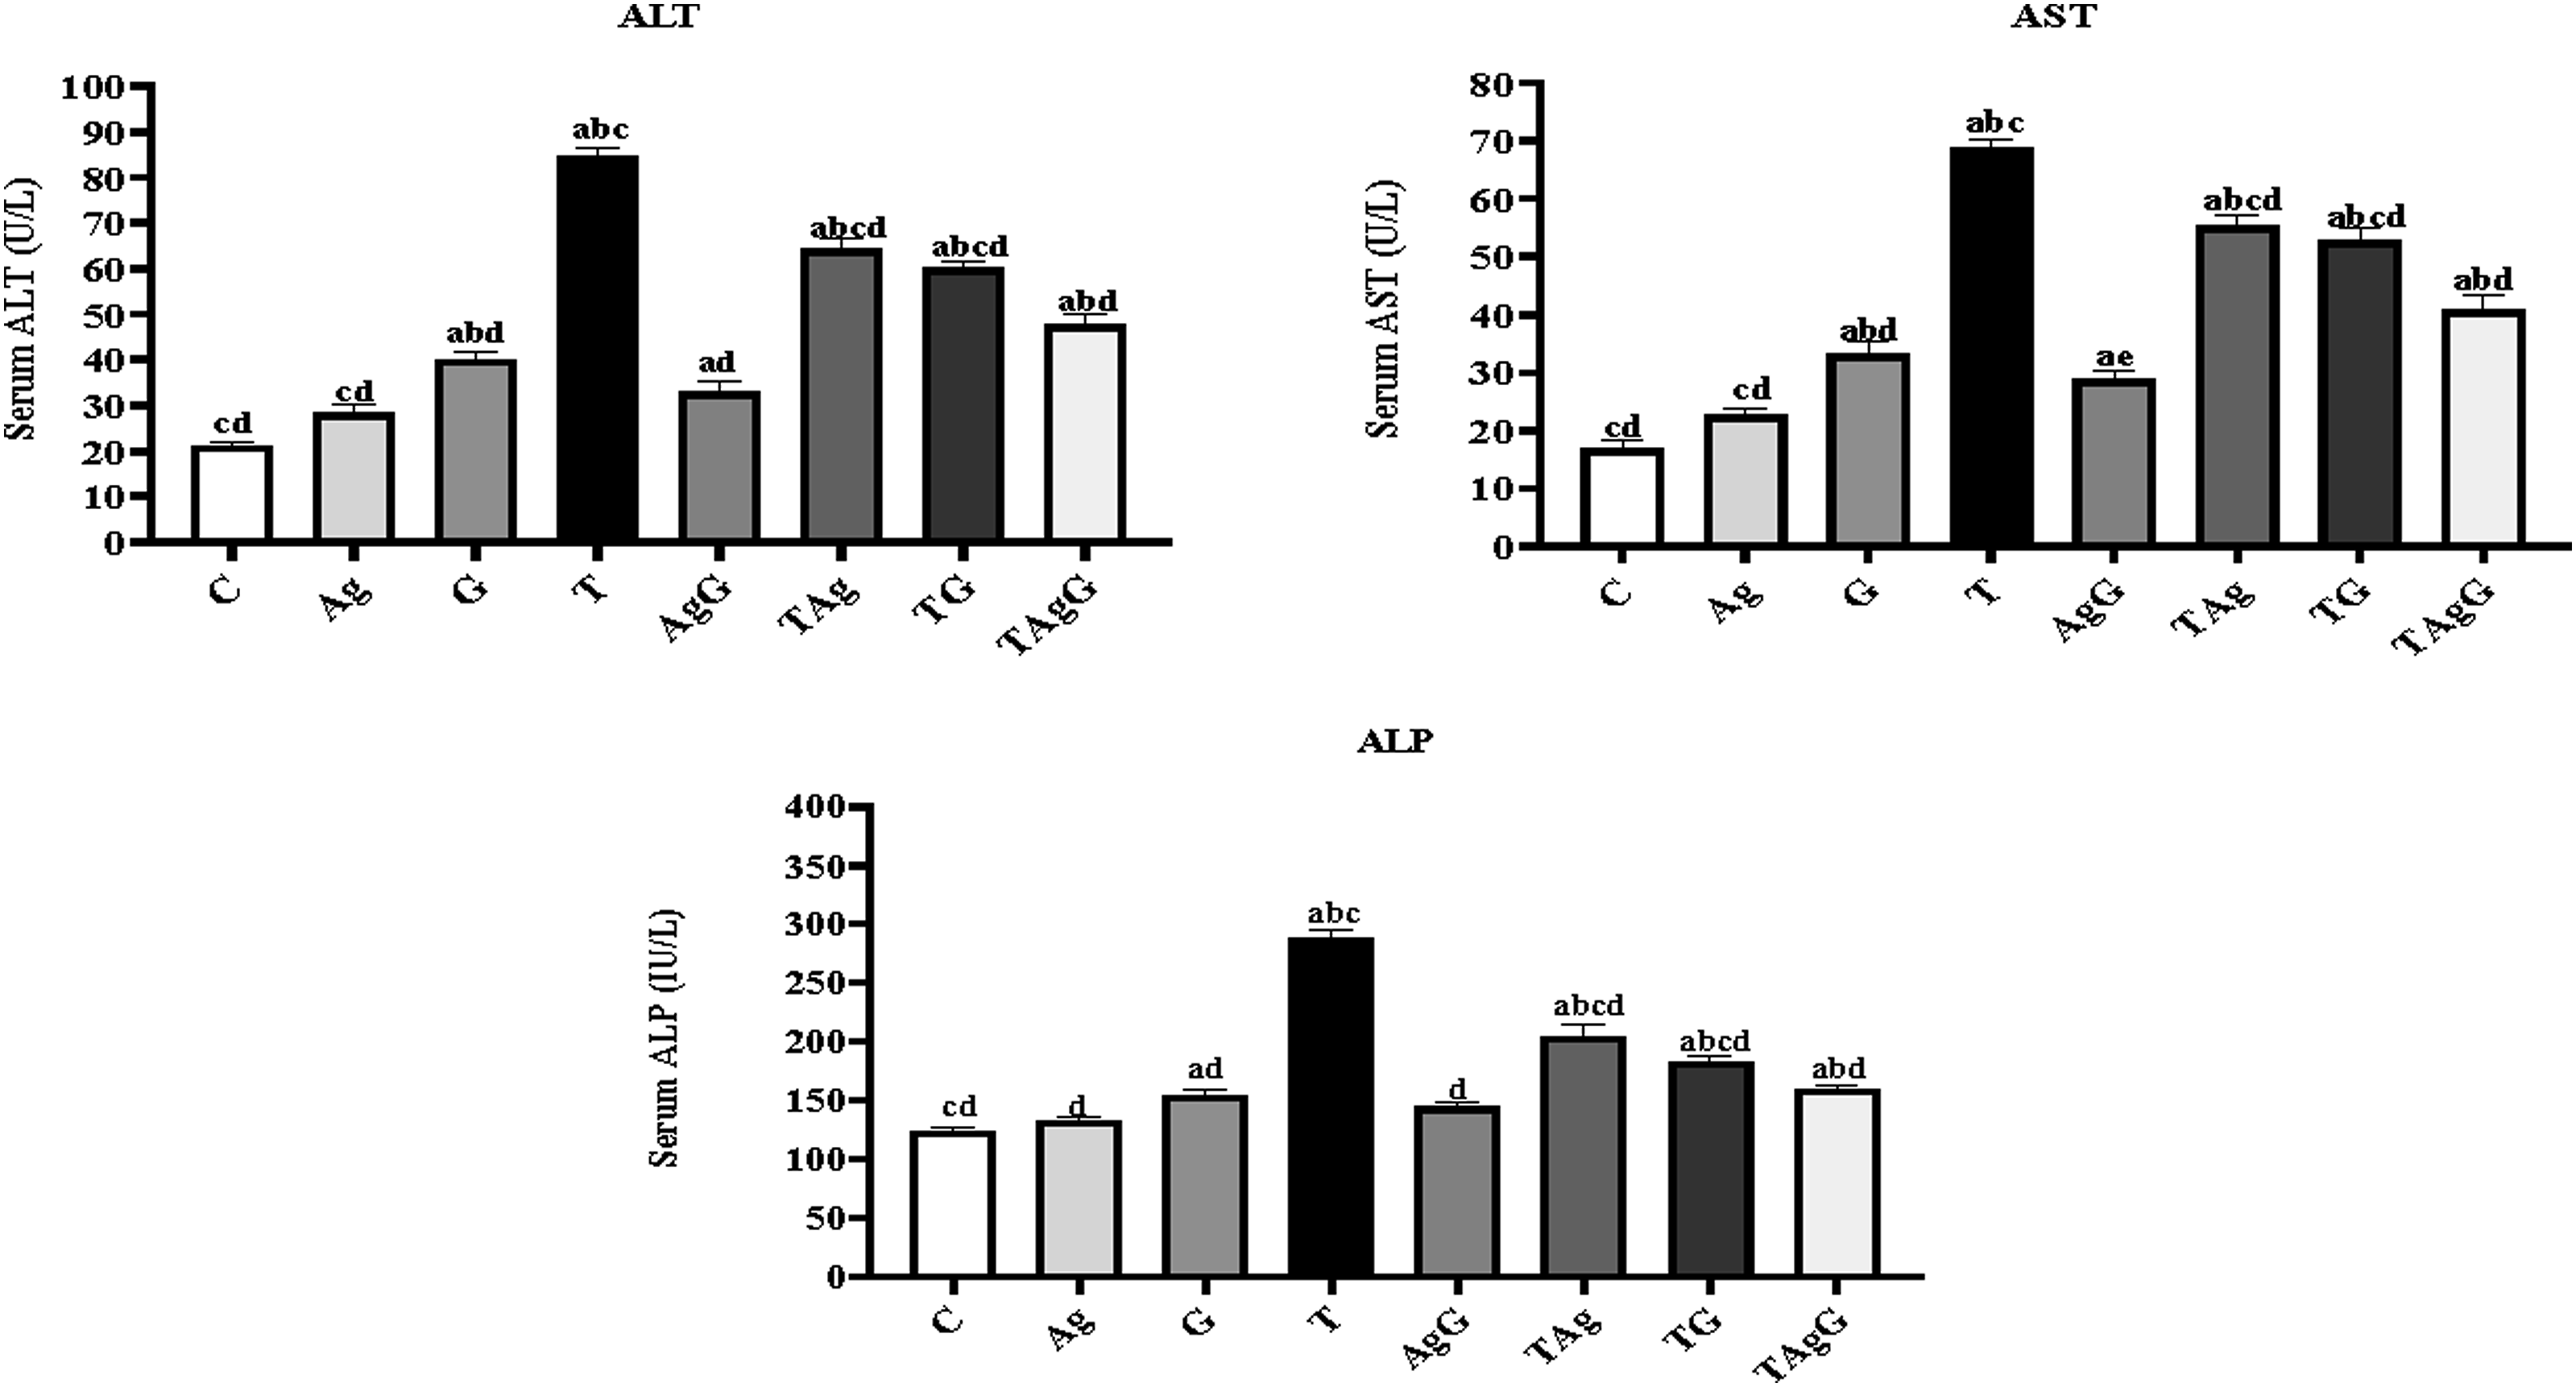
Annexin V apoptosis analysis
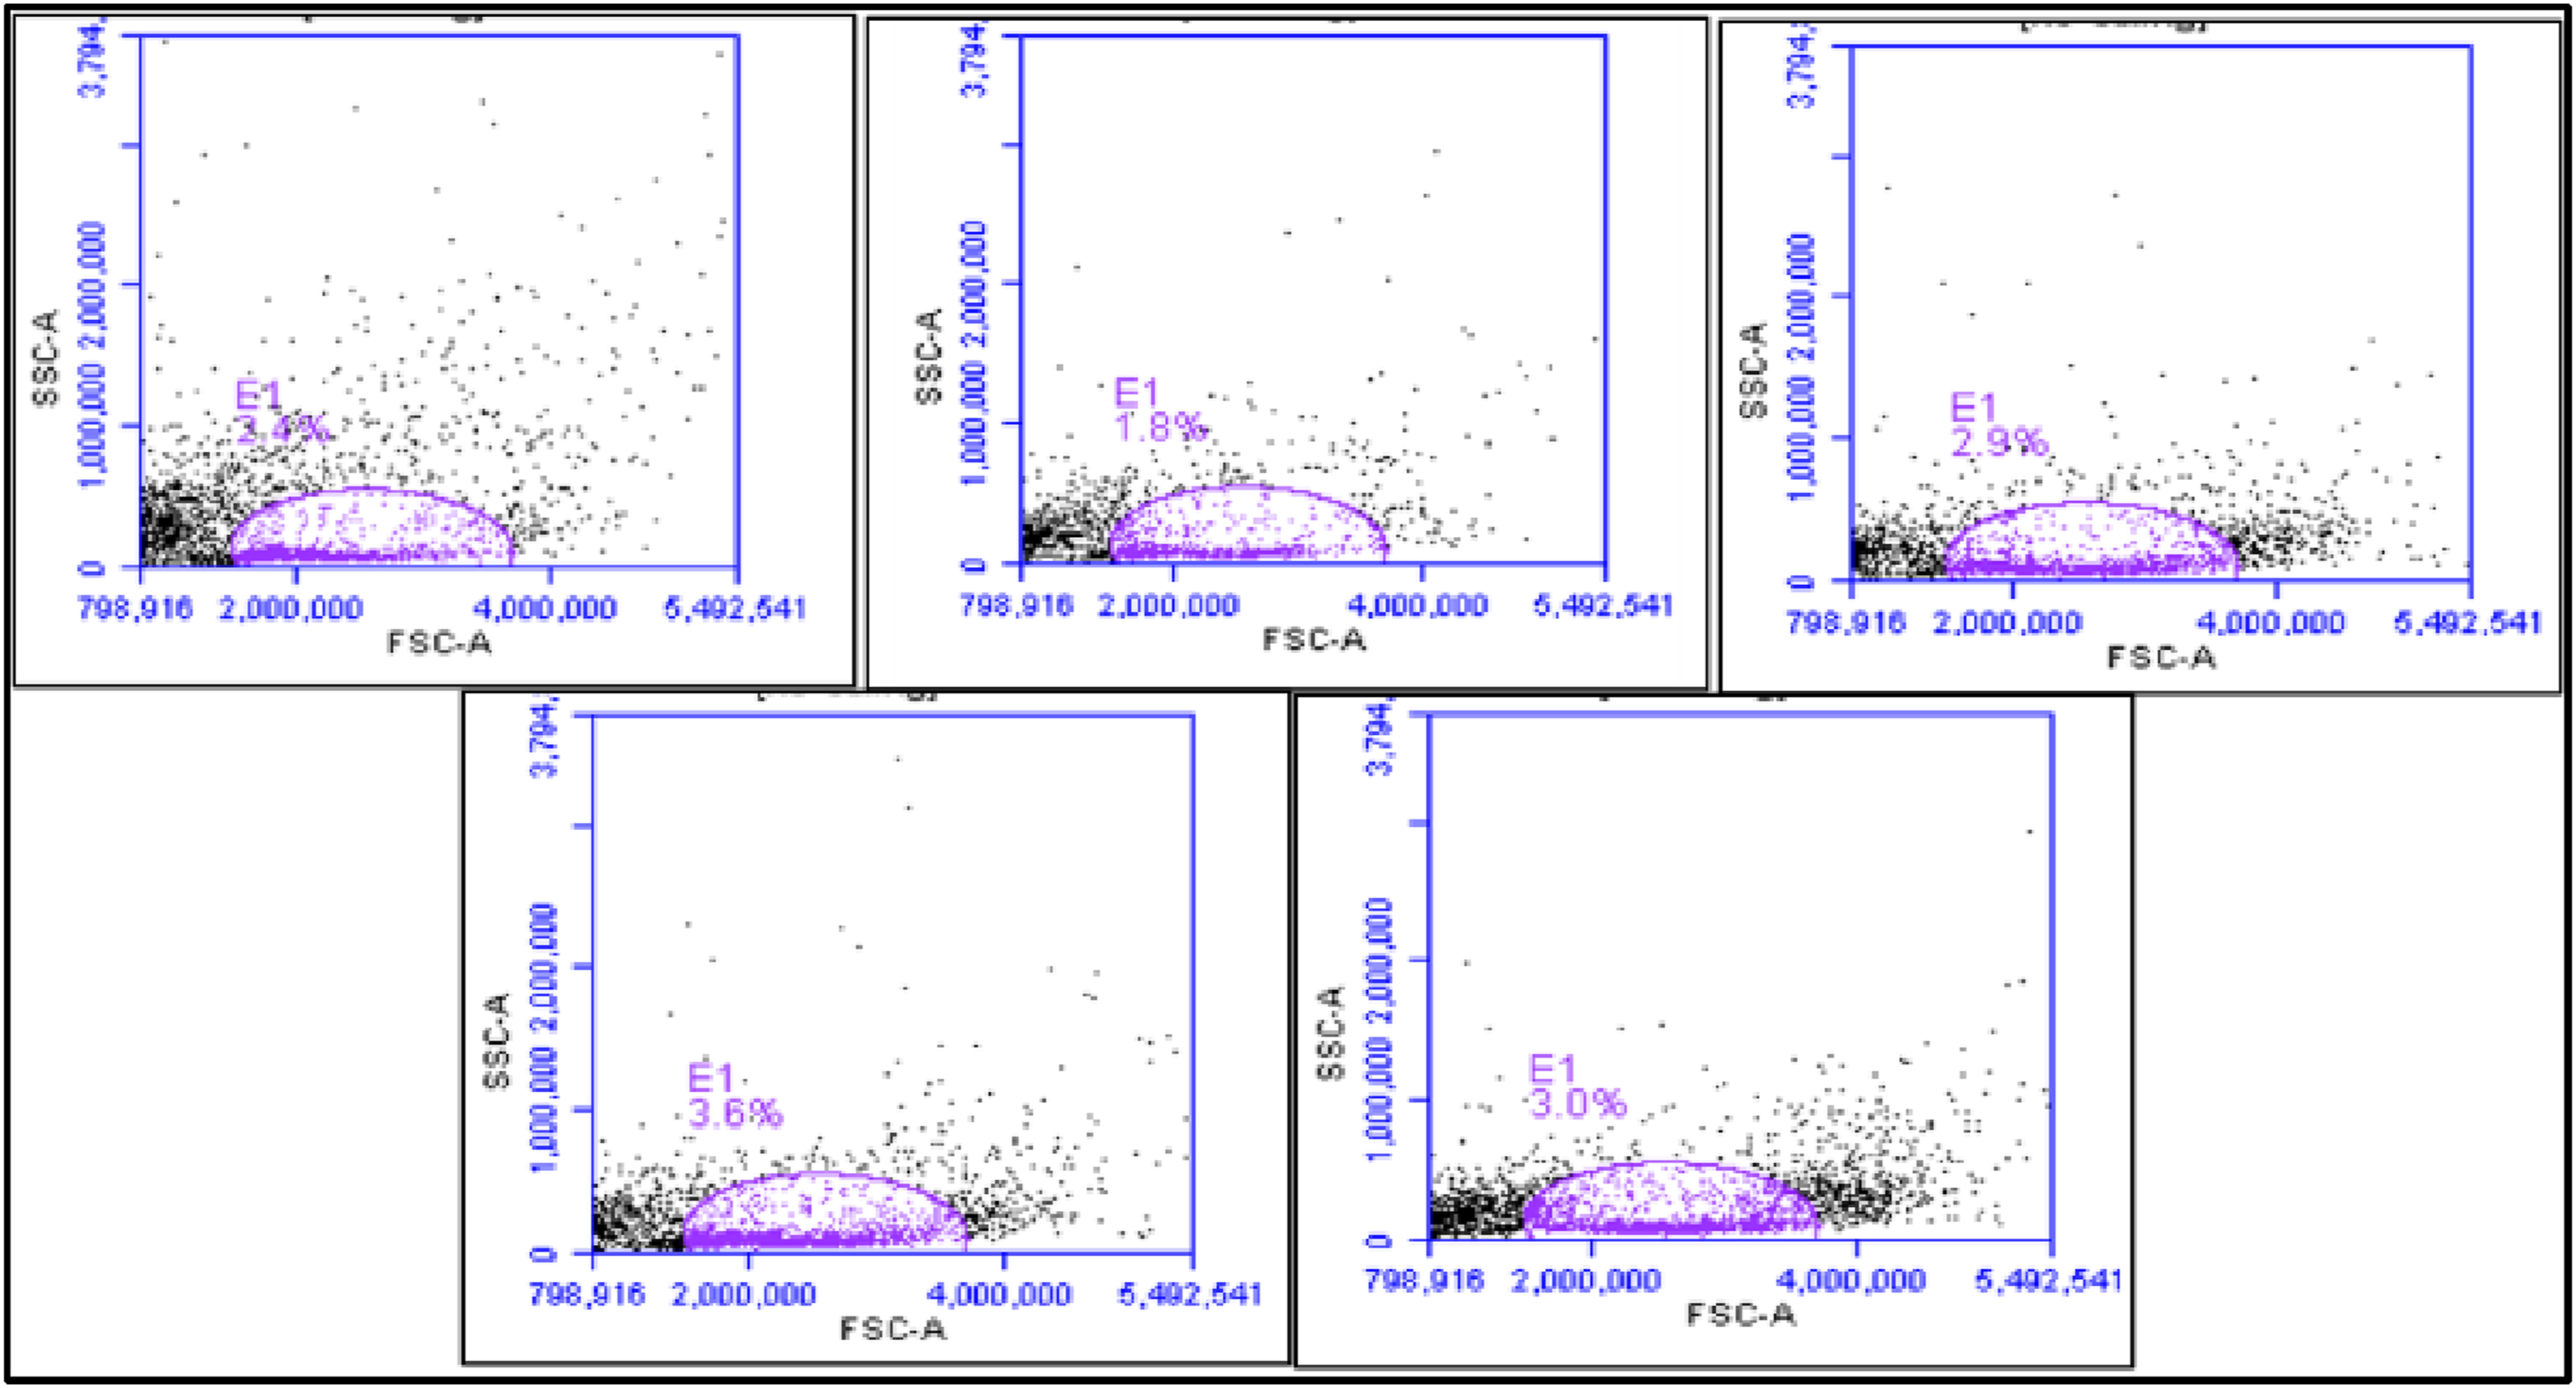
Apoptotic Annexin V/PI lymphocyte distribution using flow cytometry analysis was shown in dot plots and histograms (Figures 7 and 8). Annexin V/PI staining defined the apoptotic and non-apoptotic population of cells. In the present work, the total apoptotic activity (V+/PI−) and (V+/PI+) significantly increased in T group (63.6 ± 0.32) comparing to the healthy control group (0.15 ± 0.08). However, our results demonstrated that Gem can reduce the total apoptosis of lymphocyte (50.07± compared to T group. In addition, the AgNPs administration showed a potent decrease in apoptosis (43.5 ± 0.46) compared to T group. Remarkably, the combination of AgNPs and Gem established a synergistic effect counter HCC development in TAgG (35.68 ± 0.58) contrary to the T group. Flow cytometric profile of blood lymphocytes of all tested groups stained with Annexin V/FITC in x-axis and Propidium Iodide (PI) in y-axis. Viable cells (lower left) Annexin V–/PI–, early cell apoptosis (lower right) Annexin V+/PI–, late cell apoptosis (upper right) Annexin V+/PI+, and necrotic cells (upper left) Annexin V–/PI+. The overall percentage of viable and dead cells comprises the total apoptotic cells (early and late) as well as the necrotic ones: (a)- normal control (C), (b)- HCC developed group (T), (c)- Animals developed HCC & treated with AgNPs (TAg), (d)- HCC developed rats & injected with Gem, (e)- HCC developed rats &treated with AgNPs and Gem (TAgG) Data are mean ± SE, at p < .05. Forward scatter (FSC) versus side scatter (SSC) plots after doublet exclusion. (a) Control (C); (b) HCC (T); (c) HCC-AgNPs treated group (TAg); (d) HCC-Gem treated group (TG); (e) HCC- AgNPs- Gem treated group (TAgG).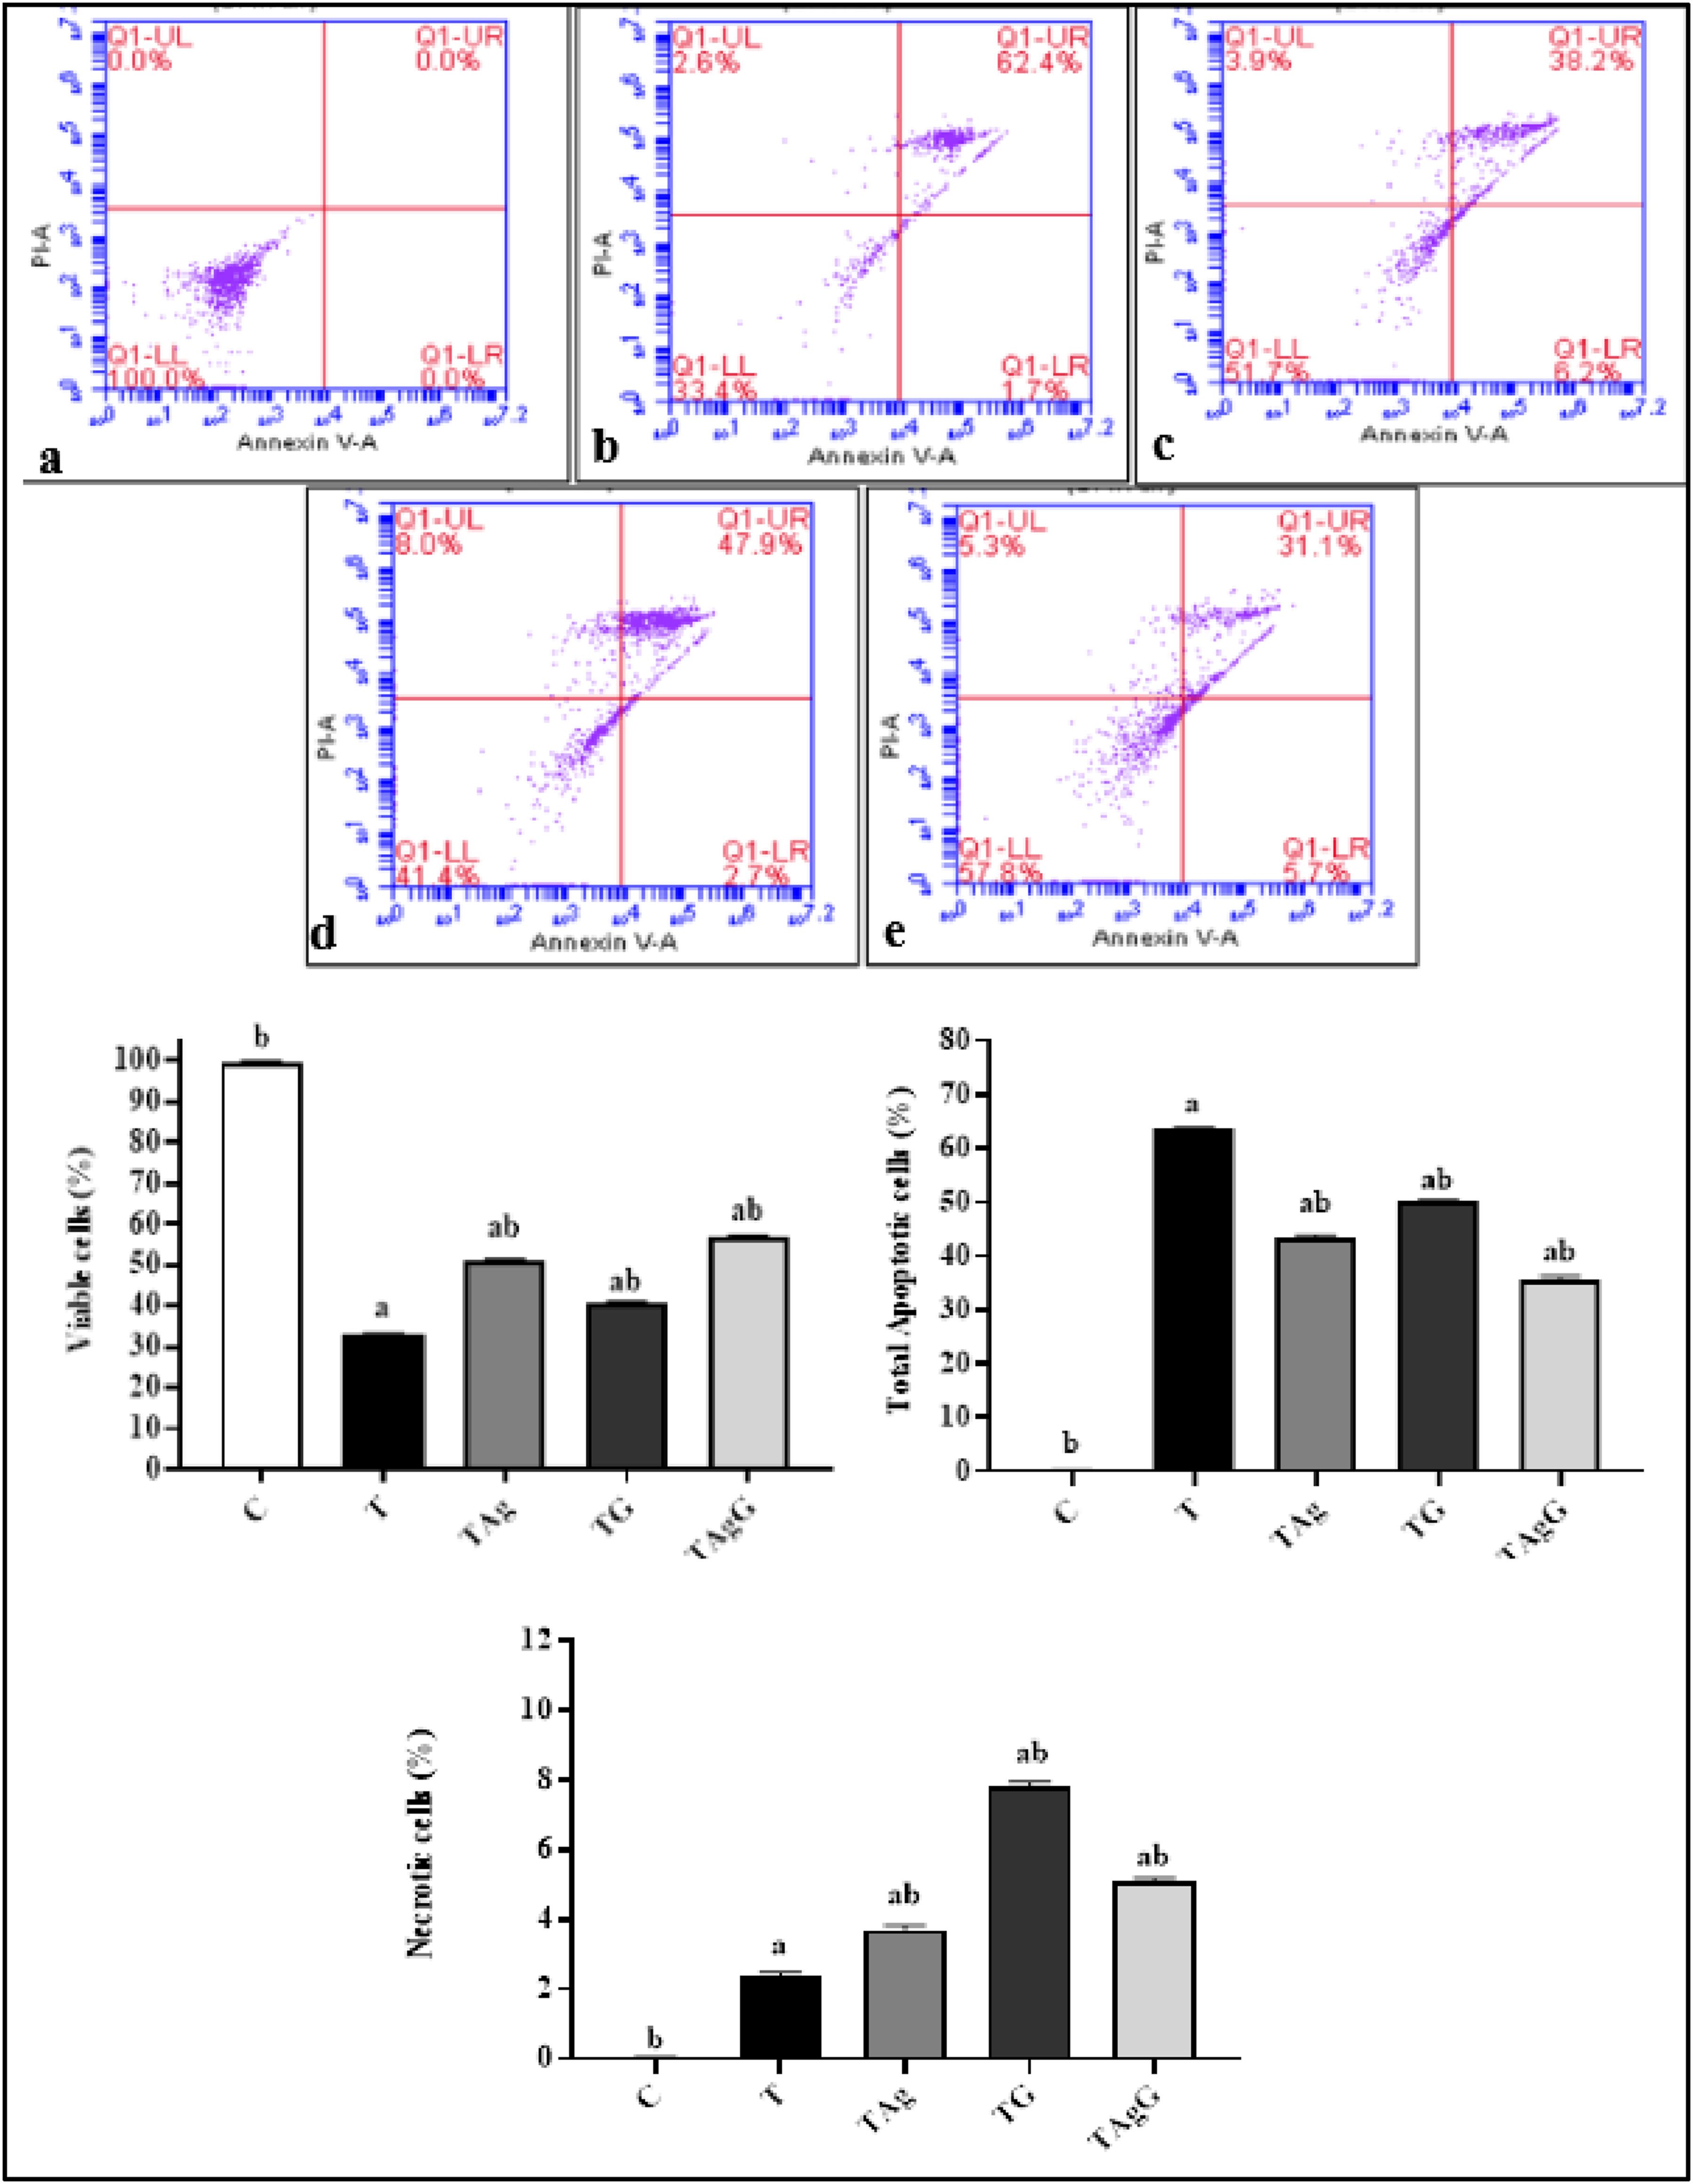
The distribution of apoptotic Annexin V/PI lymphocytes was analyzed using flow cytometry. The results were presented in dot plots and histograms (Figures 7 and 8). Annexin V/PI staining was used to differentiate between the apoptotic and non-apoptotic cell populations. 40 The study found that the total apoptotic activity (V+/PI-) and (V+/PI+) was significantly higher in the T group (63.6 ± 0.32) compared to the healthy control group (0.15 ± 0.08). However, the results showed that Gem can reduce the total apoptosis of lymphocytes (50.07± compared to the T group. Moreover, the administration of AgNPs led to a significant decrease in apoptosis (43.5 ± 0.46) compared to the T group. Interestingly, combining AgNPs and Gem resulted in a synergistic effect that countered the development of HCC in TAgG (35.68 ± 0.58), in contrast to the T group.
Mixed function cytochrome P-450 enzyme activity
In the present work, the expression of liver CYT P450 mRNA of the control(C) group was 1.06 ± 0.09 folds. The developed HCC group (T) exhibited a significant increase in CYT P450 mRNA compared to the control group. Nevertheless, the results revealed significant improvement in the HCC group treated with AgNPs (TAg) (5.31 ± 0.38) or Gem (TG) (4.51 ± 0.43) compared to the T group (9.20 ± 0.47) (p < .05). Moreover, the combined treatment of AgNPs and Gem (TAgG) observed a potent improvement (2.80 ± 0.22) compared to the T group (p < .05). (Figure 9) The relative gene expression of CYT-P450 m-RNA in different examined groups. Each value represents the mean ± SE (n = 7). Columns over headed with different letters are considered significantly different (p < .05). (a): Different from control, (b): Different from Ag, (c): Different from G; and (d): Different from T.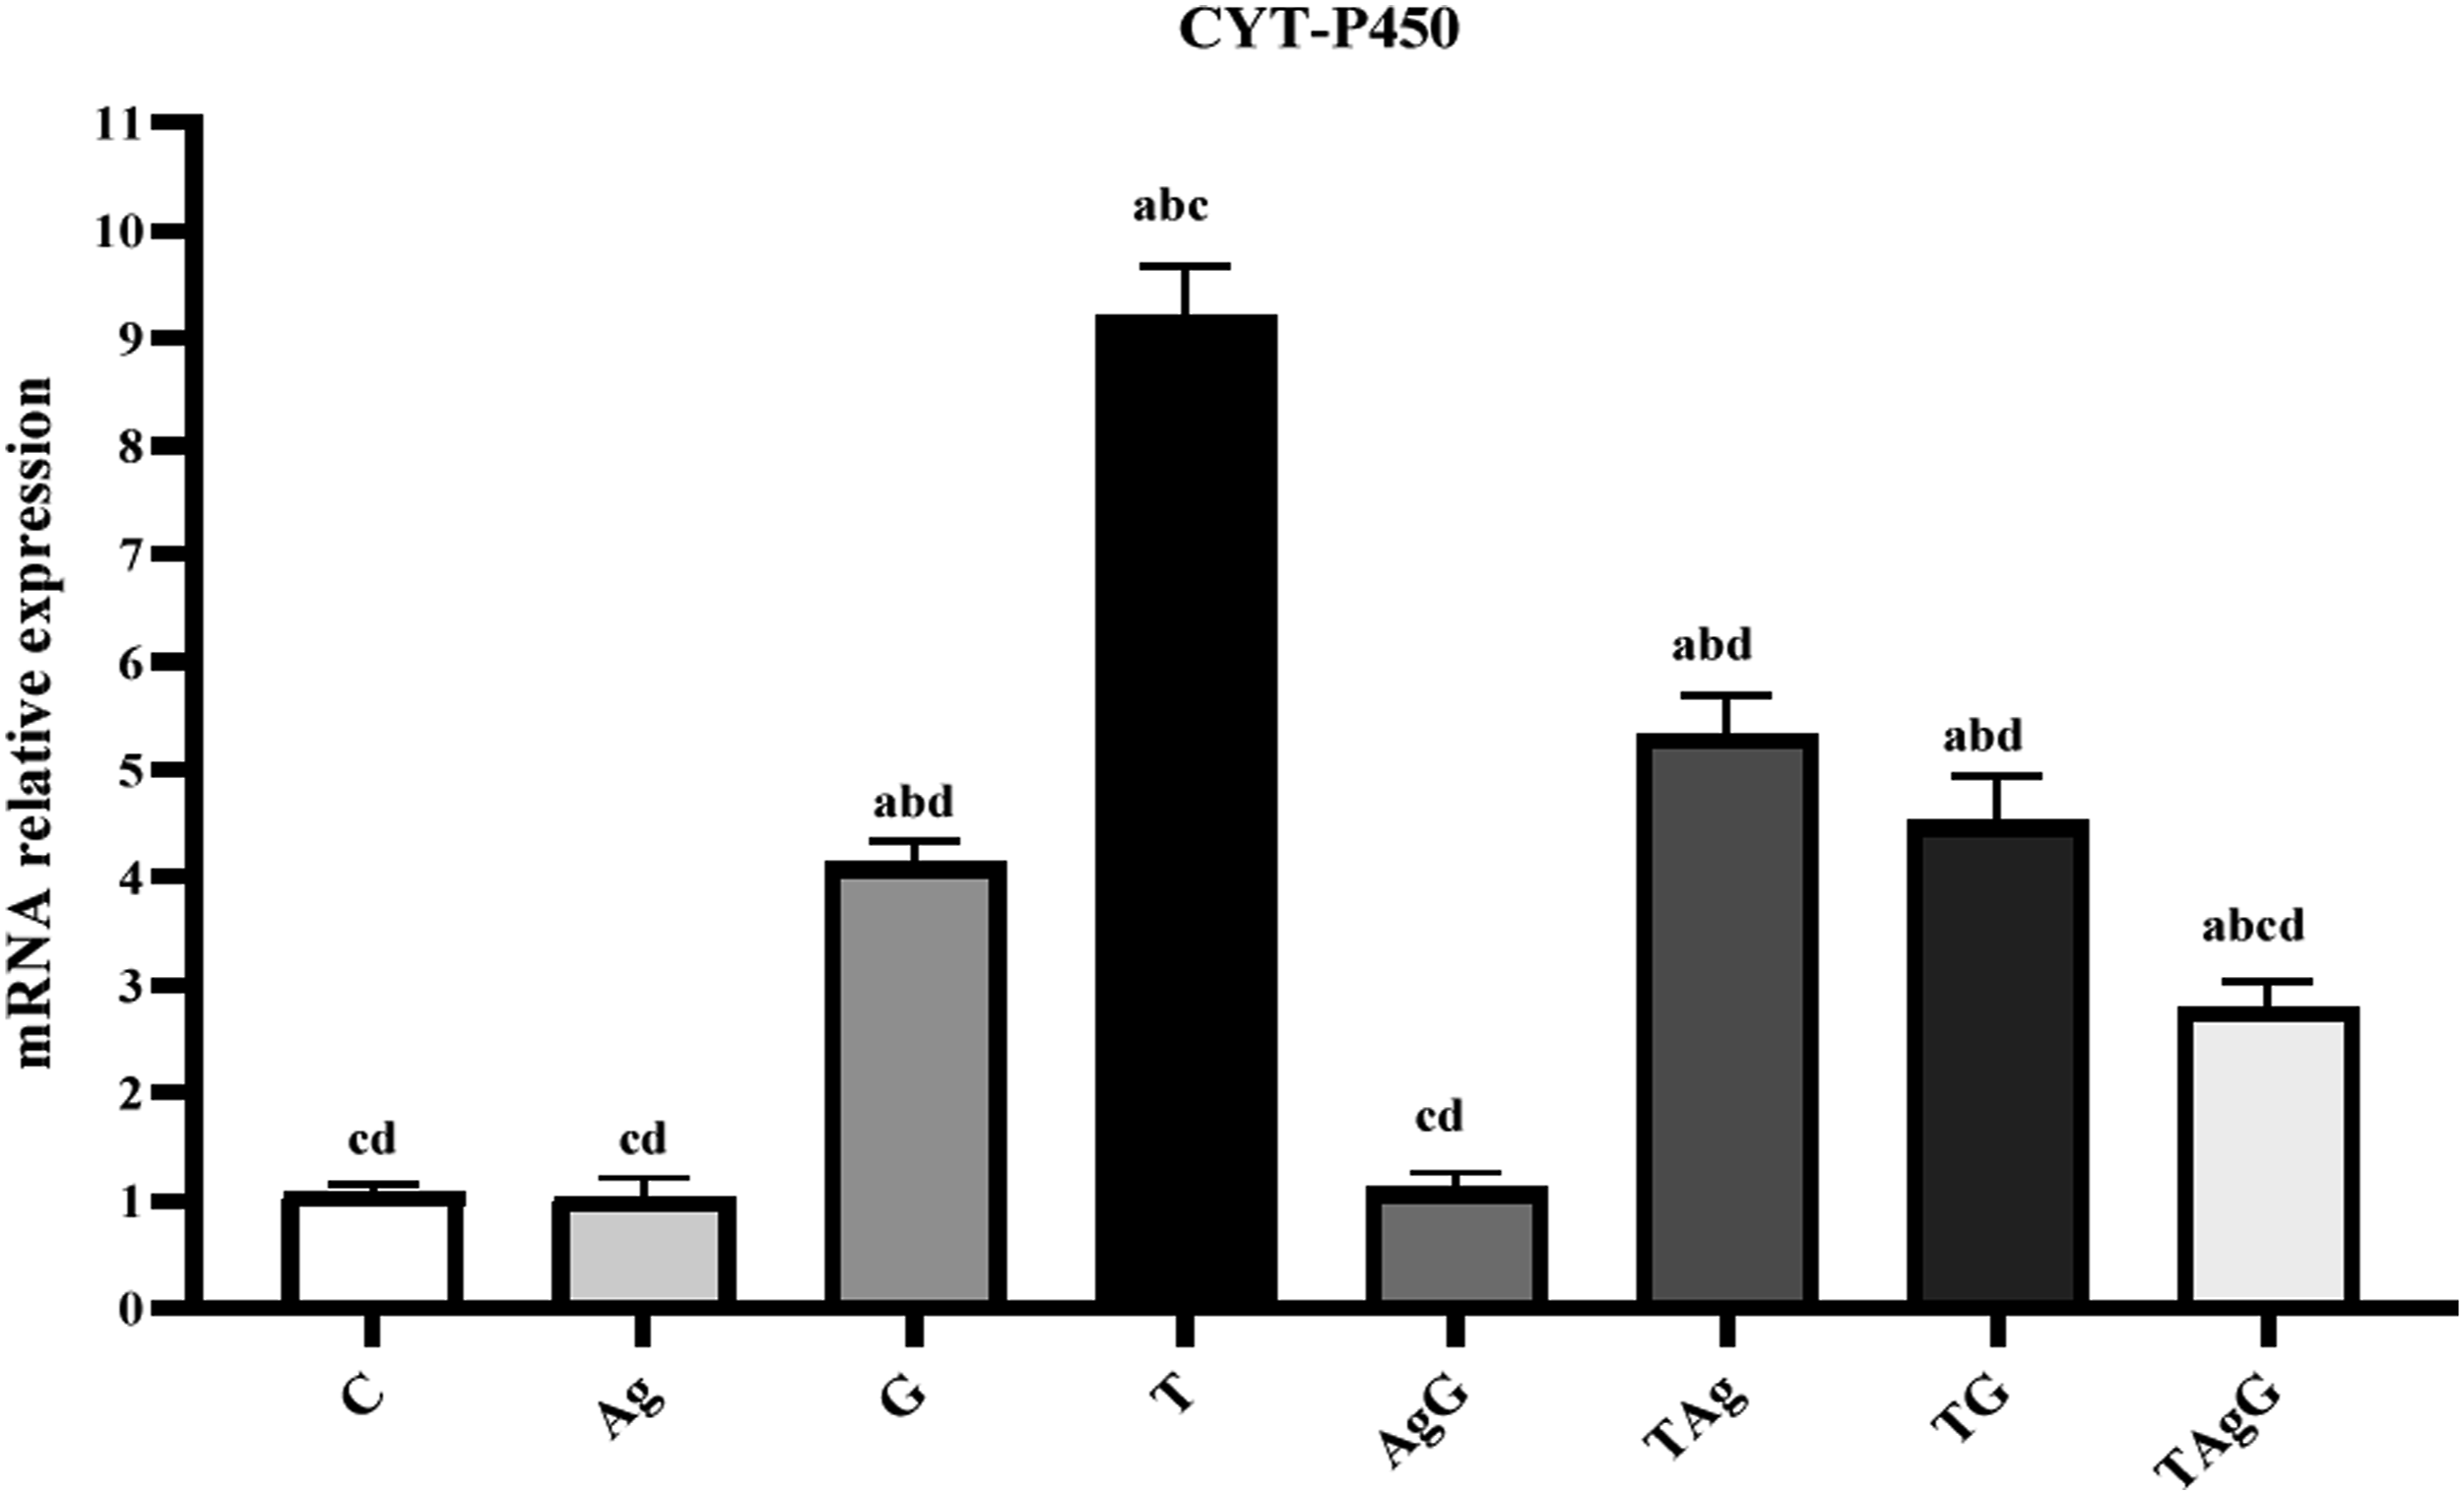
Apoptotic pathway detections
The protein expression of Bax was significantly decreased (p < .05) in the T group (68.46%) compared to the control group (Figure 10(a)). On the other hand, the treatment by AgNPs alone (TAg), GEM alone (TG), or both (TAgG) significantly elevated (p < .05) (7.07-fold change, 9.5-fold change, and 14.56-fold change, respectively) compared to the T group. Similarly, Caspase9 protein expression demonstrated a significant decline (p < .05) in the T group (64.47%) compared to the corresponding control. However, the protein expression of Caspase9 significantly rise (p < .05) in groups TAg, TG, and TAgG (7.5-fold change, 11.08-fold change, and 16.25-fold change, respectively) compared to the T group (Figure 10(b)). Though, the protein expression of BCl2 exhibited a potent increase in T group (p < .05) (5.5-fold change) in comparison to the respected control. Conversely, the data of the TAg, TG, and TAgG displayed a significant reduction (p < .05) (35.42%, 43.82%, and 63.59%, respectively) corresponding to tumor developed group (T) (Figure 10(c)). The protein expression of different apoptotic markers (Bax, BCL2, and Caspase9) in all examined rats. Each value represents the mean ± SE (n = 7). Columns over headed with different letters are considered significantly different (p < .05). (a): Different from control, (b): Different from Ag, and (c): Different from G; (d): Different from T.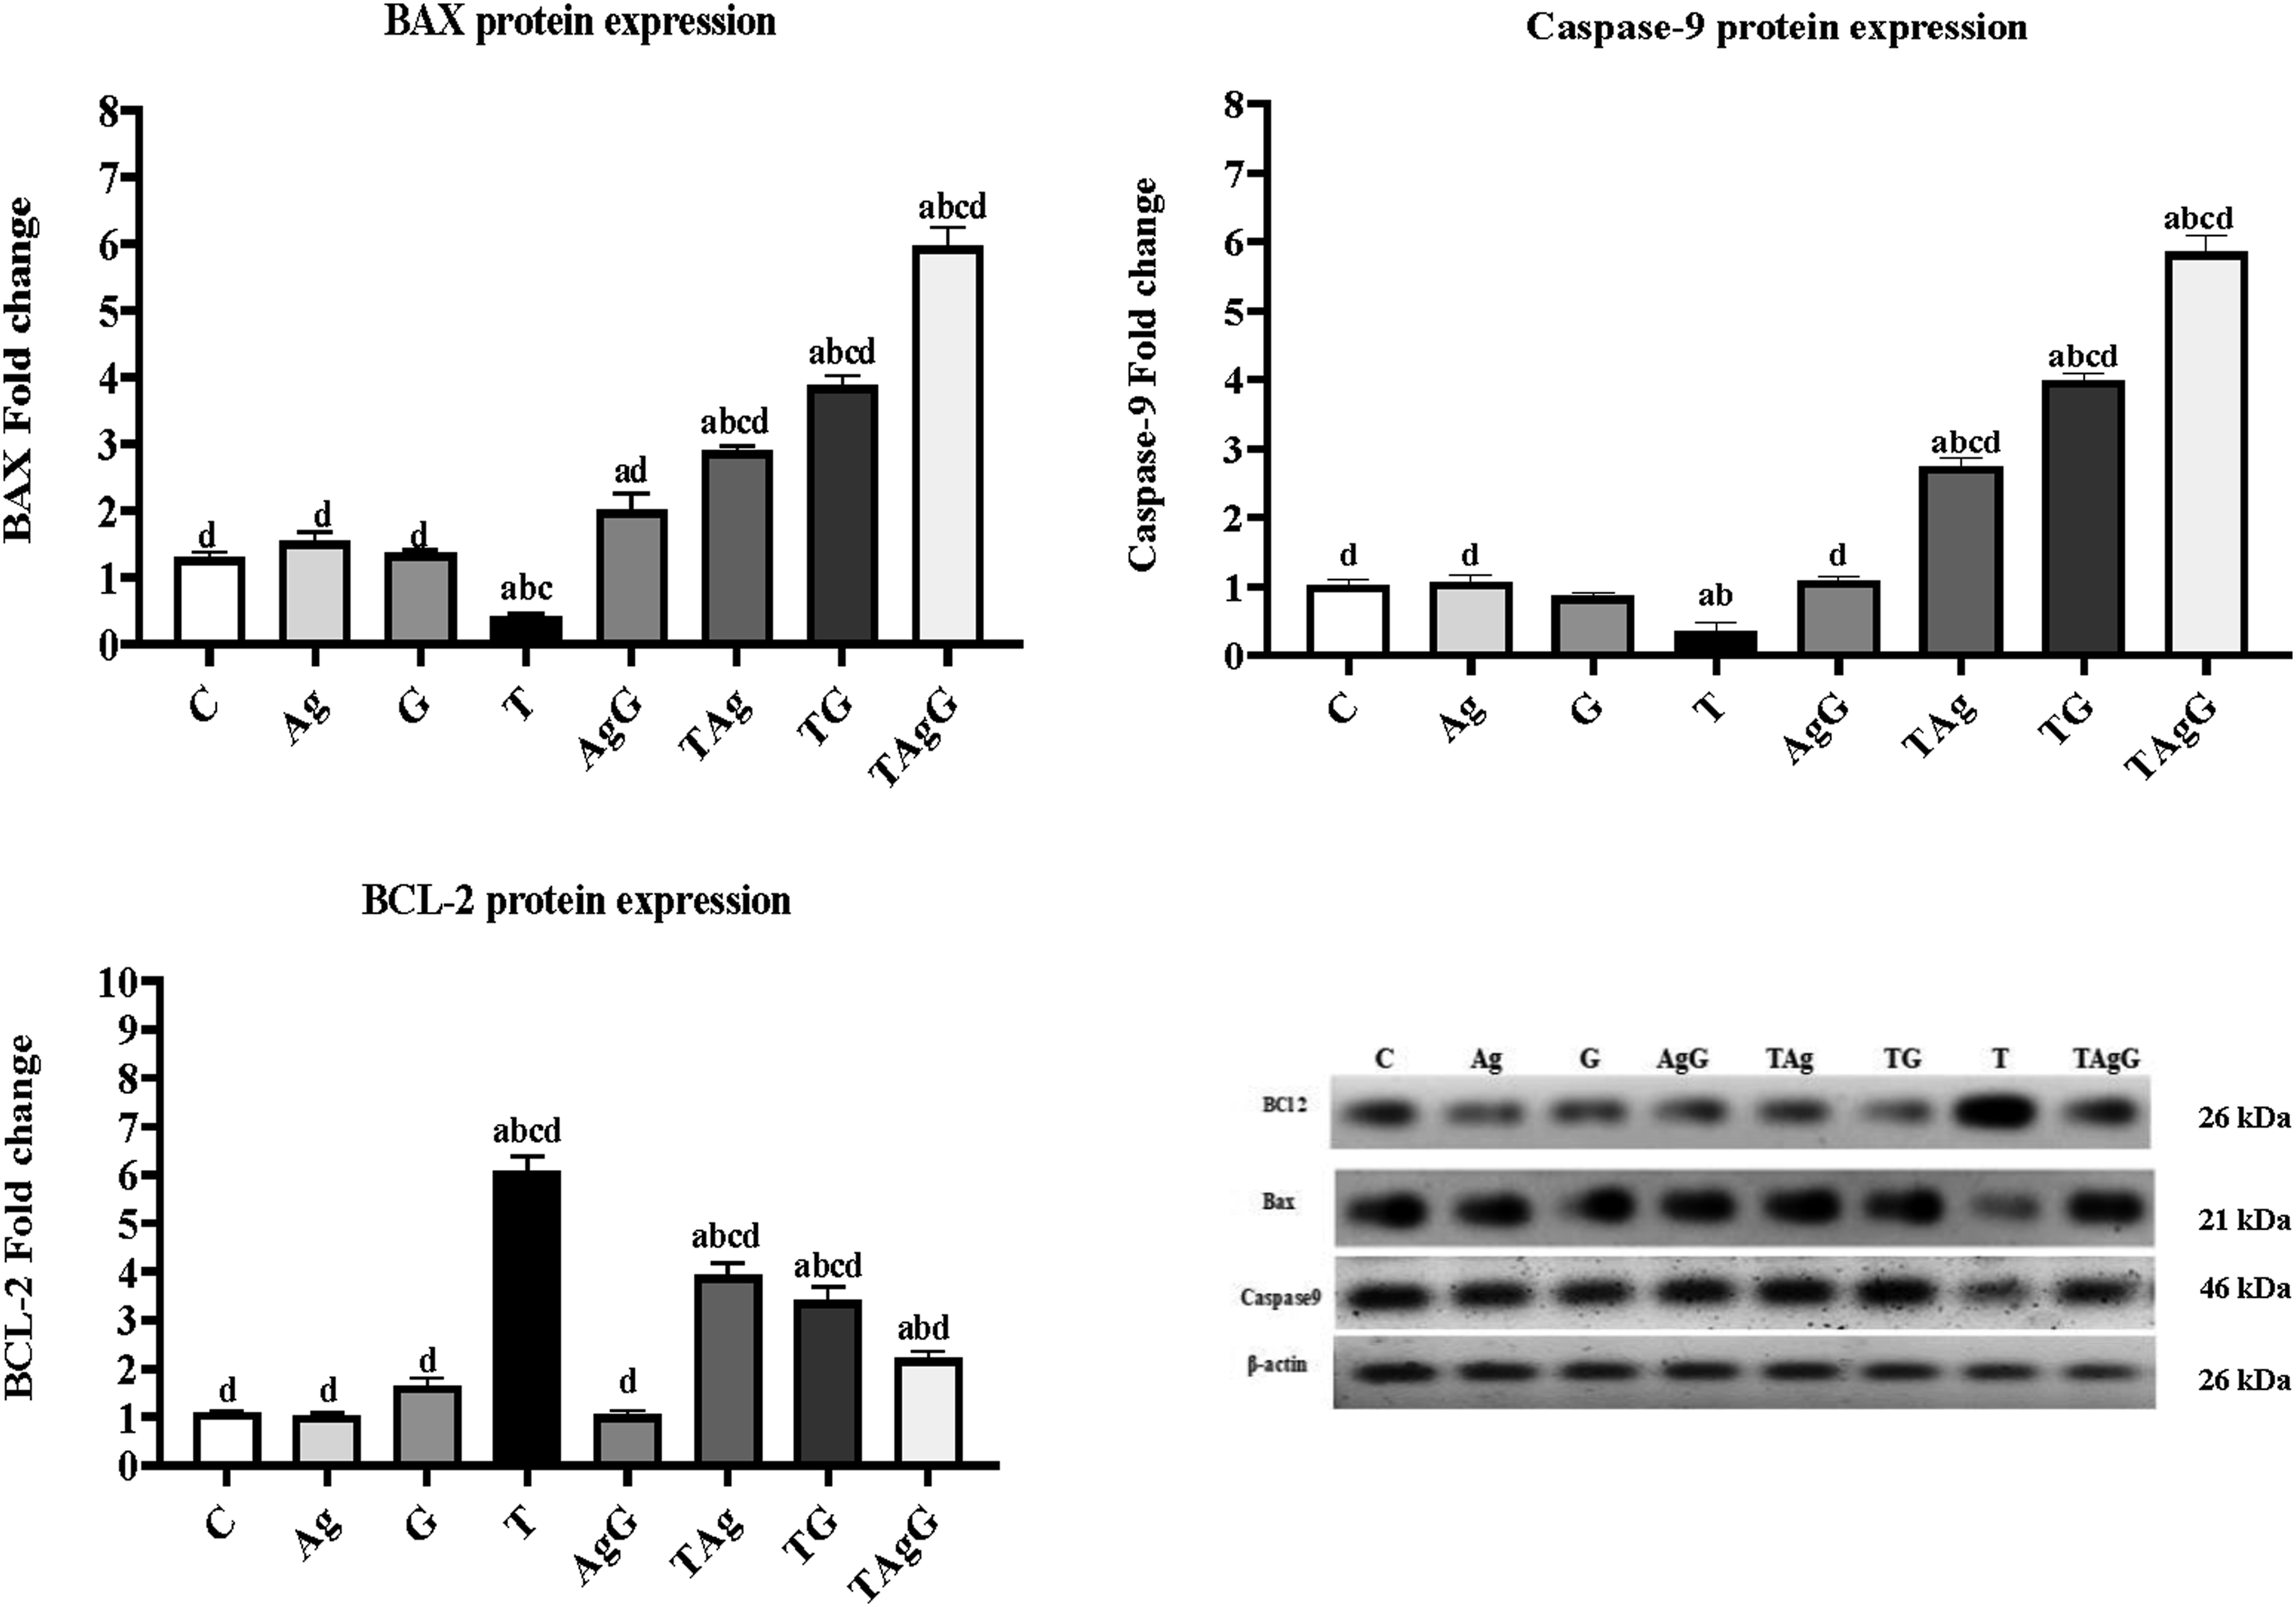
The protein expression of SMAD4 is presented in Figure 11. The expression of the T group was increased significantly (p < .05) (5.4-fold change) compared control group (C). Otherwise, the treatment by AgNPs or Gem alone or together TAgG demonstrated a significant decrease (p < .05) (34%, 45%, and 56.68, respectively) compared to the T group. The protein expression of SMAD 4 in all examined rats. Each value represents mean ± SE (n = 7). Columns over headed with different letters are considered significantly different (p < .05). (a): Different from control, (b): Different from Ag, (c): Different from G; and (d): Different from T.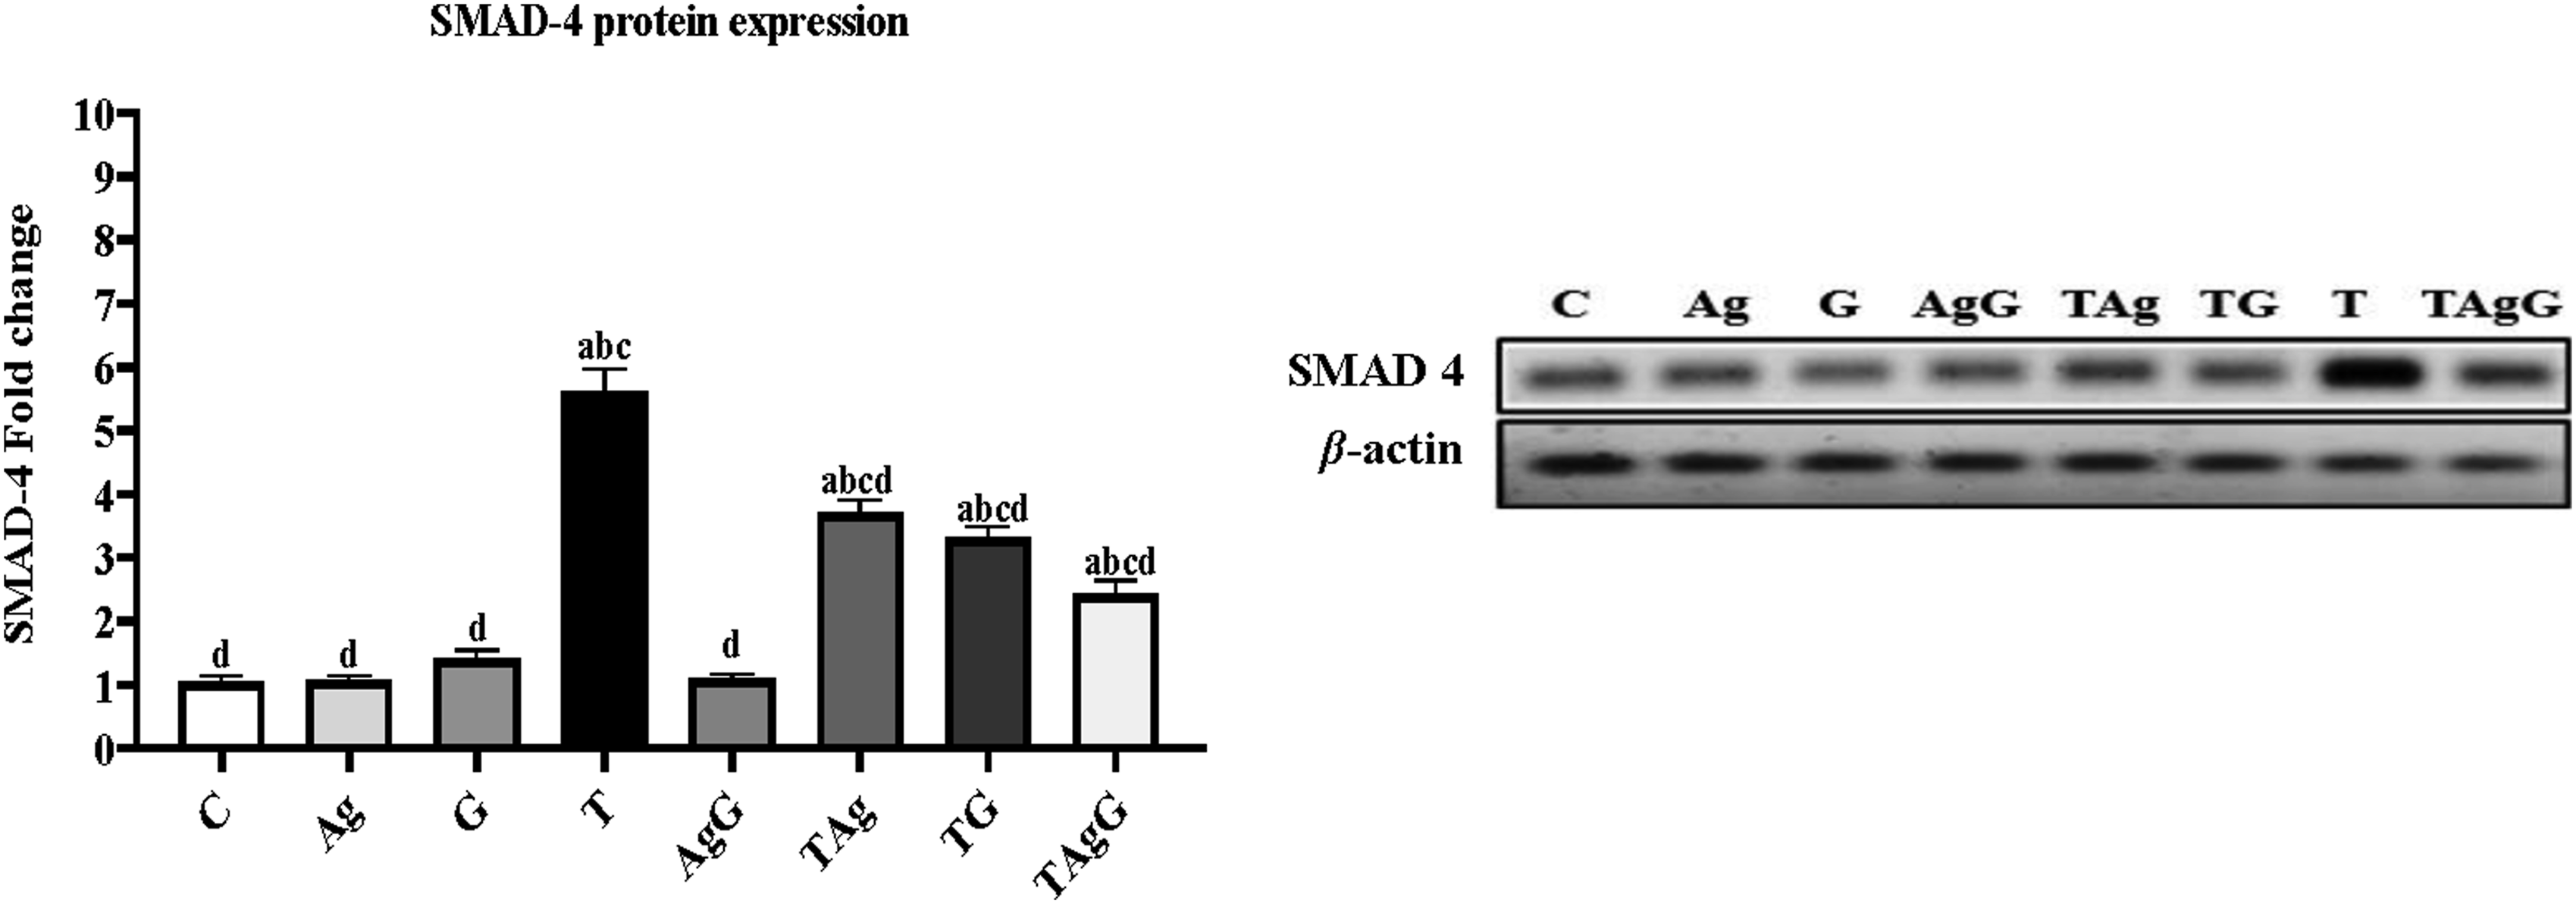
The gene expression of miR-21 in the T was significantly elevated (p < .05) (8.40-fold change) compared to the control. Oppositely, miR-21 expression in TAg, TG, and TAgG groups was potently declined (32.36%, 39.2%, and 62.25%, respectively compared to the T group (Figure 12). The relative gene expression of miR-21 in different examined groups. Each value represents the mean ± SE (n = 7). Columns over headed with different letters are considered significantly different (p < .05). (a): Different from control, (b): Different from Ag, (c): Different from G; and (d): Different from T.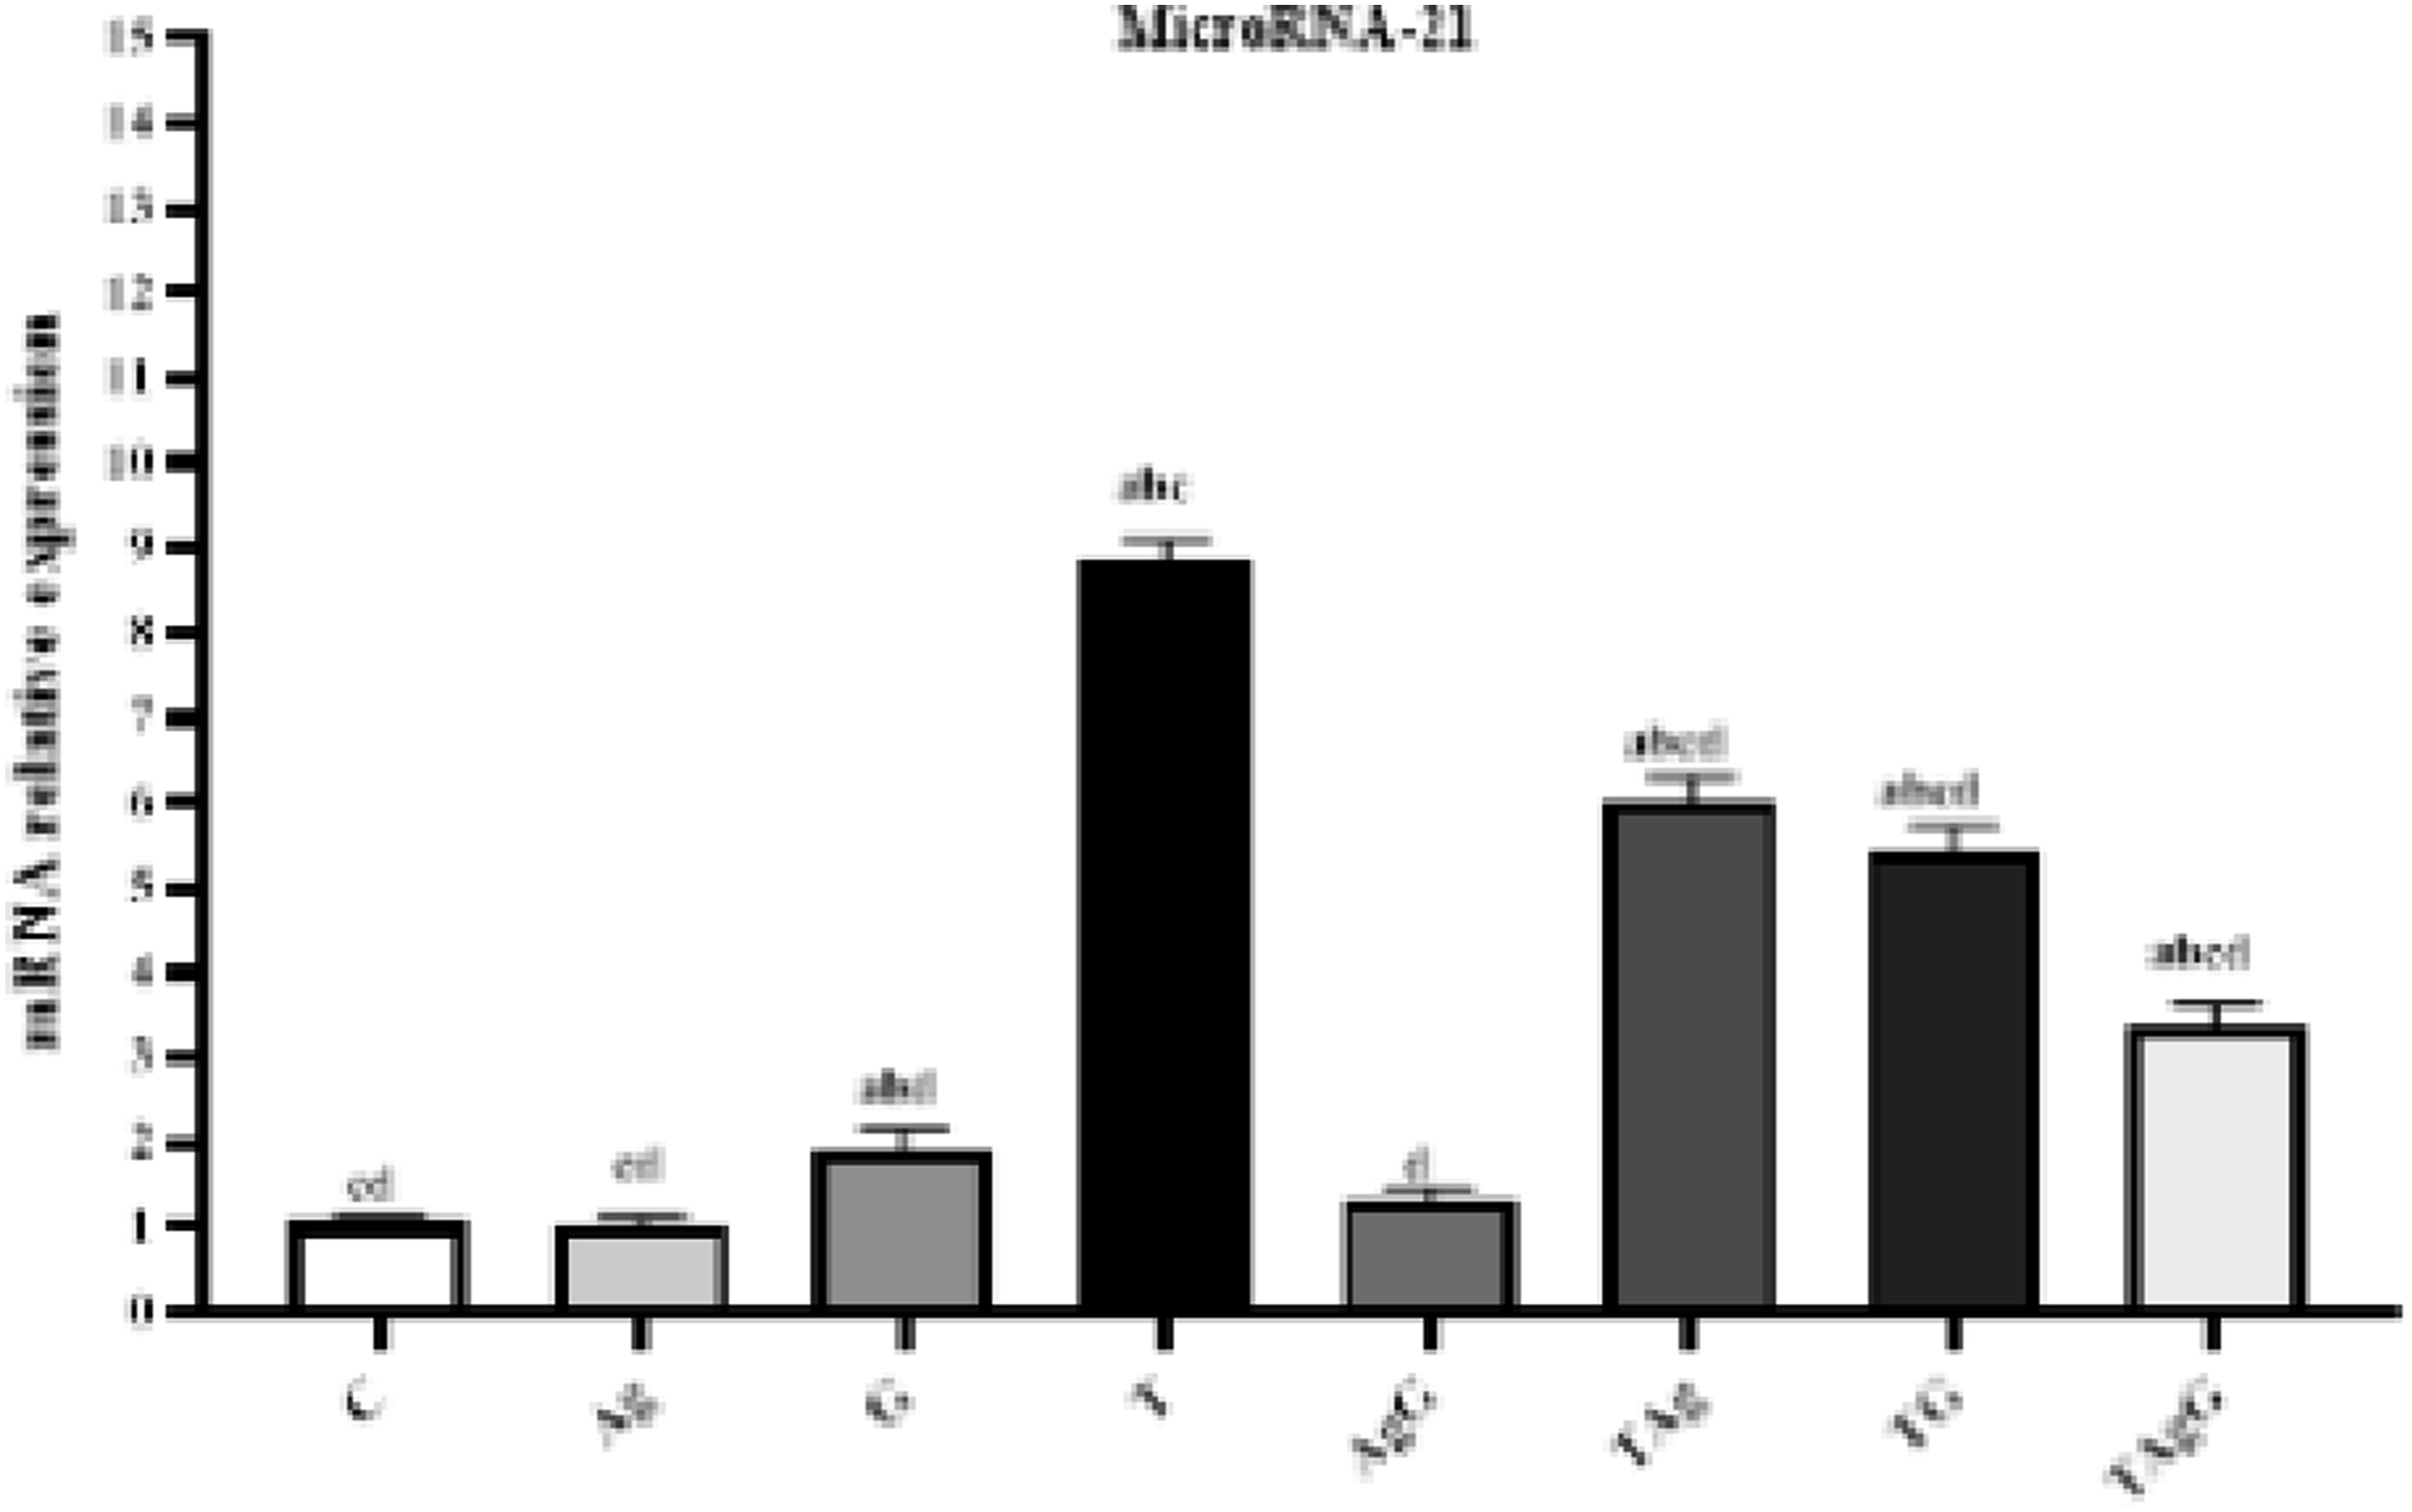
Histopathological study
The normal histological structure of the hepatic tissue is shown in Figure 13. Remarkably, in the control group there is no pathological clues were shown. In rats treated with ANPs, there was no toxicity according to AgNPs treatment that the normal-sized portal tract surrounded by cords of average-sized hepatocytes with no degeneration or necrosis was presented (Figure 13(b)). The liver section of the G group is presented in Figure 13(c) showed central veins enclosed by cords of degenerated hepatocytes, some of them showed patchy necrosis. The combined administration of AgNPs and Gem in the AgG group showed a minor dilated central vein surrounded by cords of slightly degenerated hepatocytes, some showing pyknotic (dark stained small) nuclei and apoptotic bodies (Figure 13(d)). Nevertheless, rats that developed HCC revealed sheets of malignant hepatocytes exhibiting pleomorphism, hyperchromasia, abnormal mitotic figures, and focal areas of necrosis (Figure 13(e)). Additionally, Figure 13(f) presented the liver section of the TAg group showed malignant cells surrounded by 80% of tumor necrosis. In TG group the section of liver showed malignant cells surrounded by 60% of tumor necrosis (Figure 13(g)). But rats treated with AgNPs and Gem showed few residual malignant cells surrounded by 95% of tumor necrosis, illustrated in Figure 13(h). Photomicrograph of liver tissue sections. (a): Normal control liver section.(b): Ag group showed normal sized portal tract (blue arrow) surrounded by cords of average sized hepatocytes with no degeneration or necrosis (red arrow), (c): G group showed central veins (red arrows) surrounded by degenerated hepatocytes, some of them showed spotty necrosis (blue arrows), (d): AgG group showed mild dilated central vein (blue arrow) surrounded by cords of mild degenerated hepatocytes, some showing pyknotic (dark stained small) nuclei (red arrows) and apoptotic bodies (black arrow), (e): HCC group showed sheets of malignant hepatocytes exhibiting pleomorphism, hyperchromatisa and abnormal mitotic figures (blue arrows) and focal areas of necrosis (red arrows), (f) TAg group showed malignant cells (red arrow) surrounded by 80% of tumor necrosis (blue arrow), (g): TG group showed malignant cells (black arrow) surrounded by 60% of tumor necrosis (red arrow), and (h): TAgG group showed few residual malignant cells (blue arrow) surrounded by 95% of tumor necrosis (red arrows).
Discussion
Owing to the unique characteristics of nanoparticles, they may be one of the promising modalities for cancer treatment with traditional chemotherapeutic drugs. Gamma radiation is an eco-friendly method for AgNPs synthesis, compromising plentiful advantages over conventional chemical and photochemical procedures because of its simplicity and efficiency. 41 The radiochemical process was achieved to reduce Ag + ions at ambient temperature without using excessive reducing agents or producing unwanted by-products of the reductant. In addition, the reducing agents were distributed uniformly in the solution, so AgNPs were formed in highly pure and stable forms. 42 The size of nanoparticles is considered a vital factor in their cytotoxicity and cellular uptake.43,44 It affects their interaction with mammalian cells and where NPs accumulated. 45 In the current work, AgNPs exhibited a diameter of 30-50 nm. Many reports documented that decreasing the size leads to an increase in the surface area of the particles, which facilitates the diffusion of the particles into the cell. 46 The polymeric materials coating AgNPs enhance their stability and reduces the Ag + ions dissolution from AgNPs surface. 47 Using different coating materials can affect AgNPs toxicity; Anderson et al. 48 documented that PVP-coated AgNPs directed to the lung get cleared faster than citrate-coated AgNPs, so surface coating has a vital role in the internal clearance and translocation of AgNPs. Therefore, we prepared PVP-coated AgNPs to sidestep any coating-dependent disparity in cellular response.49,50 Fehaid et al. 51 recommended PVP for AgNPs coating in vitro studies because of their higher stability with less aggregation and dissolution changes. Additionally, Pharmacokinetics of AgNPs were documented in previous works.52–54
The efficiency of AgNPs on HCC-induced rats was studied by measuring liver function enzyme (ALT, AST, and ALP) activities; they are indicators of hepatocellular injury. In healthy (control) liver, organ homeostasis happens through cell death and tissue regeneration. Therefore, ALT and AST levels were maintained within a normal range. 55 However, a significant increase in liver enzyme activities was documented regarding HCC development due to hepatocyte injuries, so enzymes are released into the blood circulation. 56 ALT is a more specific biomarker for acute liver injury at its early stages and in some types of cancers, such as HCC. 57 But both enzymes’ activities were decreased after AgNPs treatment (TAg) which may confirm the AgNPs role in the probable regeneration of hepatocytes and possible healing of the hepatic parenchyma. 58 The comparative cytotoxic study was carried out by MTT assay to evaluate the cytotoxic effect of gemcitabine, doxorubicin, and cyclophosphamide drugs on Wi38 and HepG2 cell lines. The results documented the dose-dependent inhibitory ability of GEM against HepG2 cells more than cyclophosphamide and less toxic on the normal Wi38 cells. Apoptosis is the first guard against cancer progression. 59
Furthermore, much research defined the disturbance of apoptotic mechanisms during cancer development.60,61 Annexin V is a protein that can detect the presence of phosphatidylserine (PS) on the outer surface of the cell membrane during apoptosis. On the other hand, propidium iodide (PI) can identify the loss of integrity of the nucleus, which is a characteristic of necrosis. Therefore, the Annexin V/PI technique can be effectively used to distinguish between apoptosis and necrosis.62,63 Annexin-V results showed a value of (63.6 ± 0.32) in the lymphocytes of HCC-developed rats(T)due to the capability of cancer cells to alter the levels of proteins associated with lymphocyte function, including apoptosis.64,65 The amount of apoptosis in the T group was approximately 1.5 times of rats treated with AgNPs (TAg) (43.5 ± 0.46). Farahani et al. 66 stated the ability of AgNPs to induce apoptosis in cancerous cell lines with low toxicity on normal liver cells and the lymphocytes. Mahjoub et al. 67 showed that AgNPs administration did not cause changes in the WBC formula, but it can induce which activation in murine lymphocytes after a few hours of exposure to AgNPs. 68 In addition, in the group treated with GEM, the apoptosis was markedly decreased (50.07 ± 0.32) regarding the T group. Furthermore, the combination of AgNPs and GEM exhibited a more pronounced effect on lymphocyte apoptosis (35.68 ± 0.58) as the co-treatment improves therapeutic efficiency that may be due to the ability of AgNPs and GEM to generate oxygen free radicals that cause substantial DNA damage, subsequently induce apoptosis. 69
Besides, our investigation exhibits the mechanism understood that AgNPs mediated extrinsic and intrinsic apoptotic cell death. The proteins of apoptotic factors Bax, Caspase9, and the anti-apoptotic Bcl2 were isolated, and their expression levels were determined, as illustrated in Figure 10. The displayed results revealed that Bcl-2 expression was suppressed and Bax expression was up-regulated in rats treated with AgNPs compared to the control group. It has been proven that the boosted expression of Bax represents the main effector of the intrinsic pathway responsible for the induction of mitochondrial modifications that leads to cyt c and caspase −9 induction. 69 Kanipandian et al. 70 proved that the decreased Bcl2 level indicates that AgNPs effectively interfere with the intrinsic apoptotic activity by preventing the anti-apoptotic gene expression. Remarkably, it was demonstrated that the up-regulation of caspase 9 provokes caspase −3 levels in AgNPs treated cells. 70 Ahmadian et al. 71 demonstrated that AgNPs induce Bax gene expression and decrease Bcl2 expression. Rakowski et al., 72 reported that depending on the size surface modification, and shape of AgNPs can induce cytotoxicity, 73 mitochondrial dysfunction, and oxidative stress also enhance apoptosis. Moreover, in this study, GEM enhanced apoptosis by up-regulation of Bax and caspase9 and downregulation of Bcl2 protein expression; this data is compatible with Yuan et al. 7 documented that GEM single treatment can induce DNA fragmentation, also Teng et al. 71 documented that GEM not only inhibits cell proliferation and angiogenesis in tumor cells but also induces apoptosis. Zhu et al. 74 verified that GEM induces apoptosis in pancreatic cell lines by inhibiting Bcl2. Moreover, many previous studies demonstrate that GEM induced apoptosis by improving Bax and decreasing Bcl2 expression in breast cancer cells 75 and gall bladder cancer cells. 76
Further, cytochrome P450 (CYP) is an enzyme family that plays vital roles in the endogenous and exogenous metabolism of many molecules.
77
They are the main enzymes incorporated in cancer development. The present results showed that AgNPs effectively decrease the elevation of CYP2E1 that increased in the HCC group activated by DEN. It was reported that CYP enzymes mediate the metabolic activation of many procarcinogens.
77
They can hydrolyze diethylnitroseamine in the liver into active metabolites.
78
Kang et al.
78
proved that CYP2E1 is the key diethylnitroseamine-activating P450 responsible for diethylnitroseamine-induced hepatocarcinogenesis. Also, Munger et al.
79
stated the impact of nanoparticle size on cytochrome P450 enzymes
Conclusion
In the current work, we use γ –irradiation as an eco-friendly method in silver nanoparticle preparation. The size and quality of prepared silver nanoparticles were proved by different techniques (EDX, TEM, UV, XRD). It could be suggested that AgNPs can diminish the challenges of using Gemcitabine in HCC treatment via enhancing the intrinsic and extrinsic apoptotic pathways as well as suppression of SMAD4 and miR-21 expression. Finally, this work highlighted that using AgNPs as a co-treatment with chemotherapeutics such as GEM accomplished of providing greater therapeutic effects than single-method treatment which is an advanced therapeutic strategy. 97
Footnotes
Acknowledgements
We acknowledged the pre-print of our manuscript available at: https://www.researchsquare.com/article/rs-3068693/v1.pdf- ![]() .
.
Author contributions
“All authors contributed to the study conception and design. Material preparation, data collection and analysis were performed by [Mahmoud Mohamed Refaat], [Asmaa Abukar Hassan] and [Amany Ismael Raafat]. The first draft of the manuscript was written by [Soheir Abdelazem Osman] [Shadia A Fathy] and [Mohamed Ragaa Mohamed] and all authors commented on previous versions of the manuscript. All authors read and approved the final manuscript.”
Declaration of conflicting interests
The author(s) declared no potential conflicts of interest with respect to the research, authorship, and/or publication of this article.
Funding
The author(s) received no financial support for the research, authorship, and/or publication of this article.
Ethical statement
Animal welfare
The present study followed international, national, and/or institutional guidelines for humane animal treatment and complied with relevant legislation from the National Center for Radiation Research and Technology (NCCRT)-Egyptian Atomic Energy Authority.
Data availability statement
The datasets generated during and/or analyzed during the current study are available from the corresponding author upon reasonable request.