
Abstract
Objective
Our research aims to assess the influence of erastin, a ferroptosis-inducing agent, on cervical cancer cells.
Introduction
Cervical cancer is a prevalent malignancy in females. Dysregulation of ferroptosis, a form of cell demise reliant on iron, is implicated in several cancers.
Methods
The effect of erastin on HeLa and SiHa was detected by transwell assay, scratch test, and colony formation assay, while cell apoptosis was detected using flow cytometry. Cellular reactive oxygen species (ROS) generation was detected using the dichloro-dihydro-fluorescein diacetate assay. Sequencing analysis identified differentially expressed genes (DEGs), and Gene Ontology (GO) and Kyoto Encyclopedia of Genes and Genomes (KEGG) Enrichment analyses were employed to identify the target gene. Subsequently, the utilization of small interfering RNA (siRNA) was employed to suppress the targeted gene expression in HeLa cells, thereby effectively mitigating the impact of erastin on various cellular processes including invasion, colony formation, migration, and ROS generation.
Results
The findings indicate that erastin attenuates the viability of both HeLa cells (IC50 = 30.88 µM) and SiHa cells (IC50 = 29.40 µM). Treatment with erastin at 10 µM inhibits the invasion, colony formation, and migration of both HeLa and SiHa cells within 24 h. Ferrostatin-1 (1 µM) notably alleviates the inhibitory effects of erastin of HeLa and SiHa cells. Upregulation of nuclear factor erythroid 2-related factor 2 (Nrf2) and its downstream target, heme oxygenase-1 (HO-1), was found in erastin-treated cells compared to the control group. When knocked down HO-1 in HeLa cells, effectively counteracting the effects of erastin on the invasion, colony formation, migration, and ROS production in HeLa cells.
Conclusion
Our research demonstrates that erastin induces ferroptosis and the accumulation of ROS in cervical cancer cells by activating the Nrf2/HO-1 pathway, significantly reducing cell proliferation and motility. These findings propose a potential molecular mechanism of erastin-mediated cervical cancer development.
Introduction
Cervical cancer is a frequent female reproductive system-associated cancer, with more than 600,000 new diagnoses and 340,000 deaths annually worldwide. 1 Infection with human papillomavirus (HPV) is a key event in the neoplastic progression of cervical lesions, while human immunodeficiency virus (HIV) infection, sexually transmitted infection, smoking, and oral contraceptive may also be relevant. 2 The progression from cervical intraepithelial neoplasia (CIN) to invasive carcinoma is regulated by genes involved in mitogenesis, cell proliferation, DNA repair, angiogenesis, and apoptosis. 3 However, the pathogenic mechanisms of cervical cancer development are not entirely understood.
Ferroptosis is an iron-dependent process of cellular death that is regulated and featured by excessive intracellular lipid peroxides, iron, and mitochondrial reactive oxygen species (ROS) accumulation. 4 Moreover, ferroptosis dysregulation induces chemotherapy resistance and treatment failure. 5 Thus, targeting the ferroptosis process has a therapeutic effect on various human cancers, such as pancreatic, breast, and hepatic. 6 A recent study reported that oleanolic acid suppressed cervical cancer cell proliferation by activating ferroptosis, suggesting that ferroptosis may be used as a therapeutic target in cancer treatment. 7
Erastin is an inducer of ferroptosis by inhibiting cystine-glutamate transport receptor and thereby glutathione synthesis. 8 Erastin-induced ferroptosis is observed in various human cancer cells, such as lung cancer and fibrosarcoma cells. 9 A previous study indicated that erastin enhanced the death of cervical cancer cells induced by X-rays. 10 However, the molecular mechanism and signaling pathways involved remain unclear. The nuclear factor erythroid 2-related factor 2 (Nrf2) and its downstream target heme oxygenase-1 (HO-1) play essential roles in ferroptosis in neurodegenerative diseases. 11 However, whether the Nrf2/HO-1 pathway is involved in ferroptosis during cervical cancer development awaits investigation.
Our study examined the impact of erastin on cervical cancer cells. It also investigated whether erastin mediated cervical cancer by inducing ferroptosis and the signaling pathways involved in erastin-mediated cancer progression.
Materials and methods
Cell line and treatments
DMEM (Gibco, Germany, cat no. 11965092) containing 0.1 mg/mL streptomycin (Solarbio, China, cat no. P1400), 10% fetal bovine serum (Gibco), and 100 U/mL penicillin (Solarbio, China, cat no. P1400) was used for the cultivation of HeLa cells. MEM (Gibco, Germany, cat no. C11095500BT) supplemented with 10% fetal bovine serum, 1 × non-essential amino acids (CELLCOOK, cat no. CM1008S/L), 0.1 mg/mL streptomycin (Solarbio, China, cat no. P1400), and 100 U/mL penicillin (Solarbio, China, cat no. P1400) was used for the culture of SiHa cells (Kinlogix Biotech, Guangzhou, Ltd., China). Logarithmic growth phase cells were utilized, and all the culturing was carried out in a humidified environment with 5% CO2 at 37°C.
Ferrostatin-1 (1 mg) (MedChemExpress, China, cat no. HY-100579) was dissolved in 0.3812 mL of DMSO (Sigma-Aldrich, USA, cat no. 67685), with the assistance of sonication, yielding a 10 mM masterbatch of Ferrostatin-1. Subsequently, the masterbatch was diluted with culture medium to a final concentration of 10 μM for experiments. Erastin (1 mg) (MedChemExpress, China, cat no. HY-15763) was dissolved in 0.1828 mL DMSO using ultrasound-assisted solubilization, yielding a 10 mM masterbatch of Erastin. Then, the masterbatch was diluted with culture medium to a final concentration of 10 μM for experiments. Cells were proliferated in erastin (10 µM), ferrostatin-1 (1 µM, a ferroptosis inhibitor) plus erastin (10 µM), or an equal volume of DMSO (NC group) for 24 h.
Small interfering RNAs (siRNAs) targeting the HO-1 gene (si-HO-1) and scramble siRNA (si-NC) were procured from GenePharma (China). The si-HO-1 and si-NC sequences are as follows: HO-1-siRNA1–799: sense 5’-AGAAUCUUGCACUUUGUUGCU-3’, antisense 5’- CAACAAAGUGCAAGAUUCUGC-3’. HO-1-siRNA2–1355: sense 5’- ACAAAAAUAAGACAAAAACAC-3’, antisense 5- GUUUUUGUCUUAUUUUUGUUG-3’. HO-1-siRNA3–1418 sense 5’-AAAAACAACAGAACACAACAA-3’, antisense 5’- GUUGUGUUCUGUUGUUUUUAU-3’. si-NC: sense 5'- UUCUCCGAACGUGUCACGUTT-3', antisense 5'- ACHUGACACGUUCGGAGAATT-3'.
After purification and quantification, distilled water was used for siRNA dilution for preparing the 0.5 μg/μL final solution. Cells were delivered with designated siRNA (100 nmol/L) via Lipofectamine 3000 (Thermo Fisher, USA) for 48 h, and HO-1 mRNA expression was evaluated by quantitative real-time PCR (qRT-PCR). The most effective siRNA was used for subsequent experiments.
CCK-8 assay
HeLa and SiHa cells were incubated with increasing doses of erastin (1–50 µM) and assessed for viability after 24 h of treatment using the CCK-8 assay (APE × BIO, USA, cat no. K1018). Cells in the logarithmic growth phase were rinsed once with phosphate-buffered saline (PBS), digested into a single-cell suspension using 0.25% trypsin, and resuspended in complete medium. Then, cells were inoculated into 96-well plates (100 µL, 3 × 10³ cells per well) and incubated with different doses of erastin. After 24 h of culture with erastin, 10 µL of CCK-8 reagent was added to cells and incubated at 37°C for 4 h. The optical density was measured at 450 or 490 nm by using a spectrophotometer (Varioskan LUX, Thermo Fisher). The inhibition percentage was calculated using the following formula: Inhibition (%) = (ODcontrol − ODsample)/ODcontrol × 100%. The IC50 value (half-maximal inhibitory concentration) of erastin was also estimated. This experiment was repeated three times.
Assessment of cellular reactive oxygen species generation
Cellular ROS generation was assessed using the dichloro-dihydro-fluorescein diacetate assay (DCFH-DA; Meilunbio, China, cat no. 4091990). Cells proliferated in 6-well plates (2 × 10⁵ cells per well) were incubated with erastin. After thoroughly rinsing twice with PBS in a light-proof environment, cells were marked with DCFH-DA (20 µM) for 30 min at 37°C. The fluorescence strength of dichlorofluorescein was measured using SpectraMax iD3 (BD Biosciences, USA).
Flow cytometry
Cell apoptosis after erastin treatment was determined using the Annexin V-FITC/PI Apoptosis Detection Kit (Sigma-Aldrich, USA, cat no. 40302). Cells were plated in 6-well plates (5 × 10⁵/well) and exposed to erastin (10 µM) and ferrostatin-1 (1 µM) for 24 h. Subsequently, the cells were harvested and re-suspended in the binding buffer (195 µL) and treated for 20 min at room temperature in a light-free environment with Annexin V-FITC (5 µL) and working solution of propidium iodide (10 µL). Cellular apoptosis was assessed using flow cytometry (FACSCalibur, BD Biosciences).
Clonogenic assay
Cells cultivated in 6-well plates (500 cells/well) were augmented with 1 μM ferrostatin-1 and 10 μM erastin for 24 h. Crystal violet (Solarbio, China, cat no. G1064) was dissolved in 100% methanol and diluted in PBS at a ratio of 1:10. Next, 1% crystal violet staining of colonies was carried out for half an hour, followed by three washes with PBS. To estimate the number of colonies formed, the optical density at 540 nm was assessed via a spectrophotometer.
Scratch assay
Cells in the concentration of 5 × 10⁵ per well were cultivated in 6-well plates until adherence, followed by scratching the cells’ monolayer with a sterilized P200 pipette tip (width: 500 µm). Then, cells were supplemented with 1 μM ferrostatin-1 and 10 µM erastin for 24 h and washed with PBS. After 72 h, the scratch was photographed by microscopy (Canon, Japan) and quantified using the Image J software.
Ribonucleic Acid sequencing
Total RNA was extracted using TRIzol solution (Invitrogen, USA, cat no. 15596-026), and 1% agarose gel was utilized to detect RNA degradation and contamination. The RNA sample purity was examined using a NanoPhotometer (Implen, USA), and its integrity was determined by NanoDrop 2000 with the RNA 6000 Nano Assay Kit (Thermo Fisher, USA, cat no. 5067-1511). For preparing the RNA sample, 3 µg RNA sample was utilized. The transcriptome library was prepared using the Illumina TruSeq RNA Sample Preparation Kit (Illumina, USA, cat no. RS-122-2001), sequenced on a HiSeq 2000 platform (Illumina) after clustering, and paired-end reads (100 bp) were generated.
Differentially expressed genes (DEGs)
The transcript expression was assessed using the kb per million reads protocol. Total reads mapped per transcript were counted by HTSeq (version 0.5.3), and edgeR, a Bioconductor software package, was used to complete the read count. The R package DEGseq (version 1.12.0) was used to identify DEGs. A |log2(Erastin/MOCK) | > 1 and a p-value of 0.05 were used as the DEG threshold.
Gene Ontology and Kyoto Encyclopedia of Genes and Genomes enrichment analyses
InterProScan and BLASTX against the NCBI database were used to perform protein annotations. The obtained information was converted into Gene Ontology (GO) annotations and mapped to GO slims. The statistical significance of functional GO slim enrichment was determined by Fisher’s exact test within Blast2GO (false discovery rate <0.001). The hypergeometric test and Benjamini–Hochberg false discovery rate correction 12 were used to identify significantly enriched Kyoto Encyclopedia of Genes and Genomes (KEGG) pathways using KOBAS (version 2.0).13-15
Transwell assay
Cells’ migration ability was assessed using 24-well Transwell inserts (pore size: 8-µm; Corning Incorporated, USA). In brief, the plate’s lower chamber was perfused with RPMI-1640 (750 µL) supplemented with 10% fetal bovine serum. In a serum-free culture media (200 µL), 2 × 10⁴ cells were re-suspended and then cultured in the upper plate chamber. After 24 h incubation with 1 µM ferrostatin-1 and 10 µM erastin at 37°C, 4% paraformaldehyde was utilized for the fixation of the migrated cells, which were then subjected to crystal violet (1%) staining. Microscopic images were acquired, and migrated cells were quantified.
Quantitative real-time PCR
The total RNA was extracted using TRIzol solution and then subjected to reverse transcription. qRT-PCR was performed on the A100 PCR system using SYBR GreenER qPCR SuperMix Universal. The primer’s sequences are mentioned below: HO-1 F: 5′-5′-AAGACTGCGTTCCTGCTC AAC-3′, HO-1 R: 5′-AAAGCCCTACAGCAACTGTCG-3′; Nrf2 F: 5′-CACATCCAGTCAGAAACCAGTGG-3′, Nrf2 R: 5′-GGAATGTCTGCGCCAAAAGCTG-3′.
Western blotting
Cells were harvested and lysed for half an hour on ice using RIPA buffer (Meilunbio, China, cat no. MA0152). For SDS-PAGE gel electrophoresis, an equal volume of cell lysates was loaded and separated on the gel and then transferred to the PVDF membranes. The membranes were then blocked with 5% non-fat dry milk at room temperature for 60 min and probed with antibodies against pAMPK, AMPK, PPAR-α, PPAR-γ (Cell Signaling Technology, USA), HO-1, Nrf2, and GAPDH (Abcam, USA) overnight at 4°C. Next, the horseradish peroxidase-conjugated secondary antibody was incubated with the membrane for 60 min. The targeted bands were detected using an enhanced chemiluminescence system. The results were expressed as the ratio of the target protein to GAPDH and then normalized to the values measured in the control groups, which were presented as 1.
Statistical analysis
The SPSS25.0 statistical software was applied to analyze the data. The data were expressed as mean ± standard deviation, and p < .05 depicted statistical significance. *p < .05, **p < .005, ***p < .001, and ****p < .0001.
Results
Erastin suppresses cervical cancer cell growth
HeLa cells and SiHa cells were augmented with various erastin doses for 24 h to evaluate their cytotoxicity in the cervical cancer cells. The CCK-8 assay revealed that erastin markedly suppressed the viability of both HeLa cells (IC50 = 30.88 µM; Figure 1(a)) and SiHa cells (IC50 = 29.40 µM; Figure 1(b)) relative to DMSO-treated controls in a dose-dependent fashion. Viability of cervical cancer cells treated with various concentrations of erastin. (a) HeLa cells (IC50 = 30.88 µM). (b) SiHa cells (IC50 = 29.40 µM).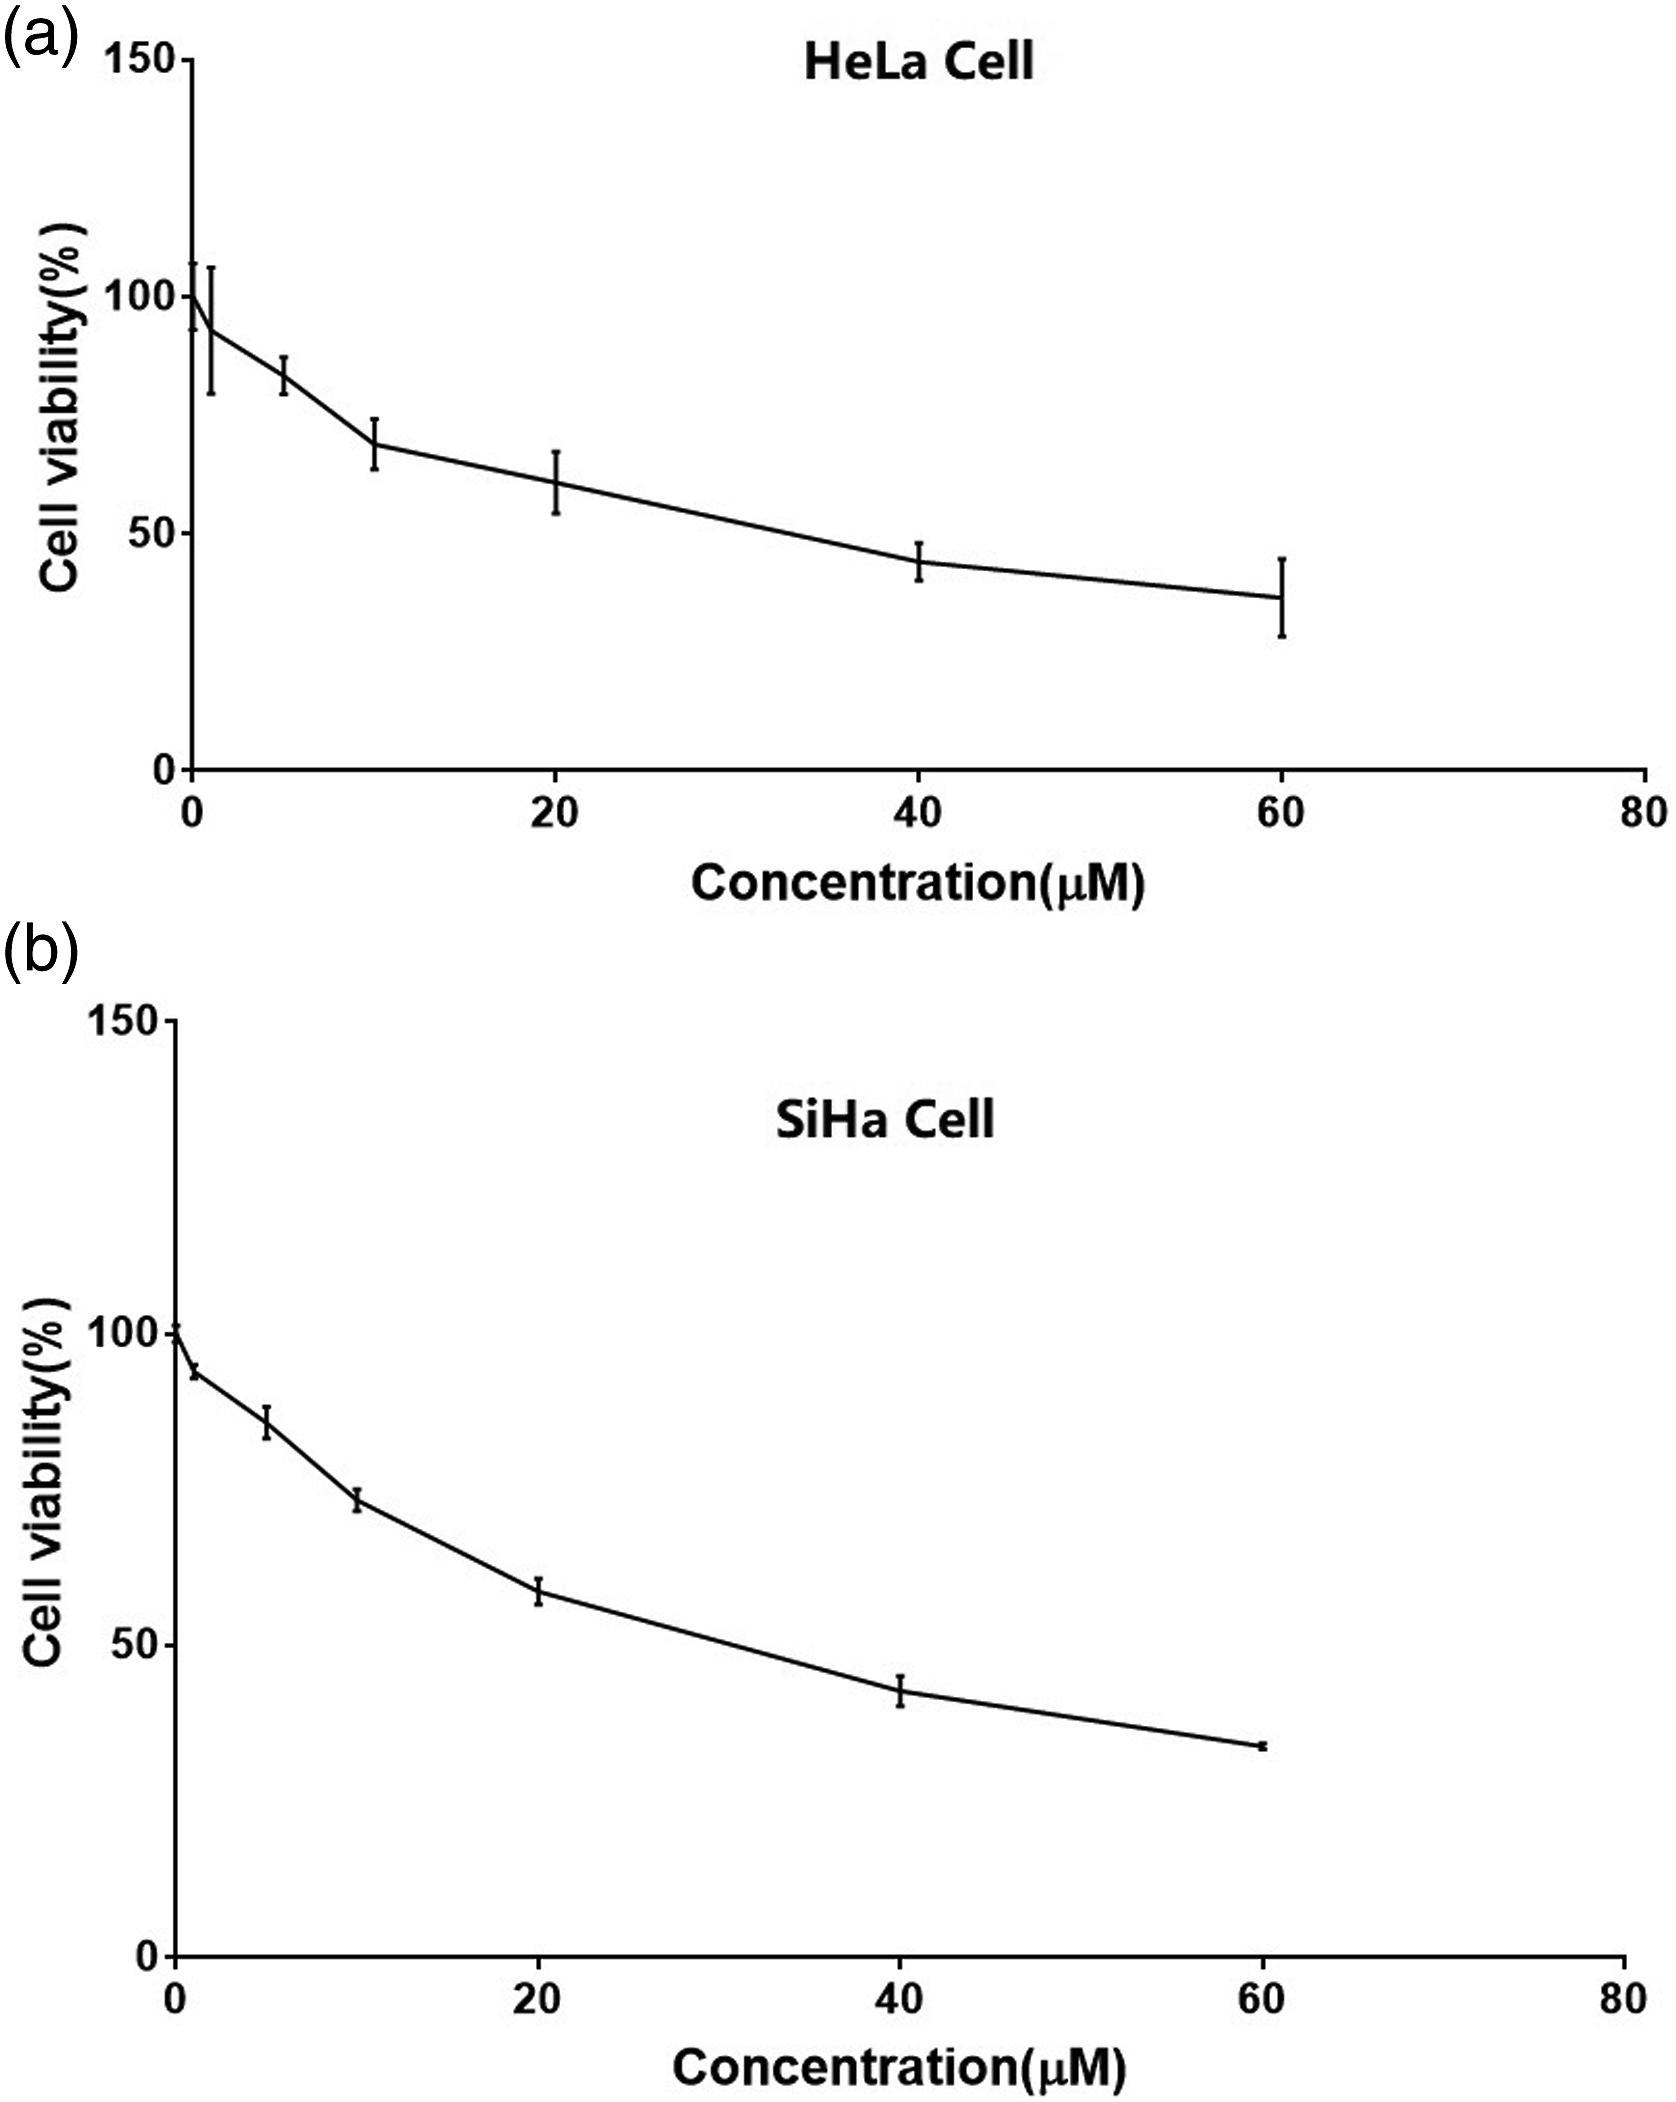
Erastin inhibits colony formation and migration/invasion of cervical cancer cells via ferroptosis
Next, the effects of erastin on cervical cancer cells’ capability to form a colony were assessed. The clonogenic assay demonstrated that erastin at 10 µM markedly decreased the number of colonies formed by cells after 24 h of treatment, while ferrostatin-1 (1 µM, 24 h) restored their colony-forming capacity after 24 h of incubation (Figure 2(a) and (b)). Moreover, the scratch and Transwell migration assays revealed that the wound healing and invasive capacities of cells were greatly inhibited by Erastin (10 µM, 24 h) but could be restored by the presence of ferrostatin-1 (1 µM, 24 h) (Figure 2(c)–(f)). Erastin affects the colony-forming ability and migration/invasion of HeLa and SiHa cells via ferroptosis. HeLa and SiHa cells were augmented with DMSO (NC group), erastin (10 µM), or erastin (10 µM) plus ferrostatin-1 (1 µM) for 24 h. (a), (b) Representative images of cell colonies after 24 h of treatment. The bar chart shows fold change relative to the control group. (c), (d) Scratch analysis was conducted to evaluate the invasive capability of HeLa and SiHa cells, and representative images (40× magnification) are shown. The bar chart shows the relative migration distance. (e), (f) A Transwell assay was carried out to evaluate the invasive ability of HeLa and SiHa cells. Representative images (200× magnification) are shown. The bar chart shows the relative invasive rate. (g), (h) Total cellular ROS generation after treatment was measured by DCFH-DA. Representative images (200× magnification) are shown. (i), (j) HeLa and SiHa cell apoptosis after treatment was assessed by flow cytometry. Representative images and quantitative analysis are shown.
The role of ROS in erastin-induced ferroptosis was explored further. ROS production by cervical cancer cells was detected after treatment with 1 µM ferrostatin-1 (24 h) and 10 µM erastin (24 h). The results revealed that ROS production was triggered by erastin but inhibited by ferrostatin-1 (Figure 2(g) and (h)).
HeLa and SiHa cells’ apoptosis subjected to erastin (10 µM, 24 h) and ferrostatin-1 (1 µM, 24 h) treatment was assessed by cell cytometry (Figure 2(i) and (j)), which showed that the apoptosis was induced by erastin but inhibited by ferrostatin-1.
Evaluation of transcriptome sequencing data, functional annotation, and classification
HeLa cells were treated with 10 µM erastin for 24 h, and then the transcriptome was identified using RNA-sequencing analysis to investigate the mechanism by which erastin induced ferroptosis in cells. The DEGs were identified in the Erastin group versus the MOCK group (Figure 3(a)–(c)). The functional annotation and classification were carried out further by comparing the sequences with GO and KEGG databases. Genes annotated by the GO database were classified into molecular function, biological progress, and cellular component, and the top 20 level 2 GO terms (p < .05) are listed in Figure 3(d). The KEGG analysis identified the top 20 s-category KEGG pathways (p < .05), such as the AMPK and PARP signaling pathways (Figure 3(e)). Evaluation of transcriptome sequencing data, functional annotation, and classification. (a) Scatter plot of differential expression. The x-axis represents the MOCK group, while the y-axis represents the Erastin group. P < .001 is considered statistical significant. Red dots, upregulated genes; green dots, downregulated genes. (b) Volcano plot of global DEGs in different groups, Erastin versus MOCK. The x-axis is the log2 scale of the fold change of gene expression in Erastin and MOCK groups (log2 (fold change)). Negative values indicate downregulation; positive values indicate upregulation. The y-axis is the minus log10 scale of the adjusted p-values (–log10), which indicate the significant level of expression difference. Red dots (Up) depict markedly upregulated genes (p < .05, fold change >2); blue dots (Down) depict markedly downregulated genes (p < .05, fold change >2); gray dots represent DEGs insignificantly. (c) GO enrichment analysis of DEGs, erastin versus MOCK. In the heat map of the DEGs between the Erastin and MOCK groups, red stripes represent high expression genes, while blue stripes represent low expression genes. (d) Significant enriched GO terms between the Erastin and MOCK groups. Blue columns represent the top 20 molecular function terms in the enrichment analysis; green columns represent the top 20 cellular component terms in the enrichment analysis; red columns represent the top 20 biological process terms in the enrichment analysis. (e) The top 20 enriched KEGG pathway terms of DEGs between the Erastin and MOCK groups. The y-axis represents pathway names, and the x-axis indicates enrichment factors.
Identification and validation of genes related to signaling pathways
The majority of the DEGs in the Erastin group versus the MOCK group were related to the AMPK, PARP, and ferroptosis signaling pathways. qRT-PCR and Western blotting were used to validate RNA sequencing data. A total of 11 genes were selected for validation: five related to the AMPK pathway (EIF4EBP1, HNF4A, LIPE-AS1, PCK2, and PFKFB4) (Figure 4(a)), two to the PPAR pathway (SLC27A6 and SORBS1) (Figure 4(b)), and four to the ferroptosis pathway (Nrf2, HOMOX1, SLC2A6, and ASOCS1) (Figure 4(c)). The results of the four genes related to the AMPK pathway and two genes related to the PPAR pathway were inconsistent with the RNA-sequencing results (Table 1). p-AMPK expression was not detected in either the NC or the Erastin group (Figure 4(d)). PPAR-α, which suppresses ferroptosis, and PPAR-γ, which promotes ferroptosis, were observed in the Western blot. PPAR-α expression was upregulated, while PPAR-γ was downregulated in the Erastin group compared to the controls (Figure 4(e)). The expressions of ferroptosis signaling pathway genes were consistent with the RNA-sequencing results (Figure 4(c), (e), and (f)), where both HO-1 and Nrf2 were upregulated in erastin-treated cells. Thus, HO-1 was selected as the candidate gene for the RNAi experiment. Validation of selected DEGs by qRT-PCR and Western blotting. HeLa cells were augmented with DMSO (NC group) or erastin (10 µM) for 24 h. (a) Relative mRNA expression of genes related to the AMPK pathway. (b) Relative mRNA expression of genes related to the PPAR pathway. (c) Relative mRNA expression of genes related to the ferroptosis pathway. (d) Relative expression of essential proteins related to the AMPK pathway. (e) Relative expression of key proteins related to the PPAR and ferroptosis pathways. (f) Quantitative analysis of the expression of key proteins related to the PPAR and ferroptosis pathways. AMPK, PPAR, and ferroptosis signaling pathway-related DEGs.

The effects of erastin on HeLa cells were diminished by si-HO-1 transfection
HeLa cells were transfected with siRNA targeting HO-1 to ascertain that erastin induced ferroptosis via HO-1. HO-1-siRNA1–779, HO-1-siRNA2–1355, and HO-1-siRNA3–1418 significantly reduced the HO-1 mRNA expression in HeLa cells (Figure 5(a)), with the most robust effect in the group delivered with HO-1-siRNA1–779. HeLa cells transfected with HO-1-siRNA1–779 (hereinafter named si-HO-1) were subjected to erastin treatment (10 µM, 24 h), where the upregulation of HO-1 by erastin was inhibited by si-HO-1 transfection (Figure 5(b)). HO-1 knockdown also inhibited the Nrf2 and HO-1 protein expressions in erastin-treated HeLa cells (Figure 5(c) and (d)). Selection and validation of HO-1 siRNA. (a) Relative mRNA expression of HO-1 in HeLa cells transfected with scramble siRNA (si-NC) or three candidate siRNAs targeting HO-1. (b) After being transfected with selected HO-1 siRNA, HeLa cells were treated with 10 µM erastin or DMSO for 24 h. Relative mRNA expression of HO-1 was measured by qPCR. (c), (d) Relative protein expression of HO-1 and Nrf2 was measured by Western blotting.
The effects of HO-1 knockdown on erastin-induced ferroptosis in HeLa cells were investigated. HeLa cells’ ability to form colonies and migrate/invade was suppressed effectively by erastin but was restored by si-HO-1 transfection (Figure 6(a)–(c)). Moreover, erastin-induced ROS production in HeLa cells was inhibited significantly by HO-1 knockdown (Figure 6(d)). In addition, HeLa cell apoptosis was induced by erastin but markedly reduced by si-HO-1 transfection (Figure 6(e)). Overall, HO-1 downregulation diminished the effects of erastin on HeLa cells. Impact of HO-1 knockdown on erastin-induced ferroptosis in HeLa cells. HeLa cells were transfected with scramble siRNA (si-NC) or si-HO-1, followed by 24 h treatment with DMSO or 10 µM erastin. (a) Representative images of colonies after 24 h of treatment are shown. The bar chart shows fold change relative to the control group (si-NC). (b) A scratch assay was performed to evaluate the invasion capacity of cells. Representative images (40× magnification) are shown. The bar chart shows the migration distance relative to the control group. (c) A Transwell assay was carried out to assess the migration capacity of cells. Representative images (200× magnification) are shown. The bar graph shows the invasion rate relative to the control group. (d) Total cellular ROS generation was detected by DCFH-DA, and representative images (200× magnification) are shown. (e) CCK-8 assay was applied to evaluate cell viability. The bar chart shows the viability relative to the control group. (f) Flow cytometric analysis detected apoptosis. Images and quantitative analysis of the apoptosis rate are shown.
Discussion
Current treatments, including surgery, chemotherapy, and radiotherapy, have significantly benefited patients with cervical cancer. However, traditional therapeutic intervention for cervical cancer is still challenging for a complex and heterogeneous disease. 16 In the present work, erastin effectively inhibited colony formation and migration/invasion of cervical cancer cells by inducing ferroptosis via the Nrf2/HO-1 pathway, suggesting the potential of erastin in cervical cancer treatment.
The therapeutic potential of erastin in cancers has been reported widely. For instance, erastin reduces the breast cancer cell’s viability dose-dependently and induces autophagy. 17 Erastin also increases intracellular accumulation of ABCB1 and elevates the sensitivity of ovarian cancer cell lines (KEY and SKOV3) to cisplatin.18,19 Our study showed that the IC50 values of erastin for HeLa cells and SiHa cells were 30.88 µM and IC50 = 29.40 µM, respectively. Erastin also inhibited colony formation and migration/invasion of these cells.
Ferroptosis is associated with several malignancies. Prostate cancer cells’ exposure to a high iron environment disrupts the androgen receptor signaling, resulting in cytotoxicity. 20 In breast cancer cells, iron-mediated lysosomes generated ROS, induced ferroptosis, and suppressed breast cancer stem cells. 21 A ferroptosis-related signature was proposed to predict the prognosis of patients with cervical squamous carcinoma. 22 Moreover, oleanolic acid reduced the viability and proliferation of HeLa cells by regulating ferroptosis-related genes. 7 In addition, microRNA-660-5p has been shown to inhibit ferroptosis in SiHa cells, 23 while DHA can trigger ferritinophagy-dependent ferroptosis in SiHa cells. 24 Ferrostatin-1 is a specific ferroptosis inhibitor that prevents erastin-induced lipid ROS accumulation and inhibits ferroptosis in fibrosarcoma HT-1080 cells. 4 In the present work, ferrostatin-1 markedly diminished the suppressing activity of erastin on both HeLa and SiHa 24 cell growth, motility, and ROS production.
The AMPK, PPAR, and Nrf2/HO-1 are key signaling pathways related to ferroptosis.25,26 AMPK acts as a cell energy status sensor, and its inactivation reduces the protective effect of energy stress on iron toxicity. 27 A recent study revealed that FTY720, a novel immunosuppressant, induced autophagy and ferroptosis in multiple myeloma via the AMPK signaling pathway. 28 In this study, sequencing analysis showed that AMPK pathway-related genes (i.e., HNF4A, LIPE-AS1, and PFKFB4) were expressed differentially in erastin-treated cells, validated by qRT-PCR and Western blotting. However, erastin treatment did not affect the phosphorylation level of AMPK in HeLa cells, indicating that AMPK might not be the predominant pathway in erastin-induced ferroptosis. PPAR pathway was reported to show enhanced expression in breast cancer tissues and may be related to ferroptosis.29,30 In this study, high-throughput sequencing analysis showed that two genes related to the PPAR pathway (SLC27A6 and SORBS1) were expressed differentially in erastin-treated cells, consistent with the qRT-PCR results but not Western blotting. The inconsistency implies that the classical PPAR signaling may not be the primary mechanism in erastin-induced ferroptosis in HeLa cells. PPAR-α and PPAR-γ showed opposing expression trends upon erastin treatment. These discrepancies may be influenced by different regulatory factors, and the interaction between these PPAR subtypes within cells is complex. Han 31 reported PPAR-γ-mediated ferroptosis in DCs induced by RSL3, while Xing 32 found a potentially negative role of PPAR-α in ferroptosis-related tissue injuries.
Nrf2 plays a critical role in the ferroptosis of liver cancer cells. The target genes of Nrf2 (HO-1, NQO1, and FTH1) increase iron toxicity resistance by altering lipid peroxidation and iron metabolism. Nrf2 inhibition has been reported to promote ferroptosis in liver cancer cells in animal models and in vitro. 33 HO-1 is a heme oxygenase considered a cytoprotective factor and a tumor suppressor. 34 Several studies have identified HO-1 as a critical factor of iron-dependent lipid peroxidation in regulated cell death. 35 However, cellular iron and ROS are the critical driving force for HO-1 activity, which may convert HO-1 from a protective to a pathogenic factor. 35 Recently, studies have revealed that high HO-1 expression is linked with lymph node metastasis, late clinical stage, and substandard prognosis of gynecological cancers. 36 Nrf2/HO-1 signaling involvement in ferroptosis and tumorigenesis has been reported widely. In human melanoma cells, the Keap1/Nrf2/HO-1 pathway stimulation induced ferroptosis. 37 The activation of the ferritin-mediated Keap1/Nrf2/HO-1 pathway favored epithelial–mesenchymal transition inhibition in gastric cancer cells. 38 Additionally, cetuximab promoted ferroptosis in colorectal cancer with KRAS mutation via the RSL-3-mediated p38/Nrf2/HO-1 pathway, 39 while tagitinin C triggers ferroptosis in colorectal cancer cells via the Perk/Nrf2/HO-1 signaling. 40 Over 99% of cervical cancer cases are caused by persistent genital high-risk HPV infection. 41 HPV oncoproteins, such as E5, E6, and E7, play a pivotal role in driving cervical oncogenesis by manipulating cancer hallmarks, inducing angiogenesis, resisting cell death, and sustaining proliferative signaling. 42 A recent study reported that ectopic expression of HPV-E6/E7 plasmid in various cancer cells repressed constitutive Nrf2 activity. 43 In this study, Nrf2 and HO-1 were highly expressed in ferroptotic HeLa cells, suggesting that the Nrf2/HO-1 pathway may be a key mechanism by which erastin regulates ferroptosis. Further analysis using the siRNA technique demonstrated that HO-1 knockdown significantly diminished the erastin activity on colony formation, migration, invasion, and ROS production of HeLa cells.
The limitation of this study should also be acknowledged. While our data demonstrated that erastin-induced ferroptosis and ROS accumulation in cervical cancer cells by activating the Nrf2/HO-1 pathway, other potential contributing factors or signaling pathways involved in this process were not explored.
Conclusion
Our study reported that erastin induced ferroptosis and ROS accumulation in cervical cancer cells via activating the Nrf2/HO-1 pathway, significantly reducing cell proliferation, migration, and invasion. Our findings propose a new mechanism by which erastin suppresses cervical cancer progression.
Footnotes
Acknowledgments
The authors wish to thank Professor Desheng Yao (Guangxi Medical University Cancer Hospital, Nanning, Guangxi, China) for Hela and SiHa cells and Dr. Hao Yin for his technical assistance.
Author Contributions
Conception and design of the study: JYC. Provision of study materials or patients: QQH. Acquisition of data: XNW and QQH. Data analysis: JBH and LY. Interpretation of data: JYC and QQH. XNW drafted the manuscript alone. JYC, XNW, QQH, JBH, and LY substantially revised the manuscript. All authors have read and approved the final manuscript.
Declaration of conflicting interests
The author(s) declared no potential conflicts of interest with respect to the research, authorship, and/or publication of this article.
Funding
The author(s) disclosed receipt of the following financial support for the research, authorship, and/or publication of this article: The present study was supported by the National Natural Science Foundation of China (grant no.81860457), China Postdoctoral Science Foundation General Project 2019M663411, the Natural Science Foundation of Guangxi Province, China (grant no.2017GXNSFAA198106), medical and health appropriate technology development and promotion application project of Guangxi Province, China (grant no. S2018107), and the Guangxi Medical University Training Program for Distinguished Young Scholars.
Ethical Statement
Data Availability Statement
Data sharing not applicable to this article as no datasets were generated or analyzed during the current study.