
Abstract
Keywords
Introduction
Chronic Obstructive Pulmonary Disease (COPD) is a preventable and treatable chronic disorder, but it is also one of the most common causes of morbidity and mortality worldwide. Despite treatment, persistence of respiratory symptoms and airway obstruction is the common end point. 1 Airflow limitation in COPD is a consequence of lower airway abnormalities, which can occur with or without alveolar involvement, in response to a variety of injurious factors. 2 COPD frequently coexists with other chronic diseases, such as diabetes mellitus, systemic hypertension, and ischemic heart disease. These comorbidities can interact with each other and with COPD to worsen outcomes. 3
Obstructive sleep apnea (OSA) is a chronic respiratory disorder characterized by recurrent episodes of upper airway narrowing during sleep, which disrupt normal ventilation. 4 The co-occurrence of obstructive sleep apnea and chronic obstructive pulmonary disease is termed the Overlap Syndrome (OS),5,6 which was first described in 1985. 6 The prevalence of OS in the general population ranges from 1.0 to 3.6%. 5 The prevalence of OSA in patients with COPD varies, with some studies reporting a prevalence of 10%–15% 7 and others reporting a lower prevalence of 3% 8
Patients with Overlap Syndrome (OS) experience significantly poorer sleep quality and more prolonged and severe desaturation events than patients with either OSA or COPD alone, due to the synergistic effects of these two conditions.4,5 Patients with Overlap Syndrome have a higher prevalence of pulmonary hypertension than patients with either obstructive sleep apnea or COPD alone. 9 The development of pulmonary hypertension in COPD patients strongly suggests the presence of concomitant OSA. OS has also been associated with arterial hypertension, cardiovascular diseases, and stroke. 10
Despite growing research, our understanding of Overlap Syndrome (OS) is still limited. There is a paucity of data on predictors of OS in COPD patients, and treatment guidelines are incomplete. More information is needed to identify and treat these patients early before complications develop. In this study, we investigated blood indices as novel and simple predictors of OS, and analyzed factors associated with subsequent exacerbation attacks.
Patients and methods
Patient selection and study design
This cross-sectional study recruited 330 patients with confirmed COPD, diagnosed by post-bronchodilator forced expiratory volume in one second (FEV1) testing, 1 who visited Tanta University Hospital between February 2022 and January 2023 for routine visits or for acute exacerbations, defined as worsening of day-to-day symptoms requiring changes in regular medication or urgent hospitalization and intervention. 11 All patients underwent routine investigations to assess the severity and cause of exacerbation. Informed consent was obtained from all patients, and the study was approved by the Faculty of Medicine Tanta University Ethics Committee (Approval No.: 36192/12/22).
As shown in Figure 1, all participants underwent the Epworth Sleepiness Scale (ESS) assessment, a subjective measure commonly used to screen for OSA.
12
Participants with high ESS scores underwent polysomnography (PSG), a sleep study that records five or more predominantly obstructive respiratory events per hour of sleep to confirm the diagnosis of OSA. The severity of OSA was classified using indices such as the Apnea Hypopnea Index (AHI).
13
Flowchart for selection of patients in the study.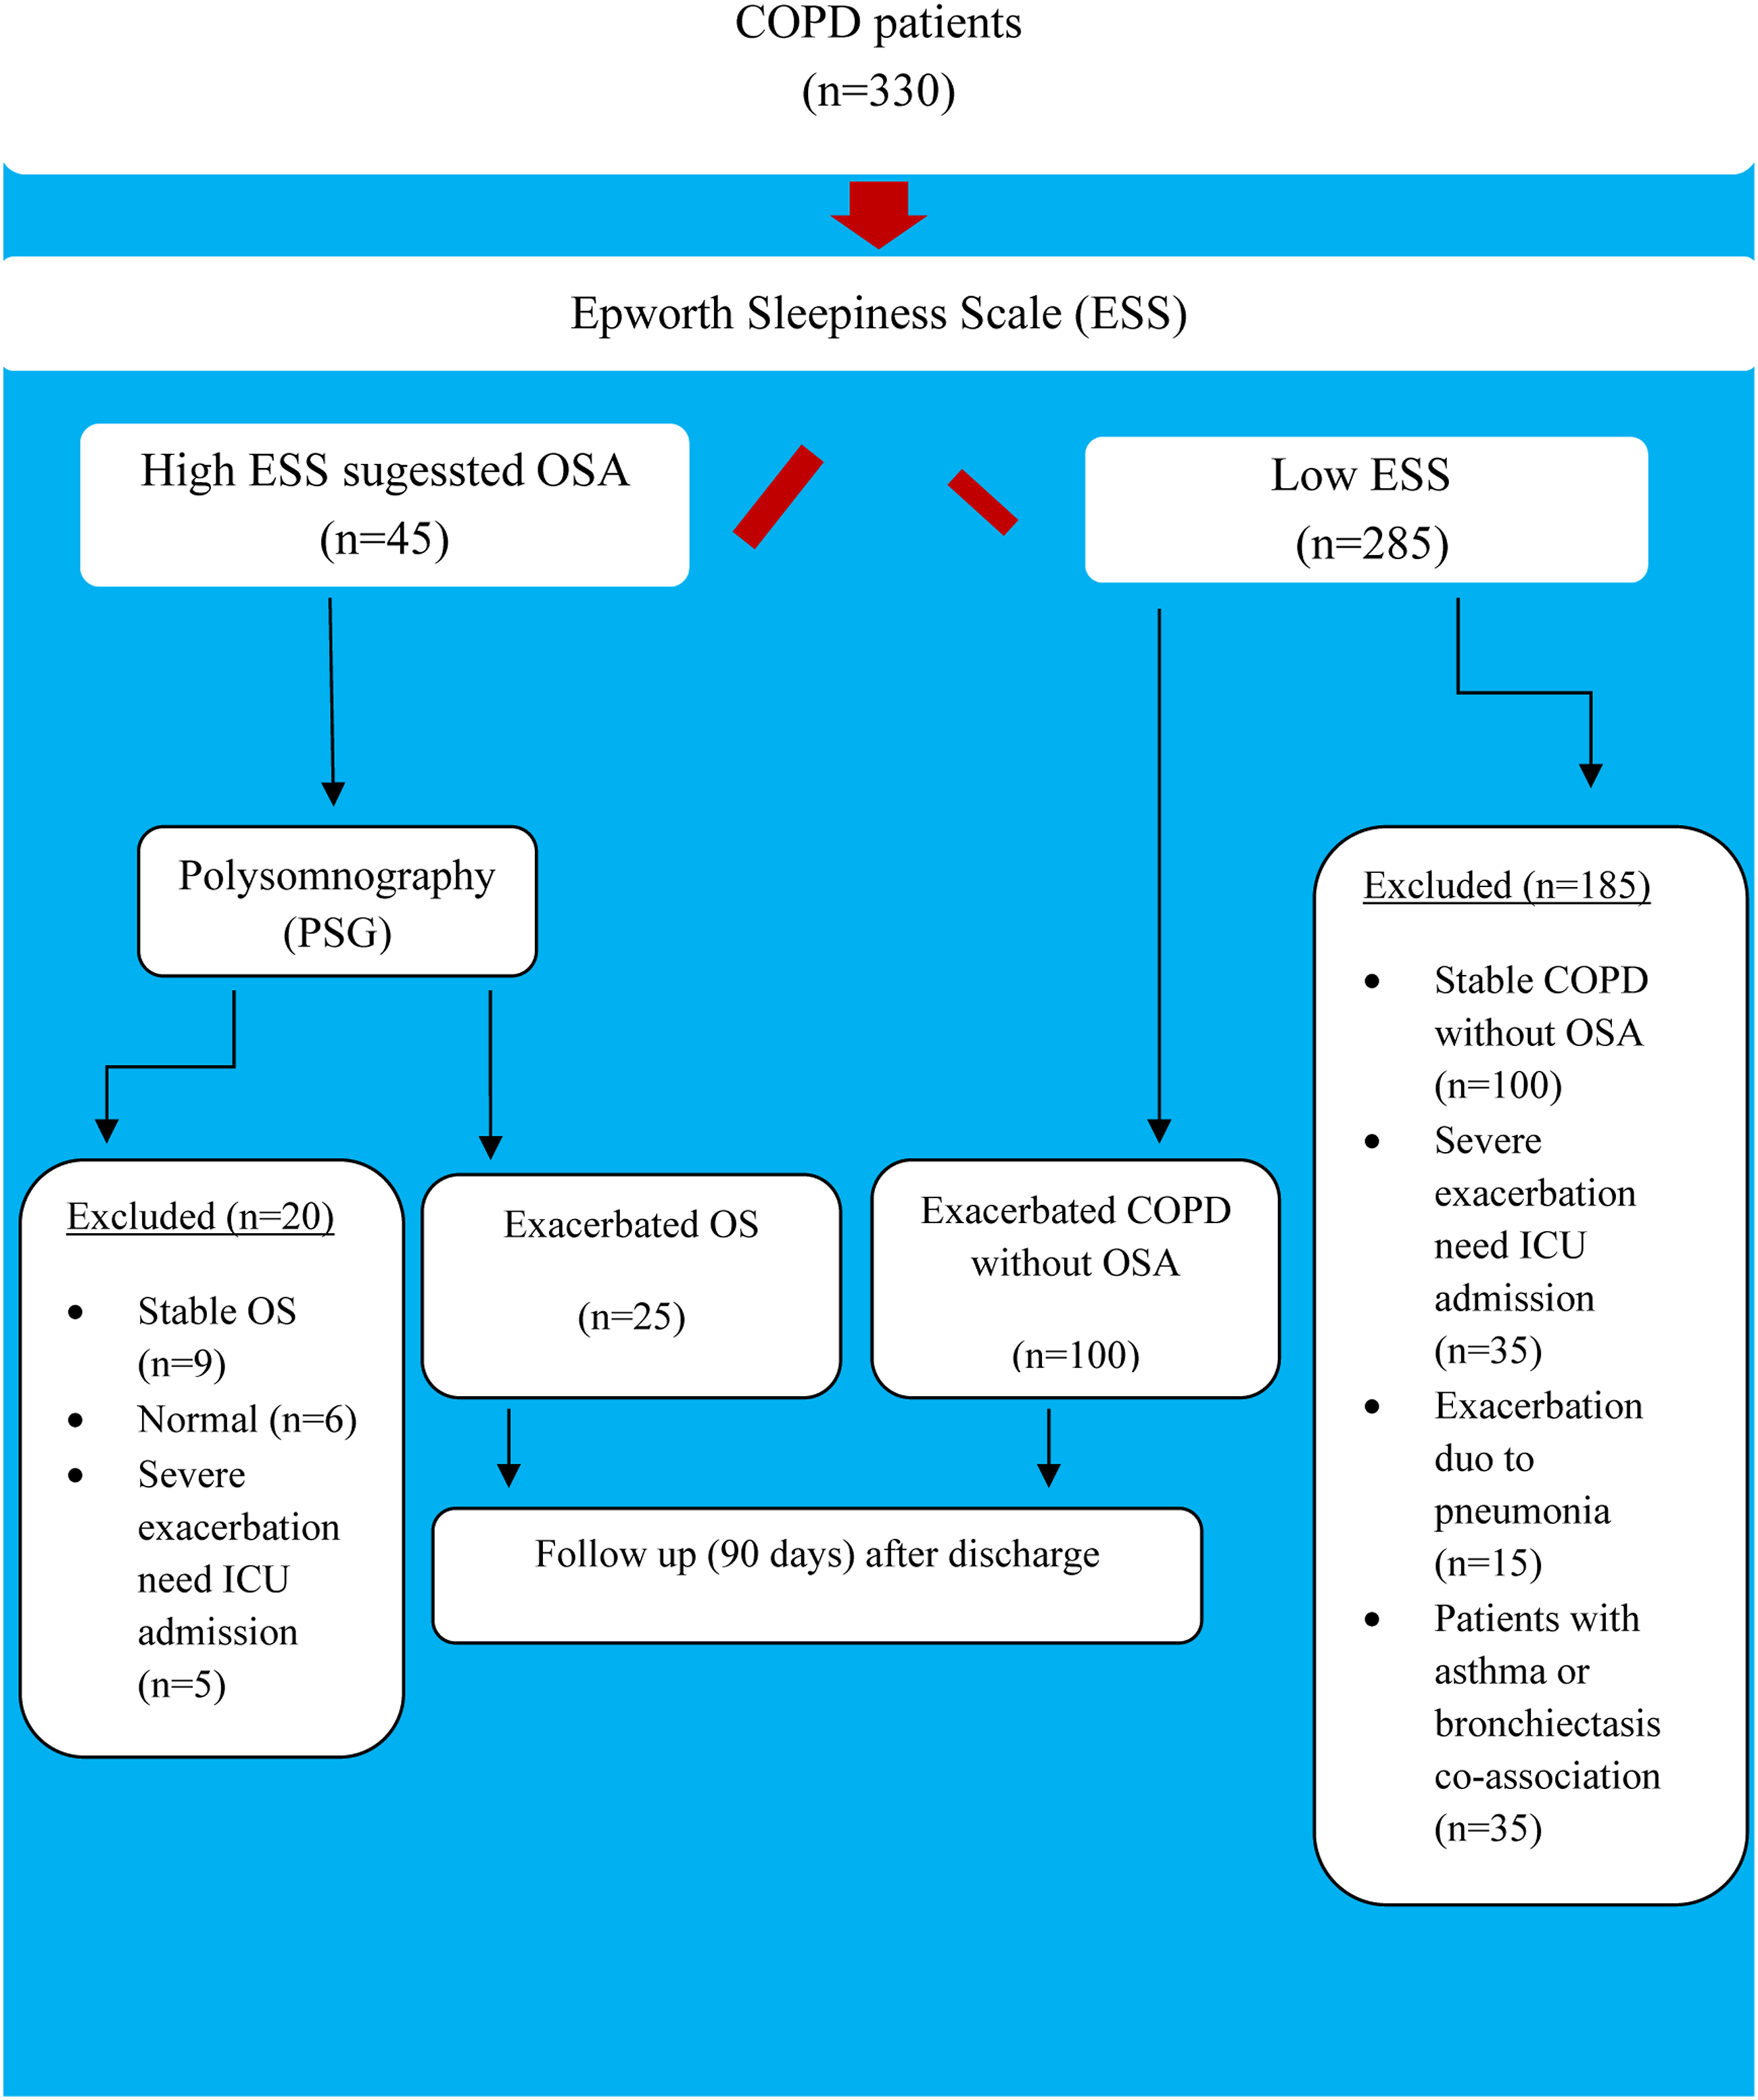
Patients with stable COPD, those with severe exacerbations requiring ICU admission, or those with exacerbations due to pneumonia, COPD with asthma, bronchiectasis, or interstitial lung diseases were excluded from the study.
Sample size
The sample size for this study was calculated using Minitab 17.1.0.0 for Windows (Minitab Inc., 2013, Pennsylvania, USA), based on the study by Lurie et al. in 2021. 5 Assuming a prevalence of Overlap Syndrome of 6%–66% with a 95% confidence level and a type I error of 5%, the minimum total sample size required was 86, which could be extended up to 124.
Data collection and measurement
Demographic data
Patient-related information including age, sex, smoking habits and index, comorbidities, recent spirometry data (FEV1, FVC, and the ratio), history of hospital admission due to acute exacerbation in the last year and number of entries, history of using oral corticosteroids and number of courses in the previous year, and history of domiciliary oxygen therapy were retrieved from the patients’ medical records.
Standard measures for evaluating COPD exacerbations
All patients underwent arterial blood gas (ABG) assessment in room air, body mass index (BMI) calculation, and blood sampling for complete blood count (CBC), C-reactive protein (CRP), and erythrocyte sedimentation rate (ESR) measurement. Patients with excess sputum production were requested to undergo chest X-ray and provide sputum samples for examination using the Film Array Pneumonia Panel Plus (FA-PP) (Biofire, BioMérieux, Marcy l'Etoile, France) and subsequent chest computed tomography (CT) scan if required to detect atypical pneumonia.
Epworth sleepiness scale and polysomnography
The Epworth Sleepiness Scale (ESS) is a self-reported questionnaire that assesses daytime sleepiness. 14 It consists of eight questions about the likelihood of dozing off or falling asleep during specific activities or situations. Each question is rated on a scale of 0 to 3, with 0 indicating no dozing and three indicating a high chance of dozing. The total score is calculated by adding up the scores for each question, and a score higher than five indicates significant daytime sleepiness. Patients with high ESS scores may be further evaluated with polysomnography (PSG), a sleep study that can diagnose OSA. OSA is characterized by five or more episodes of breathing obstruction per hour of sleep. The severity of OSA is classified using indices such as the Apnea Hypopnea Index (AHI), Respiratory Disturbance Index (RDI), or Respiratory Event Index (REI).
Short term follow-up
In the 90 days following hospital discharge, any episodes of exacerbation have been recorded.
Statistical analysis
Continuous data were summarized using means, medians, standard deviations, and interquartile ranges, while categorical data were summarized using counts and percentages. All statistical analyses were performed using Minitab 17.1.0.0 for Windows (Minitab Inc., 2013, Pennsylvania, USA). The normality of the data was assessed using the Shapiro-Wilk test. The independent t test or Mann-Whitney U test was used to compare two numerical data, and the chi-squared test was used to compare the frequencies of two or more groups. The receiver operating characteristic (ROC) curve was used to evaluate the utility of the newly developed hematologic indices in predicting OS among exacerbated COPD patients and predicting the second exacerbation attack in the OS group; an area under the curve (AUC) above 0.6 was considered acceptable. Logistic regression analysis with a backward elimination technique was used to identify predictors of OS among exacerbated COPD patients, while Cox regression analysis was used to predict the next exacerbation attack within a short-term follow-up period (90 days after discharge). All tests were two-tailed, and p-values < 0.05 were considered statistically significant.
Results
Patients’ characteristics and risk factors
Demographic features and risk factors of patients with exacerbated OS.

BMI: body mass index, DM: diabetes mellitus, IHD: ischemic heart disease, HTN: hypertension, PAHT, pulmonary arterial hypertension, RD: renal disease, LD: liver disease, RA: room air, OCS-CN: oral corticosteroid course number, n: number, SD: standard deviation, IQR: inter quartile range, the numerical data represented as mean and standard deviation, or median and IQR, and categorical data as number and percentage.
aIndependent t test.
cMann Whitney test.
bChi square test, p < 0.05 considered significant.
Compared to patients with COPD alone, those with OSA had a higher prevalence of diabetes mellitus (p = 0.05) and pulmonary artery hypertension (p < 0.001). Conversely, patients with COPD without OSA had a higher prevalence of systemic hypertension (p < 0.001) and liver disease (p = 0.03). All patients with OSA received domiciliary oxygen therapy, compared to 60% of those with COPD without OSA (p < 0.001). Despite no differences between the groups in spirometry parameters, the Epworth Sleepiness Scale (ESS) score was significantly higher in patients with OSA (p < 0.01).
Peripheral blood findings in patients with exacerbated COPD and OS
Comparison of the peripheral blood findings and ratios in exacerbatedOS and COPD alone.

TLC: Total leukocytic count, HB: hemoglobin, PLT: platelets, MPV: mean platelet volume, CRP: C-reactive protein, ESR: erythrocyte sedimentation rate, MER: monocyte to eosinophils ratio, NMR: neutrophil to monocyte ratio, PMR: platelet to monocyte ratio.
bIndependent t test.
aMann Whitney test, p < 0.05 considered significant.
C-reactive protein (CRP) and erythrocyte sedimentation rate (ESR) levels were significantly higher in the overlap group (p = 0.01 and 0.005, respectively). New ratios derived from blood counts were developed to compare the groups. The first ratio, monocyte to eosinophil ratio (MER), was significantly higher in the overlap group (median MER of three in the COPD group vs 5.5 in the overlap group; interquartile range [IQR] of 1.5-4.5 vs 3.6-6, respectively; p = 0.004). Conversely, the other two ratios, neutrophil to monocyte ratio (NMR) and platelet to monocyte ratio (PMR), were significantly lower in the overlap group (p = 0.02 and < 0.001, respectively).
The neutrophil to monocyte ratio (NMR), monocyte to eosinophil ratio (MER), and platelet to monocyte ratio (PMR) showed significant utility in discriminating exacerbated overlap syndrome (OS) from COPD without OSA. The area under the receiver operating characteristic curve (AUC) for NMR, MER, and PMR was 65%, 70%, and 83%, respectively (p = 0.02, 0.004, and <0.001, respectively) (Figure 2). Utility of a) Monocyte to eosinophil ratio (MER), b) Neutrophil to monocyte ratio (NMR), and c) Platelet to monocyte ratio (PMR) in prediction of OS among exacerbated COPD patients.
Performance of MER, NMR and PMR in discriminating exacerbated OS from COPD alone.
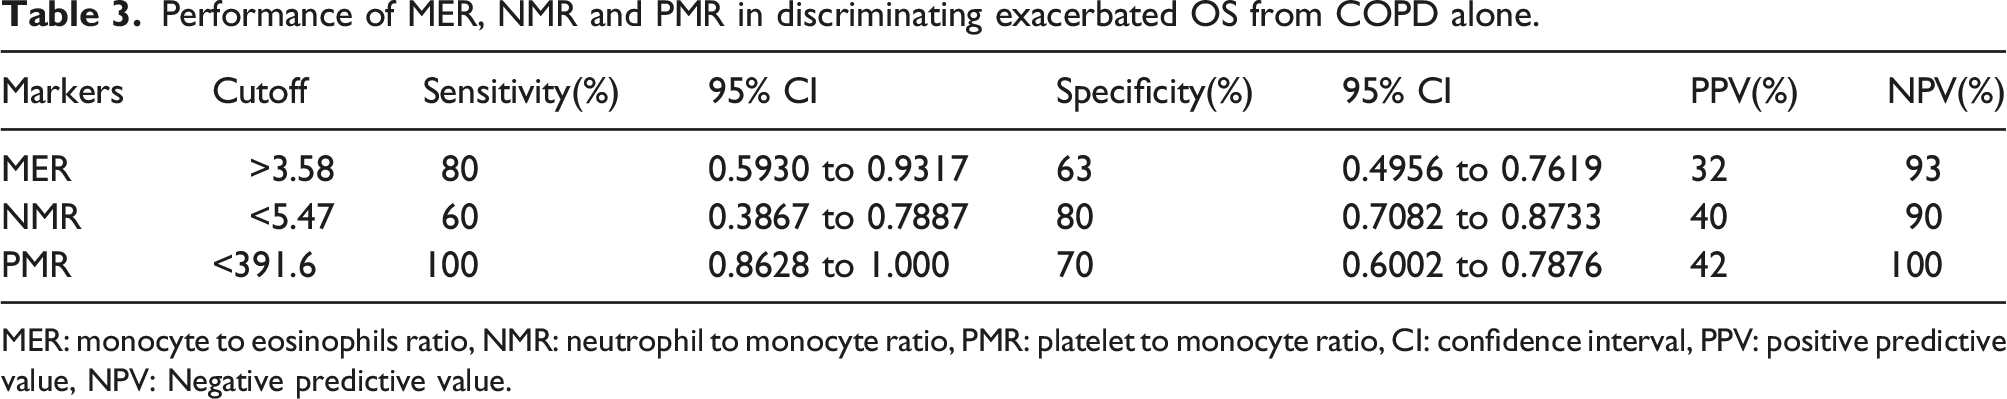
MER: monocyte to eosinophils ratio, NMR: neutrophil to monocyte ratio, PMR: platelet to monocyte ratio, CI: confidence interval, PPV: positive predictive value, NPV: Negative predictive value.
Predictors of OS among exacerbated COPD
Predictors of OS in exacerbated COPD patients.

BMI: body mass index, FEV1: Forced expiratory volume in 1 s, FVC: Forced vital capacity,MER: Monocyte eosinophils ratio, Coeff.: coefficient, OR: odds ratio, CI: confidence interval, The goodness for fit test: Hosmer-Lemeshow test, X2 = 0.83, p = 0.33, p < 0.05 was considered significant.
aThe test of significant: logistic regression analysis with backward elimination methods.
Correlation of blood indices with the severity of OS
Figure 3 shows a significant correlation between the apnea-hypopnea index (AHI) and blood indices. The linear relationship between AHI and the monocyte to eosinophil ratio (MER) and the neutrophil to monocyte ratio (NMR) was strongly positive, with correlation coefficients of 0.41 and 0.85, respectively (p = 0.05 and 0.001). However, the correlation between AHI and the platelet to monocyte ratio (PMR) was strongly negative, with a correlation coefficient of −0.89 (p < 0.001). Correlation between AHI and blood indices in OS *: Test of significant: Pearson correlation coefficient, the sign before “r”, denotes the direction of relationship, p < 0.05 considered significant.
Prognosis and factors implicated in the next exacerbation attack in OS group.
During the 90-days follow-up period after hospital discharge, 60% (15 out of 25) of patients with overlap syndrome were re-admitted due to acute exacerbation attacks, compared to 100% of patients with COPD alone. This difference was statistically significant (p < 0.001, Figure 4). Frequency of acute exacerbation in OSA-COPD overlap *: The test of significant: chi-square test, p < 0.05 considered significant.
Factors associated withprediction of the next exacerbation attack in OS group.

BMI: Body mass index, MER: monocyte to eosinophils ratio, NMR: neutrophil to monocyte ratio, PMR: platelet to monocyte ratio, FEV1: Forced expiratory volume in 1 s, FVC: Forced vital capacity, p < 0.05 considered significant.
aIndependent t test.
bMann Whitney test.
Predictors of poor prognosis in OS group.

FEV1: Forced expiratory volume in 1 s, FVC: Forced vital capacity,MER: Monocyte esinophils ratio, Coeff.: coefficient, HR: hazardous ratio, CI: confidence interval, The goodness for fit test: Chi square test, X2 = 6.3, p = 0.11, p < 0.05 was considered significant.
aThe test of significant: Cox regression analysis with backward elimination methods.

ROC curve for MER for predicting the next Exacerbation attack.
Utility of MER in predicting the next exacerbation attack in OS group.
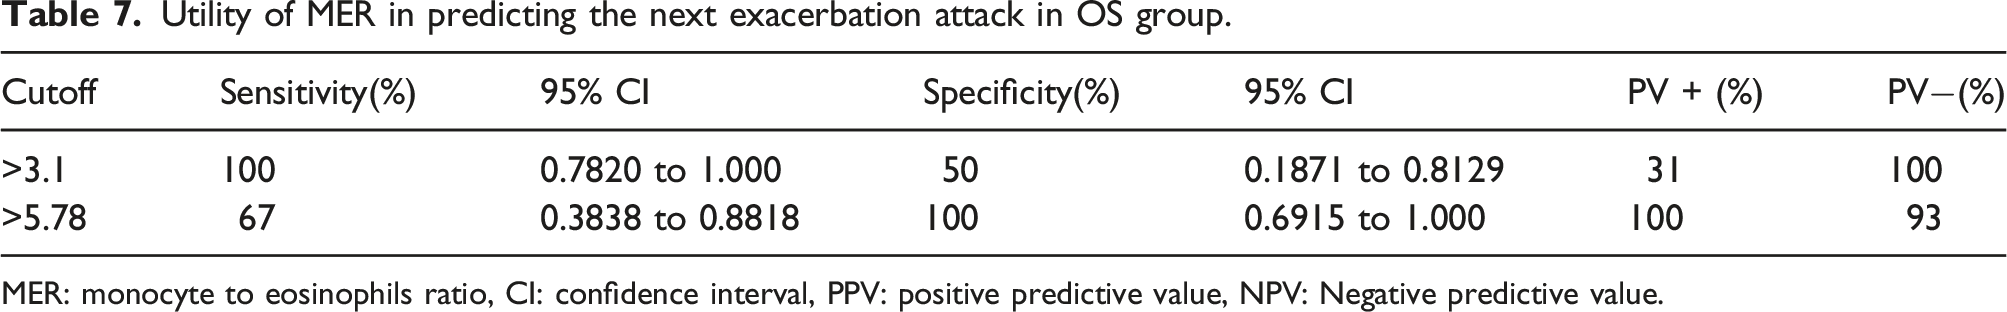
MER: monocyte to eosinophils ratio, CI: confidence interval, PPV: positive predictive value, NPV: Negative predictive value.
Discussion
David Flenley coined the term “COPD-OSA overlap syndrome” in 1985 to describe apneas or hypopneas that occur secondary to COPD during sleep. 15 Patients with both COPD and OSA have a higher risk of morbidity and mortality than patients with either condition alone. 16 In this study, we show that different blood indices and ratios of blood components are highly discriminatory for detecting OS and predicting the next exacerbation attack.
Although bone marrow is the primary site for hematopoiesis, including megakaryopoiesis, recent studies have shown that the lungs may also participate in the production of platelets, and represents one of major sites of their synthesis.17,18 When platelets count drops in the circulation, megakaryocytes present in the extravascular spaces of the lungs migrate to the bone marrow to increase the yield of platelets. 17 Several studies have shown that COPD was associated with significant increase in the platelet count and/or mean platelet volume (MPV), and this increase was associated with poor outcome in these patients.19,20 Therefore, it has been suggested that platelets contribute to the pathogenesis of the disease. 18 In our cohort, Patients with COPD alone had significantly higher platelet counts than patients without COPD. Additionally, patients with COPD alone had a higher frequency of exacerbations. However, the elevation in platelet count was not predictive of future exacerbations.
Eosinophils are among the inflammatory cells that contribute to airway obstruction in COPD. Sputum eosinophilia can be used to detect disease exacerbations, and eosinophil count can be used to monitor treatment response, especially to inhaled corticosteroids.21–23 In our study, patients with overlap syndrome had significantly higher eosinophil counts than patients with COPD alone. Additionally, a ratio of monocytes to eosinophils was useful for differentiating between exacerbated overlap syndrome and COPD alone.
The number of lung macrophages increases in COPD, which could be due to migration of monocytes from the peripheral blood or up-regulation of anti-apoptotic genes in lung macrophages.24,25 Macrophages play an important physiological role in the innate immune system, but they can also participate in parenchymal destruction and airway remodeling under pathological conditions. 26 Higher numbers of blood monocytes have been observed in patients with severe COPD and in patients with acute exacerbations of the disease. These monocytes have a high potential to differentiate into a more inflammatory destructive phenotype.27,28
Previous studies have shown that the monocyte to HDL ratio is higher in patients with obstructive sleep apnea (OSA), suggesting that monocytes play a role in this disorder.29,30 Additionally, the monocyte to lymphocyte ratio has been found to be an independent risk factor for coronary artery disease and a predictor of severity in this disease. 31 In our study, we found that the monocyte involvement in ratios as a numerator with eosinophil or as a denominator with platelets or neutrophils was associated with an ability to discriminate between exacerbated OS from COPD alone, and to predict the next exacerbation in OS patients.
All patients with exacerbated OS received domiciliary oxygen therapy, which indicates the severity of hypoxia in this group. However, the frequency of acute exacerbations was significantly lower in the OS group than in the COPD group alone. We believe that oxygen therapy in the OS group may be a modifying factor that delayed the occurrence of exacerbations. A systematic review and meta-analysis about the effect of long-term oxygen therapy (LTOT) in COPD patients found that LTOT significantly reduced the risk of hospital readmissions for exacerbations. 32 Additionally, other studies showed that continuous positive airway pressure (CPAP) with good compliance decreases the frequency of exacerbation-related hospitalizations and improve survival rates, as well as lung function and COPD-related symptoms.33,34
Obesity was also a predictor of exacerbated overlap syndrome (OS). COPD clinical phenotypes affect the likelihood of OS, with the chronic bronchitis phenotype associated with high BMI increasing the risk of OS and the emphysema phenotype associated with low BMI being protective against OS. 35 We think that our patients belong to the chronic bronchitis phenotype. It has been reported that patients with this phenotype have higher percentages of eosinophils and macrophages and lower percentages of neutrophils in the sputum than patients without symptoms of this disorder. 36 This is similar to our findings, but our findings were mainly in the peripheral blood, and not in the sputum. Conversely, a different study found that eight sputum cytokines associated with these cells were not associated with worse symptoms or lung functions in COPD patients. 37
The impact of obesity on the severity of COPD exacerbations has only recently been investigated. 38 In a large population study, Goto et al. found that obesity was not associated with increased in-hospital mortality after hospitalization for acute exacerbation of COPD. 39 A meta-analysis of 17 studies found that overweight was associated with a lower risk of long-term all-cause mortality in COPD patients compared to normal or underweight patients. 40
Conclusions
We identified three ratios from the peripheral blood components that can be used for differentiation between exacerbated and COPD. Obesity was also a predictor of exacerbation of OS in our cohort. Long term follow up is recommended to evaluate the severity of exacerbations and the effect of complications of OS on the morbidity and mortality of these patients. More studies are needed to validate these findings and to develop and implement clinical tools that incorporate these ratios into the management of OS patients.
Limitations of the study
Our study has several limitations. First, we did not assess the pattern of the parameters we assessed, since we measured these parameters only once. Second, we only evaluated the frequency of acute exacerbations in both groups, but not their severity. Third, the parameters we measured were assessed during the acute setting only. Fourth, we measured the total monocyte count, but not the subsets. Evaluating the subsets would have been helpful to understand the physiological and pathological functions of these cells. Fifth: the limited number of patients with OS also represents another limitation. Finally, we did not examine the sputum of the study groups, which could have been valuable for comparison with peripheral blood. The reason for some of these limitations is that the main goal of our study was to identify easy and simple markers among routine laboratory tests and measurements for the prediction of OS. These markers could be used for diagnostic and prognostic purposes in limited resource settings.
Footnotes
Author contributions
Asmaa Ali: Conceptualization, Methodology. Ahmed Samir Abdelhafiz: Writing original draft. Mai M. Saleh, Heba Salem, Mohammed Abdallah Rakha, and SehamEzzat: Investigation and data collection.
Declaration of conflicting interests
The author(s) declared no potential conflicts of interest with respect to the research, authorship, and/or publication of this article.
Funding
The author(s) received no financial support for the research, authorship, and/or publication of this article.