
Abstract
Background
Genome instability lncRNA (GILnc) is prevalently related with gastric cancer (GC) pathophysiology. However, the study on the relationship GILnc and prognosis and drug sensitivity of GC remains scarce.
Method
We extracted expression data of 375 GC patients from TCGA cohort and 205 GC patients from GSE26942 cohort. Then, lncRNA was separated from expression data, and systematically characterized the 8 marker lncRNAs using the LASSO method. Next, we constructed a GILnc model (GILnc score) to quantify the GILnc index of each GC patient. Finally, we analyzed the relationship between GILnc score and clinical traits including survival outcomes, TP53, and drug sensitivity of GC.
Results
Based on a computational frame, 205 GILncs in GC has been identified. Then, a 8 GILncs was successfully established to predict overall survival in GC patients based on LASSO analysis, divided GC samples into high GILnc score and low GILnc score groups with significantly different outcome and was validated in multiple independent patient cohorts. Furthermore, GILnc model is better than the prediction performance of two recently published lncRNA signatures, and the high GILnc score group was more sensitive to mitomycin. Besides, the GILnc score has greater prognostic significance than TP53 mutation status alone and is capable of identifying intermediate subtype group existing with partial TP53 functionality in TP53 wild-type patients. Finally, GILnc signature as verified in GSE26942.
Conclusion
We applied bioinformatics approaches to suggest that a 8 GILnc signature could serve as prognostic biomarkers, and provide a novel direction to explore the pathogenesis of GC.
Introduction
Gastric cancer (GC) is one of the leading contributors to the global cancer disease burden, which has brought heavy burden to the society and family.1,2 Despite the many treatments available to treat GC, it still ranks fourth in tumor-related mortality.3,4 The genesis and development of GC are reported to be due to the accumulation of gene mutations and epigenetic changes, which in turn lead to transcriptional or translational dysregulation.5,6 Due to gene mutations that have occurred in the early stages of the malignant tumor, molecular mechanisms of gene mutations regulation have to be further explored, and the analysis of its relations with GC metastasis and drug resistance will help to find new early GC markers, and will help to improve and enrich the early diagnosis of GC, in order to achieve targeted drugs which provide theoretical basis for the development of GC, and will help to improve the prognosis of patients with GC.
Molecular biology studies have shown that there is genomic instability or genetic instability in GC. 7 Loss of heterozygosity (LOH) and microsatellite instability (MSI) caused by DNA mismatch repair (MMR) gene repair errors are considered to be the two main phenotypic features of genome instability. 8 Genomic instability can be a hallmark of both human genetic disease and cancer. 9 Tumor cells have biological characteristics such as unrestricted proliferation, vascular regeneration, and metastasis, and the instability of the genome is the most essential characteristic of tumor cells. The relative stability of the genome is the basic prerequisite for cells to be faithfully passaged. When there are genetic defects or exposure to adverse environmental factors such as biological, physical, and chemical tests, it will lead to genomic instability. 10 Studies have constructed 10-miRNA signatures related to DNA damage response, and have shown that 10-miRNA signatures are associated with poor prognosis in ovarian cancer. 11 More and more evidence indicates that lncRNA plays an important role in tumors, and abnormal lncRNA expression may affect tumor cell proliferation, tumor progression or metastasis.12-14 Therefore, constructing lncRNAs related to genomic instability may be a prognostic factor for GC.
In this study, we extracted the transcription data of 375 GC patients from TCGA cohort and 205 GC patients from GSE26942 cohort. Then, lncRNA was separated from expression data, and systematically characterized 8 marker genome instability lncRNAs (GILnc) using the LASSO method. We constructed a GILnc score to quantify the GILnc index of each GC patient. We revealed that the distribution of GILnc score was validated in the GSE26942 cohort, suggesting that this scoring system based on GILnc plays an important role in predicting the prognosis of GC.
Materials and methods
Data source and preprocessing
Clinical characteristics of GC patient datasets in this study.

Selection of GILnc signature in GC
To identify the GILncSigs in GC, the top 25% somatic mutations per patient (n = 90) and the last 25% somatic mutations per patient (n = 97) of the patients were assigned to GU-like (genomic unstable) group and GS-like (genomic stable) group. Use the “Limma” software package in the R statistical software to extract and analyze the downloaded data, and screen out the differentially GILncs between GU-like group and GS-like group. We set the adjusted p-value < 0.05 and log2FC>1 as a significance threshold. 16
Construction of a risk model with prognostic value in GC
Next, univariate Cox regression analysis was used for differentially expressed GILncs, and the differentially expressed GILncs related to the patient’s overall survival (OS) were screened out based on p<0.05. Then, LASSO was used to identify the most powerful prognostic GILncs. A risk score for each patient was calculated according to the following formula
Gene set enrichment analysis (GSEA)
We performed GSEA to identify differences in the enrichment of pathways and biological processes between high-risk and low-risk groups. GSVA was conducted using the “GSEA” package in R. We downloaded the gene sets of “c2. cp.kegg.v7.3. symbols” and “h.all.v7.3. symbols” from the MSigDB database for GSEA (http://www.gsea-msigdb.org/gsea/downloads.jsp). Gene Ontology (GO) and Kyoto Encyclopedia of Genes and Genomes (KEGG) pathway analyses were performed using the “clusterProfiler” package. A significance level of 0.05 (FDR) was considered to indicate statistical significance. 19
Immune cell infiltration
We performed the ssGSEA, CIBERSORT, and xCell algorithm methods to calculate the composition of immune cells between the clusters
Statistical analysis
The normality of the variables was evaluated using the Shapiro–Wilk normality test. Continuous variables between two groups were compared using the unpaired Student t-test and Mann–Whitney U test for parametric data and non-parametric data, respectively. For comparison between more than two groups, we used parametric one-way ANOVA or non-parametric Kruskal–Wallis test. Kaplan–Meier analysis was used to generate survival curves using the “survival” and “survminer” packages, and the cut-off values were determined through the “surv_cutpoint” function in the packages. The receiver operating characteristic (ROC) curve was generated using the “pROC” package. To calculate the hazard ratios and identify the independent prognostic factors, univariate and multivariate Cox regression analyses were performed using the “survival” package. All statistical analyses were two-sided and considered p < 0.05 as the threshold for statistical significance. The statistical results were all analyzed by R (version3.6.2).
Result
Identification of GILncs signature in GC patients
The workflow of our study was presented in Figure 1. As showed in Supplemental Table 1, GILncs were significantly different expression between GU-like group and GS-like (Figure 2(a)). Using 205 differentially expressed GILncs, all 375 patients were arranged into two clusters, the GS-like cluster and the GU-like cluster (Figure 2(b)). Next, we further analyzed the difference between the cumulative somatic mutation value between the GU group and the GS group, and the results showed that the cumulative somatic mutation value of the GU group was significantly higher than that of the GS group (Figure 2(c)). Researchers have discovered UBQLN4 is a newly identified driver of genomic instability, and harmful UBQLN4 mutations in families with autosomal recessive syndromes. Loss of UBQLN4 can lead to increasing sensitivity to genotypic stress and delayed DNA double-strand break repair.
20
Therefore, we compared the expression level of UBQLN4 in the GU group and the GS group, and the results showed that the expression level of UBQLN4 in the GU group was significantly higher than that in the GS group (Figure 2(d)). Flow chart of the steps in the performed analyses. Identification and functional annotations of genomic instability-related lncRNAs in patients with gastric cancer. (A) Heatmap of the top 20 genome instability-associated lncRNAs expressing the most upregulation and downregulation. (B) Unsupervised clustering of 375 GC patients based on the expression pattern of 205 candidate genomic instability-related lncRNAs. The left blue cluster is GS-like group, and the right red cluster is GU-like group. (C) Boxplots of somatic mutations in the GU-like group and GS-like group. Somatic cumulative mutations in the GU-like group are significantly higher than those in the GS-like group. (D) Boxplots of UBQLN4 expression level in the GU-like group and GS-like group. The expression level of UBQLN4 in the GU-like group is significantly higher than that in the GS-like group. Horizontal lines: median values. Statistical analysis was performed using the Mann–Whitney U test. (E) Coexpression network of genomic instability-related lncRNAs and mRNAs based on the Pearson correlation coefficient. The red circles represent lncRNAs, and the blue circles represent mRNAs. (F) Functional enrichment analysis of GO for mRNAs co-expressed lncRNAs. (G) Functional enrichment analysis of KEGG for mRNAs co-expressed lncRNAs.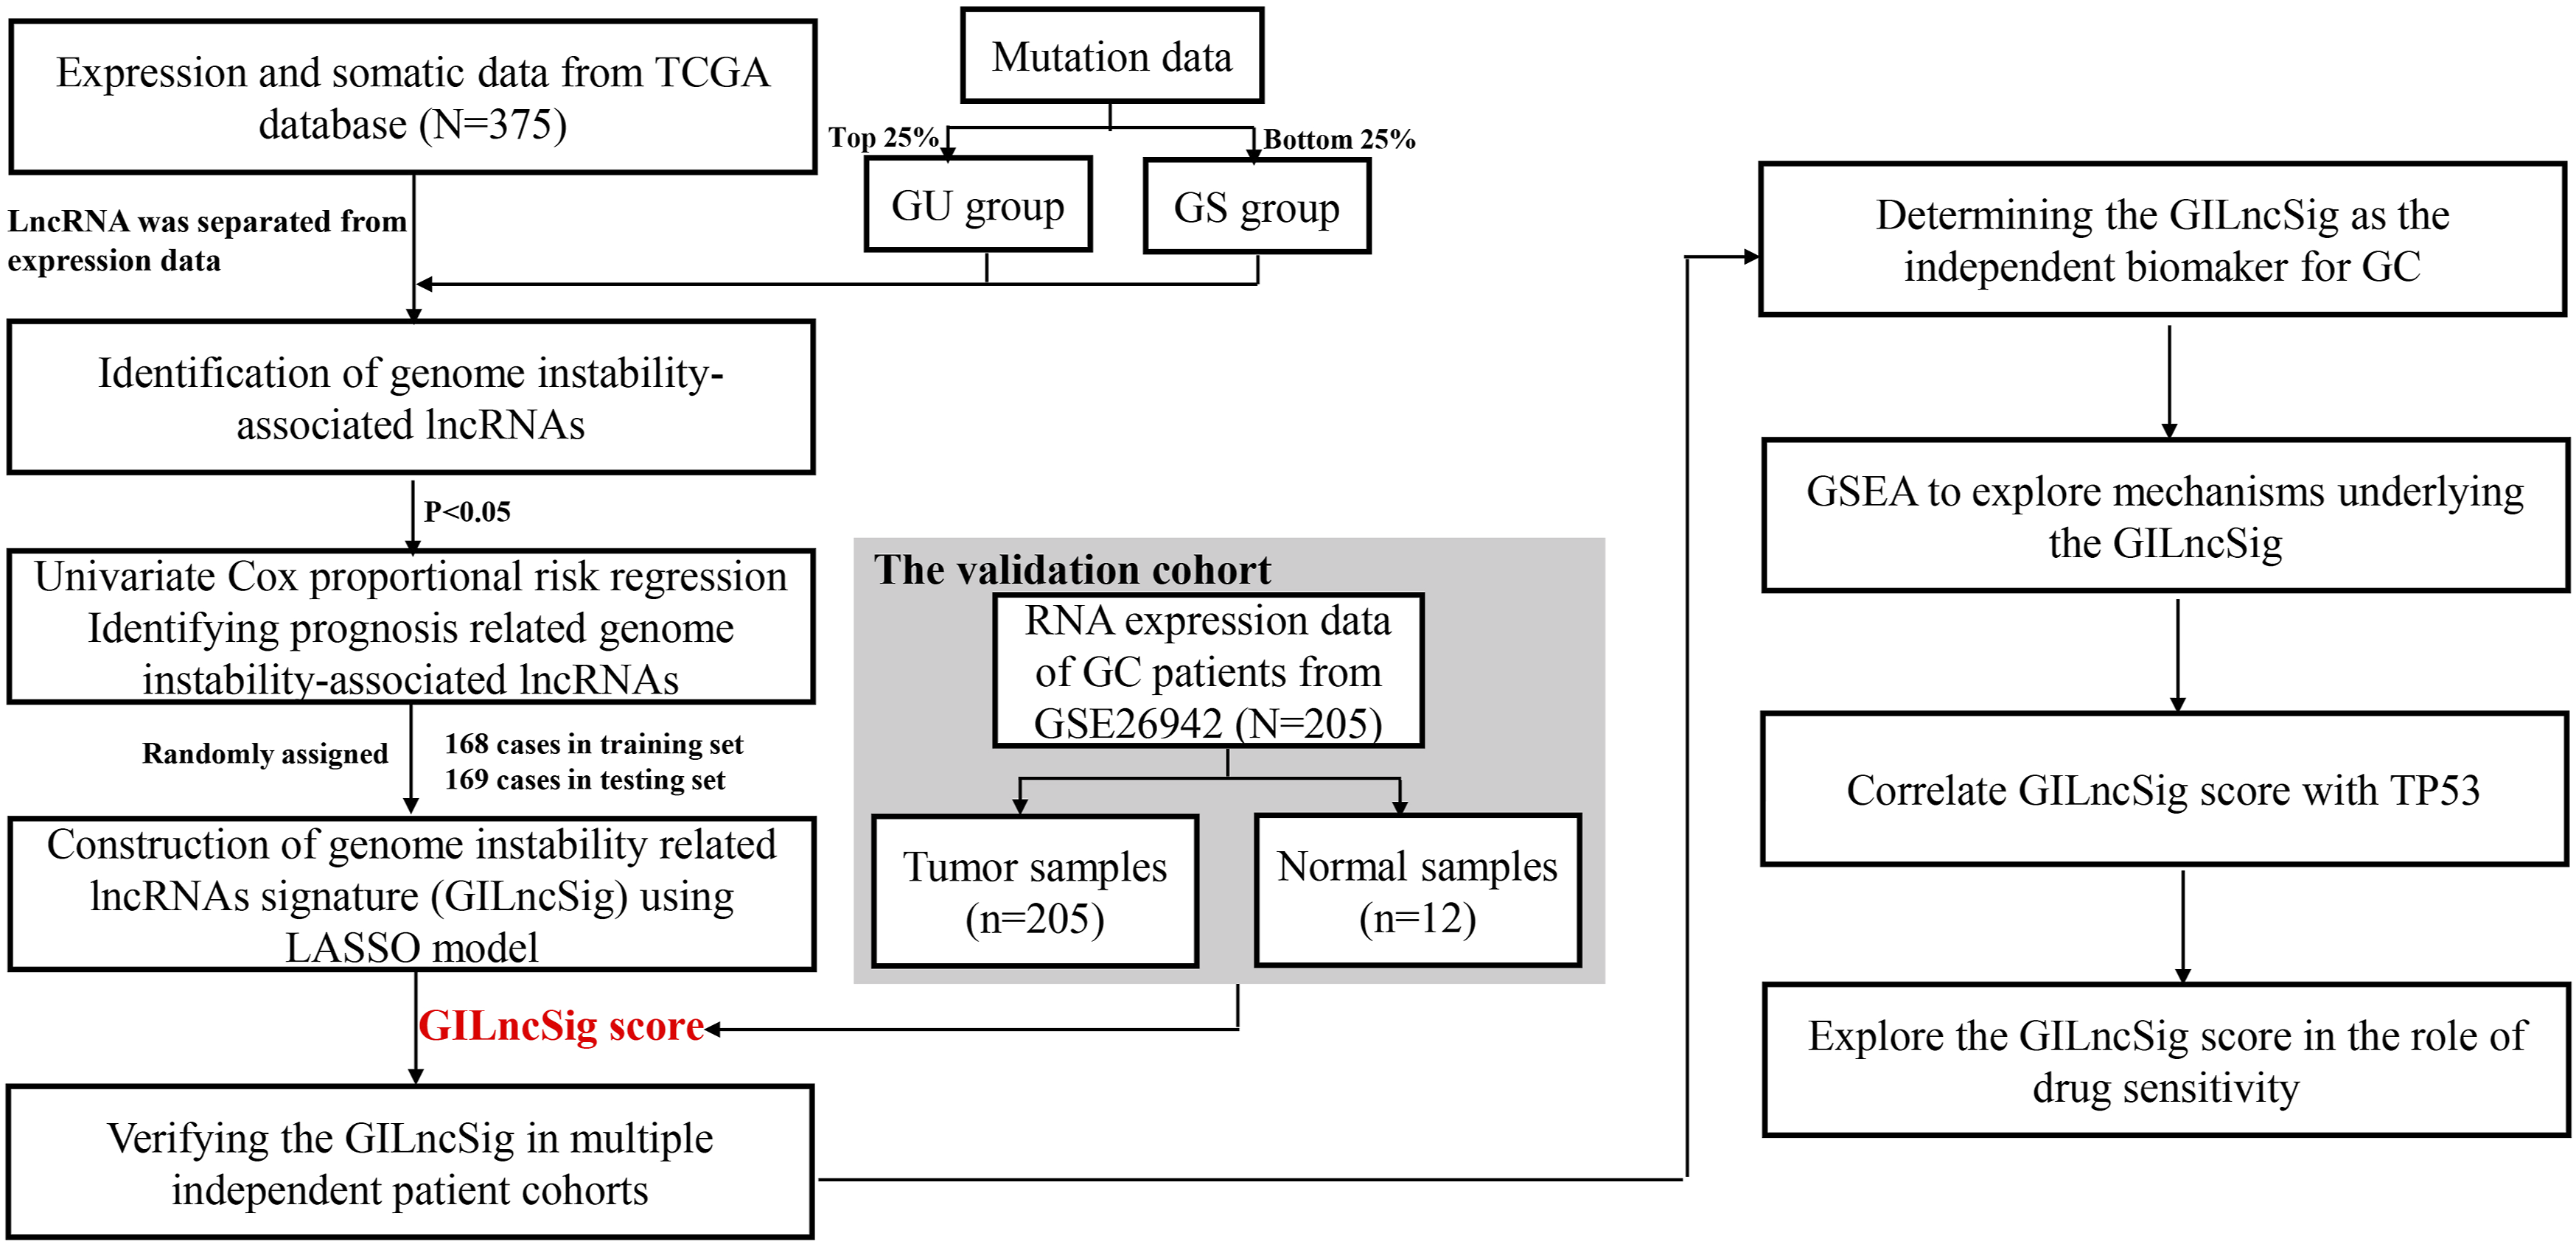

To better understand the functions of these GILncs, we constructed a lncRNA-mRNA coexpression network, where the nodes are lncRNA and mRNA, if they are related to each other, lncRNA and mRNA will be linked together (Figure 1(e)). In addition, functional enrichment analysis of go and kegg for lncRNA-correlated mRNA, go and kegg showed that lncRNA-correlated mRNA are mainly cancer-specific pathways (Figure 2(f) and (g)).
Development of a GILncs signature for prognosis of patients with GC in the training set
Next, 375 GC patients were divided into the training set and the testing set according to best batches. Table 1 shows the clinical characteristic of training set, the testing set and TCGA dataset. In order to predict the clinical outcomes of GC with GILncs signature, we applied LASSO Cox regression algorithm to the 205 GILncs in the training set. Eight GILncSigs were selected to build the risk signature based on the minimum criteria (Supplemental figure 1(a) and (b)). Next, to inspect whether eight GILncSigs were related to prognosis in GC, multivariate Cox regression was employed to analyze the hazard ratio (HR) of 8 GILncSigs in GC. Forest plot showed that high expression levels of 6 genes including RHOXF1-AS1, AL049838.1, LINC01436, LINC01833, AL359182.1, and LINC01614 were significantly related to poor OS of GC patients. While, high expression levels of AC078883.2 and AL365181.3 were closely related to relatively better OS in GC patients (Figure 3(a), Table 2). Furthermore, Kaplan–Meier log-rank analysis revealed that high GILnc score group was significantly correlated with poor overall survival (OS) (Figure 3(b)). To test the efficiency of GILncSig, ROC curve was constructed. The risk score’s AUC was 0.699, indicating that its efficiency to predict prognosis was accurate (Figure 3(c)). Simultaneously, as increasing GILnc score, the chang of expression in the training set (Figure 3(d)). We further analyzed the difference between the cumulative somatic mutation value between the two groups. The result showed the cumulative somatic mutation value in the high GILnc score group was higher than that in the other group (Figure 3(e)). We also compared the expression level of UBQLN4 in two groups. The result showed the UBQLN4 in the high GILnc score group was higher than that in the other group (Figure 3(f)). Identification of the genomic instability-derived lncRNA signature (GILncSig) for outcome prediction in the training set. (A) Forest plots showing the results of the multivariate Cox regression between GILncSig expression and OS. (B Kaplan–Meier estimates of overall survival of patients with low or high risk predicted by the GILncSig in the training set. Statistical analysis was performed using the log-rank test and univariate Cox analysis. (C) Time-dependent ROC curves analysis of the GILncSig at 1-year. (D) LncRNA expression patterns and the distribution of somatic mutation and UBQLN4 expression with increasing GILncSig score. The distribution of somatic cumulative mutations (E) and UBQLN4 expression in the (F) in the high-risk and low-risk groups for GC patients. The red represents the high-risk group, and the blue represents the low-risk group. Horizontal lines: median values. Statistical analysis was performed using the Mann–Whitney U test. Multivariate Cox regression analysis of genome instability-related lncRNAs associated with overall survival in GC

Validation of GILnc score for outcome prediction in the testing set and TCGA set
To examine the robustness of the GILnc score in the testing set and TCGA set. The results showed that patients in the high GILnc score group had a poor survival as compared with low GILnc score group in the testing set and TCGA set (Figure 4(a) and (c)). The risk score’s AUC was 0.671 in TCGA set and 0.634 in testing set, indicating that its efficiency to predict prognosis was accurate (Figure 4(d) and (d)). Simultaneously, as increasing GILnc score, the chang of expression in the testing set and TCGA set (Figure 4(e) and (i)). We further analyzed the difference between the cumulative somatic mutation value between the two groups. The result showed the cumulative somatic mutation value in the high GILnc score was higher than that in the testing set and TCGA set (Figure 4(f) and (j)). We also compared the expression level of UBQLN4 in two groups in the testing set and TCGA set, and the expression level of UBQLN4 in the high GILnc score group was significantly higher than that in the low GILnc score group (Figure 4(g) and (k)). Functional enrichment analysis revealed that the high GILnc score group was enriched in cancer-related pathways, and low GILnc score group was enriched in metabolism-related pathways (Figure 5(a) and (b)). Performance evaluation of the GILncSig in the TCGA set and testing set. Kaplan–Meier estimates of overall survival of patients with low or high risk predicted by the GILncSig in the TCGA set (A) and testing set (C). Statistical analysis was performed using the log-rank test and univariate Cox analysis. time-dependent ROC curves analysis of the GILncSig at 1-year in the training set (B) and testing set (D). LncRNA expression patterns and the distribution of somatic mutation count distribution and UBQLN4 expression for patients in high- and low-risk groups in the training set (E) and testing set (H). The distribution of somatic mutation in patients of high- and low-risk groups in the training set (F) and testing set (I). The distribution of UBQLN4 expression in patients of high- and low-risk groups in the training set (G) and testing set (J). Horizontal lines: median values. Statistical analysis was performed using the Mann–Whitney U test. GSEA on the TCGA cohort to explore mechanisms underlying the 8-GILncSig. (A) GSEA GO identifies high and low risk related signaling pathway in GC. (B) GSEA KEGG identifies high and low risk related signaling pathway in GC.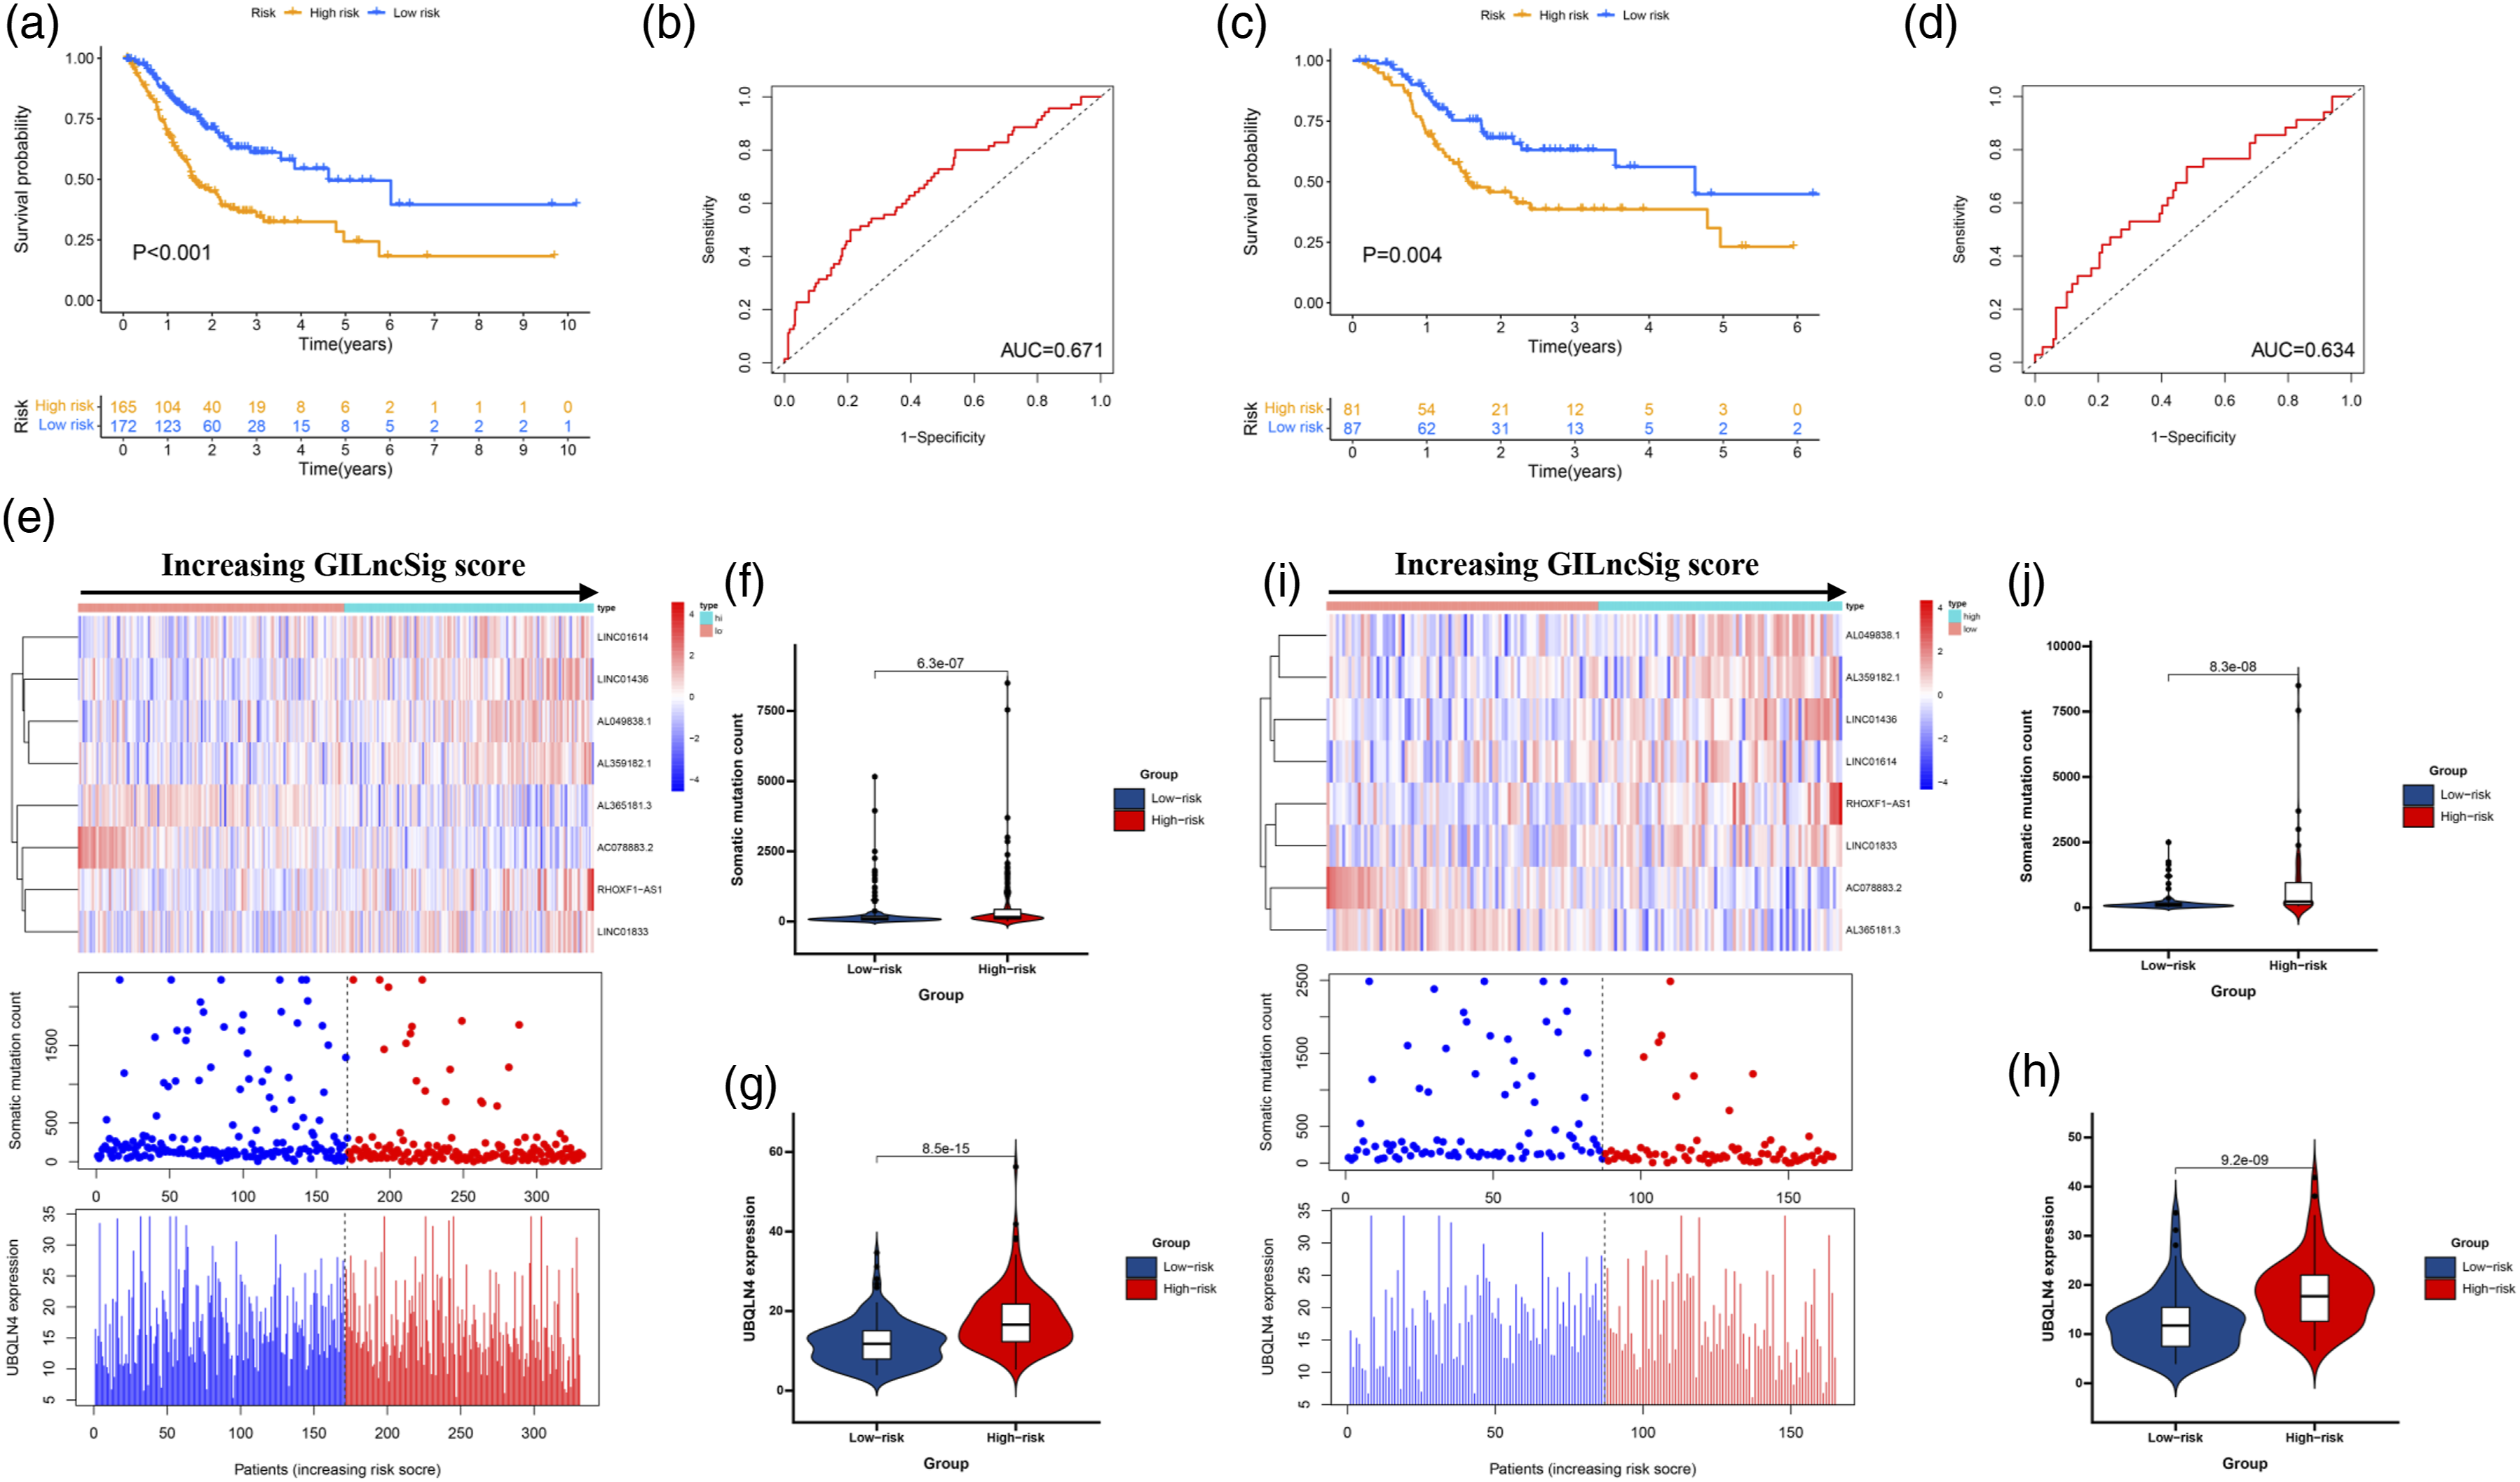

Independent prognostic analysis of GILncs signature
Univariate and multivariate Cox regression to identify independent prognosis predictor in both the TCGA cohort and the GSE26942 cohort.

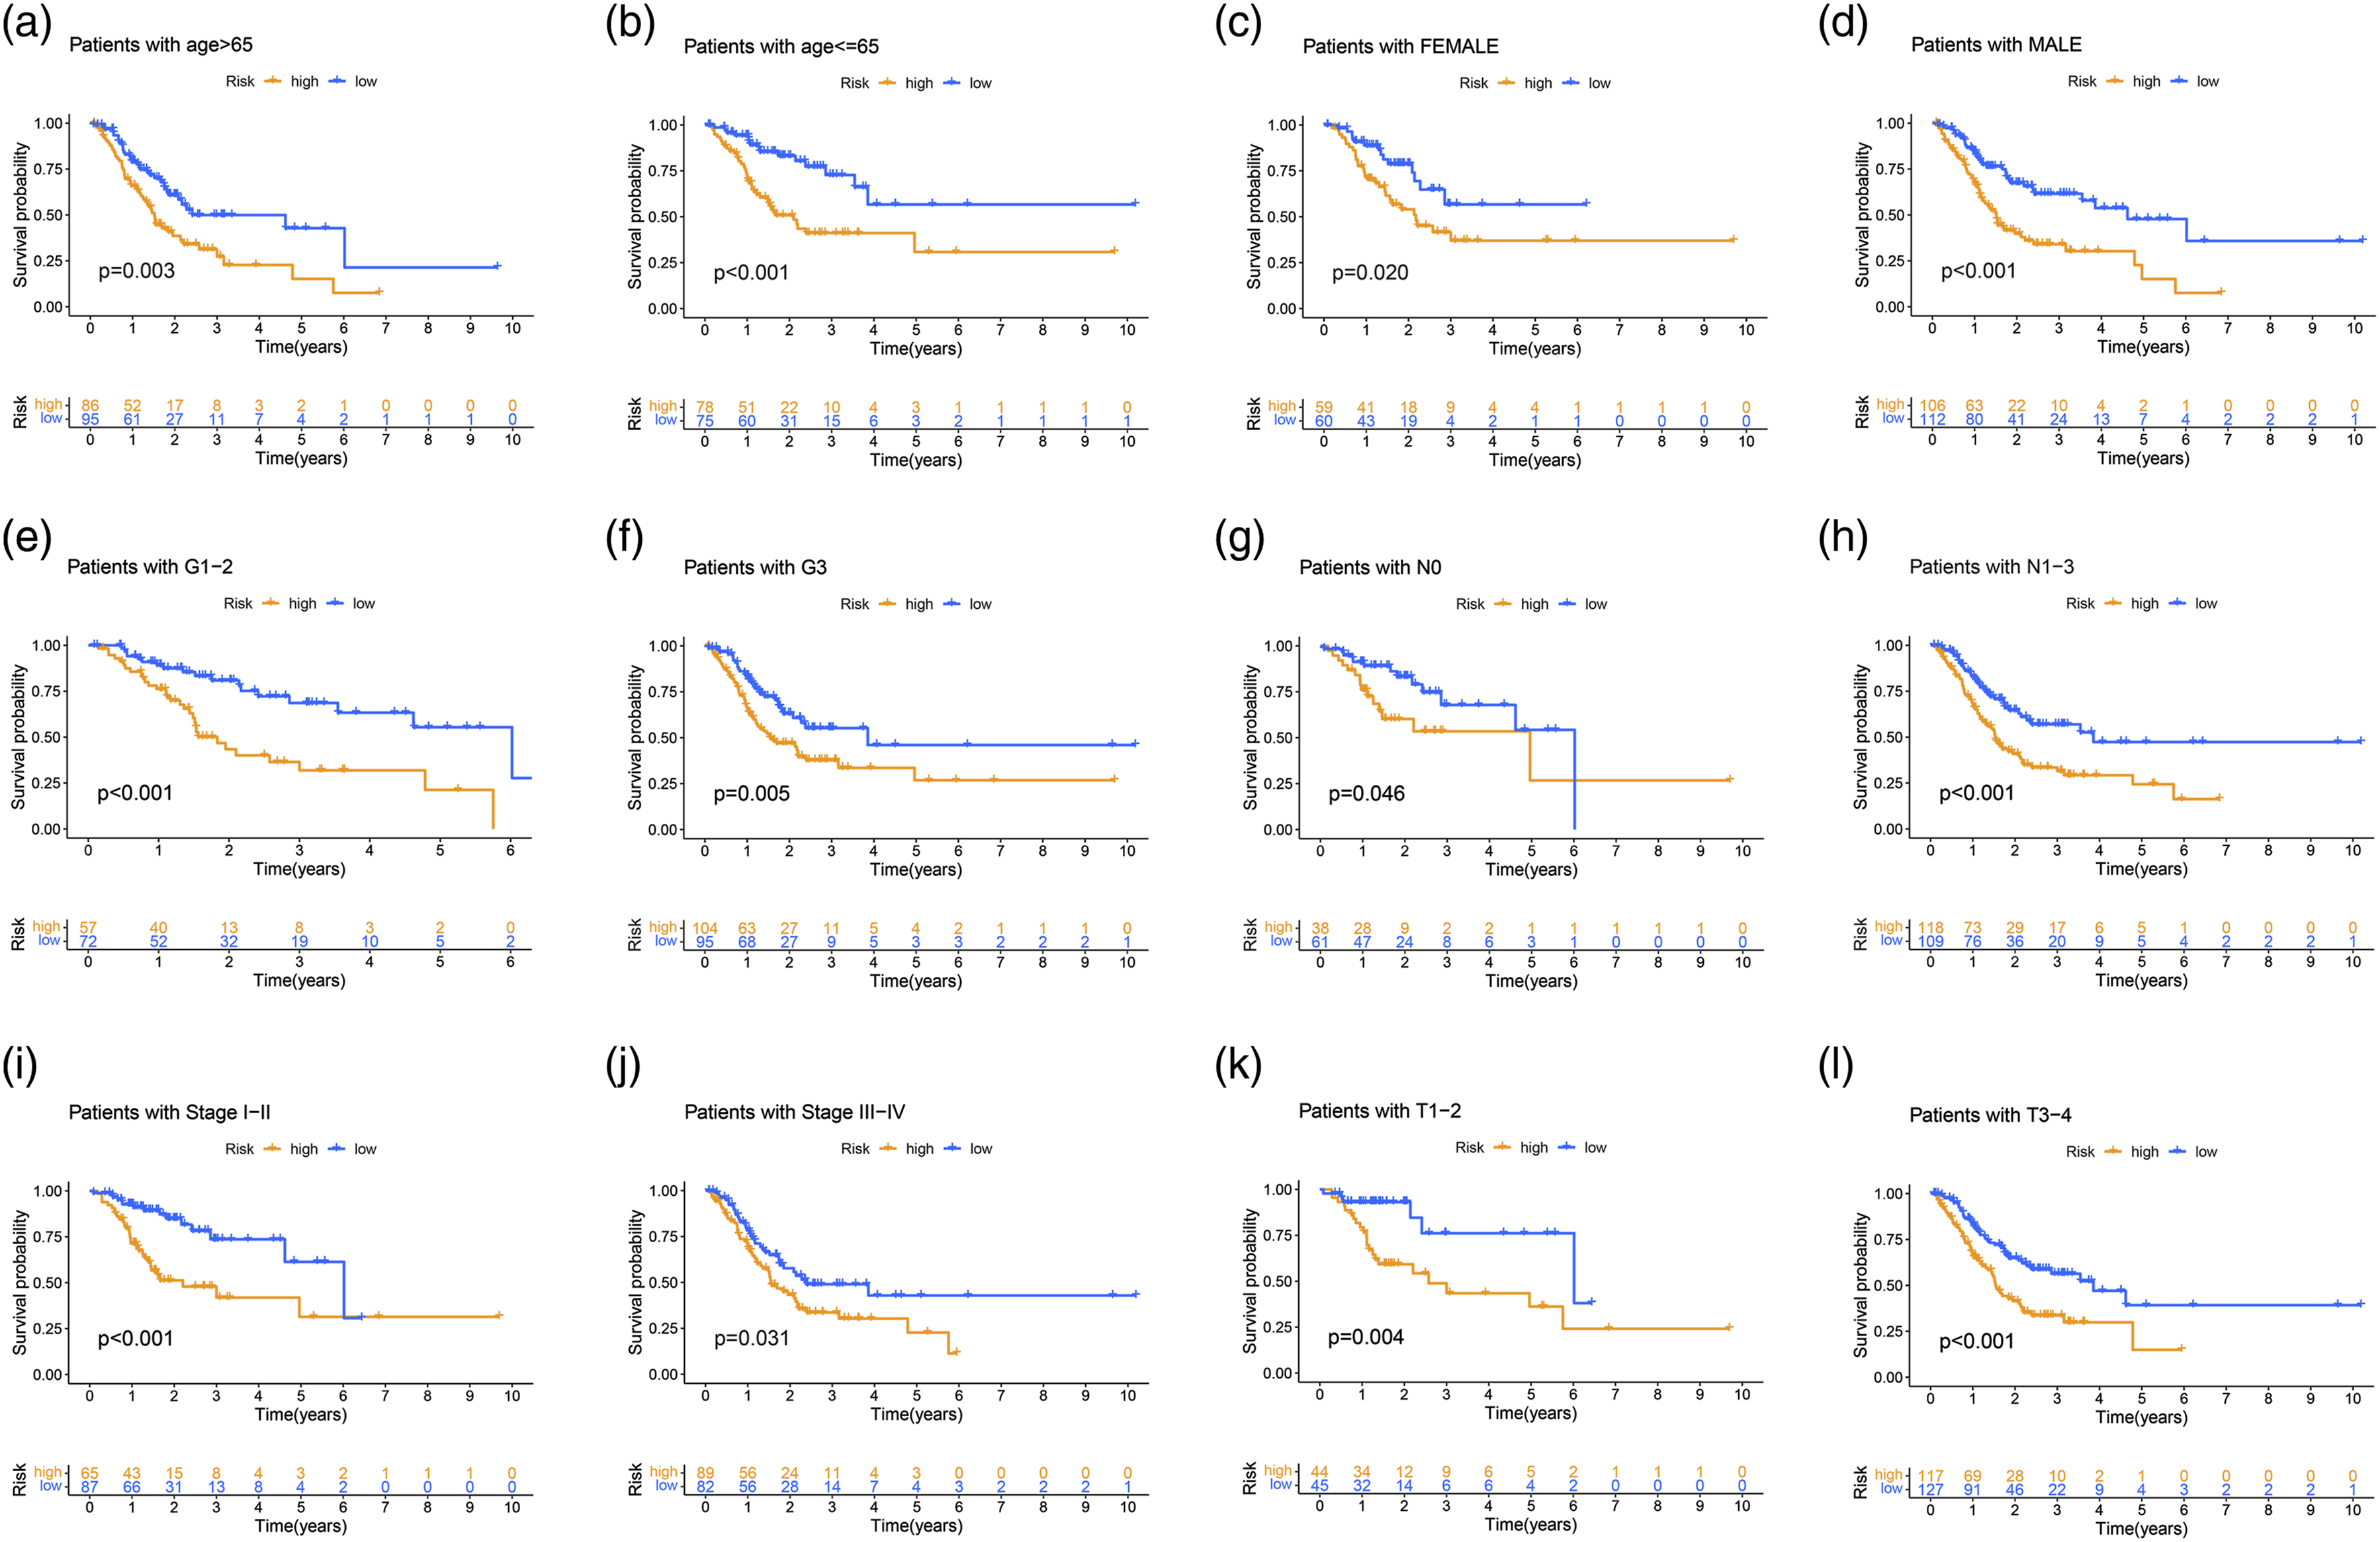
Kaplan–Meier curves were performed for patients stratified by clinicopathological features in the TCGA set. Impact of prognostic risk on overall survival for patients younger than 65 years old (A) and older than 65 years old (B); for female (C) and male patients (D); for patients in G1-2 (E) and G3 (F); for patients in N0 (G) and N1-3 (H); for patients in stage I-II (I) and stage III-IV (J); and for patients in stage T1-2 (K) and stage T3-4 (L).
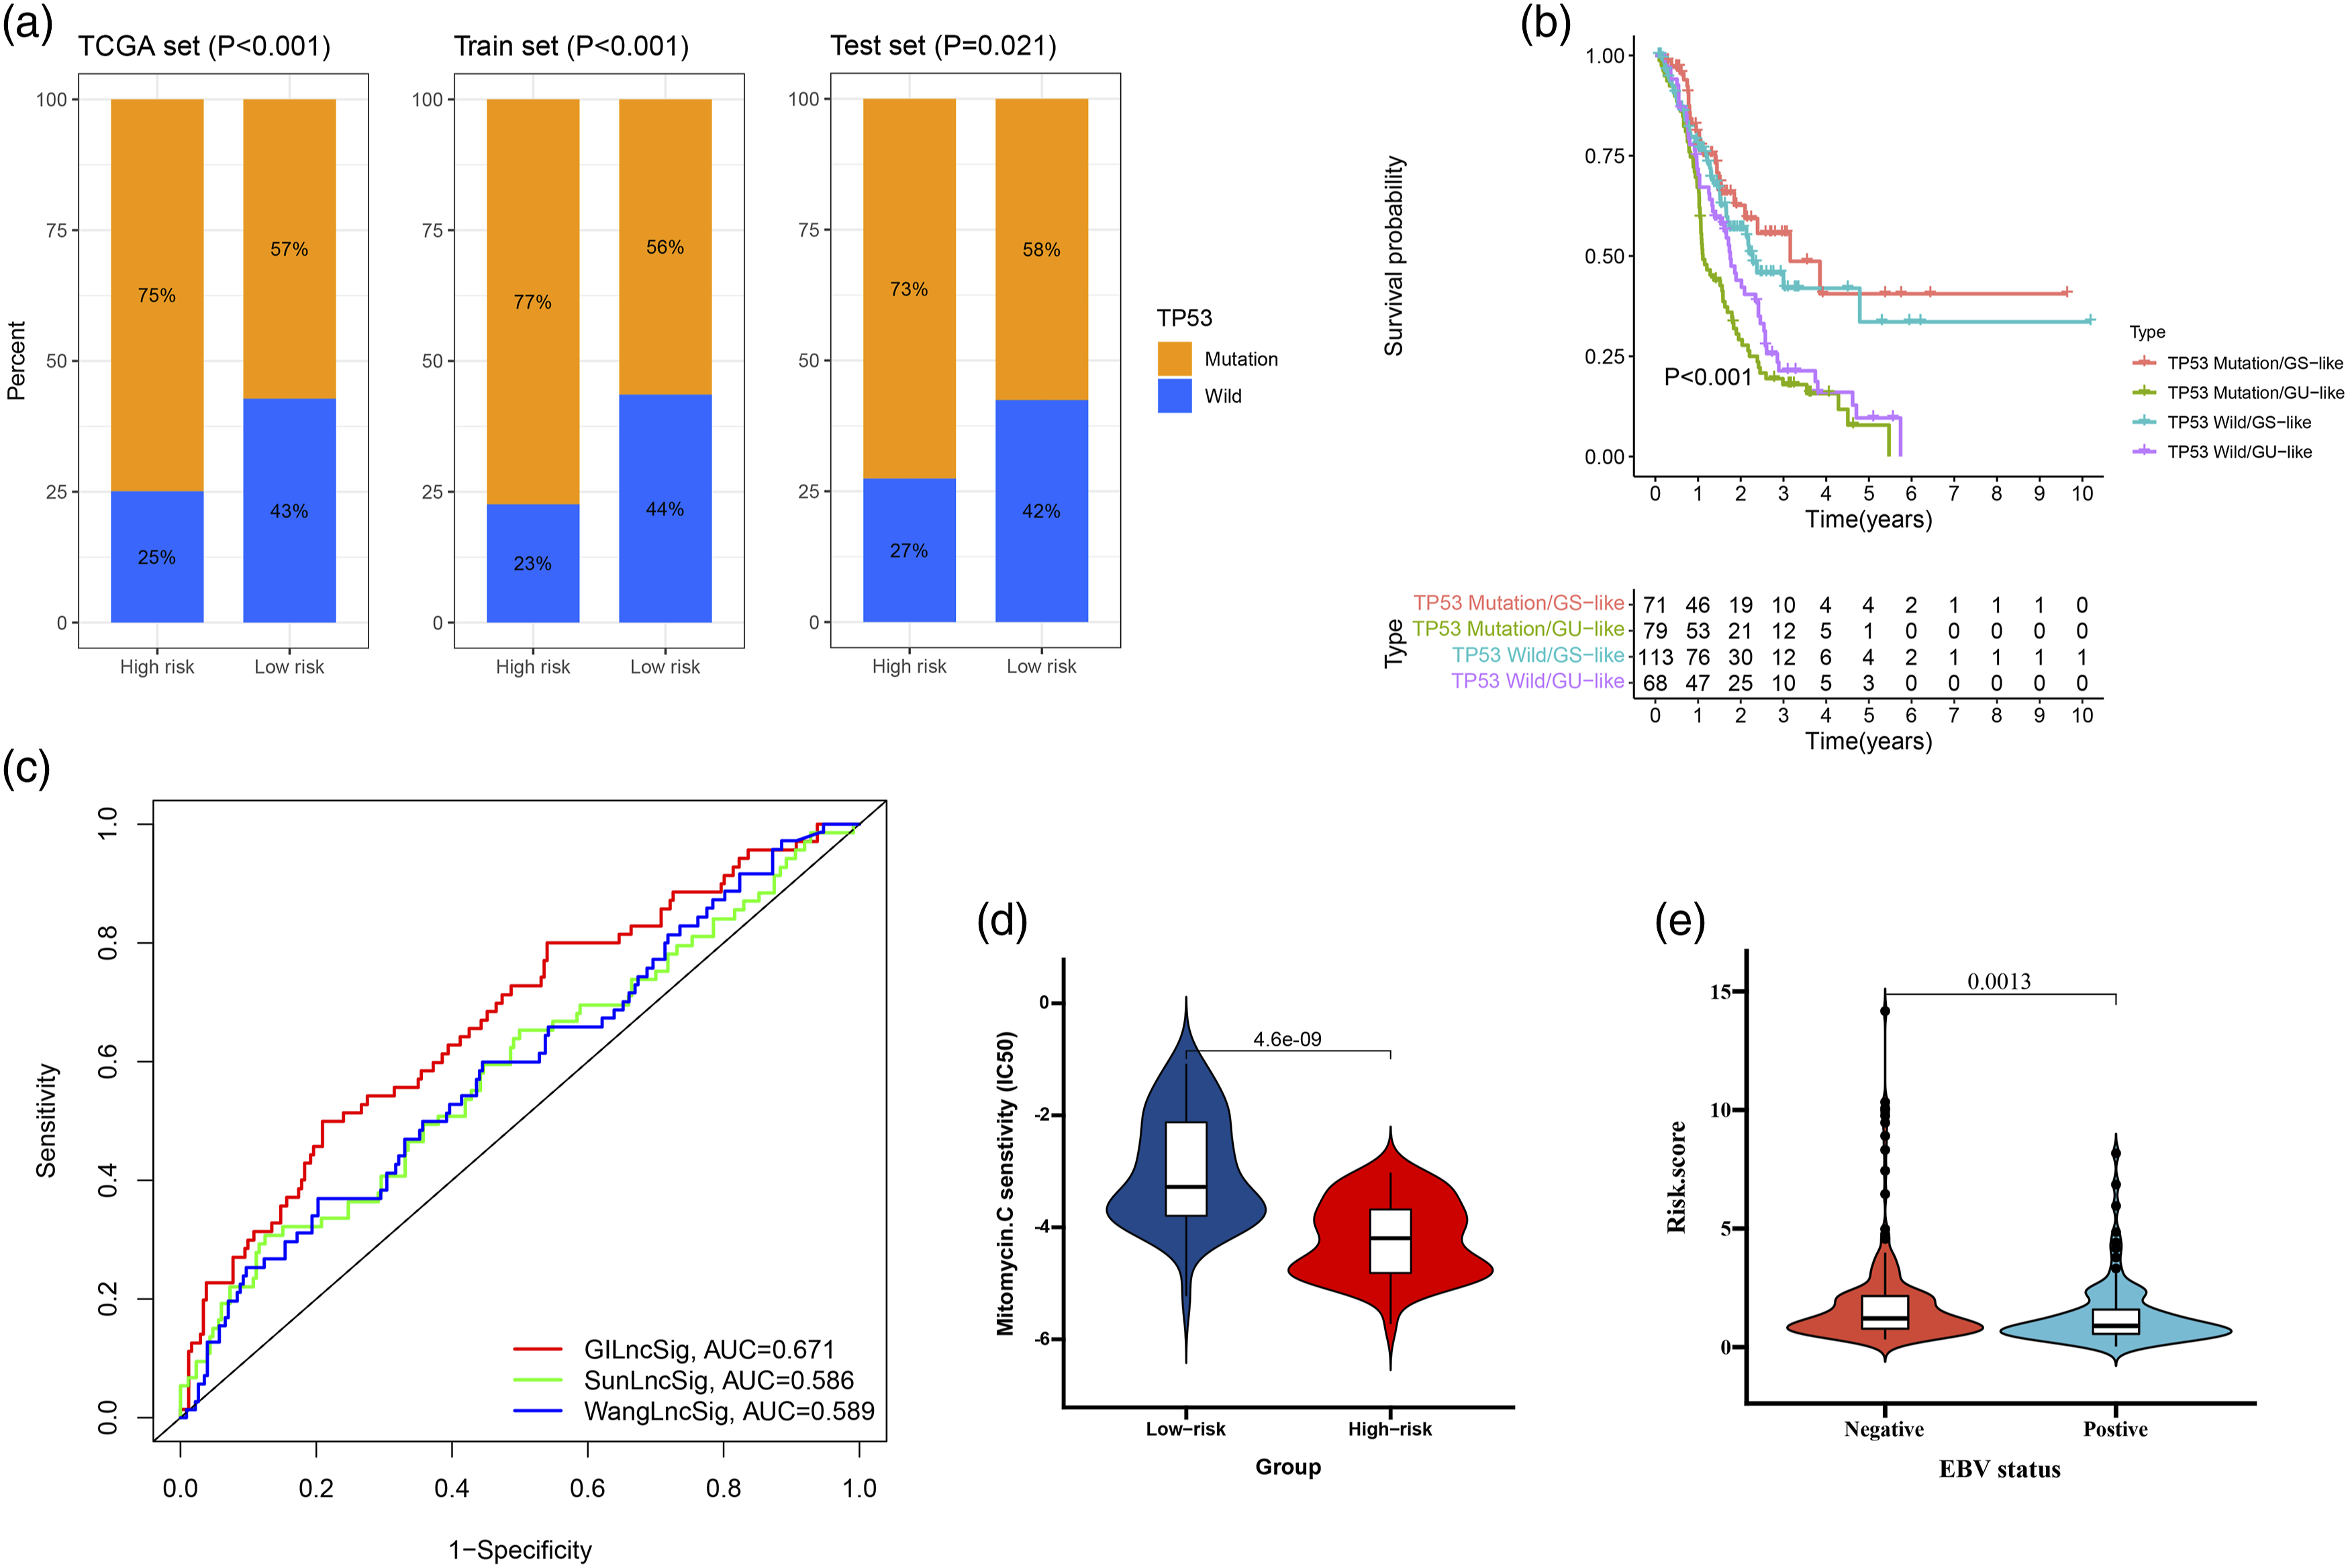
Relationship between the GILncSig and TP53 somatic mutation. (A) The proportion of TP53 mutation in high-risk and low-risk groups in the training set, testing set and the TCGA set. (B) Kaplan–Meier curve analysis of overall survival is shown for patients classified according to TP53 mutation status and the GILncSig. Statistical analysis was performed using the log-rank test. (C) The ROC analysis at 1-year of overall survival for the GILncSig, LilncSig and BailncSig. (D) The drug sensitivity in high-risk and low-risk groups. (E) The EBV status in high-risk and low-risk groups.
Association of GILnc score with TP53
TP53 gene is closely related to the occurrence and development of GC. 21 As shown in Figure 7(a), the proportion of patients with TP53 mutations in the high GILnc score group was significantly higher than that in the low GILnc score group (p <0.05). Then, we divide all patients into TP53 mutation/GS, TP53 mutation/GU, TP53 wild/GS, and TP53 wild/GU group. The results showed that patients in TP53 mutation/GU had a poor survival as compared with TP53 mutation/GS in TCGA set (Figure 7(b)). Furthermore, we compared the resulting GIlnc to the latest published signatures related to lncRNAs; the first signature is the 8-lncRNA signature (SunLncSig), 22 and the second signature is the 3-lncRNA signature (WangLncSig). 23 The results showed that the AUCs for SunLncSig, WangLncSig, and GILncSig OS were 0.586, 0.589, and 0.671 (Figure 7(c)). To gain further insight into the effects of the GILnc score on drug sensitivity, we evaluated the correlation between GILnc score and drug sensitivity, we found that the high GILnc score group showed significantly increased sensitivity to mitomycin drug (Figure 7(d)). In addition, the positive EBV status was significantly correlated with lower GILnc score (Figure 7(e)).
The GILncs signature in the role of PD-1/L1 immunotherapy
We first analyzed the immune infiltration between high-risk and low-risk group, and significantly higher immune infiltration in the high-risk group was observed relative to low-risk group (Figure 8(a)). Next, we download the immunotherapy data of TCGA-STAD patients, and the significant therapeutic advantages and clinical responses to PD-1/L1 immunotherapy in patients with high-risk group compared to those in low-risk group were confirmed (Figures 8(b) to (e)). The GILncs signature in the role of PD-1/L1 immunotherapy. (A) Landscape of immune infiltration in high-risk and low-risk groups. The correlation of GILncs signature with clinical response to anti-PD-1 immunotherapy. (B) CTLA4_negative+ PD-1_negative, (C) CTLA4_negative + PD-1_positive, (D) CTLA4_positive + PD-1_negative, and (E) CTLA4_positive + PD-1_positive.
Construction and assessment of a predictive nomogram
A nomogram incorporating tumor stage and risk group was built to predict 1-year, 3-year, and 5-year OS (Figure 9(a)). Calibration plots showed that the nomogram was better at predicting short-term survival (1- and 3-year) rather than long-term survival (5-year), as indicated by agreement between the predicted survival and actual survival (Figure 9(b)). According to DCA curves, the nomogram also offered the highest net benefit among the three factors examined (Figure 9(c)). Construction and assessment of a predictive nomogram. (A) A nomogram predicting survival probability at 1-, 3-, and 5-year after surgery for GC patients; (B) Calibration curves for the nomogram; (C) DCA curves showing the comparison between the nomogram and tumor stage or risk group alone for predicting 1-, 3-, and 5-year overall survival in GC.
Validation the expression and prognosis of GILncs signature in GSE26942
To further validate GILnc score in GC, GSE26942 cohort was used to measure the GILnc score, and the result showed that compared with normal group, the RHOXF1-AS1, AL049838.1, LINC01436, LINC01833, AL359182.1, and LINC01614 level were significantly higher in GC group, however, the AC078883.2 and AL365181.3 level were significantly lower in GC group (Figures 10(a) to (h)), and Kaplan–Meier analysis revealed that the prognosis of patients with high GILnc score group was significantly poor than that of patients with low GILnc score (Figure 10(i)). Validation of the prognostic performance of GIlncSig on GSE76427 datasets. (A) AL365181.3, (B) LINC01614, (C) RHOXF1-AS1, (D) AL049838.1, (E) LINC01436, (F) AL359182.1, (G) LINC01833, and (H) AC078883.2 expression levels are shown for the GC and normal tissue. (I) Kaplan–Meier curves illustrated that patients with high risk had worse overall survival than those with low risk (P value = 0.030).
Discussion
GC is characterized by genomic instability, researches show that genomic instability play significant roles in the pathological process of chronic atrophic gastritis, gastric ulcer, atypical hyperplasia, intestinal metaplasia, and gastric carcinoma. 24 The occurrence of malignant tumor is a process of multi-gene participation and gradual evolution. 25 The progression from a normal cell to a malignant cell is actually a long process that involves various genetic mutations that lead to a precancerous lesion and then to a malignant tumor. This series of genomic evolution often requires DNA damage or replication abnormalities in chromosomal instability and even the emergence of a “hyperploidy” phenotype. As a result, most tumors often present a complex genetic map at the time of diagnosis, which is very different from that of normal controls, suggesting a high degree of genomic instability in the body at the time of tumor development.26,27 Genomic instability is an important molecular feature of malignancy. 28 The relative stability of the genome is the basic prerequisite for faithful cell passage. 29 Detection of genomic instability is now thought to be an early warning of tumorigenesis. 30 Current studies have also confirmed that genes that cause genomic instability are important clues to the causes of tumors. 31 Moreover, with the continuous improvement of modern molecular biology methods, more and more evidence shows that cancer patients can be timely treated by detecting their genomic instability. 32 Clinically, there have been some targeted drugs targeting genomic instability-related genes, which have brought good news to tumor patients. 33 It has been established that downregulation of these genomic instability-related genes has been clinically found to significantly enhance the sensitivity of cancer patients to platinum-based chemotherapy.34,35 To sum up, it is of great significance to elucidate the relevant mechanisms of genomic instability in tumor cells and to conduct relevant assays to reduce the incidence of tumor, delay the progression and improve the disease condition.
LncRNA is widely defined as a class of RNA molecules whose transcriptional length is greater than 200 nucleotides and lacks an open reading frame. 36 LncRNAs have a potential role in regulating the function of tumor cells. 37 LncRNA regulate gene expression at different levels including chromatin assembly, transcriptional, and posttranscriptional.38,39 Recent studies have shown that NORAD and GUARDIN are essential for genomic stability.40,41 Currently, a variety of tumor genomic instability detection technologies have sprung up rapidly, and the understanding of the role of genomic instability in the development of tumors is gradually deepening. However, the genom-wide identification of genomic instability-related lncRNAs and the systematic exploration of their clinical significance in cancer are still in their infancy. Therefore, it is of great significance to identify lncRNAs associated with genomic instability.
First, we downloaded the GC expression profile data and mutation data. We defined the 25% with the highest frequency as the high mutation group, and the 25% with the lowest frequency as the low mutation group. A total of 205 different lncRNAs were obtained compared with the low mutation group. These lncRNAs were characterized as genomic instability-related lncRNAs. Functional enrichment analysis of mRNAs co-expressed with 205 lncRNAs indicated that these lncRNAs may play an important role in the pathogenesis of GC, which is consistent with other studies. 42 Abnormal repair of DNA damage is directly related to genomic stability. If the mechanism of repairing DNA damage is defective, it will directly lead to the persistence of DNA damage and the harmful changes of cells, until the tumor is triggered. DNA damage is mainly exogenous, such as chemical exposure, UV irradiation, biological hazards, and endogenous, such as in vivo spontaneous DNA damage events, cell cycle process and DNA replication process block. These damages, if not repaired in time, can induce genomic oxidation, alkylation, and even DNA crosslinking, dimer formation, and even DNA breakage.43,44 Therefore, whether DNA damage can be repaired in time and correctly directly affects the maintenance of genome stability.
In the past, the pathological classification of gastric cancer commonly included Lauren classification, Borrmann classification, and WHO classification; however, these classifications have limited significance for the clinical treatment of gastric cancer.45,46 Now, with the progress of genetic technology, the classification of gastric cancer at the molecular level is more meaningful for the selection of targeted drugs for gastric cancer patients. GILncSig divided patients into low GILnc score group and high GILnc score group. Kaplan–Meier analysis revealed that the prognosis of patients with high GILnc score group was significantly poor than that of patients with low GILnc score group. In addition, the high GILnc score group was more sensitive to mitomycin. The above studies suggest that GILnc score classification has the potential to predict prognosis and guide medication.
Our study has some limitations. First, given the individual heterogeneity of GC, the results of our study should be further validated using more multicenter clinical data. Last, our findings have substantial implications for 8 GIlncs of GC, and the detailed molecular mechanisms require further research to explore deeper interactions.
Conclusion
In a conclusion, this study was focused on the analysis of GILnc in GC, and based on GILnc, we constructed the GILnc score model to explore the extensive regulation mechanisms by which genome instability affects tumorigenesis. The relationship between the scoring system and clinical outcomes in GC patients was demonstrated, and model validation was performed using external dataset from the GEO databases. This study provides novel insights into the role of genome instability in GC development.
Supplemental Material
Supplemental Material - A novel 8-genome instability-associated lncRNAs signature predicting prognosis and drug sensitivity in gastric cancer
Supplemental Material for A novel 8-genome instability-associated lncRNAs signature predicting prognosis and drug sensitivity in gastric cancer by Changhong Yi, Xia Chen, Jing Song, Minghui Ma, Xiaolu Yuan and Chaohao Zhang in International Journal of Immunopathology and Pharmacology
Footnotes
Authors’ contributions
Dr. Yuan, Xiaolu and Dr Zhang, Chaohao help to download TCGA data. Changhong Yi and Xia Chen designed the study, performed statistical analysis, and drafted the article. Jing Song helped to draft the article. Minghui Ma and Jing Song conceived the study, participated in its design and coordination, and helped to draft the article. All authors read and approved the final manuscript.
Declaration of conflicting interests
The author(s) declared no potential conflicts of interest with respect to the research, authorship, and/or publication of this article.
Funding
The author(s) received no financial support for the research, authorship, and/or publication of this article.
Data availability
All data used in the study can be downloaded from the TCGA data repository (https://gdac.broadinstitute.org/; accessed 26 May 2021) and the GEO database (https://www.ncbi.nlm.nih.gov/geo/query/acc.cgi?acc=GSE26942; accessed 26 May 2021).
Ethical statement
Considering all data in this study was obtained from Public DataBase, the ethics approval and informed consent were not provided.
Supplemental Material
Supplemental material for this article is available online.
References
Supplementary Material
Please find the following supplemental material available below.
For Open Access articles published under a Creative Commons License, all supplemental material carries the same license as the article it is associated with.
For non-Open Access articles published, all supplemental material carries a non-exclusive license, and permission requests for re-use of supplemental material or any part of supplemental material shall be sent directly to the copyright owner as specified in the copyright notice associated with the article.