
Abstract
It has been reported that hyperhomocysteinemia (HHcy) is associated with neurodegenerative and cardiovascular diseases. However, little is known about brain histomorphology, neuronal organelles, and hairy enhancer of split (hes) expression under HHcy. In this study, non-HHcy and HHcy induced by high-methionine diet in apolipoprotein E–deficient (Apo E−/−) mice were comparatively investigated. The histomorphology, ultrastructure, autophagosomes, apoptosis, and expression of proteins, HES1, HES5 and P62, were designed to assess the effects of HHcy on brain. The results showed that compared to the non-HHcy mice, the HHcy group had an increase in autophagosomes, vacuolization in mitochondria, and neuron apoptosis; treatment with folate and vitamin B12 reduced the extent of these lesions. However, the elementary histomorphology, the numbers of cortical neurons, and Nissl bodies had no significant difference between the HHcy and the non-HHcy groups or the group treated with folate and vitamin B12. Immunohistochemistry and immunofluorescence demonstrated a decrease in HES1- or HES5-positive neurons in the HHcy group when compared to the non-HHcy groups, wild-type, and Apo E−/− controls, or the HHcy mice with folate and vitamin B12 supplement. Western blots showed that HHcy induced a decreased expression of HES1 and HES5, or P62, in which the expression of HES1 and P62 was elevated by treating with folate and vitamin B12 supplement. These results suggest that HHcy-enhanced brain damage is associated with increased autophagy and neuronal apoptosis in Apo E−/− mice, in which downregulation of hes1 and hes5 is involved.
Introduction
Homocysteine (Hcy) is a sulfur-containing amino acid and an intermediate product in the biosynthesis of methionine and cysteine. Under normal circumstances, Hcy can be re-methylated to form methionine. Several enzymes such as N5, N10-methylenetetrahydrofolate reductase, cystathionine-β-synthase (CBS), methionine synthase (MS), and betaine-homocysteine methyltransferase (BHMT) are involved in the biosynthesis of Hcy.1–3 Vitamin B12 (methylcobalamin) as coenzyme of MS and folate as the methyl donor are also involved in the metabolism of Hcy. 3 In humans, plasma Hcy contents greater than 15 µmol/L are classified as hyperhomocysteinemia (HHcy).1,2 HHcy is a common cause contributing to the outcomes in various diseases such as cardiovascular diseases, stroke, and neurodegenerative diseases.2,3 In previous studies, HHcy has been shown to promote the development of cardiovascular diseases, 1 such as atherosclerosis,4,5 hypertension, and thrombosis in both mice and humans.6,7 HHcy, as an independent risk factor, may worsen the pathogenesis and progression of Alzheimer’s disease.8,9 In elderly subjects, HHcy could be associated with biological aging and cognitive impairment.9,10 Several studies suggest that there may be some ways and molecular mechanisms to be involved in pathogenesis and progression of various diseases under HHcy.5,11 Endothelial cell dysfunction aggravated by HHcy has been shown in cultured cells and endothelia of patients with angina.1,12,13 HHcy enhances necrosis in brains affected by ischemia/reperfusion or stroke.14,15 However, the histological and ultrastructural changes induced by Hcy, as an independent factor, are not yet confirmed in the brain or neurons in vivo. Several experimental studies have shown that elevated plasma Hcy levels, which is an excitatory amino acid, accelerate the sensitivity of neurons to exogenous cytotoxicity and oxidative damage.15,16 Additionally, cyclin A transcription may be suppressed in endothelial cells under HHcy conditions.12,13 In rats with deficiencies in spatial learning and memory, HHcy is associated with alterations in neurotrophic factors.10,17
It has been suggested that inappropriateness in the proliferation and differentiation of neuronal cells occurs in neurodegenerative diseases, aging, and even cognitive impairment.8,18–20 It is possible that HHcy has an inhibitory effect on signaling pathways such as Notch/hairy enhancer of split (hes) associated with regeneration for neurons but vascular smooth muscle cells (VSMCs).5,21,22 The Notch signaling pathway is very important for the maintenance of proliferation and differentiation of neuronal stem cells in humans and most of the mammals.23,24 hes1 and hes5 are widely expressed in tissues such as the brain and pancreas in embryonic and adult mammals.25,26 HES1 and HES5, both Notch targets, are essentially involved in regulating the progenitor pool of the neocortex and retina in mice.27,28 HES1 and HES5 deficiency or loss is related to depletion of progenitors and promotion of premature neuronal differentiation, which induce serious neurological abnormalities in the embryo. 29
Some studies have associated HHcy with neurodegenerative diseases;3,8,17 HHcy or disruption of Hcy metabolism could interfere with the regeneration and repair potential in the central nervous system (CNS). 16 The study conducted in vitro has shown that HHcy may also inhibit the cardiac stem cell–mediated cardiac repair. 30 The Notch signaling pathway and hes1 contribute to maintaining the progenitor state of nervous cells and ensuring proper differentiation.26,29 Increased expression of HES1 is required when a stable cell tries to proliferate.25,29,31 Therefore, we speculate that downregulated expression of HES1 or HES5 and neuronal injury could be induced to some extent by HHcy.
In this study, HHcy was induced in apolipoprotein E–deficient (Apo E−/−) mice with a high-methionine diet as in previous studies.4,5 Histomorphological and cellular changes in brain tissue and neurons were detected by optical and electron microscopy. The apoptosis cells were demonstrated by the terminal deoxynucleotidyl transferase-mediated dUTP-biotin nick end labeling (TUNEL). The expression of HES1 and HES5 was investigated by immunohistochemistry, immunofluorescence, and western blotting. The expression of P62, a molecular marker of autophagy, was demonstrated by western blotting.
Materials and methods
Animals and reagents
All animals were male C57BL/6J mice that were either normal wild-type mice (Wt group, n = 12) or Apo E−/− mice (Apo E−/− group, n = 36). All the Apo E−/− mice were purchased from Jackson Laboratory (Bar Harbor, ME, USA). After 1 week of acclimatization, Apo E−/− mice were randomly divided into three groups (n = 12 per group): the Apo E−/− control group (Apo E−/− group), the Apo E−/− with HHcy group, and the Apo E−/− with HHcy treated with vitamins, folate, and vitamin B12 (C63H88CoN14O14P, methylcobalamin) group (MFB group). The Apo E−/− mice with a high-methionine diet were used for HHcy models as previously described.4,5 The mice in the Apo E−/− and Wt groups were fed with a general diet AIN-93G (Shanghai Saab Biological Co., Ltd, Shanghai, China). The mice of the HHcy and MFB group were fed with the general diet (AIN-93G) supplemented with 1.7% methionine (GB 14924.2). Meanwhile, the mice of the MFB group were fed with vitamins supplemented with 0.006% folate (GB 14924.2) and 0.0004% vitamin B12 (GB 14924.2; Shanghai Saab Biological Co., Ltd). All animal use and procedures were in strict accordance with the Chinese Laboratory Animal Use Regulations. Efforts were made to minimize animal stress and to reduce the number of mice used for this study. The animal studies were approved by the Ethical Committee of Ningxia Medical University (2013-58 for 81360184 and 2015-100 for 81560208).
Reagents were purchased from Boster Biotechnology Co (Wuhan, China) and Beijing Zhongshan Golden Bridge Biotechnology Co (Beijing, China), except for the monoclonal anti-NeuN and anti-glial fibrillary acidic protein (GFAP) antibodies (Cell Signaling Technology, Beverly, MA, USA), polyclonal anti-Hes1 and anti-Hes5 (Millipore, Shanghai, China), polyclonal anti-P62 (Cell Signaling Technology), horseradish peroxidase–conjugated anti-mouse secondary antibody (Cell Signaling Technology), Microplate BCA Protein Assay Kit (Thermo Scientific, Shanghai, China), and glyceraldehyde 3-phosphate dehydrogenase (GAPDH; Sigma, St. Louis, MO, USA).
Preparation of samples
After 18 weeks of 1.7% methionine supplementation, all animals were anesthetized by an intraperitoneal injection of 4% sodium pentobarbital (30 mg/kg). Blood was immediately collected in EDTAK3-tubes. Half of the brains were fixed in 4% paraformaldehyde for histopathology, immunohistochemistry, and immunofluorescence analysis (n = 12 per group). The other halves of the brains were prepared into 1 mm × 1 mm × 2 mm blocks that included the frontal cortex and were fixed with 3% glutaraldehyde for transmission electron microscope analysis (n = 6 per group), while the remainder of the another six halves (n = 6 per group, which included the cerebral hemisphere, not included cerebellar hemisphere and olfactory bulb) were stored at −80°C for western blotting.
Measurement of plasma Hcy
Plasma was collected by centrifugation of blood at 3000g at 4°C for 10 min. The plasma was mixed in 10% buffered solution containing 1% NaBH4, 10% C2H6OS, 5% ethylenediaminetetraacetic acid (EDTA), 0.1% NaOH, 0.5% C4H10O2S2, 0.5% 1-octyl alcohol, and 0.05% HCl for 1 min at room temperature; it was adjusted by NH4NO3/HCOONH4 buffered solution containing C10H11BrN2O, pH 3.6; it was filled in a C18 reversed phase chromatography, 150 mm × 4.6 mm; acetonitrile (C2H3N) gradient elution was carried out; the retention time used was 4.14 min. Plasma total Hcy concentrations (n = 12, each group) were measured by a high-performance liquid chromatography (HPLC; Model-L2000; Hitachi, Tokyo, Japan).
Histopathology
A series of consecutive sections (4 µm in thickness) were collected from paraffin-embedded blocks for conventional histopathologic examination with hematoxylin and eosin (HE) staining, with three sections per mouse (n = 12 per group). The images, with no overlapping, of the frontal cortex were captured with a microscope (DM4000 LED; Leica, Wetzler, Germany) under a high power field (HPF; 400×), and the number of neurons per HPF was counted and analyzed with a computer imaging analysis system (Leica Application Suite 4.5). The pathological changes, such as necrosis and edema, were comparatively observed based on the histology of the Wt group. Pischinger staining was used to show the Nissl bodies and evaluate the degeneration of neuron based on the mean optical density. 32
Electron microscopy
The blocks containing the frontal cortex were fixed in 3% glutaraldehyde overnight at 4°C. Specimens were post-fixed with osmium tetroxide (1% in phosphate buffered saline (PBS)) for 2 h at room temperature, dehydrated in an acetone series, and then embedded in epoxy resin. Slices of 60 nm thickness were sectioned (n = 6 per group) and stained with uranyl acetate, and the ultrastructural changes in the neurons (50 cells per mouse) were used for transmission electron microscopy (Hitachi H7800) analysis as previously described.33,34 The normal mitochondria were defined as vacuolar structures in which a double membrane and cristae could be clearly observed, and vacuolization in mitochondria (VM) was defined as vacuolar structures in which an expanded volume and cristae loss more than 50%. The autophagosomes (ASs) including lipofuscins were defined as vacuolar structures containing electron dense material and autophagic vacuoles. 34 The ratios of the neuron with VM or AS were analyzed among the groups.
TUNEL staining
TUNEL staining was performed according to the manufacturer’s instruction (Zymed, San Diego, CA, USA). In brief, after being washed three times in Tris-HCl (pH 7.7), sections were treated with 2% H2O2 for 10 min at room temperature to quench endogenous peroxidase activity. Sections were then incubated with terminal deoxynucleotidyl transferase enzyme solution at 37°C for 1 h. Sections were dipped in 300 mM NaCl and 30 mM sodium citrate solution for 15 min at room temperature to terminate the reaction. The reactive signals were visualized by 3,3′-diaminobenzidine (DAB). To determine whether apoptotic cells were neurons or glial cells, we performed GFAP double-labeling. The number of TUNEL-positive neurons per HPF was counted and analyzed with a computer imaging analysis system (Leica Application Suite 4.5). The average ratio of TUNEL-positive neurons per HPF was obtained as per the following formula: numbers of TUNEL-positive neuron/numbers of TUNEL-positive and TUNEL-negative neuron.
Immunohistochemistry and immunofluorescence labeling
The sections (n = 12 per group) were treated with 3% H2O2 for 10 min at room temperature to quench endogenous peroxidase activity. The sections, which were merged in citrate solution, were briefly heated in a microwave oven to retrieve antigen before nonspecific binding sites were blocked with 5% bovine serum albumin (BSA) in PBS/0.2% Triton X-100 (TX)-100 for 30 min. After incubation with the primary antibody (NeuN or HES1/HES5, 1:200 dilution) at 4°C overnight, the sections were first incubated with biotinylated secondary antibody (1:1000) and then an avidin–biotin complex was conjugated to horseradish peroxidase. The slides were stained with DAB and counterstained with hematoxylin. Sections incubated without primary antibody were used as negative controls. The images were captured, and the total neurons and HES1- or HES5-positive neurons were analyzed with a computer imaging analysis system (Leica Application Suite 4.5). Immuno-tagged HES1 or HES5 was located in the nucleus with colors characterized as brown, yellow, and weak yellow. The total number of neurons and the number of neurons showing each color in the frontal cortex were determined under a HPF. The average numbers of neurons labeled by HES1 or HES5 per HPF were analyzed and compared among the Wt, Apo E−/−, HHcy, and MFB groups. The average ratio of HES1- or HES5-labelled neurons per HPF was obtained.
For immunofluorescence labeling, the sections were blocked with 3% BSA and incubated overnight with anti-HES1 or -HES5 and anti-GFAP at a 1:100 dilution. The sections were then incubated with tetramethylrhodamine (TRITC)-labeled anti-rabbit secondary antibody (1:200 dilution). The sections were observed using a fluorescence microscope (Olympus FV100 IX81, Tokyo, Japan). The HES1- or HES5-positive neuronal cells per HPF were counted.
Western blotting
Cerebral hemisphere specimens including the frontal cortex (but lacking the cerebellar hemisphere and olfactory bulb) were homogenized in a suspension buffer containing 10 mM Tris-HCl, 1 mM EDTA, 1 mM phenylmethylsulfonyl fluoride (PMSF), 1 mM pepstatin, and 1% w/v sodium dodecyl sulfate (SDS) using an ultrasonicator and then centrifuged at 10,000g for 15 min at 4°C. The supernatant was collected, and the protein content from each sample was measured using the Microplate BCA Protein Assay Kit (Thermo Scientific). Equal amounts of protein were loaded into each lane, separated on 10% NuPAGE Bis–Tris gels, and then transferred to a poly vinylidene difluoride (PVDF) membrane. The primary antibodies used were HES1 or HES5 (1:1000 dilution), P62 (1:1500 dilution), and GAPDH (1:5000 dilution). GAPDH was used as a loading control. The secondary antibodies (1:1000) were horseradish peroxidase–conjugated anti-mouse IgG. Western blot analysis was performed using a chemiluminescence system. The above procedures were performed with three duplications. Band densitometry was measured using the Gene Genius Gel Imaging System (Bio-Rad, Cambridge, UK). The relative values were calculated after normalization to the loading control.
Statistical analysis
All values were expressed as the mean ± standard deviation. Using SPSS 20.00, one-way analysis of variance (ANOVA) followed by Tukey’s test and two-tailed unpaired t-test were used to analyze the differences among the four groups. Statistical significance was defined as P < 0.05.
Results
Plasma Hcy
The total plasma Hcy (tHcy) concentration in the Wt and Apo E−/− groups was in normal level, 3.24 ± 1.62 and 6.47 ± 2.66 µmol/L, respectively. The plasma concentration of tHcy was remarkably elevated in the HHcy mice (tHcy = 23.71 ± 6.30 µmol/L, in moderate HHcy) fed the methionine-rich diet, as expected, and it was significantly higher than the concentration in the Wt, Apo E−/−, and MFB groups (P = 0.0001, with two-tailed unpaired t-test). In contrast, mean tHcy in mice fed the methionine-rich diet and vitamins supplemented, folate and vitamin B12 (MFB group), attenuated the rise in tHcy (tHcy = 11.81 ± 2.94 µmol/L, in normal level, P = 0.0001, with two-tailed unpaired t-test).
Effect of HHcy on histomorphology of brain and neurons
The normal histology of brains in HE-stained sections in the Wt mice is shown in Figure 1. No obvious pathological changes such as necrosis and edema were observed in the Apo E−/−, MFB, and HHcy groups (Figure 1(a)). To observe HHcy effect on the neurons’ amount, we measured neurons labeled with NeuN. As shown in Figure 1(b), the number, size, and distribution of neurons were similar among the Wt, Apo E−/−, HHcy, and MFB groups (Figure 1(b)). The Nissl bodies visualized by Pischinger staining were abundant in the cortical neurons in the mice with or without HHcy (Figure 1(c)). There were no differences in the numbers of neuron labeled by NeuN or mean optical density of Pischinger staining in the cortex among the Wt, Apo E−/−, HHcy, and MFB groups (Figure 1(d), P = 0.1674 and P = 0.0801).
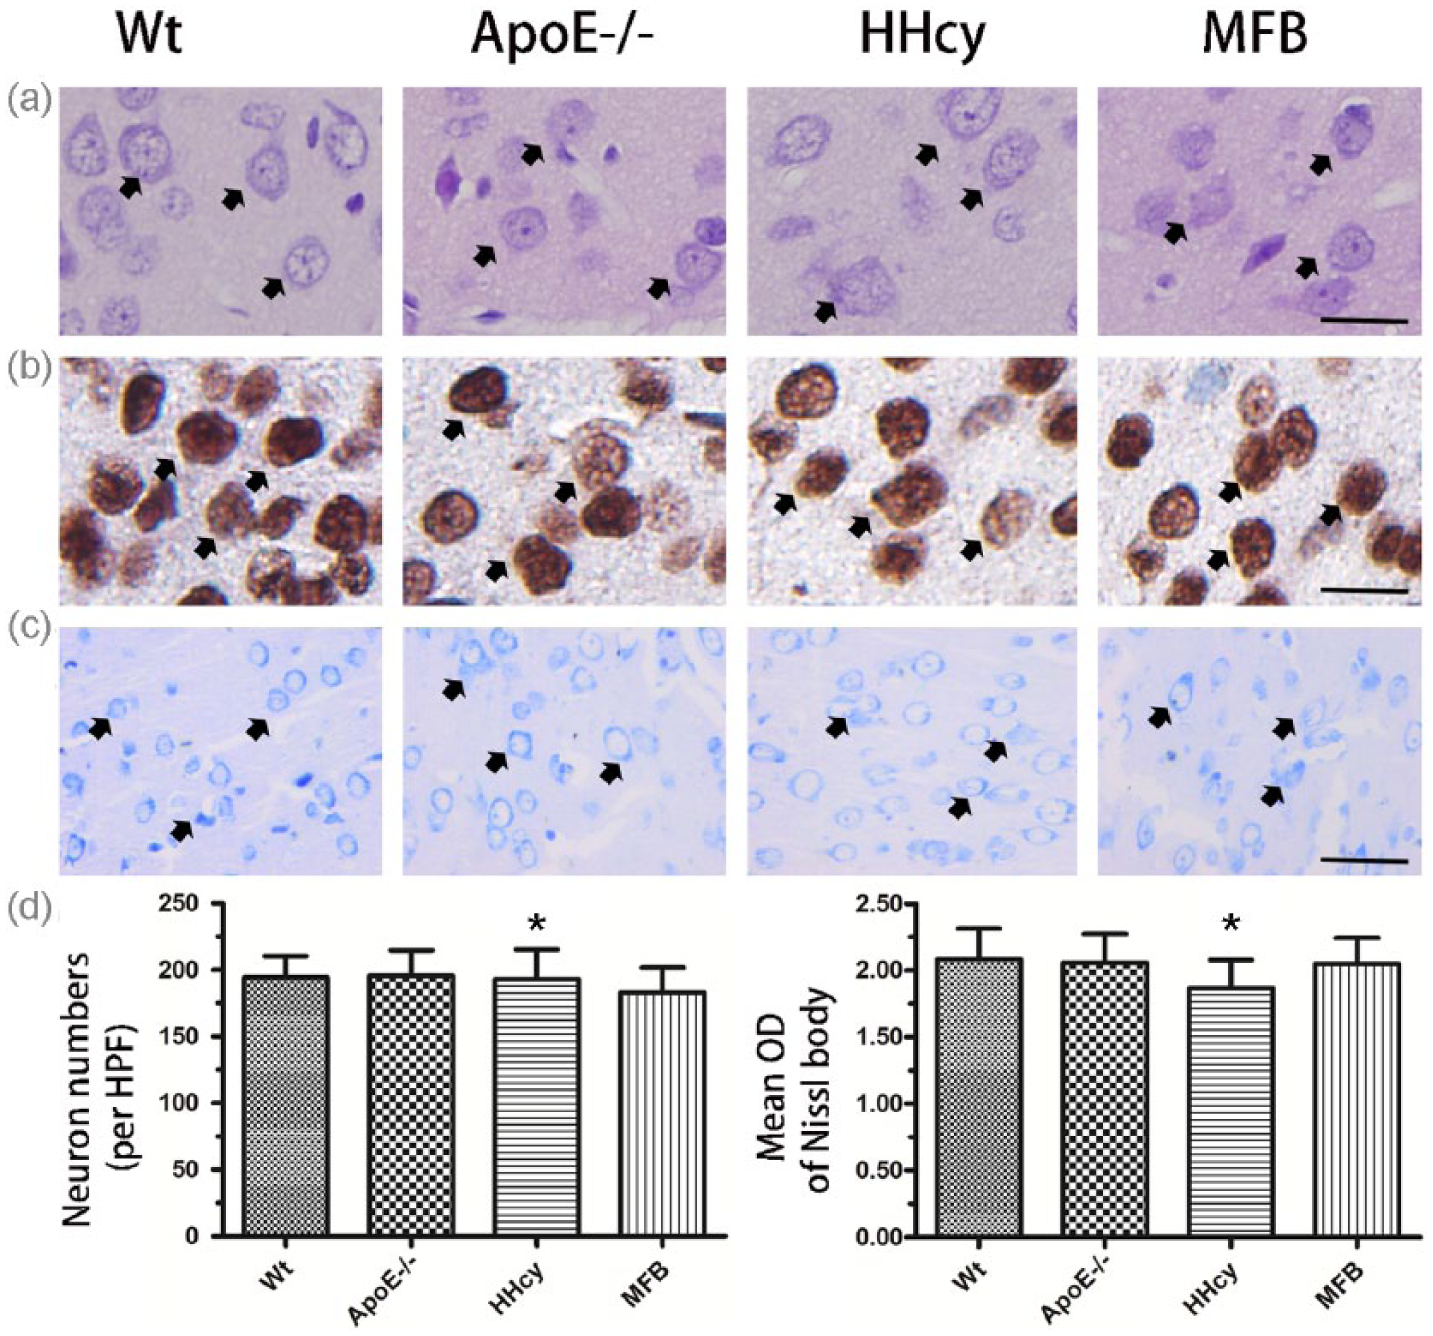
The histology of the frontal cortex. (a) Representative histograph in HE staining, normal histology with neurons (arrow; bar = 20 µm). (b) Representative picture of NeuN-labeled neurons (arrow; bar = 20 µm). (c) Representative picture of Pischinger staining, the deep blue in neurons (arrow; bar = 50 µm). (d) Bar graphs of the numbers of NeuN-labeled neuron and the mean OD of Pischinger staining in the cortex (n = 12 per group). *P = 0.1674 and P = 0.0801 (with Kruskal–Wallis test); no significant differences among Wt, Apo E−/−, HHcy, and MFB groups.
HHcy effect on neuron ultrastructure
To further investigate the effect of HHcy on neurons, we evaluated neuron ultrastructure using transmission electron microscopy. There was no difference in the membrane, nucleus, or number of mitochondria and endoplasmic reticulum between the Wt (Figure 2(a)), Apo E−/− (Figure 2(b)), HHcy (Figure 2(c)), and MFB (Figure 2(d)) groups. Compared to the Wt, Apo E−/− neuronal mitochondrial structures were normal; the HHcy neurons showed increased VM and lipofuscins or autophagic vacuoles or ASs (Figure 2(c)). In MFB group, it also showed a few of VM and ASs (Figure 2(d)). The numbers of neuron with VM or AS were significantly increased in HHcy mice compared with Wt and Apo E−/− mice, respectively (Figure 2(e), P = 0.0048 and P = 0.0051). The neurons with ASs in MFB mice were significantly decreased compared with HHcy mice (Figure 2(e), P = 0.0073), but the neurons with VM or AS were still obviously higher than that of Wt and Apo E−/− groups (Figure 2(e), P = 0.0051 and P = 0.0166).

Representative ultrastructural images of cortical neurons. (a) Wt group, normal mitochondria (M) with cristae structures. (b) Apo E−/− group, normal mitochondria (M). (c) HHcy group, increased autophagosome (AS) containing electron dense material. (d) MFB group, increased vacuolization in mitochondria (VM) and autophagosome (AS; N = nucleus, bar = 1 µm). (e) Bar graph, summary of the ratio of neurons with VM and AS (n = 6 per group). *P = 0.0048 and P = 0.0051 (with two-tailed unpaired t-test), versus Wt group, respectively; #P = 0.0073 versus HHcy group (with two-tailed unpaired t-test).
Neuronal apoptosis under HHcy
In the mice of Wt (Figure 3(a)) and Apo E−/− groups (Figure 3(b)), few weak TUNEL-positive neurons were occasionally found in the cortex. The TUNEL-positive neurons were obviously increased in the HHcy (Figure 3(c)) and MFB groups (Figure 3(d)). Compared to the Wt and Apo E−/− groups, the numbers of TUNEL-positive neuron at the cortex showed significant increase in the HHcy group (Figure 3(e), P = 0.0050 and P = 0.0210). Treatment with folate and vitamin B12 (MFB group) significantly reduced the numbers of TUNEL-positive neuron at the cortex compared to non-treated HHcy group (Figure 3(e), P = 0.0491).

Representative histograph of TUNEL in the frontal cortex. (a) Wt group, normal neurons (arrow), no TUNEL-positive cells. (b) Apo E−/− group, neurons (arrow), without TUNEL-positive cells. (c) HHcy group, neurons (arrow), and increased TUNEL-positive neurons (arrowhead). (d) MFB group, neurons (arrow), and TUNEL-positive neurons (arrowhead; bar = 20 µm). (e) Bar graph, summary of TUNEL-positive neurons (n = 12 per group). *P = 0.0050 and P = 0.0210 (with two-tailed unpaired t-test) versus Wt and Apo E−/− groups, respectively; #P = 0.0491 versus HHcy group (with two-tailed unpaired t-test).
Effect of HHcy on HES1 or HES5 and P62 expression in the brain
The results concerning HES1, HES5, and P62 western blotting analyses in the Wt, Apo E−/−, HHcy, and MFB groups are summarized in Figure 4(a). The relative value for HES1 or HES5 and P62 indicated a significant decrease in the HHcy group (Figure 4(b)) compared with Wt and Apo E−/− groups (P = 0.008, P = 0.0095, and P = 0.0023). The relative values of HES5 and P62 proteins in MFB group were also decreased compared with Wt group (Figure 4(b), P = 0.062 and P = 0.0097).

Representative immunoblot images of HES1 or HES5 and P62 in the brain. (a) Representative immunoblot images of HES1, HES5, and P62. (b) Bar graph of HES1, HES5, and P62 relative value (n = 6 per group). *P = 0.0008, P = 0.0095, and P = 0.0023 (with two-tailed unpaired t-test) versus Wt and Apo E−/− groups, respectively.
Effect of HHcy on the expression of HES1 and HES5 in neurons
To further determine the target cells (neurons or astrocytes) involved, we evaluated the effect of HHcy on localized expression of HES1 and HES5 in neurons. As shown by immunohistochemistry (Figure 5(a)) and immunofluorescence with double-labeled HES1 or HES5 and GFAP (Figure 5(b)), in the Wt group, most neurons showed strong immunoreactivity for HES1 and HES5 (Figure 5(a), in immunohistochemistry or Figure 5(b), in immunofluorescence). In the Apo E−/− and MFB groups, the majority of neurons were also positive for HES1 and HES5, and there was no significant difference in the number of HES1- or HES5-immunostained neurons among these three groups (Figure 5(c)). Compared to Wt, Apo E−/−, and MFB groups, the HHcy group had significantly decreased HES1- and HES5-immunostained neurons (Figure 5(c), P = 0.0003 and P = 0.0001).
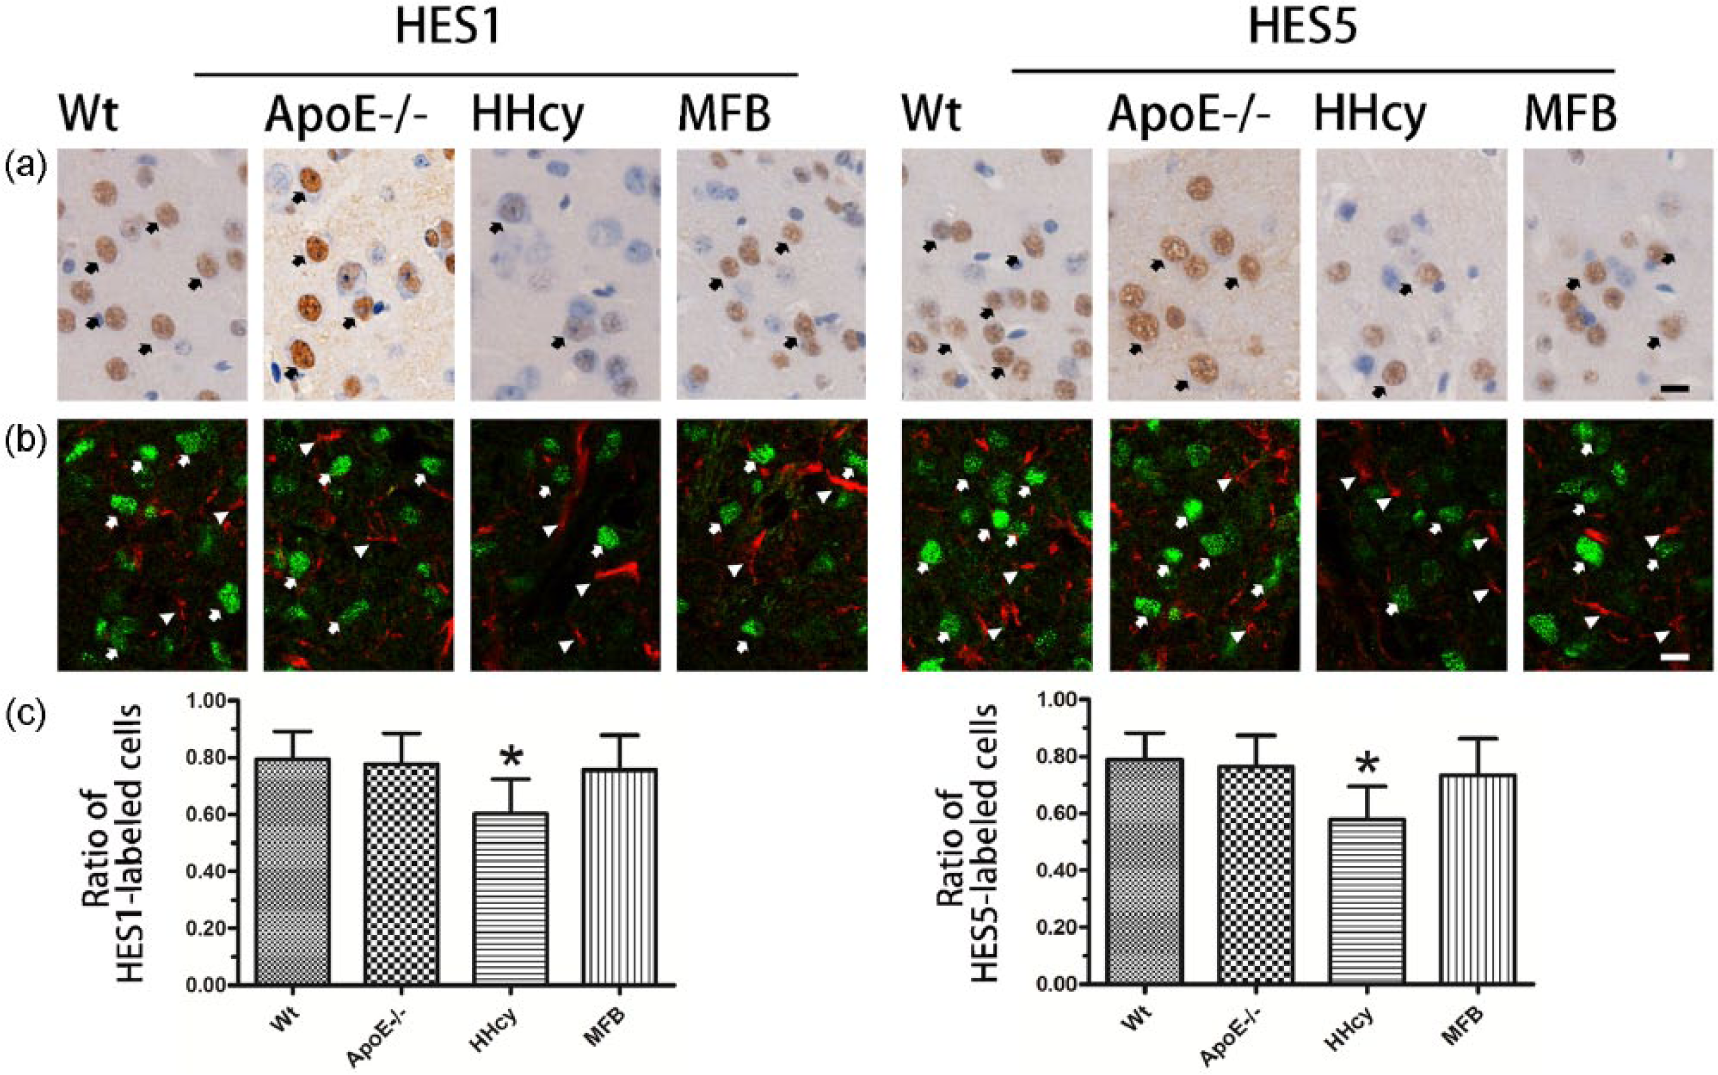
Representative immunostaining images of HES1 and HES5 in the cortex. (a) Representative immunohistochemistry, Wt and Apo E−/− group, the majority of HES1- and HES5-immunostained neurons (arrow); HHcy group, part of HES1- and HES5-immunostained neurons (arrow); MFB group, lot of HES1- and HES5-immunostained neurons (arrow). (b) Representative immunofluorescent, Wt, Apo E−/−, and MFB group, the majority of HES1- and HES5-labeled neurons (green, arrow), negative in astrocytes (red, arrowhead); HHcy group, part of neurons HES1- and HES5-labeled (green, arrow), negative in astrocytes (red, arrowhead; bar = 20 µm). (c) Bar graph, summary of HES1 and HES5 neurons immunohistochemistry, per HPF (n = 12 per group). *P = 0.0003 and P = 0.0001 (with two-tailed unpaired t-test) versus Wt and Apo E−/− groups, respectively.
Discussion
In humans, plasma Hcy concentrations from 16 to 30 µmol/L are defined as moderate HHcy, and concentrations greater than 100 µmol/L are classified as severe HHcy. 3 It is known that CNS has a limited capacity for Hcy metabolism; the brain maintains a low level of Hcy through several mechanisms, such as recycling cobalamin-dependent MS, catabolism through cystathionine beta synthase to cystathionine, and export.3,35 Numerous factors are involved in the metabolic cycle of Hcy.17,36 The common causes of HHcy were environmental or genetic factors.1,3 In this study, a moderate level of HHcy in Apo E−/− mice was induced by 18-week high-methionine diet. This is consistent with previous reports,4,5 suggesting that the Apo E−/− mouse is a useful animal model of HHcy.4,37
Epidemiological, clinical, and experimental studies suggest that HHcy induces the aggravation of symptoms associated with aging, decline in cognition, and neurodegeneration.2,8,9,20 However, the histological and ultrastructural lesions induced by HHcy have not yet been evaluated by morphological evidences in vivo. In an experiment performed in SH-SY5Y neuroblastoma cells, a 35% reduction in cell viability was observed in the cells after a 5-day incubation with 20 µmol/L Hcy. 16 In this study, increased ASs and apoptosis were found in the HHcy mice, but there was no obvious abnormality in the basic histology and neurons’ amount, and Nissl bodies in moderate HHcy were demonstrated by NeuN labeling and Pischinger staining; meanwhile, a downregulation of P62 (an indicator of autophagy) in the brain was demonstrated in HHcy mice. These results suggest that the neuronal autophagy and apoptosis may be induced by a moderate HHcy in the Apo E−/− mice, thereby brain or neuronal damage is aggravated. Protein P62 (sequestosome 1) is the ubiquitin binding protein, which is associated with protein trafficking and degrading. The expression of P62 is downregulated as over-activating autophagy. 38 As the autophagy promotor, Hcy could induce upregulation of LC3B/Beclin-1, accumulation of AS, and aggravation of neuronal injury following cerebral ischemia/reperfusion. 15 In C57BL6/J mice with HHcy induced by a vitamin-B-deficient diet, significant rarefaction of hippocampal microvasculature, without concomitant gliosis and neurodegeneration, was demonstrated. 20 It is reported that the Apo E−/− mice fed the high-methionine diets with vitamin B (folate, B12) deficiency developed HHcy and had significant atheromatous in the aortic arch but without any increase in vascular pathology. 37 The study conducted in the brains of HHcy folate-deprived rats revealed cytoplasmic swelling and mitochondrial degeneration in the endothelium. 33 Moreover, Hcy can induce high expression of inflammatory genes without any morphological change in retinal pigment epithelial cell line. 22 The cholinergic dysfunction and vascular microbleedings in the rats could be induced by HHcy in 5 or 15 months. 39
The underlying mechanisms by which HHcy induces neuronal autophagy and apoptosis are still not understood.15,34 Either the above ultrastructural changes, increased VM and AS, and downregulation of P62, or increased TUNEL-positive neurons may imply over-activation of autophagy and apoptosis under HHcy, in which several molecules and signaling pathways may be modulated.8,13,22 HHcy may inhibit the biosynthesis of S-adenosylmethionine (SAM), the principal methyl donor for all methylation reactions in cells.3,40 The decrease in SAM biosynthesis is likely to induce DNA hypomethylation that inhibits the growth of endothelial cells.
12
Although mild HHcy does not cause memory impairments and neurobiochemical changes in mice, mild HHcy combined with hypoperfusion increases the expression of GFAP and matrix metalloproteinase-9 (MMP-9) in the dentate gyrus and cortex.
40
In addition, oxidative stress has been suggested to be involved in HHcy-induced brain injury.15,16 Compared with the mice without HHcy, the mice with mild HHcy had a 2.1-fold increase in lesion size in an ischemic brain injury model.
14
The recent studies suggested that HHcy is capable of increasing the levels of reactive oxygen species (ROS) and superoxide anions in neuronal cells and VSMCs,11,16,21 resulting in DNA damage and activation of pro-apoptotic or apoptotic factors, such as bax, bcl-2, P53, and caspase-3.14,16,22 Furthermore, the activation of the N-methyl-
This study investigated the effect of HHcy on the expression of HES1 and HES5 in the brain and cortical neurons; the expression of HES1 or HES5, a dominant player in Notch/Rbpjκ signaling, was downregulated in the frontal cortex neurons and brain in mice with moderate HHcy, suggesting that HHcy may be able to inhibit the expression of HES1 and HES5 in neurons. Little is known regarding the mechanisms of decreased HES1 and HES5 expression in neurons under HHcy. However, previous studies have found that Hcy augments the expression of C-reactive protein (CRP) and phosphorylation of ERK1/2 and the NR1 subunit of the NMDAr in VSMCs,8,11,21 indicating that Hcy can initiate the inflammatory response of VSMCs through increased expression of CRP, which is involved in the NMDAr-ROS-ERK1/2/p38-NF-κB signal pathway.6,21 Moreover, the cardiac stem cell–mediated cardiac repair may be depressed under HHcy, in which a decreased stem cell factor was induced.30,34 Hes1 and Notch signaling are important factors under conditions that require the self-renewal of progenitors to maintain telencephalon size.26,29,41 According to our findings, it is speculated that moderate HHcy in Apo E−/− mice could induce downregulation of hes1 and hes5 genes, which would be involved in neuronal autophagy and apoptosis, thereby brain or neuron damage is aggravated.
The hes gene is a member of a family of genes that produce proteins with a DNA-binding basic helix–loop–helix (bHLH) motif; these proteins are transcription factors that induce neuronal differentiation.26,29 The bHLH proteins are categorized into two types: inhibitive and promotive. The inhibitive bHLH genes, such as hes1, hes3, and hes5, may maintain the undifferentiated state of neuronal stem cells to preserve their capacity for proliferation and differentiation. 26 The promotive type of bHLH genes, including mash1, math, and Neurogenin, may accelerate neuronal stem-cell differentiation into neurons.25,26 Therefore, hes1 and promotive bHLH genes regulate each other, maintaining some cells as progenitors while driving others to differentiate.26,29,41 Recent studies have found that the absence of hes1 and Rbpjκ increased the number of differentiated pro-opiomelanocortin and neuropeptide Y neurons with fewer progenitors.23,29,41
In this study, it is the limitation that the results showed a data about histopathology, autophagy, degeneration, and apoptosis in the cortical neurons and expression of HES1 or HES5 under moderate HHcy (23.71 ± 6.30 µmol/L total Hcy in plasma). However, future studies are required to determine whether neuronal autophagy and apoptosis are directly induced by the HHcy cytotoxicity or by downregulating hes1 and hes5 genes or other signal transduction pathways. This study could not find significant morphological and pathological changes in the cortical brain tissue and neurons of the Apo E−/− mice with moderate HHcy; this may be associated with the amount of Hcy or experimental duration. It is possible that the moderate HHcy could not lead to visible morphological changes in optical microscope. Of course, this also needs further studies.
In summary, this study shows that HHcy could be induced in Apo E−/− mice fed a high-methionine diet for 18 weeks. The histology of the brain tissue and neurons in HHcy Apo E−/− mice was not obviously abnormal. An increase in ASs and VM under electron microscope and neuron apoptosis by TUNEL was observed in mice with HHcy. Meanwhile, a downregulation of HES1 and HES5 in the brain and cortical neurons was demonstrated in HHcy mice via immunostaining and western blotting. These results suggest that HHcy induces mitochondrial damage, autophagy, and neuronal apoptosis in Apo E−/− mice, in which downregulation of hes1 and hes5 is involved. The results of this study might help in understanding the HHcy effects on brain and neurons.
Footnotes
Acknowledgements
The authors thank Fang Xu and Hua Xu for critical reading of the article; Yi-Deng Jiang for Apo E−/− mice; Wen Yang for mice care; Yan Zhang, Jianda Dong, and Fengying Guo for technical assistance; and Mr Faisal UL Rehman for editing and proof reading. J.-W.Z., R.Y., and Y.-S.T. have contributed equally to this study and share first authorship. Y.-L.W., J.-Z.Z., and L.J. conceived and designed the study. J.-W.Z., R.Y., and Y.-S.T. designed and carried out experiments. J.-W.Z and R.Y. carried out and analyzed the recordings. Y.-S.T. and Y.-Z.G. designed and carried out immunohistochemistry, immunofluorescence, and western blotting experiments. Y.C. and J.-W.Z. supervised experiments and helped with data interpretation. J.-W.Z., Y.-L.W., J.-Z.Z., and L.J. wrote the article. All authors discussed results and commented on the article.
Declaration of conflicting interests
The author(s) declared no potential conflicts of interest with respect to the research, authorship, and/or publication of this article.
Funding
This work was supported by the National Natural Science Foundation of China (J.-Z.Z. supported by no. 81360184 and L.J. supported by no. 81560208).