
Abstract
Background
Despite treatment advances, prognoses of patients with advanced colorectal cancer remain poor. The limited effectiveness of programmed cell death protein 1 (PD-1) blockade immunotherapy in a subset of patients necessitates a deeper understanding of the colorectal cancer microenvironment. This study aimed to identify new therapeutic targets and potential biomarkers by investigating CD8 + CD101hiTim3+ (CCT) T cells and their progenitors in colorectal cancer, and their association with immunotherapy response at the transcriptomic level.
Methods
We used single-cell sequencing data and The Cancer Genome Atlas database for comprehensive bioinformatics analysis, including single-cell sequencing data analysis, Gene Set Variation Analysis, pseudotime analysis, cell communication analysis, and construction and validation of a prognostic model.
Results
Key findings include the identification and annotation of various T-cell subtypes in colorectal cancer, construction of a pseudotime trajectory of CCT T cells and their progenitors showing dynamic gene expression changes, and enhanced interactions between CCT T cell progenitors and other cells in the PD-1 immunotherapy group. We developed and validated a prognostic model comprising 15 gene features with strong prognostic stratification performance, revealing that high-risk patients exhibit transcriptomic associations with potentially reduced responses to immune checkpoint inhibitors (ICIs). Pathway enrichment analysis highlighted critical pathways, including leukocyte adhesion and T cell activation, indicating complex influences on disease progression and treatment responses within the colorectal cancer immune landscape.
Conclusions
This study emphasizes the potential importance of targeted therapies that modulate immune interactions and functional states to improve colorectal cancer prognosis, particularly in high-risk patients who show an association at the transcriptomic level with reduced ICI responsiveness.
Introduction
Colorectal cancer (CRC) remains a major public health challenge and one of the most prevalent and deadly malignancies worldwide. 1 Despite advances in the genetics and molecular biology of CRC, treatment outcomes for advanced stages remain poor.2,3 Although traditional bulk transcriptomic analyses have provided valuable insights into the molecular landscape of CRC,4,5 they often overlook the cellular heterogeneity and complex microenvironmental interactions that are critical for tumor progression and therapeutic resistance.
The CRC tumor microenvironment (TME) consists of immune cells, fibroblasts, endothelial cells, and extracellular matrix components that influence disease progression and therapeutic responses.6,7 Among immune cells, CD8+ cytotoxic T lymphocytes are key players in antitumor immunity8,9; however, their effectiveness is frequently hindered by the immunosuppressive nature of the TME and the expression of immune checkpoint molecules, such as programmed cell death protein 1 (PD-1). Although immune checkpoint blockade (ICB) therapies, particularly PD-1/programmed death-ligand 1 (PD-L1) inhibitors, have shown success in patients with microsatellite instability-high (MSI-H) CRC,10–12 not all CRC patients benefit from ICB therapy. Recent studies have found a strong correlation between CD8+CD101hiTim3+ (CCT) T cells and immune treatment outcomes in tumor patients. 13 CCT cells are terminally exhausted T cells that are primarily expressed in patients after PD-1 treatment and are associated with poor immune treatment outcomes. Additionally, patients with a higher proportion of CCT cells tend to have worse prognosis. These findings suggest that CCT cells, as a type of T cell associated with anti-PD-1 immune therapy at the transcriptomic level, are strongly correlated with potential therapeutic benefit and prognosis of CRC patients. 13 Therefore, a deeper understanding of the molecular and cellular determinants of response and resistance to these therapies is needed. 14 Identifying specific T-cell subsets and their functional states within the TME could provide valuable insights into the mechanisms underlying therapeutic efficacy and resistance, potentially guiding the development of more effective treatment strategies.
Recent advancements in single-cell RNA sequencing (scRNA-seq) have revolutionized our ability to decode tumor cell composition and unravel the intricate interplay between different cell types in the TME.15–17 These studies revealed critical aspects of tumor biology, such as rare cell populations, differentiation trajectories, and dynamic therapeutic responses.18–20 Single-cell analyses of various cancers have revealed the presence of diverse immune cell populations, stromal cells, and malignant cell subtypes, each contributing uniquely to tumor behavior and treatment response.20–22
In this study, we analyzed the scRNA-seq data from CRC samples to explore cellular heterogeneity and gene expression in the TME. Through the clustering and annotation of cell populations, with a specific focus on T cells and their subtypes, we sought to elucidate the cellular dynamics and interactions linked to colorectal cancer progression, as well as their association at the transcriptomic level with response to PD-1 immunotherapy. Our findings provide novel insights into potential biomarkers and therapeutic targets, thereby offering opportunities to enhance current treatments and improve patient outcomes.
Methods
Data preparation
Whole-genome expression profiles, clinical data, and single nucleotide variants (SNVs) data for CRC were obtained from The Cancer Genome Atlas (TCGA) using the R package “TCGAbiolinks,” 23 The TCGA-colon adenocarcinoma (COAD) database includes 483 tumor and 41 normal samples, of which 420 tumor samples with survival data were retained after excluding those with survival times < 30 days. Similarly, the TCGA-rectal adenocarcinoma (READ) database comprised 152 tumor samples with survival information after applying the exclusion criteria.
scRNA-seq data were obtained from the GSE205506 dataset, which contained 40 samples: 9 PD-1 immunotherapy-treated and 10 untreated colon cancer tissues. In this study, the cell type annotation of single-cell data was primarily accomplished using the Seurat package (version 4.2.0) in combination with cell type-specific biomarkers. We first identified the differentially expressed genes for each cell cluster using the FindAllMarkers function of Seurat, and then performed cell type annotation by referring to the cell type signature markers reported in published studies (e.g. CD3D for T cells, MS4A1 for B cells, CD14 for macrophages, etc.). Raw single-cell data were processed using the Seurat package in R. 24 Low-quality cells and genes were filtered out based on the following criteria: (a) fewer than 200 expressed genes per cell; (b) fewer than 500 unique molecular identifier (UMI) reads per cell; and (c) retention of cells with less than 25% mitochondrial gene content. Data normalization was performed with Seurat's “NormalizeData” function. 25 Principal component analysis was conducted, and significant principal components (PCs) were used for graph-based clustering. Batch effects were corrected using the harmony method, and cell clustering was performed using the FindClusters function implementing the Louvain algorithm for community detection. A resolution of 0.2 was applied, generating 10 clusters based on 20 PCs. Differentially expressed genes (DEGs) were identified using the FindAllMarker function.
T-cell re-clustering was performed according to Leung et al., 13 specifically resolving the CD8+CD101+Tim3+ effector population (CCT T cells) and its precursor state CD101+Tim3+ cells (CCT precursors). Expansion of CCT T cells in PD-1 blockade-refractory patients 13 prompted fine annotation to decode their spatiotemporal dynamics and functional diversification.
Pseudotime analysis
We performed a pseudotime analysis using Monocle 2, 26 which models branching and linear differentiation processes from user-defined gene lists. Normalization of raw counts was achieved by calculating size factors, and genes with high dispersion, and expression levels were used to map pseudotime trajectories. 27 The DDRTree algorithm, configured with standard parameters, was employed for the analysis. Subsequently, Branch Expression Analysis Modeling was used to identify genes with significant branch dependency, which were then depicted in heatmap form.
Cell–cell communication analysis
For the intercellular communication analysis, the “CellChat” R package was used with UMI count matrices from both PD-1 immunotherapy and untreated CRC samples. 28 Using the “CellChatDB.human” ligand-receptor interaction database as a reference, interactions were analyzed using default settings. CellChat data from both groups were consolidated to assess the comparative interaction counts and intensities. The “netVisual_diffInteraction” function was utilized to graphically represent disparities among cell types. Additionally, the distribution of signaling genes was illustrated using both the “netVisual_bubble” and “netVisual_aggregate” functions.
Gene ontology and Kyoto encyclopedia of genes and genomes pathway enrichment analysis
DEGs were identified for two comparisons: First, between CCT T cells and other cells, using Seurat's FindAllMarkers function with default parameters (|log2Fold Change| > 0.25, P < 0.05). Second, between TCGA CRC and normal control samples using the “limma” R package. 29 The intersection of these gene sets identified CCT T cell-related DEGs in CRC. Gene ontology (GO) enrichment analysis 30 covered biological processes (BP), molecular functions (MF), and cellular components (CC), while Kyoto encyclopedia of genes and genomes (KEGG) 31 enrichment analysis, conducted using the “clusterProfiler” R package (version 4.2.2), 32 identified altered metabolic pathways (P < 0.05).
Prognostic model construction and validation
To determine the prognostic significance of phenotype-related DEGs, univariate Cox regression analysis was conducted on the tumor cohort's overall survival, considering P ≤ 0.05 as significant. Tumor samples with clinical data were stratified into training (n = 279) and validation (n = 141) sets in a 7:3 ratio. Additionally, a least absolute shrinkage and selection operator (LASSO) Cox regression model was constructed using the “glmnet” R package
33
refined candidate genes and constructed the prognostic model. Risk scores were calculated using the following formula:

Coef(genei) is the risk coefficient, and expression (genei) is the gene expression level. The surv_cutpoint function determined the optimal cutoff to categorize the training samples into low- and high-risk groups. Kaplan–Meier survival curves and log-rank tests assessed prognostic significance, while receiver operating characteristic (ROC) curves and area under the curve (AUC) values validated the model's performance. The validation set was categorized similarly for further testing.
Gene set enrichment analysis
Differential expression analysis was conducted using the “limma” R package, 29 producing fold changes (FC) in gene expression. We performed with the “clusterProfiler” R package and analyzed ordered gene lists based on log2FC, with 1000 permutations per analysis to conduct gene set enrichment analysis (GSEA) analysis. The reference gene set, c2.cp.kegg.v7.5.1. symbols were from the Molecular Signatures Database (MSigDB),34,35 with P < 0.05, indicating a significant enrichment.
Gene set variation analysis
We used the gene set variation analysis (GSVA) R package and the same KEGG gene set to explore functional differences between groups, with results visualized using “pheatmap” (version 1.0.12).
Immune infiltration analysis
Immune infiltration scores for 28 cell types were quantified using gene expression profiles, with data sourced from the Tumor and Immune System Interactions Database (http://cis.hku.hk/TISIDB/). 36 Differences in immune cell infiltration between risk groups were visualized with the “ggplot2” R package (version 3.3.6).
Somatic mutation analysis
The landscape of genomic alterations, including single nucleotide polymorphisms, insertions, deletions, tumor mutation burden (TMB), and mutation frequency, was visualized using the “maftools” R package (version 2.10.05). 37 Frequently mutated genes with the top 20 mutation frequencies have been identified as genes potentially associated with malignancy at the transcriptomic level. 38
Drug sensitivity analysis
Predicted drug sensitivity for CRC high- and low-risk groups was assessed using half maximal inhibitory concentration (IC50) and gene expression data from the Genomics of Drug Sensitivity in Cancer, 39 analyzed with the “oncoPredict” R package. 40
Immunotherapy response
The immunotherapy response was assessed using Tumor Immune Dysfunction and Exclusion (TIDE) analyses. 41
Immune checkpoints
The expression levels of common immune checkpoint genes were compared between the risk groups because these molecules regulate immune activation and control excessive immune responses.
Statistical analysis
All analyses were performed using the R software (version 4.1.2). Survival rates between groups were evaluated using Kaplan–Meier curves and log-rank tests, generated with the “survminer” R package (version 0.4.9). Univariate and multivariate Cox regression analyses were used to assess prognostic variables. Data visualization was done using “ggplot2” (version 3.3.5), and heatmaps were created with “pheatmap” (version 1.0.12). Quantitative differences for normally distributed variables were determined using two-tailed t-tests or one-way analysis of variance, whereas Wilcoxon or Kruskal–Wallis tests were used to assess non-normally distributed data. Statistical significance was set at P < 0.05.
Results
Comprehensive analysis of cell types and gene expression profiles in CRC
To explore the sources of highly expressed genes in CRC, we analyzed scRNA-seq data from the GSE205506 dataset, which included 55,926 cells. These cells were clustered into 10 distinct groups (Figure 1(a)) and annotated based on gene expression profiles, identifying seven major cell types, including T cells, B cells, Myeloid cells, Endothelial cells, and Fibroblasts (Figure 1(b)). Dot plots (Figure 1(c)) revealed characteristic gene expression patterns for each cell type. The proportions of these cell types in PD-1 immunotherapy-treated (Figure 1(d)) and untreated groups were compared (Figure 1(e)) and exhibited substantial differences that may reflect immune response variation upon treatment.
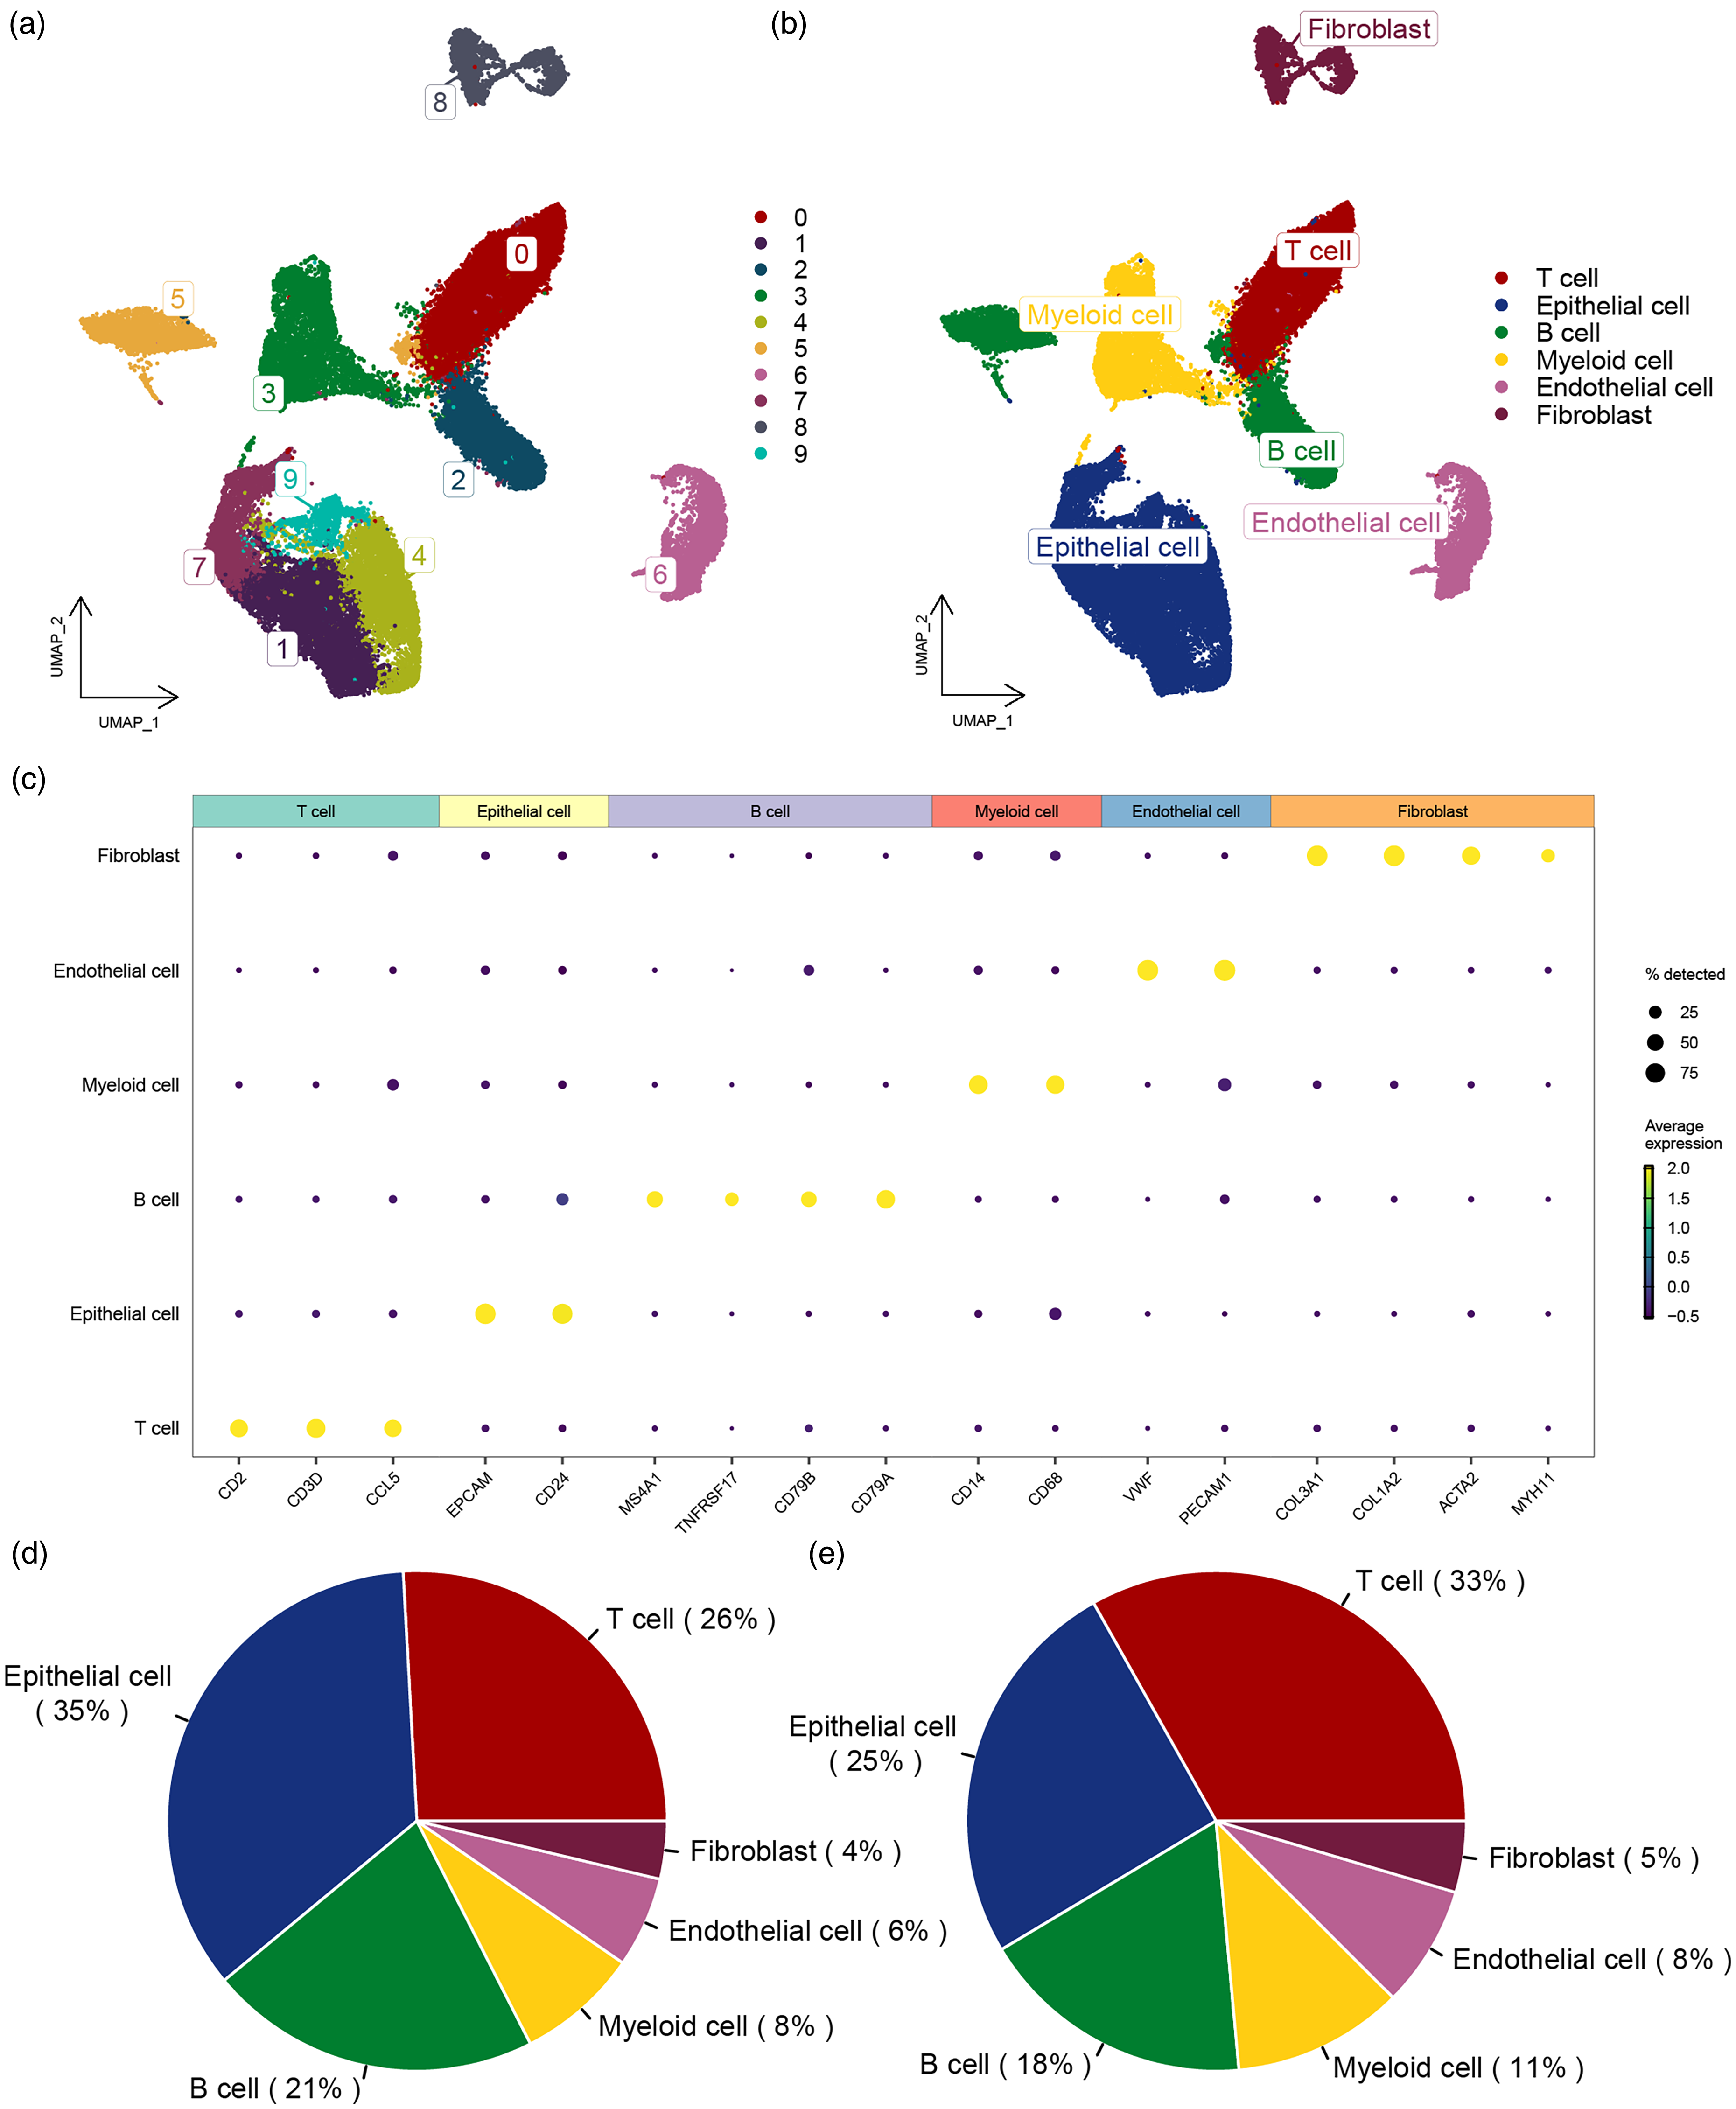
Identification of cell subpopulations from single-cell sequencing data. (a) UMAP plot showing the distribution of CRC cell subpopulations. (b) UMAP plot displaying the annotation results of CRC cell subpopulations. (c) Expression of marker genes in each cell type. (d) A sector graph displaying the distribution of cell types in the PD-1 immunotherapy group in CRC. (e) A sector graph displaying the distribution of cell types in the non-PD-1 immunotherapy group.
Among the 16,445 identified T cells, reclustering revealed 13 subgroups (Supplementary Figure S1(a)), which were annotated to include CD4, CD8, and regulatory T cells (Supplementary Figure S1(b)). Dot plots (Supplementary Figure S1(c)) illustrated the gene expression profiles of these T cell types. The analysis of T cell proportions in treated and untreated groups (Supplementary Figure S1(d)) indicated changes in immune cell composition, which demonstrates dynamic changes in the immune environment within the context of immunotherapy.
We further examined CD8+ T cells expressing CD101 and HAVCR2 (Figure 2(a) to (c)), and using UMAP plots, we visualized the expression of CD101 and HAVCR2 following reclustering (Figure 2(d) and (e)). This analysis revealed nine subgroups (Figure 2(f)), including CCT cells and their precursor CD8.Tim3.T cells (Figure 2(g)). The proportions of these cell types in PD-1 immunotherapy-treated and untreated groups were compared (Figure 2(h)), showing potential alterations in the immune landscape in response to treatment. Based on the functional investigation of these subsets, we performed GSVA enrichment analysis between subgroups to identify the three most significantly differential pathways for each cell type. Pathway activity per group was visualized in a heatmap (Figure 2(i)). The results demonstrated that the natural killer cell mediated cytotoxicity pathway was significantly enriched in the cd8+tim3+ t cell population, whereas graft versus host disease, allograft rejection, and type 1 diabetes mellitus pathways were markedly enriched in CD8+CD101+Tim3+ T cells. This pattern indicates that CD8+Tim3+ T cells exhibit potent cytotoxic functionality analogous to natural killer (NK) cell mechanisms, while CD8+CD101+Tim3+ T cells are skewed toward pathological autoimmunity—a potential mechanism associated with PD-1 resistance via autoimmune phenotype-mediated therapeutic refractoriness at the transcriptomic level.
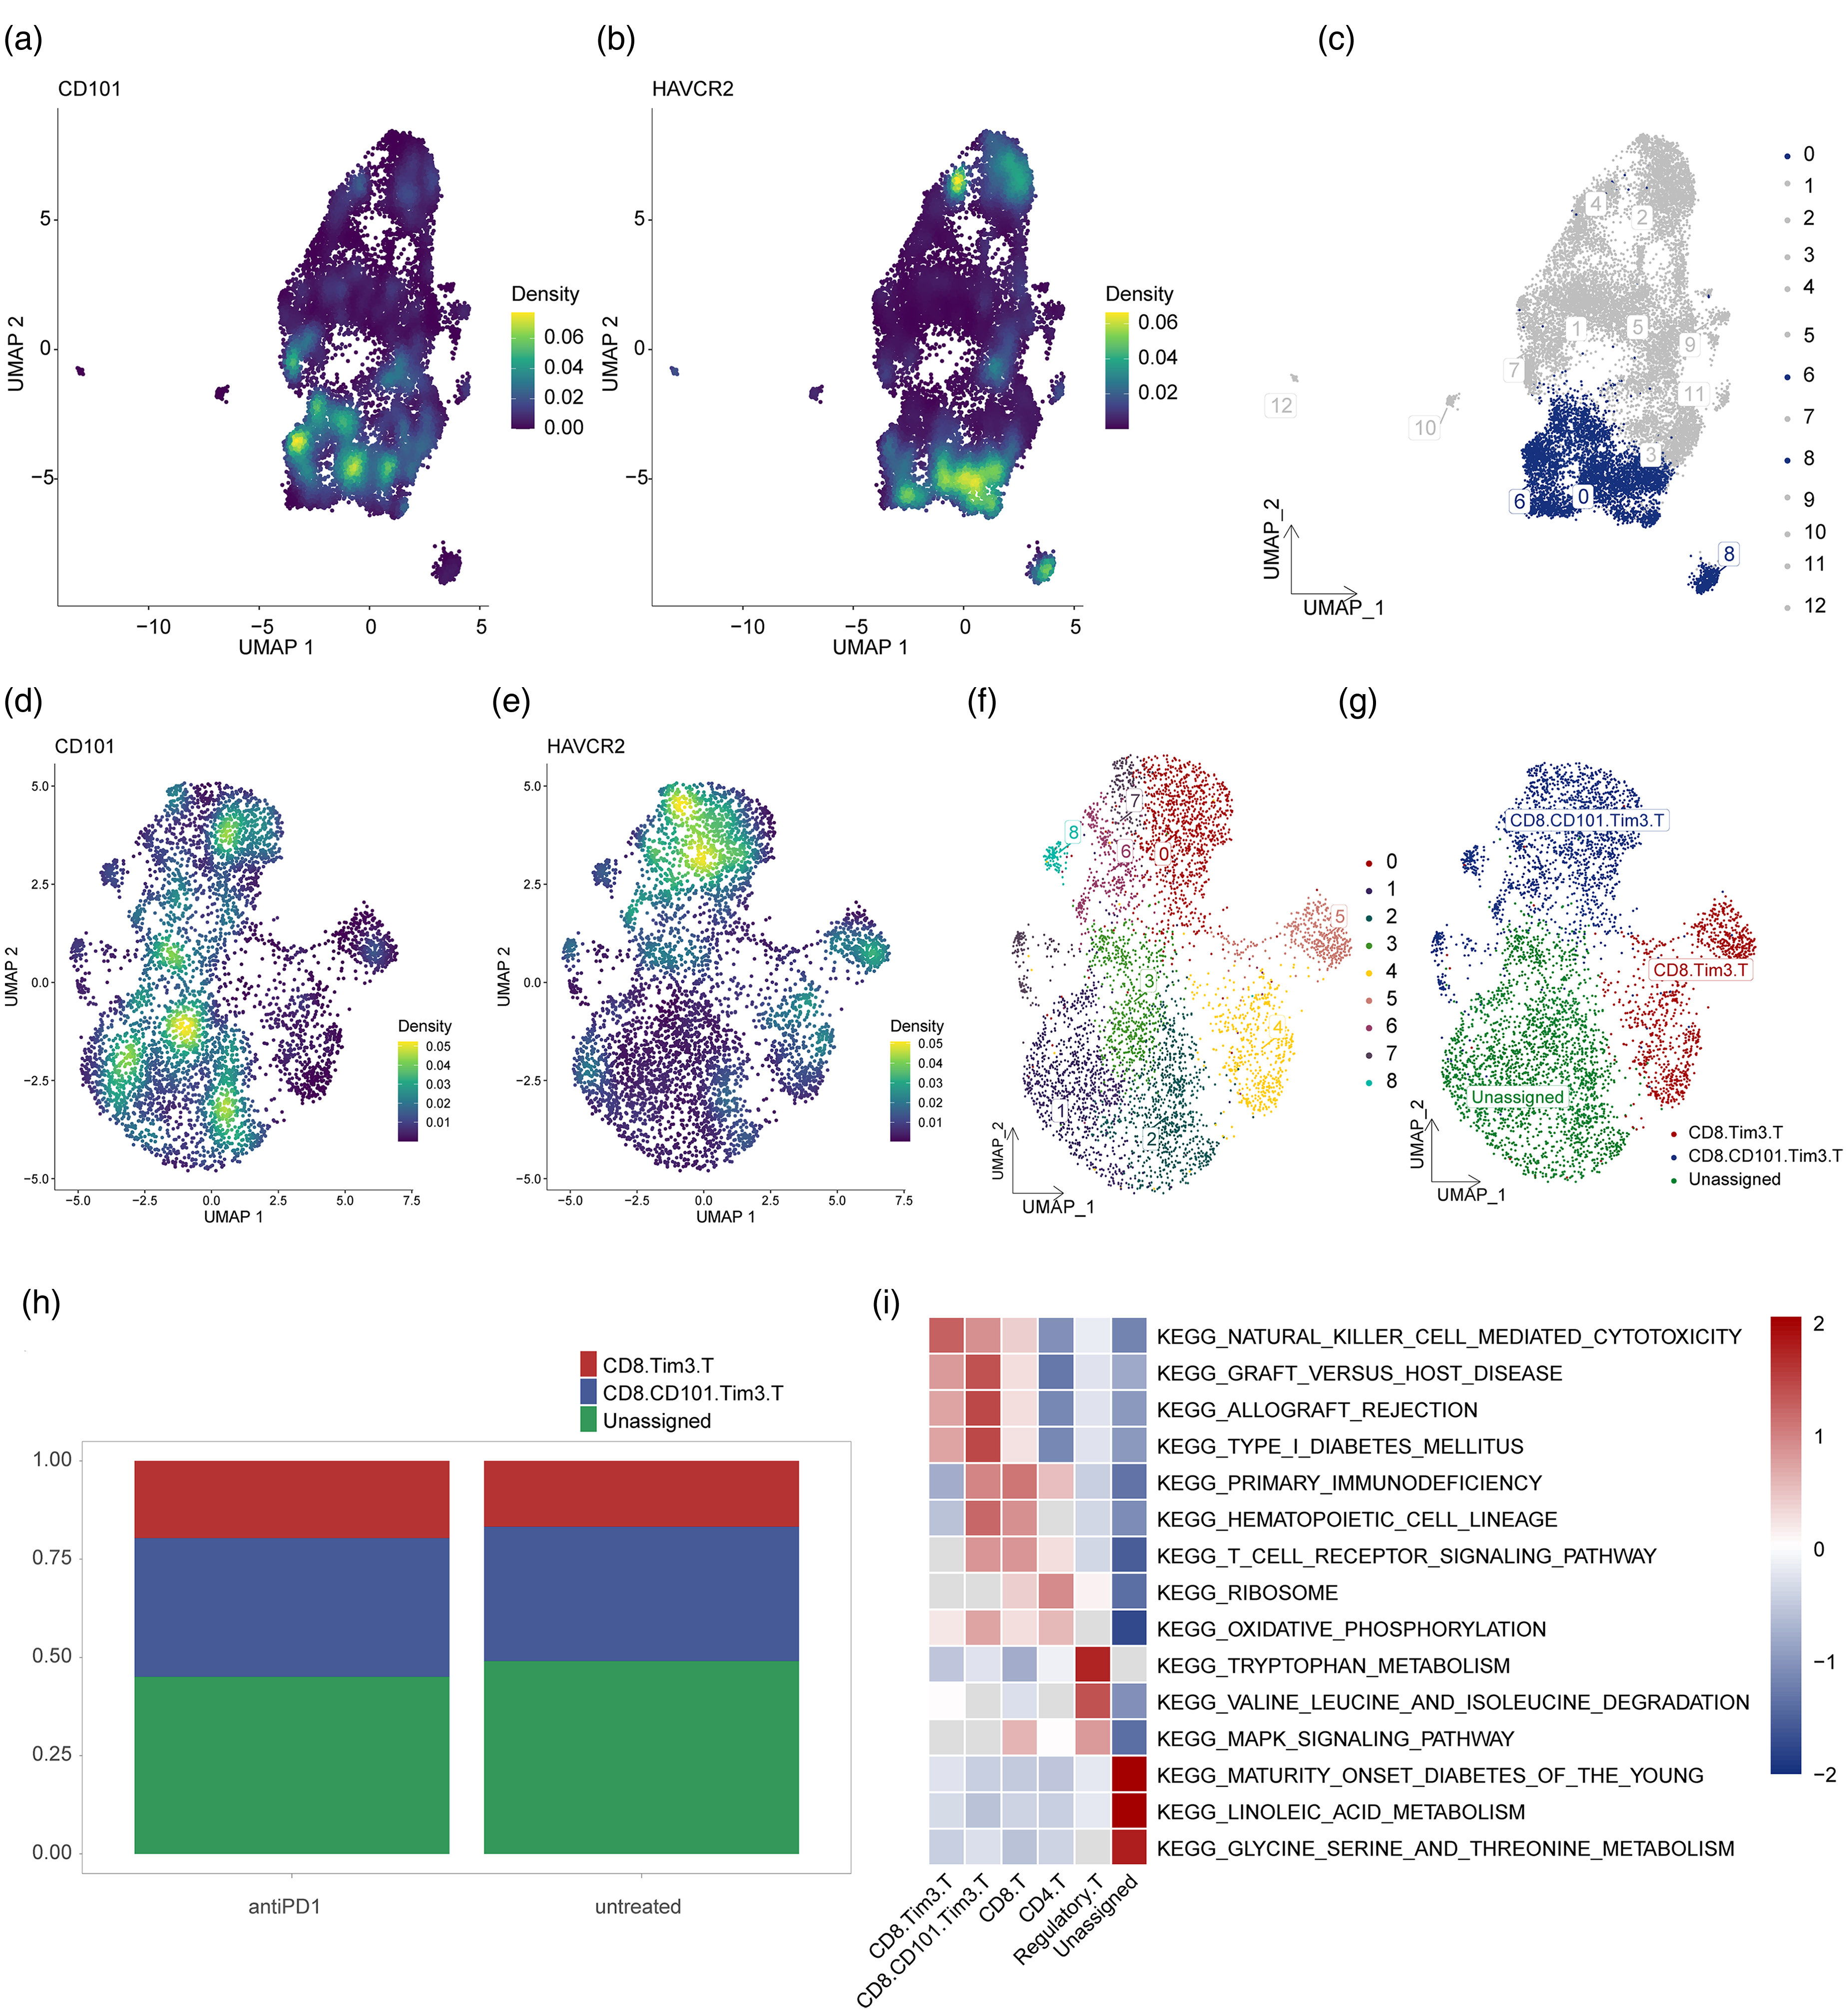
Gene expression characteristics of CCT T cell subpopulations. (a) UMAP plot shows the distribution of CD101 gene expression in T cell subpopulations. (b) UMAP plot shows the distribution of HAVCR2 gene expression in T cell subpopulations. (c) Distribution of CD101 and HAVCR2 high-expression cell populations in CD8 T cells. (d) Expression of CD101 after reclustering. (e) Expression of HAVCR2 after reclustering. (f) UMAP plot of CD8 T cells showing high-expression cell populations for CD101 and HAVCR2 after dimensionality reduction clustering analysis. (g) UMAP plot showing annotation results of high-expression CD101 and HAVCR2 cell populations in CD8 T cells. (h) Cumulative histogram showing the distribution of CCT T cells and their precursors in the PD-1 immunotherapy and non-PD-1 immunotherapy groups in colorectal cancer. (i) Heatmap visualization of GSVA analysis results.
Pseudotime trajectory analysis and cell interaction networks in CD8+ T cells
Here we employed pseudotime analysis to explore the distribution of CD8+CD101+Tim3+ T cells (CCT cells) and their precursors along the inferred differentiation trajectory. This identified principal bifurcation nodes between the two cell types and investigated whether PD-1 treatment induced differential differentiation of CCT cells. The trajectory revealed seven distinct transcriptional states (Supplementary Figure S2(a) to (d)), with proportional distributions of CCT cells and precursors across states analyzed (Supplementary Figure S2(e)). Cells from pre- and post-PD-1 treatment cohorts exhibited marked divergence in differentiation, occupying opposing ends of the pseudotime continuum (Supplementary Figure S2(d)). Specifically, pre-treatment cells primarily resided in States 1, 2, 3, and 4, whereas post-treatment cells predominantly localized to States 5, 6, and 7 (Supplementary Figure S2(f)), indicating PD-1 treatment is associated with the differentiation of CD8+CD101+Tim3+ T cells at the transcriptomic level.
Bifurcation at Node 2 (Supplementary Figure S2(b)) delineated three major branches: the pre-branch (States 1, 2, and 3, mainly representing post-treatment groups), Branch 1 (State 4), and Branch 2 (States 5, 6, and 7, primarily representing pre-treatment groups). Functional enrichment analysis of these branches elucidated molecular transitions during differentiation. Genes highly expressed in the pre-branch (States 1 and 3) showed enrichment for GO biological processes including “cytoplasmic translation,” “large ribosomal subunit biogenesis,” and “ribonucleoprotein complex biogenesis.” Conversely, Branch 2 (State 5) demonstrated enrichment for “monocyte differentiation,” “T cell activation,” and “regulation of hematopoiesis” (Supplementary Figure S2(f)).
These findings demonstrate that CCT cells and precursors undergo complex differentiation processes characterized by stage-specific biological pathways. Shifts in pathway enrichment provide insights into immune cell maturation and activation dynamics, potentially modulated by PD-1 treatment. Next, we investigated the cell interaction networks in PD-1 immunotherapy-treated versus untreated groups using the CellChat R package. The number and strength of interactions increased in the treated group (Supplementary Figure S3(a)), with most interactions enhanced (Supplementary Figure S3(b) and (c)). Distinct signaling patterns were observed between the two groups (Supplementary Figure S3(d)). The enhanced cell interactions in the treated group suggest that PD-1 blockade may promote immune activation and alter immune signaling, which could have implications for treatment outcomes.
Enrichment analysis of DEGs in CCT T cell precursors in CRC
Differential expression analysis identified 1121 DEGs between CD8.Tim3.T precursors and other CRC cell types. A heatmap highlighted the top 10 upregulated genes in CD8.Tim3.T precursors, including GNLY, NKG7, KLRD1, and others (Figure 3(a)). Comparison of CRC samples with normal controls revealed 9257 DEGs, with the top five upregulated genes being CDH3, ETV4, KRT80, MTHFD1L, and CLDN1 and the top five downregulated genes being OTOP2, VSTM2A, LINC00974, BEST4, and GLP2R (Figure 3(b)). The intersection of these DEGs identified 547 key genes (Figure 3(c)). The overlap of DEGs with normal controls further emphasizes potential tumor-specific gene signatures, which could serve as targets for future therapeutic interventions.
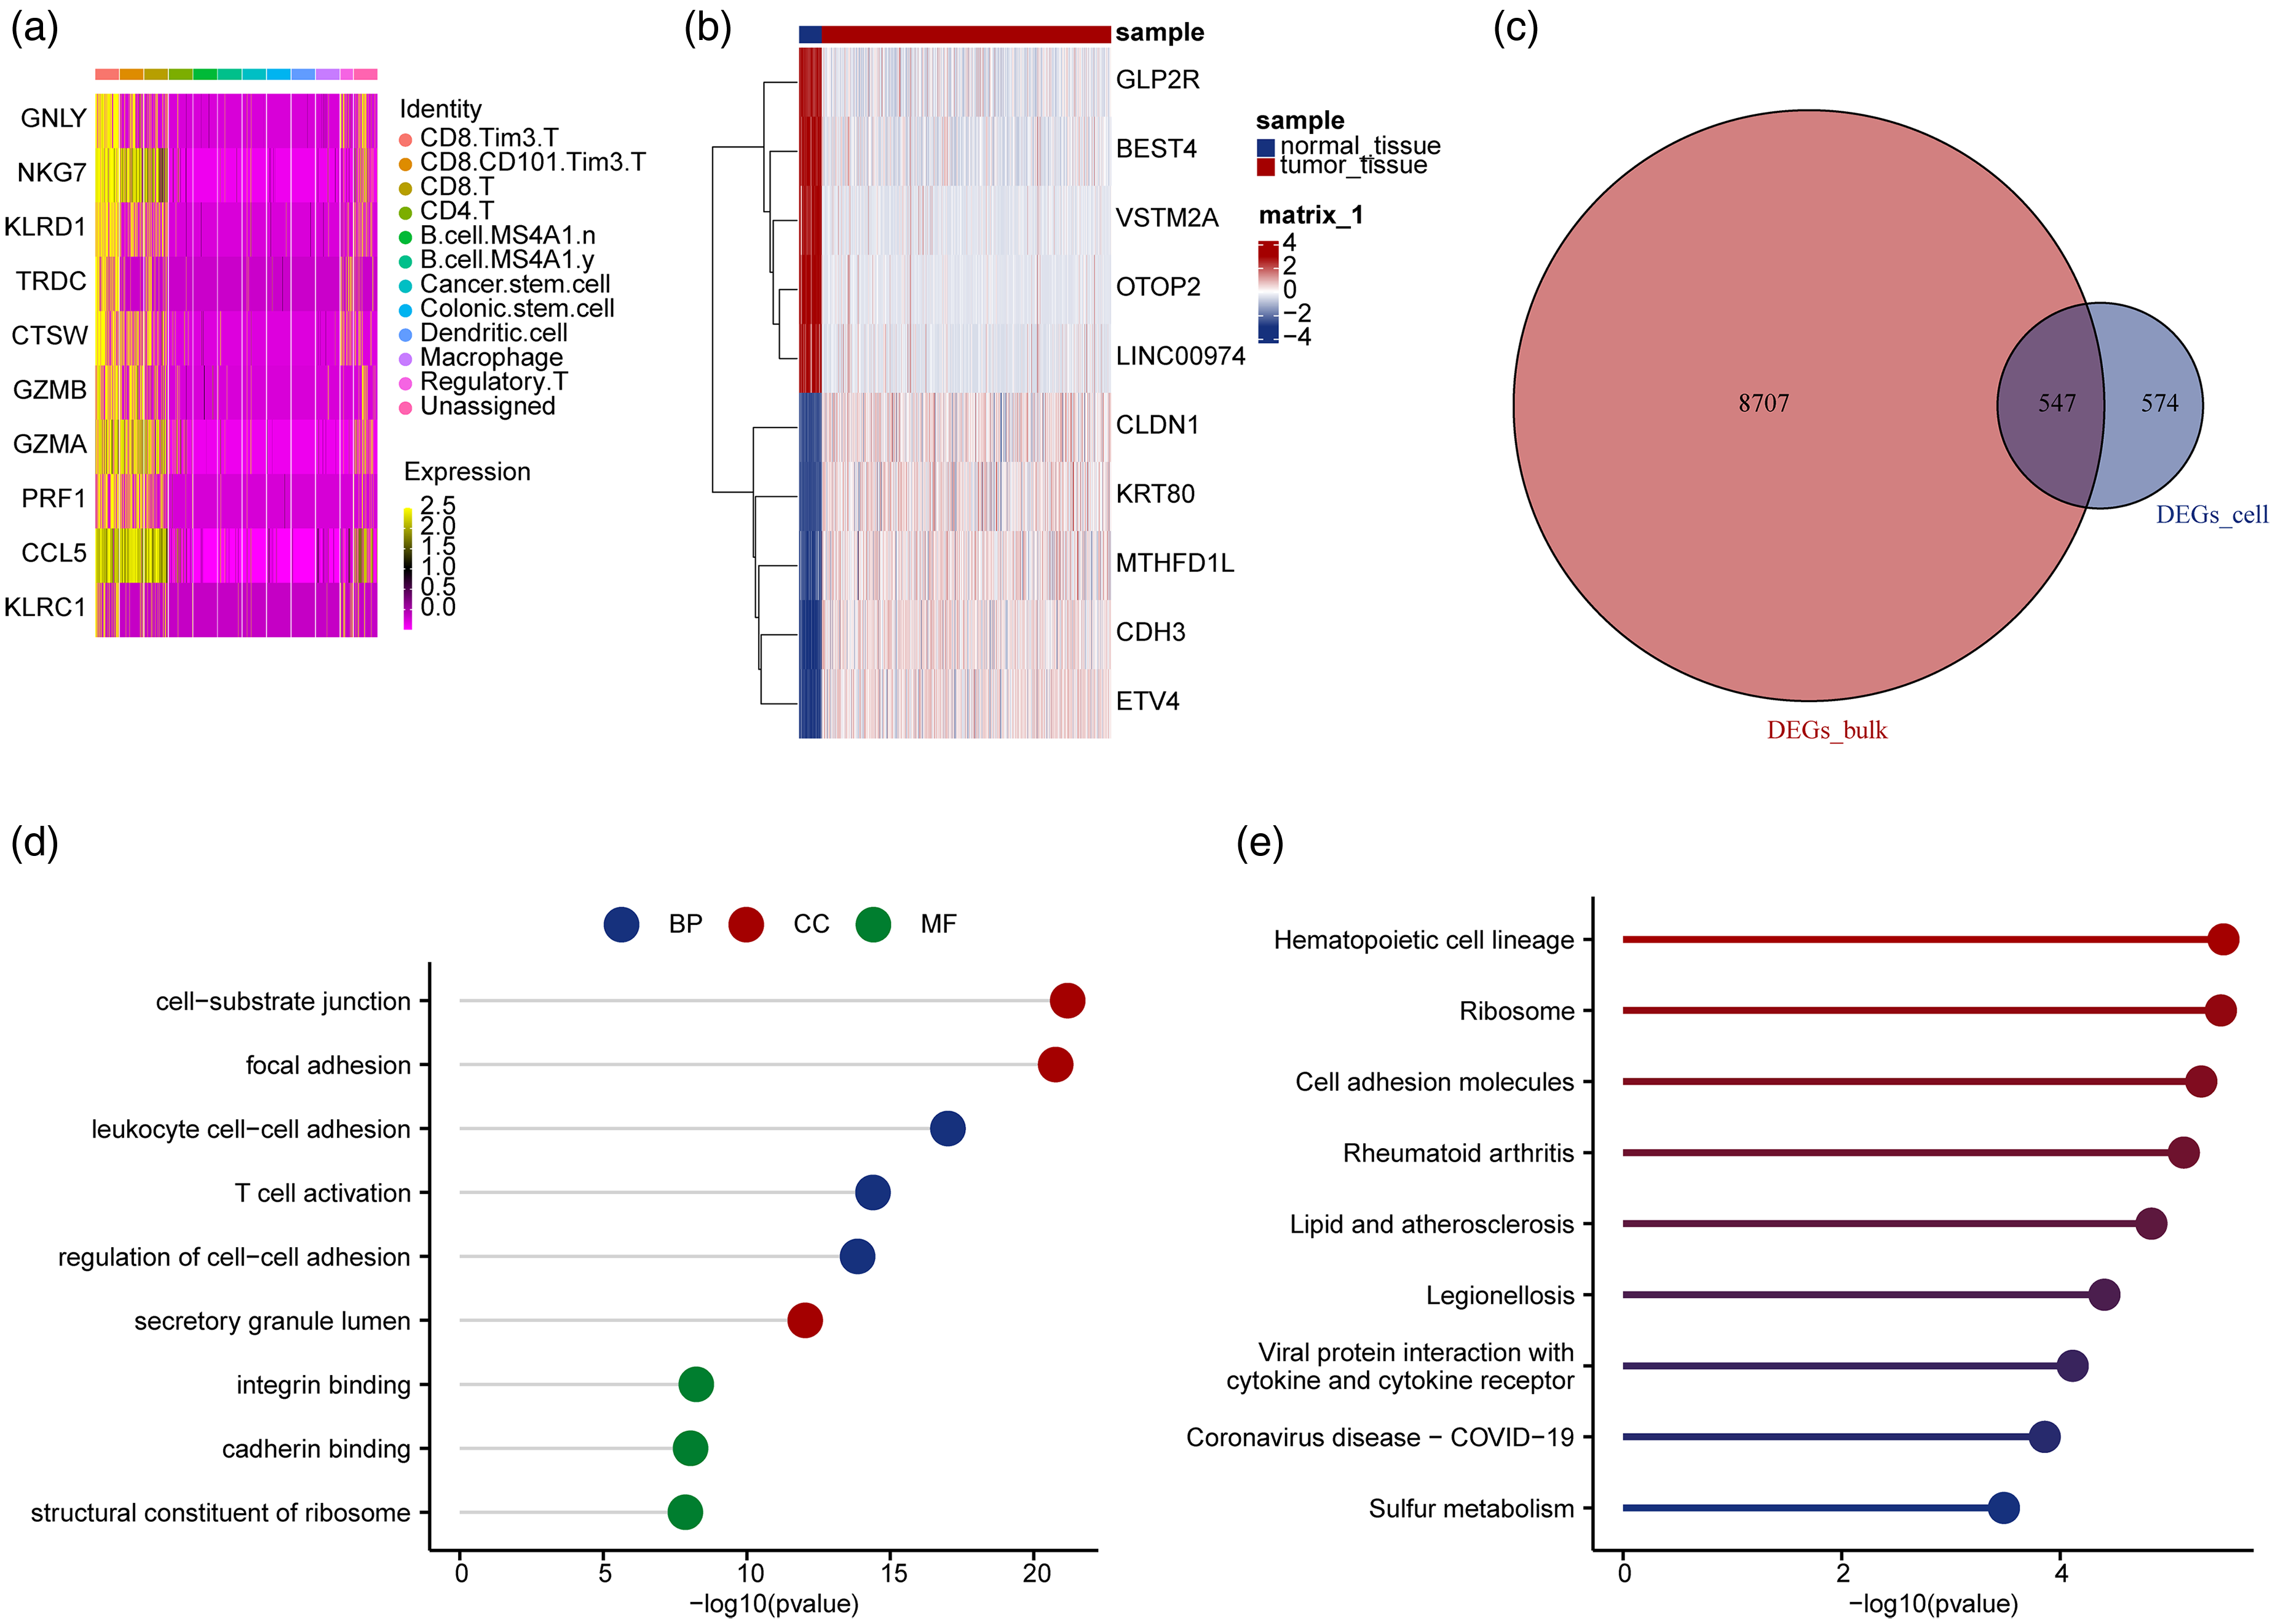
Enrichment analysis of differentially expressed genes related to CCT T cell precursors in colorectal cancer. (a) Heatmap depicting the top 10 significantly upregulated differentially expressed genes in CCT T-cell precursors in CRC. (b) Heatmap depicting the top 10 significantly differentially expressed genes in CRC. (c) Venn diagram highlighting key genes. (d) GO enrichment analysis of key genes. (e) KEGG enrichment analysis of key genes.
To explore the biological functions of key genes, we performed GO and KEGG enrichment analyses and indicated enrichment in BP such as “leukocyte cell–cell adhesion” and “T-cell activation,” CC-like “focal adhesion,” and “secretory granule lumen,” and MF including “integrin binding” and “structural constituent of ribosome” (Figure 3(d)). Enriched pathways included “Hematopoietic cell lineage,” “Ribosome,” and “Cell adhesion molecules” (Figure 3(e)). The enriched biological pathways and functions highlight the role of CCT T cell precursors in immune cell adhesion and activation, essential processes for immune response and tumor progression.
Construction and validation of prognostic model
For prognostic analysis, we performed univariate Cox regression on 547 key genes to screen and identify 53 genes significantly associated with overall survival. Subsequently, using LASSO regression in the training-validation cohort (n = 572), we refined these 53 genes to establish a 15-gene prognostic signature. This 15-gene panel was utilized to construct a prognostic model for colorectal cancer patients. The risk scores, survival times, and gene expression for the high- and low-risk groups are shown in the training set (Figure 4(a)). Kaplan–Meier survival curves demonstrated a significantly worse prognosis for high-risk patients in both the training (Figure 4(b)) and validation sets (Figure 4(c)). ROC curves confirmed the model's predictive performance, with AUC values of 0.741, 0.726, and 0.779 for 1-, 3-, and 5-year survival, respectively, in the training set (Figure 4(d)), and 0.753, 0.756, and 0.703, respectively, in the validation set (Figure 4(e)). The 15-gene prognostic model accurately predicts CRC patient survival at the transcriptomic level, with strong AUC values and significant survival differences between risk groups supporting its preliminary value for outcome stratification.
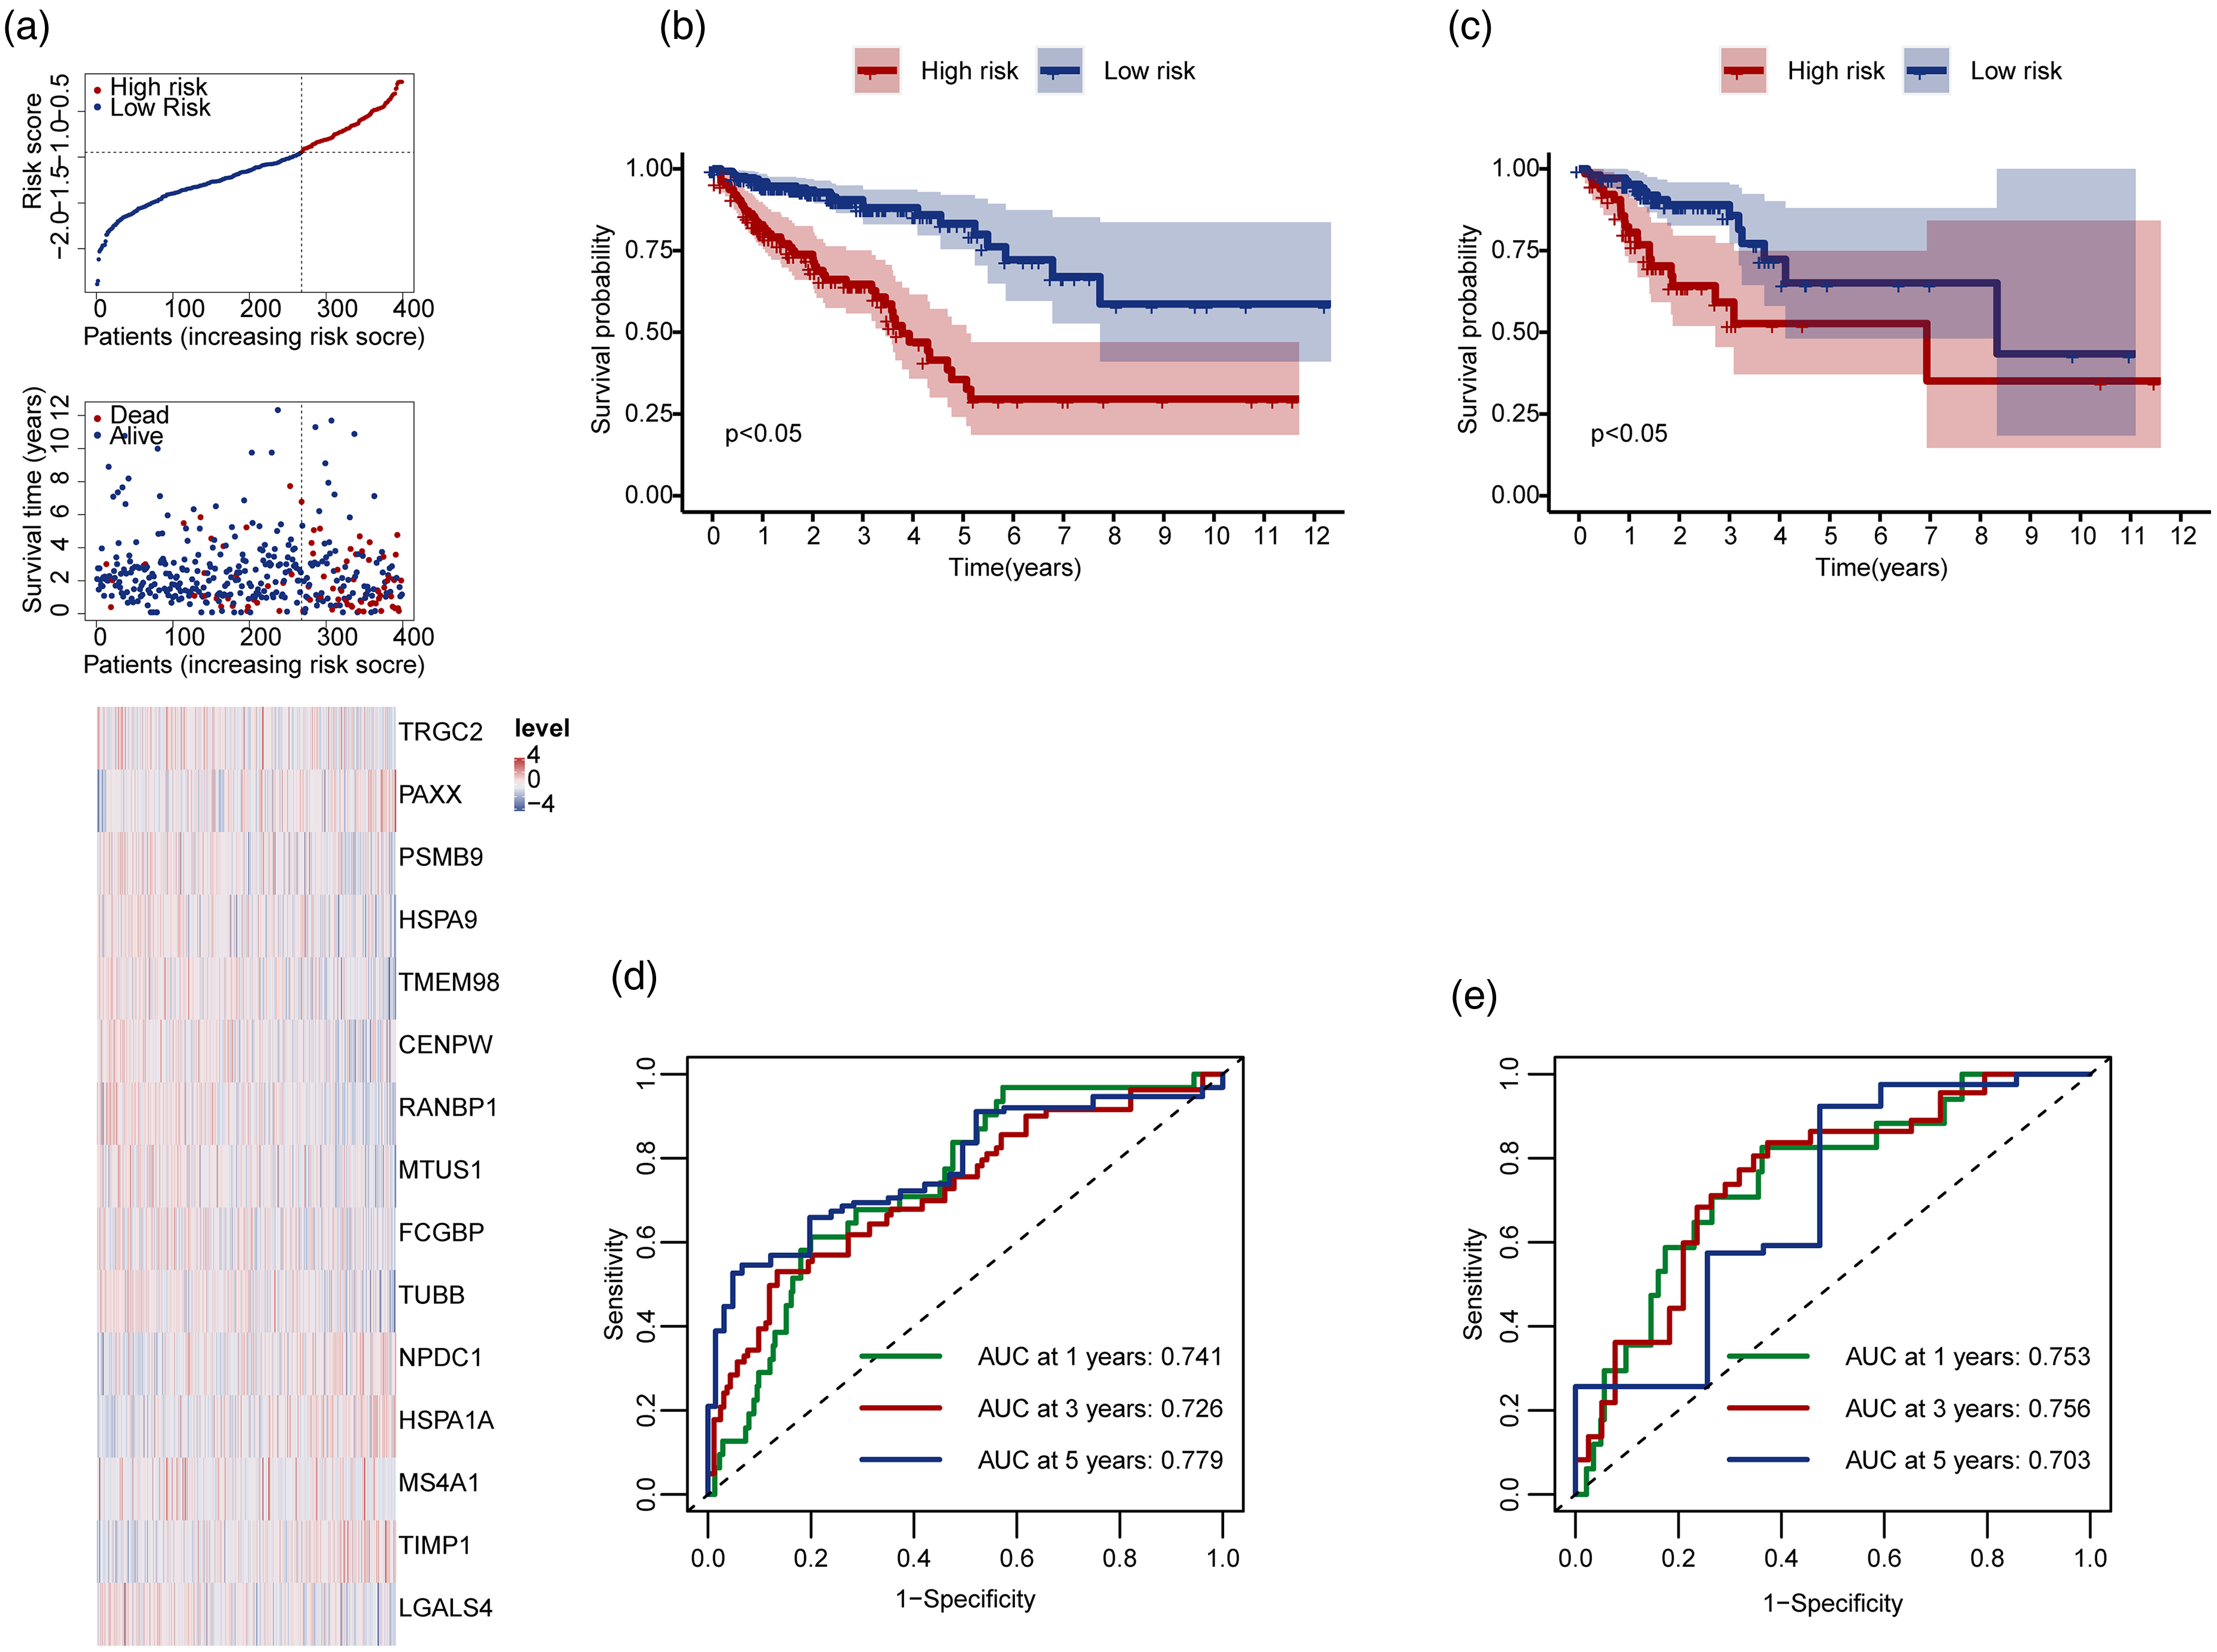
Construction and validation of the prognostic risk model. (a) Risk score distribution, survival time, and heatmap of prognostic genes in the training cohort. (b) Survival curves of high-risk and low-risk patients in the training cohort. (c) Survival curves of high-risk and low-risk patients in the validation cohort. Red represents the high-risk group, and blue represents the low-risk group. (d) Time-dependent ROC curves for 1-year, 3-year, and 5-year models in the training cohort. (e) Time-dependent ROC curves for 1-year, 3-year, and 5-year models in the validation cohort.
Kaplan–Meier survival curves for clinical subgroups indicated worse prognosis for high-risk patients according to age, sex, metastasis, nodal status, and tumor stage (Figure 5(a) to (l)). The AUC values for these subgroups are shown in Supplementary Figure S4(a) to (l), confirming the robustness of the model. Expression-based survival analysis of individual prognostic genes revealed significant differences between the high- and low-expression groups for genes like CENPW, FCGBP, and HSPA1A (Supplementary Figure S5(a) to (o)). The model's ability to stratify patients based on clinical subgroups suggests its potential to inform personalized treatment decision-making in CRC at the transcriptomic level. Additionally, the expression-based survival analysis of individual genes provides further insights into their role in CRC prognosis, supporting their potential as therapeutic targets.
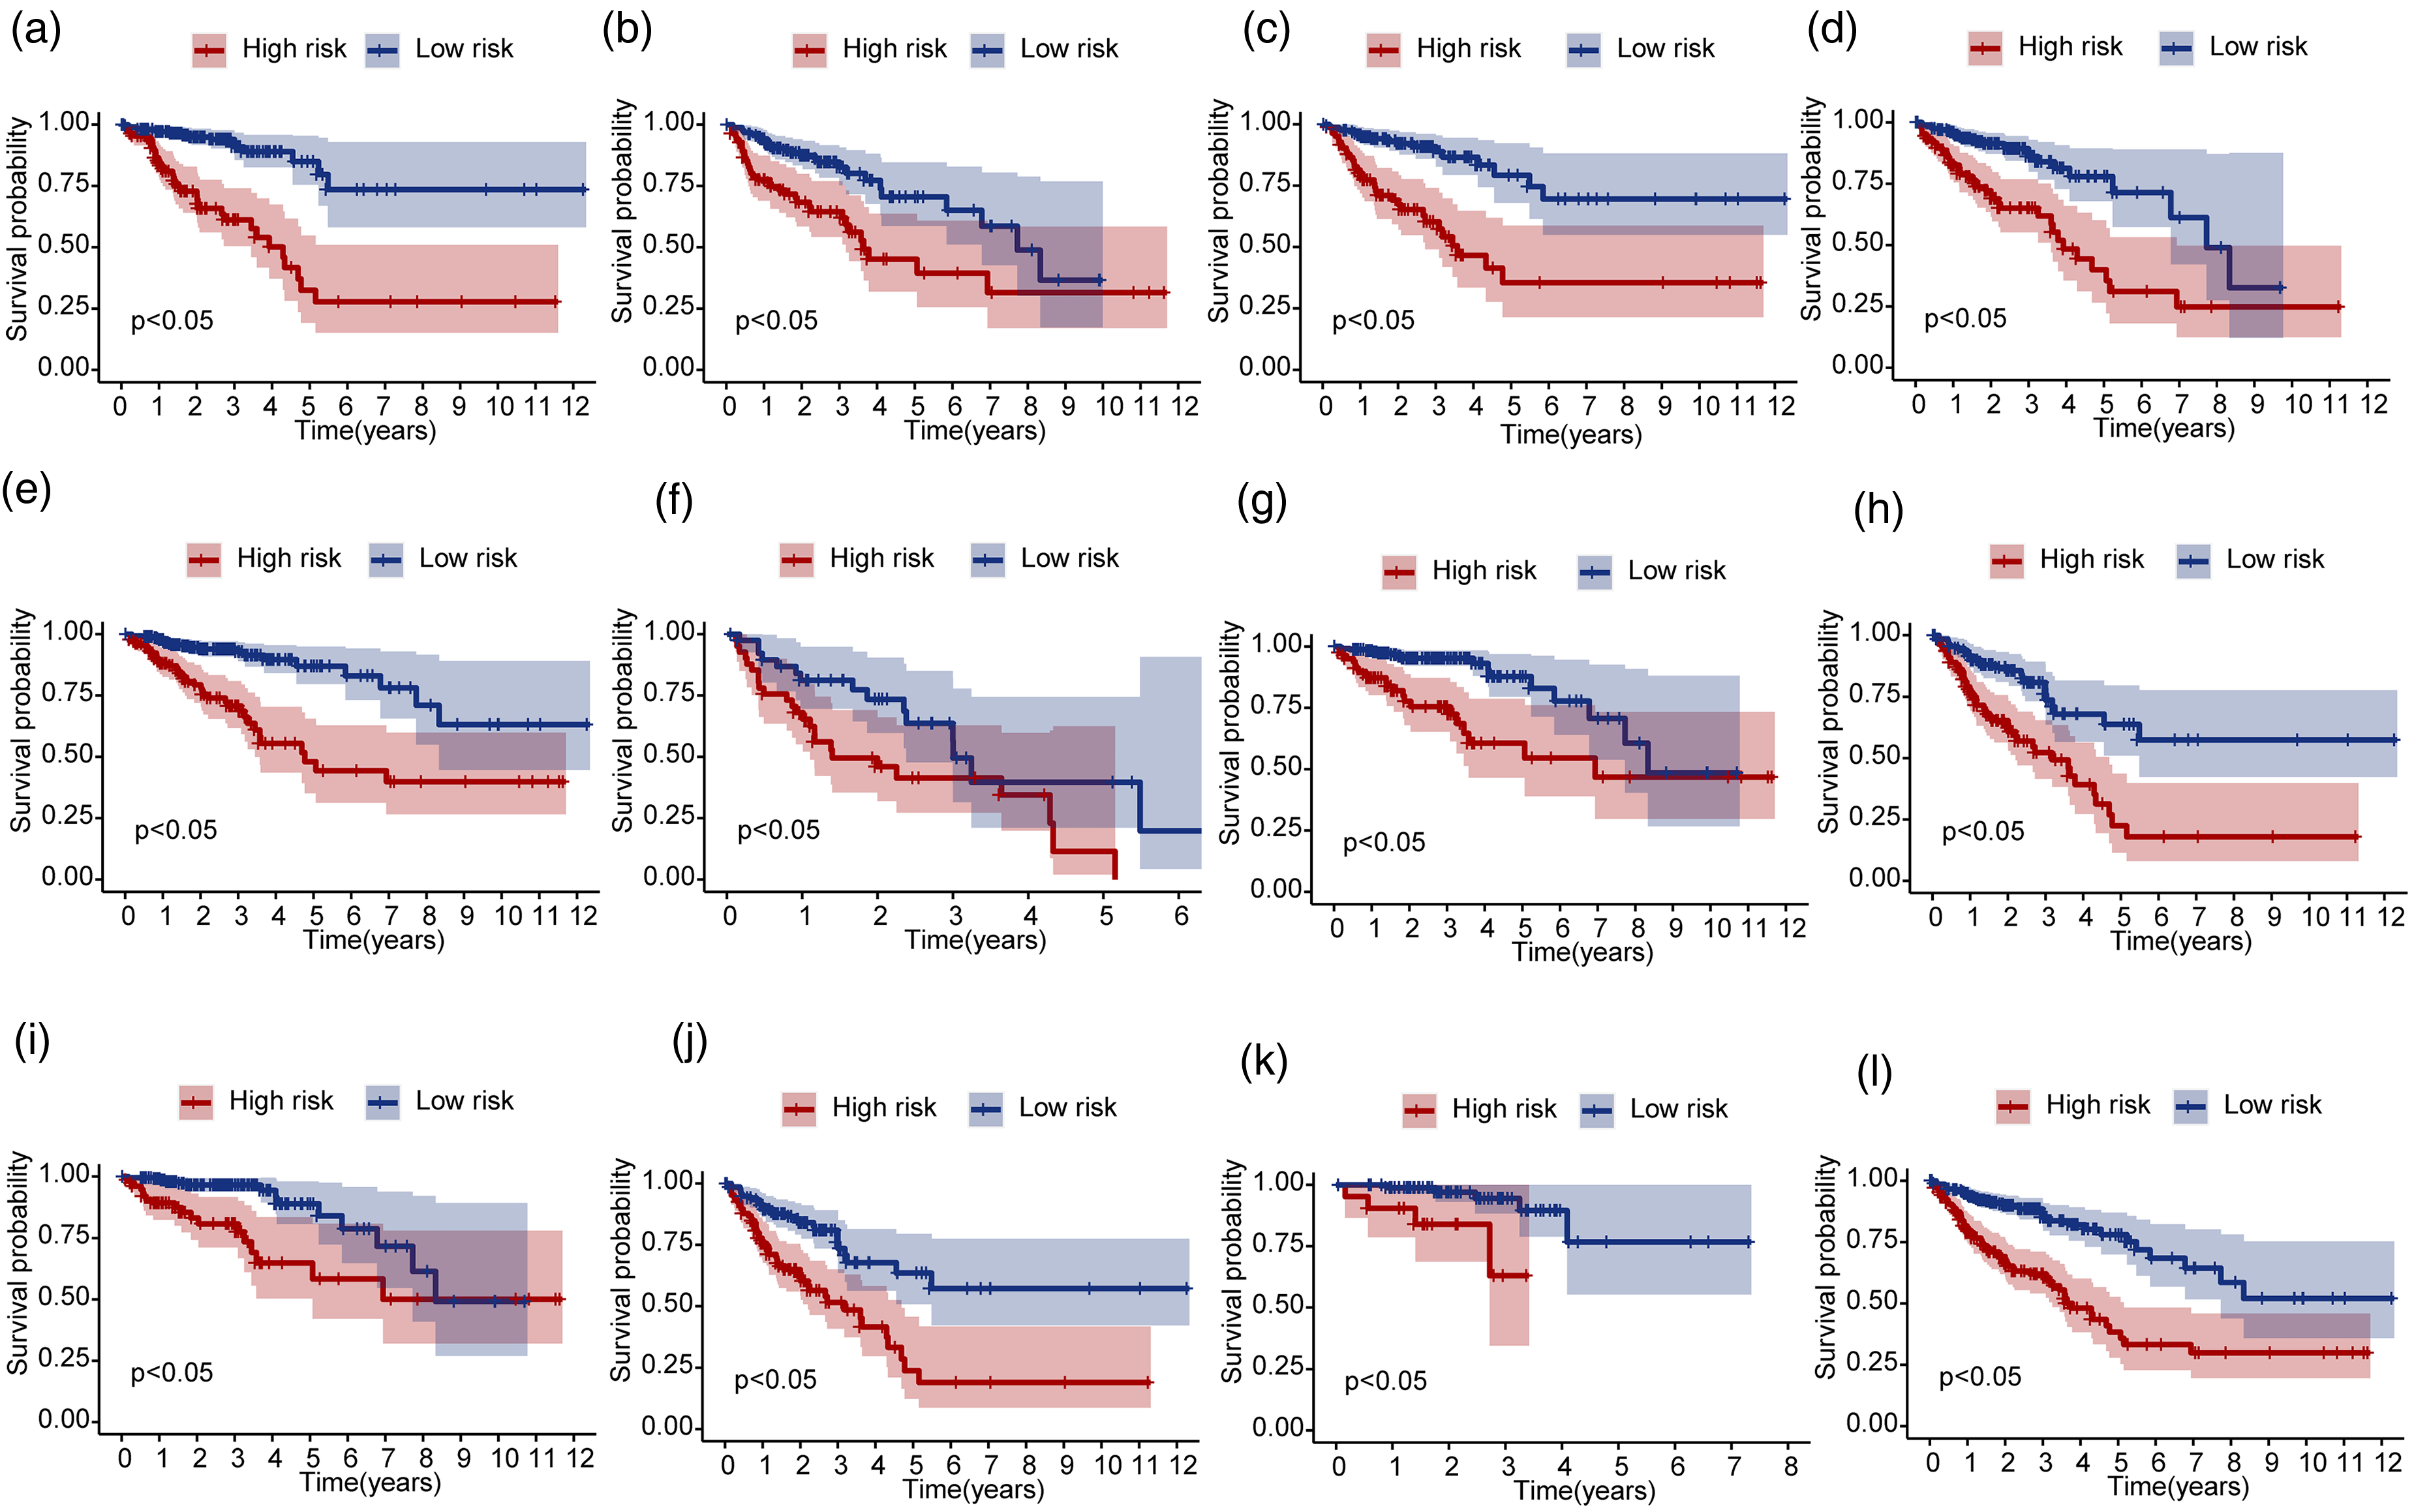
Survival curves of high-risk and low-risk patients in different clinical subgroups. (a) For patients aged <65 years. (b) For patients aged ≥65 years. (c) For female patients. (d) For male patients. (e) For the M0 subgroup. (f) For the M1 subgroup. (g) For the N0 subgroup. (h) For the N1 & N2 subgroup. (i) For the Stage I & II subgroup. (j) For the Stage III & IV subgroup. (k) For the T1 & T2 subgroup. (l) For the T3 & T4 subgroup.
Pathway enrichment analysis of DEGs in high- and low-risk groups
To investigate the mechanisms underlying the DEGs, we performed a GSEA enrichment analysis using the MsigDB pathway. The significant pathways in the high-risk group included ECM RECEPTOR activator (NES = 1.9667, adjusted P = 0.0339, FDR = 0.0167, Supplementary Figure S6(a)), GLYCOSAMINOGLYCAN BIOSYNTHESIS CHONDROITIN SULFATE (NES = 1.8654, FDR = 0.0078, Supplementary Figure S6(b)), and DILATED CARDIOMYOPATHY (NES = 1.574, FDR = 0.0198, Supplementary Figure S6(c)). In contrast, pathways such as VALINE LEUCINE AND ISOLEUCINE DEGRADATION (NES = −1.7788, FDR = 0.0033; Supplementary Figure S6(d)), PROTEASOME (NES = −1.7827, FDR = 0.0033; Supplementary Figure S6(e)), and UBIQUITIN MEDIATED PROTEOLYSIS (NES = −1.7829, FDR = 0.0033; Supplementary Figure S6(f)) were enriched in the low-risk group. These findings suggest distinct biological processes and potential therapeutic targets between high- and low-risk CRC patients. High-risk patients show enhanced extracellular matrix and glycosaminoglycan biosynthesis pathways, which may indicate tumor progression and metastasis, while low-risk patients exhibit pathways related to protein degradation, which could be linked to better cellular stress response and drug sensitivity.
GSVA enrichment analysis was conducted to identify the top five significant pathways between the groups, as visualized in a heatmap (Supplementary Figure S6(g)). This GSVA analysis provides additional evidence of the functional differences between the two risk groups, further supporting the relevance of these pathways in CRC prognosis and treatment response.
Immune infiltration analysis
To perform immune infiltration analysis, we analyzed the infiltration levels of 28 immune cell types in high- and low-risk groups using ssGSEA. The histogram revealed significant variations in immune cell proportions across patients with CRC (Supplementary Figure S7(a)), with most immune cells being positively correlated (Supplementary Figure S7(b)). Activated CD4 T cells, activated CD8 T cells, and central memory CD4 T cells showed significantly lower infiltration in the high-risk group, whereas higher infiltration was observed for activated dendritic cells, CD56bright and CD56dim NK cells, central and effector memory CD8 T cells, effector memory CD4 T cells, eosinophils, macrophages, NK cells, and regulatory T cells (P < 0.05; Supplementary Figure S8(a)). Risk score correlations with immune cells revealed a negative association with activated CD4 T cells and positive associations with macrophages, natural killer T cells, and several others (Supplementary Figure S8(b)). These findings highlight distinct immune landscapes between high- and low-risk CRC groups, where high-risk patients exhibit impaired T-cell infiltration but higher levels of innate immune cells, such as dendritic cells and macrophages. This immune profile suggests a potential immunosuppressive tumor microenvironment in high-risk patients, which could influence immune checkpoint therapy responses.
TMB, drug sensitivity analysis, and immunotherapy response
We visualized the top 20 gene mutations in COAD and READ, with APC and TP53 mutations being the most frequent in both groups (Supplementary Figure S9(a) to (d)).
Chemotherapy sensitivity analysis at the transcriptomic level indicated that low-risk patients show an association with potential better drug responsiveness to agents such as dactinomycin_1811, CDK9 inhibitors, bortezomib, rapamycin, and others (Supplementary Figure S10(a) to (i)).
Analysis of immune checkpoint gene expression revealed upregulation of TNFRSF4 in the high-risk group, whereas CD24, CD274, CD28, CD47, CTLA4, and TIGIT were downregulated (Supplementary Figure S11(a)). TIDE analysis indicated higher dysfunction and exclusion; TIDE scores in the high-risk subgroup, indicated a greater probability of immune escape and transcriptomic associations with potentially limited efficacy of immune checkpoint inhibitors (ICIs) (Supplementary Figure S11(b)). By contrast, patients in the low-risk group exhibited a higher potential for clinical benefit from ICI therapy (Supplementary Figure S11(c)). These findings suggest that the high-risk CRC group is characterized by a compromised immune response and enhanced immune escape at the transcriptomic level, which correlates with the limited therapeutic efficacy of ICIs. Conversely, low-risk patients are associated with favorable responses to ICIs and chemotherapy, underscoring the value of risk stratification in the development of personalized treatment strategies.
Discussion
CRC is a heterogeneous disease with diverse clinical outcomes significantly influenced by the tumor microenvironment, particularly the immune context. 42 The immune microenvironment is characterized by complex interactions between tumor cells, immune cells, stromal components, and cytokine networks, all of which are crucial for tumor progression and therapeutic responses. 43 CRC exhibits varying immunogenicity with distinct immune infiltrates at different stages and molecular subtypes. The immune landscape typically includes CD8+ cytotoxic T cells, CD4+ helper T cells, regulatory T cells, B cells, NK cells, macrophages, and dendritic cells. 44 The balance and functional state of these immune populations critically affect disease and patient prognosis.
Our pseudo-time analysis identified three major nodes in the differentiation trajectories of the CCT cells and their precursors. Notably, PD-1 blockade therapy was associated with a higher expression of CCT precursor cells at the transcriptomic level, suggesting that this therapy is associated with altered differentiation of CCT precursors into terminal cells, thereby potentially modulating the tumor's immune microenvironment. Functional enrichment analysis indicated that PD-1 blockade induces unique differentiation patterns in CCT cells, particularly in state 4, with significant pathways such as “cellular response to chemical stress” and “response to temperature stimulus,” highlighting enhanced tumor sensitivity.45,46 Furthermore, PD-1 therapy is associated with increased communication signals (an indirect metric of cell interaction) in CCT precursor cells, particularly through the human leukocyte antigens (HLA)-E pathway, suggesting a potential role of HLA in immunotherapy. Enhanced signaling from dendritic cells to CCT precursors was also observed, suggesting their potential importance in immune responses.22,47
We identified seven distinct cell types and categorized T cells into three subgroups: CD4+, CD8+, and regulatory T cells. Notable CD8+ subpopulations expressing CD101 and HAVCR2 suggest roles in T-cell exhaustion, indicating potential therapeutic targets. 48 PD-1 immunotherapy significantly reshaped the tumor microenvironment, increasing cell–cell interactions among immune cells, consistent with the existing literature on the effects of immune checkpoint inhibitors.11,12 Our study provides a detailed interaction map illustrating how the PD-1 blockade alters specific cell types and their interactions.
Differential gene expression analysis revealed that key genes such as CDH3, ETV4, KRT80, and CLDN1 are upregulated in CRC samples. These findings correlate with those of previous studies linking these genes to tumor progression. For instance, CDH3 has been implicated in cell adhesion and migration and influences the invasive properties of the tumor microenvironment. ETV4 regulates cell proliferation and invasion, and its identification aligns with its role in cancer cell invasiveness. The identification of ETV4 in our study aligns with its known role in promoting the invasive behavior of cancer cells, underscoring its potential as a therapeutic target. CLDN1, a component of tight junctions, affects epithelial barrier integrity and is associated with tumor progression. Our findings from the GO enrichment analysis, which highlighted pathways related to cell–cell adhesion and integrity of cell junctions, support the significant role of CLDN1 in CRC pathogenesis. The role of KRT80 in CRC is less defined, but its upregulation suggests its potential function in tumor stability and metastasis. The upregulation of KRT80 in our CRC samples and its involvement in the cell adhesion pathways suggest its potential role in maintaining tumor cell stability and promoting metastasis. Our enrichment analyses identified critical pathways, including leukocyte adhesion and T-cell activation, that are pivotal in CRC pathogenesis and immune evasion, thus providing a basis for targeted therapies.
The construction and validation of a 15-gene prognostic model based on single-cell RNA-seq data represent a significant advancement over traditional prognostic models. Additionally, we systematically examined colorectal cancer-related prognostic annotations for these 15 genes in the Human Protein Atlas (HPA) database (https://www.proteinatlas.org/). The analysis revealed that four genes—HSPA9, TMEM98, MTUS1, and NPDC1—are explicitly annotated in the HPA database as biomarkers significantly associated with prognosis in colorectal cancer. The robustness of this model across different clinical subgroups, and its high accuracy in stratifying overall survival supports further investigation for potential clinical translation. In the training cohort, the model demonstrated a strong predictive performance. Robustness was confirmed in the validation cohort. The risk score proved to be an independent prognostic stratification factor, and the nomogram model—which integrated the clinical characteristics—exhibited good stability and accuracy for survival stratification. By informing personalized treatment strategy development, this model may serve as a preliminary reference for future translational research based on individual risk profiles and potentially support the improvement of patient prognosis assessment. Combining the risk score with other clinical indicators can increase its utility in clinical settings and promote more precise and personalized treatment strategies. Importantly, our model extends beyond prognostic stratification by linking gene signatures to immunotherapy responsiveness. TIDE analysis and immune infiltration profiling revealed that high-risk patients exhibited an immunosuppressive TME characterized by increased regulatory T cells, macrophages, and NK T cells, alongside reduced infiltration of activated CD8+ T cells. This immune landscape is consistent with impaired antitumor immunity and poor clinical outcomes. In contrast, low-risk patients showed lower TIDE scores and a higher likelihood of benefiting from immune checkpoint inhibitors. Drug sensitivity analyses further suggested that low-risk patients may respond more favorably to specific chemotherapeutic agents, highlighting the potential of this model to guide personalized treatment strategies.
Immune infiltration analysis revealed that the enrichment of regulatory T cells, macrophages, and NK T cells in the high-risk group—indicating an immunosuppressive TME—correlated with poor prognosis. Regulatory T cells are known to suppress anti-tumor immune responses by inhibiting the activity of effector T cells and secreting immunosuppressive cytokines. 49 Macrophages, particularly tumor-associated macrophages, can adopt an M2-like phenotype that promotes tumor growth, angiogenesis, and metastasis, while inhibiting cytotoxic T- cell function. NK T cells, although generally considered to have anti-tumor functions, can also contribute to immunosuppression and tumor progression in certain contexts through the release of cytokines like interleukin-10 and transforming growth factorbeta. Conversely, reduced infiltration of activated CD8+ T cells in high-risk patients underscores the challenges in mounting effective antitumor immune responses in these individuals. Activated CD8+ T cells are crucial for direct tumor cell killing and the production of pro-inflammatory cytokines that enhance antitumor immunity. 50 These findings highlight the importance of targeting the immunosuppressive components of TME to enhance therapeutic efficacy.
Our analysis demonstrated that patients with lower risk scores may respond better to chemotherapeutic agents such as dactinomycin_1811, CDK9_5576_1708, and bortezomib_1191. This finding suggests that risk stratification can optimize treatment efficacy. Additionally, the analysis of TMB and drug sensitivity further emphasized the potential of the prognostic model for guiding treatment strategies. Patients with lower risk scores showed better predictive responses to several chemotherapeutic agents, which further supports the utility of this model. This suggests that high-risk patients may be transcriptomically associated with a diminished response to ICIs, as evidenced by significantly elevated TIDE scores. These findings provide a foundation for selecting personalized treatment plans, potentially improving therapeutic outcomes, and reducing adverse effects. Investigating the molecular mechanisms underlying drug sensitivity can further enhance the clinical applications of these findings. Understanding the effect of immune checkpoint differences on ICI efficacy may lead to the development of more effective combination therapies. Combining drug sensitivity data with other clinical and molecular information can pave the way for precision medicine approaches, allowing tailored treatment plans based on individual patient profiles to achieve optimal results.
Limitations
(a) A small number of PD-1-treated samples in the scRNA-seq cohort may affect the stability of cell–cell communication analysis and the reliability of screening treatment-related characteristics; (b) retrospective design based on public databases, with potential selection bias and lack of detailed clinical baseline data matching; (c) unaccounted key clinical heterogeneities (e.g. MSI status, prior treatment history) that may confound results; and (d) the lack of external validation and bootstrap analysis due to scarce public CRC prognostic scRNA-seq datasets and heterogeneity across existing datasets.
These factors limit the generalizability of our conclusions. Future multi-center, large-sample prospective studies with detailed clinical data are needed for validation; bootstrap analysis will be conducted to evaluate gene signature stability as more relevant public datasets become available.
Conclusion
Our study offers a comprehensive single-cell resolution analysis of the CRC TME at the transcriptomic level, revealing the potential cellular and molecular mechanisms associated with CRC progression and the association with PD-1 immunotherapy response. The discovery of distinct T-cell subpopulations, detailed mapping of cell–cell interactions, and the development of a robust prognostic stratification model have marked substantial progress compared to earlier research. These insights have potential implications for informing the development of personalized therapeutic strategies for CRC, which may facilitate prognostic assessment and offer novel approaches to overcoming immunotherapy resistance.
Supplemental Material
sj-docx-1-jbm-10.1177_03936155261441324 - Supplemental material for Single-cell RNA sequencing analysis reveals cellular heterogeneity and immune microenvironment dynamics in colorectal cancer
Supplemental material, sj-docx-1-jbm-10.1177_03936155261441324 for Single-cell RNA sequencing analysis reveals cellular heterogeneity and immune microenvironment dynamics in colorectal cancer by Jin-liang Zhu, Hong-Jian Gao, Lu-ji Qiao, Rong-xiang Si, Xing-dong Li, Yi You and Zhi-tao Yin in The International Journal of Biological Markers
Footnotes
Ethics statement
Not applicable.
Funding
The authors received no financial support for the research, authorship, and/or publication of this article.
Declaration of conflicting interests
The authors declared no potential conflicts of interest with respect to the research, authorship, and/or publication of this article.
Authors’ contributions
ZY, JZ, and HG contributed to the conception and study planning. JZ, LQ, RS, XL, and YY were responsible for data collection and performed the statistical analysis. JZ wrote the first draft of the manuscript. ZY and HG revised the manuscript. All authors reviewed and approved the final manuscript.
Data availability statement
The data used in this study were mainly obtained from the GEO database (https://www.ncbi.nlm.nih.gov/geo/) and the TCGA database (![]() ), and the numbers were GSE205506 dataset, TCGA-COAD, and TCGA-READ, respectively. All datasets utilized in the study are publicly available.
), and the numbers were GSE205506 dataset, TCGA-COAD, and TCGA-READ, respectively. All datasets utilized in the study are publicly available.
Supplemental material
Supplemental material for this article is available online.