
Abstract
Purpose
This study aimed to investigate KRAB-associated protein 1 (KAP1) expression in pleural mesothelioma (PM) and its impact on the biological behavior of the human pleural mesothelioma cell line MSTO-211H, providing a specific biomarker for the early clinical diagnosis of PM.
Patients and methods
KAP1 expression levels in PM tissues were detected using immunohistochemistry. Lentivirus infection was used to construct MSTO-211H mesothelioma cell lines with stable KAP1 overexpression or knockdown, and the efficiency of KAP1 overexpression or knockdown was detected using qRT-PCR(quantitative Reverse Transcription PCR) and Western blotting. The effects of KAP1 overexpression and knockdown on MSTO-211H mesothelioma cell proliferation, migration, and invasion were detected using cell counting kit-8, plate colony formation, cell scratch, and transwell invasion assays, respectively. The effects of KAP1 overexpression and knockdown on the cell cycle, related cyclins, and apoptosis were detected using flow cytometry. Gene enrichment and correlation analysis of mesothelioma were performed using bioinformatics analysis.
Results
KAP1 was significantly overexpressed in PM tissues compared with normal pleural tissues (P < 0.05). Compared to the control group, KAP1 overexpression in mesothelioma MSTO-211H cells significantly enhanced proliferation, migration, and invasion (P < 0.05), without causing cell cycle arrest, and significantly increased the mRNA and protein levels of cyclin D1 and cyclin E (P < 0.05), whereas the apoptosis rate did not significantly change (P > 0.05). Conversely, KAP1 knockdown in mesothelioma MSTO-211H cells significantly inhibited their proliferation, migration, and invasion abilities (P < 0.05), induced G0/G1 phase arrest in the cell cycle, and significantly increased the apoptosis rate (P < 0.05). Spearman correlation analysis revealed significant positive associations between KAP1 mRNA expression and TP53 and SHOX2. Conversely, KAP1 expression was significantly negatively correlated with MTAP and MSLN. GSEA reveals KAP1-associated enrichment of DNA repair, cell cycle, and proteostasis pathways in TCGA-MESO.
Conclusion
KAP1 is highly expressed in PM and functions as an oncogene-like regulator, enhancing tumor cell growth and aggressiveness.
Clinical trial registration
2023-28.
Introduction
Mesothelioma is a primary tumor that primarily affects the pleura, peritoneum, pericardium, and tunica vaginalis testis. Pleural mesothelioma (PM) is the most common type. 1 It is a highly aggressive tumor that originates from mesothelial cells, characterized by high mortality, insidious onset, and poor prognosis. 2 The major histological subtypes of PM include epithelioid, sarcomatoid, and biphasic, with epithelioid being the most common. In contrast, the sarcomatoid subtype is more aggressive and is associated with a worse prognosis. 3 The staging and grading of malignant mesothelioma are critical for clinical treatment decisions and prognosis evaluation. The recently released the TNM Staging System 9th edition (2025) introduces significant updates to the T classification for pleural mesothelioma. This includes the first-ever quantitative assessment of tumor thickness, which improves staging objectivity and prognostic accuracy. 4 The N and M classifications largely retain their previous structures. Based on international multicenter big data analysis, this updated system enables more precise staging and enhances clinical trial design. In the field of pathology, the prognostic significance of histological subtypes and nuclear grading has become increasingly important. 5 Notably, the biparametric nuclear grading system, which includes nuclear features and necrosis, has been incorporated into the guidelines for epithelioid mesothelioma. This system provides better prediction of survival outcomes. The latest guidelines also recommend the use of immunohistochemistry (IHC; e.g., BAP1, (methylthioadenosine phosphorylase) (MTAP)) and molecular testing (e.g., CDKN2A deletion) to assist in diagnosis and classification, improving diagnostic accuracy and guiding individualized treatment strategies. 6 Research indicates that PM is a rare occupational cancer primarily caused by asbestos exposure. The disease has a long latency period, and patients are often diagnosed at intermediate or advanced stages due to the lack of early diagnostic biomarkers. As a result, the median survival time is approximately 12 months, with a 5-year survival rate of around 10%.7,8 Therefore, understanding the pathogenesis of PM and identifying specific biomarkers for early diagnosis are essential for improving clinical management and enhancing patient quality of life.
KRAB-associated protein 1 (KAP1), also known as TRIM28, is a member of the tripartite motif-containing (TRIM) protein superfamily. It is a large, multidomain protein with highly versatile chromatin-associated functions. 9 The KAP1 gene is located at 19q13.43, comprises 17 exons, and encodes a protein of 835 amino acid residues. Research by Lorenzini et al. 10 indicated that KAP1 is a novel non-hereditary susceptibility gene for PM. KAP1 supports cell growth by orchestrating G2/M-specific programs to ensure proper mitotic execution. In the absence of KAP1, RNA polymerase II (RNA-Pol II) disengages from the promoters of G2/M genes, leading to prolonged mitotic arrest and subsequent death of PM cells. As a transcriptional coactivator, KAP1 is essential for the G2/M transition and mitotic execution and is responsible for controlling the expression of core genes during this specific cell cycle phase. Upon KAP1 depletion, the expression of key mitotic factors, including AURKA and AURKB, is significantly reduced, profoundly impacting chromosome condensation, alignment, and segregation. Studies have shown that KAP1 plays crucial roles in transcriptional repression, maintaining embryonic stem cell pluripotency, and regulating tumor cell proliferation, invasion, and migration. 11 However, the relationship between KAP1 and PM remains unclear. This study investigated KAP1 expression levels in PM and its impact on the biological behavior of PM cells. Lentiviral vectors for KAP1 overexpression and knockdown were constructed. qRT-PCR and Western blotting were used to verify the efficiency of KAP1 overexpression and knockdown. The effects of KAP1 overexpression and knockdown on the proliferation, migration and invasion, cell cycle, and apoptosis of mesothelioma MSTO-211H cells were examined using cell counting kit-8 (CCK-8), plate colony formation, cell scratch, Transwell invasion, cell cycle, and apoptosis assays, respectively. The aim of this study was to explore the expression of KAP1 in mesothelioma and to determine its influence on the biological behavior of tumor cells, providing an experimental foundation for identifying early diagnostic biomarkers for mesothelioma patients and exploring its potential clinical utility.
Material and methods
Materials
The human malignant pleural mesothelioma cell line (MSTO-211H cells), human KAP1 gene overexpression and knockdown lentiviral vectors, and control lentiviral vectors were purchased from Vigene Biosciences. The CCK-8 kit was purchased from DOJINDO, Japan. RPMI 1640 medium and the Annexin V-kFluor647/PI double-staining apoptosis detection kit were purchased from KeyGEN Biotech. Fetal bovine serum (FBS) and 0.25% trypsin were purchased from Gibco. Phosphate buffered saline (PBS), high-efficiency RIPA lysis buffer, PMSF, and 1% crystal violet were purchased from Solarbio. Matrigel matrix was purchased from BD Biosciences. Transwell chambers were purchased from Corning. The cell cycle detection kit was purchased from Beyotime Biotechnology. A real-time fluorescence quantitative polymerase chain reaction (PCR) instrument (ABI), microplate reader (Rayto), micro nucleic acid and protein quantifier (Life Real), chemiluminescence imaging system (Bio-RAD), and flow cytometer (BD AccuriTM C6 PLUS) were used.
IHC detection of KAP1 expression in PM tissues and adjacent non-cancer tissues
Twenty normal pleural tissue samples and 40 PM tissue samples were collected from the Department of Pathology at Chuxiong Prefecture People's Hospital from January 2019 to May 2025. Immunohistochemistry (IHC) was used to analyze whether the expression of KAP1 was correlated between normal individuals and PM patients. Positive staining of the KAP1 protein was localized in the nucleus as brownish-yellow granules. The staining intensity was scored as follows: colorless, 0 points; light yellow, 1; brownish-yellow, 2; and brown, 3. The percentage of positive cells was scored as follows: 0∼5%, 0 points; 6%∼25%, 1; 26%∼50%, 2; 51%∼75%, 3; and >75%, 4. The final score was determined by multiplying the two assessment scores: 0 points as (−), 1–4 (+), 5–8 (++), and 9–12 (+++). A score of ≤4 was considered low expression, whereas a score of >4 was considered high expression. All specimens were diagnosed by more than two pathologists using a double-blind method, and none of the patients had undergone radiotherapy or chemotherapy prior to surgery. This study was approved by the Ethics Committee of Chuxiong Yi Autonomous Prefecture People's Hospital (Approval No. 2023-28).
Cell culture
The MSTO-211H mesothelioma cells were cultured in RPMI 1640 medium supplemented with 10% FBS and incubated at 37 °C in a 5% CO2 incubator. When the cells reached 80%–90% confluence, 1 mL of 0.25% trypsin was added for digestion for 1.5 min, followed by gentle shaking. The volume of complete medium was immediately doubled to terminate the digestion. The cell suspension was centrifuged at 1000 rpm for 5 min, and the cells were collected for subsequent experiments.
Lentiviral transduction
A lentivirus for human KAP1 gene overexpression and a lentivirus for human KAP1 gene knockdown were constructed and packaged by Vigene Biosciences. Approximately 1 × 10⁵ cells were seeded per well in a 6-well plate (reaching 30–40% confluence the next day). After the virus was added, the mixture was gently mixed. The virus volume (μL) = cell number × MOI/titer (TU/mL) × 1000, and the culture was continued. At 12 h post infection, the cells exhibited good morphology with no adverse effects caused by the virus. At 24 h post infection, the medium was replaced with fresh medium, and the culture was continued. Observations and imaging were performed under a fluorescence microscope at 24, 48, and 72 h post infection. To screen the transfected cells, 2 μg/mL puromycin was added to eliminate untransfected cells and transfected cells that failed to express properly. The expression level of KAP1 was detected using q-PCR and Western blotting.
Western blotting
The cells were seeded in a 6-well plate. When the cell density reached over 80%, the old medium was discarded, and the cells were washed three times with 1 mL of PBS buffer per well. An appropriate amount of RIPA lysis buffer was added to each well, and PMSF was added a few min before use to achieve a final concentration of 1 mM. The cells were lysed on ice for 30 min. After thorough lysis, the cells were scraped off using a cell scraper and transferred to an EP tube. The mixture was subsequently centrifuged at 4 °C and 12,000 × g for 30 min, after which the supernatant was retained. A small amount of the supernatant was collected for protein concentration determination using the bicinchoninic acid (BCA method. After SDS‒PAGE, the proteins were transferred to membranes. The PVDF membrane was blocked with blocking buffer at room temperature for 1.5 h. Then, the primary antibody KAP1 (1:2000 dilution) and the internal reference β-actin (1:2000 dilution) were added, and the samples were incubated overnight at 4 °C. The samples were incubated with the secondary antibody at room temperature for 1.5 h. The membrane was washed with Tris buffered saline + Tween 20 (TBST) three times for 10 min each. Reagents A and B were mixed in a 1:1 ratio in a centrifuge tube for later use. An appropriate amount of the luminescent mixture was aspirated and evenly dropped onto the front side of the membrane. Imaging was performed using the ChemiDoc XRS + chemiluminescence imaging system. The grayscale values were analyzed using ImageJ, and the relative expression level of the KAP1 protein was calculated.
Detection of KAP1 mRNA expression in cells using RT-PCR
TRIzol reagent was added to the cell suspension. The sample was centrifuged, and 1 μL of the supernatant was collected to measure the RNA concentration and the OD260/280 ratio. Reverse transcriptase M-MLV was used to reverse transcribe the messenger RNA (mRNA) into complimentary DNA. The primer sequences for amplifying the internal reference genes GAPDH and the KAP1 gene are shown in Supplementary Table 1. The fluorescence was detected via quantitative qRT-PCR, the relative expression level was calculated with the 2 − ΔΔCt method, and three replicate experiments were performed.
CCK-8 assay for the measurement of cell proliferation
After transfection, the cells were seeded into a 96-well plate. Once the cells had adhered, fresh medium and CCK-8 reagent were added at 24 h, 48 h, 72 h, and 96 h, separately. The plate was then placed in a CO2 incubator and incubated in the dark for 2 h. The absorbance (OD value) at 450 nm was measured using a microplate reader. The experiment was repeated three times, and a proliferation curve was plotted.
Cell scratch assay for assessing cell migration ability
Three milliliters of the cell suspension in the logarithmic growth phase was seeded into a 6-well plate at approximately 1 × 10⁶ cells per well and incubated overnight until confluence. The supernatant was discarded, and a marker was used to draw five horizontal lines on the bottom of the 6-well plate. A 100 µL pipette tip was used to make three scratches perpendicular to the marked lines, which were subsequently washed with PBS three times to remove detached cells. The cells were cultured at 37 °C in 5% CO2. At 0 h, 24 h, and 48 h, 10 images per group were captured at the same position under an inverted microscope. ImageJ was used to measure the area at 0 h, 24 h, and 48 h. Migration rate = (average area at 0 h − average area at × h)/(average area at 0 h) × 100%. The experiment was repeated three times for each group, the images were processed and analyzed, and the data were plotted.
Transwell assay for cell invasion ability
The cells in good condition with a density reaching 80–90% were selected for the experiment. Digestion and centrifugation were performed on the cells to prepare a cell suspension, and the cell density was adjusted to 1 × 10⁵/mL. The serum-free medium was mixed with BD Matrigel at a 4:1 ratio, 100 µL of the diluted matrix gel was added to the upper chamber, and the mixture was incubated at 37 °C for 2 h to form a visible white film. A total of 100 µL of the cell suspension was added to the upper chamber at 1 × 10⁴ cells/well, 500 µL of complete medium containing 10% FBS was added to the lower chamber, and the mixture was incubated in a cell culture incubator for 48 h. The upper chamber was removed, and a cotton swab was used to remove the cells on the upper surface. The cells that migrated to the lower surface of the membrane were fixed with 4% paraformaldehyde for 10 min and stained with 1% crystal violet for 10 min. The cells were rinsed three times with PBS. Five fields of view (200×) were randomly selected under the microscope to observe and count the cells. After three repeated experiments, image processing and plotting were performed.
Plate colony formation assay
Three milliliters of cell suspension from the logarithmic growth phase were inoculated into a 6-well plate at a density of 5 × 10² cells per well, ensuring uniform cell distribution. The cells were incubated at 37 °C with 5% CO2 for 10 d. On the 10th day, visible colonies appeared at the bottom of the wells, at which point the culture was terminated. The supernatant was discarded, and the cells were carefully washed three times with PBS. The cells were fixed with 4% paraformaldehyde for 15 min. The fixative was removed, and the cells were washed three times with PBS. An appropriate amount of 1% crystal violet staining solution was added, and the sections were stained for 10 min. Finally, the staining solution was slowly washed away with PBS, and the plate was allowed to air dry naturally. The colonies (≥50 cells) were counted under a microscope. The experiment was repeated three times, and the colony formation rate (%) was calculated as follows: (number of colonies formed ÷ number of inoculated cells) × 100%.
Flow cytometry analysis of cell cycle changes
The logarithmic phase cells were collected, counted, washed with PBS three times, and fixed with 75% ethanol precooled on ice overnight at 4 °C. The ethanol was washed off with PBS precooled on ice, 60 μg/mL RNase was added, and the mixture was incubated at 37 °C for 30 min. The mixture was washed twice with PBS, PI staining solution (final concentration of 100 µg/mL) was added, and the mixture was incubated at 4 °C in the dark for 30 min. The cell cycle was detected using a flow cytometer with an excitation wavelength of 488 nm and an emission wavelength greater than 630 nm. Novoe Express software was used to analyze the fluorescence intensity histogram. Three replicate experiments were performed, and the proportions of cells in different phases under various treatments were statistically analyzed to determine the distribution of the cell cycle in the G0/G1, S, and G2/M phases.
Flow cytometry detection of changes in apoptosis
The cells from each group in the logarithmic growth phase were collected, washed with ice-cold PBS, and centrifuged at 1000 rpm for 5 min; this process was repeated twice. Then, 100 µL of binding buffer was added to each sample, which was transferred to a flow tube, 5 µL of Annexin V-FITC and 5 µL of PI were added, the mixture was incubated at room temperature in the dark for 15 min, and triplicate experiments were performed on the stained cells using a flow cytometer.
Data acquisition
Bioinformatics analyses were performed using The Cancer Genome Atlas (TCGA) mesothelioma cohort. mRNA expression, clinical, and survival data were obtained from the TCGA portal (87 expression samples; 86 with survival data). Patients were stratified into high- and low-risk groups based on the median KAP1 mRNA expression. Differential expression analysis was conducted between groups to generate a logFC-ranked gene list, followed by GSEA in R using clusterProfiler and org.Hs.eg.db. GSEA results were visualized with enrichplot ridge plots, showing the top five enriched terms. To evaluate the relationship between KAP1 and other diagnostic markers for PM, we performed Pearson correlation analysis on the mRNA expression levels of TP53, SHOX2, MTAP, and MLSN using RNA-seq data obtained from the GEPIA database.
Statistical analysis
Data analysis was performed using SPSS 20.0 software, and the results are expressed as the means and standard deviations (x ± s). Comparisons between the two groups were conducted using independent samples t tests, with P < 0.05 considered statistically significant (test level α = 0.05).
Results
Immunohistochemical detection of KAP1 expression in PM tissues
Immunohistochemical analysis was performed to assess the high expression and subcellular localization of the KAP1 protein in 40 PM samples and 20 adjacent non-cancerous pleural tissue samples. Compared with that in non-cancer pleural tissues from different patients, KAP1 protein expression levels were significantly greater in PM tissues. A total of 28 PM tissue samples showed strong PM staining, while 13 adjacent non-cancerous pleural tissue specimens showed weak or negative staining. IHC analysis revealed the distribution and expression level of the KAP1 protein, KAP1 was highly expressed in epithelioid (P < 0.001) and biphasic (P < 0.05) type of PM tissues. However, there was no significant change in expression in PM tissues of Sarcomatoid type (P > 0.05) (Figure 1(a)). Next, the scoring of IHC were measured and compared between PM tissues and non-neoplastic pleural tissues (Figure 1(b)).
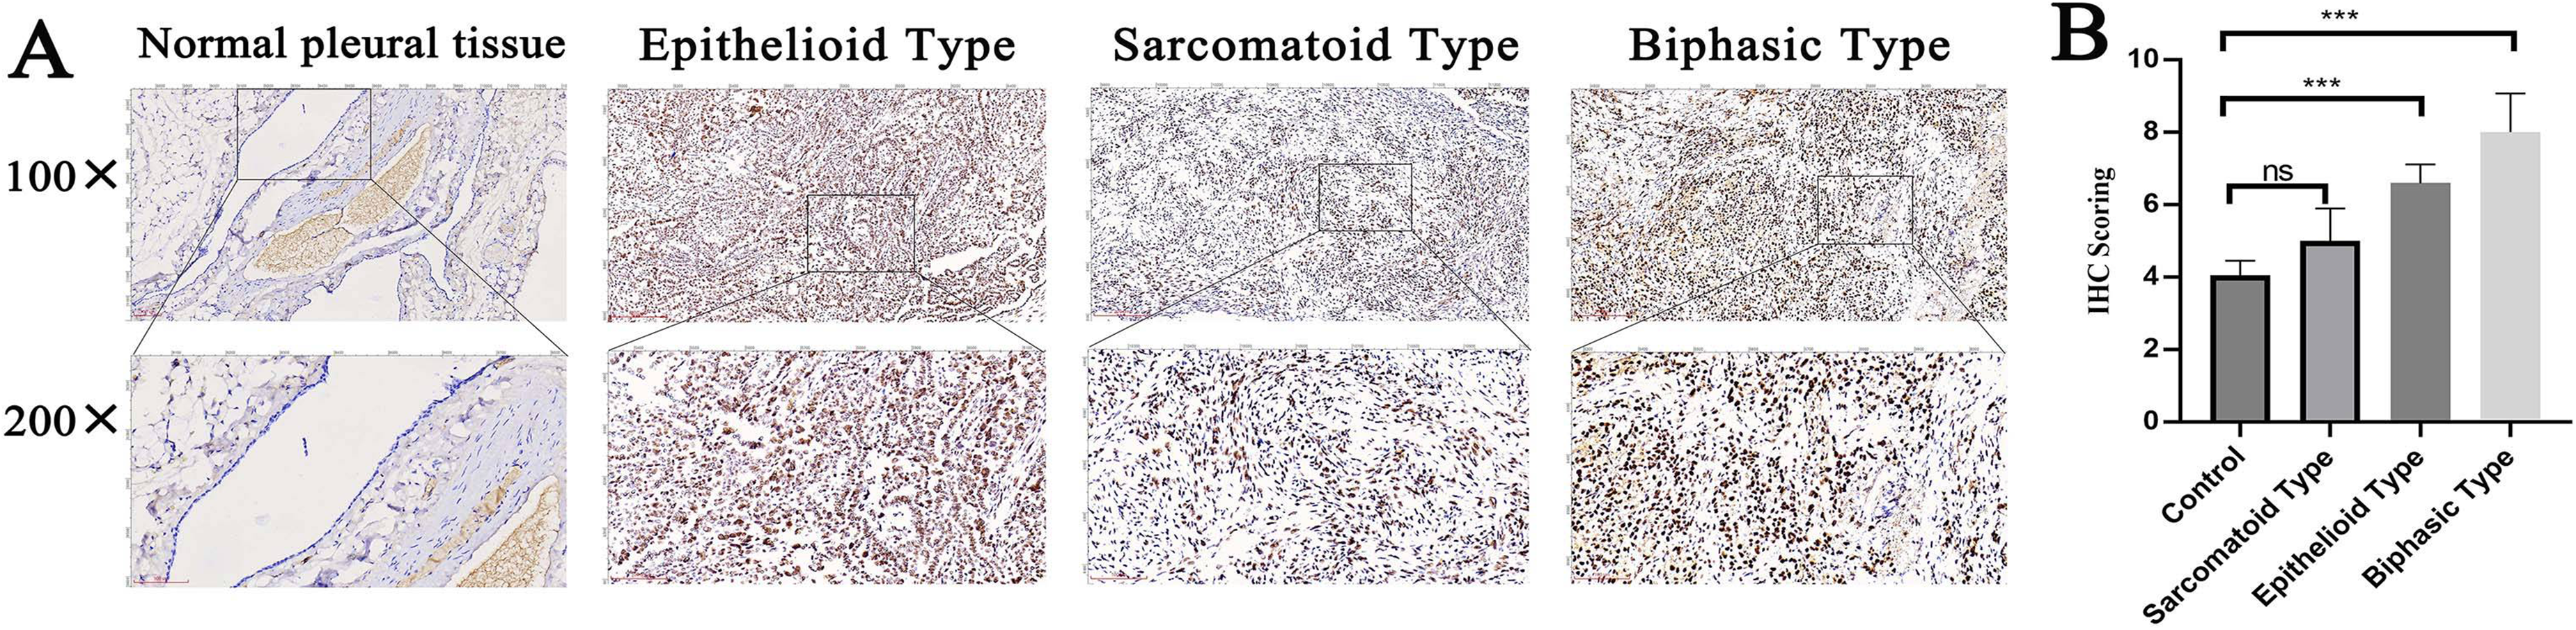
KAP1 protein expression in PM tissues and normal pleural tissues.
Optimal lentiviral infection conditions and multiplicity of infection screening results
Based on the screening results, the optimal lentiviral infection conditions were established, and a multiplicity of infection (MOI) of 5 was used in this study.
Construction of stable MSTO-211H mesothelioma cell lines with KAP1 overexpression or knockdown
The packaged human KAP1 gene overexpression group (OE-KAP1) and knockdown group (sh-KAP1) lentiviruses, along with their respective control groups (OE-NC and sh-NC) viruses, were used to infect the mesothelioma MSTO-211H cell line. Following puromycin selection, stably transfected cell lines were obtained, and the expression of green fluorescent protein (GFP) carried by the lentiviral vectors was observed under a fluorescence microscope. The results revealed distinct green fluorescence in MSTO-211H mesothelioma cells from the KAP1-overexpressing group (OE-KAP1), KAP1-knockdown group (sh-KAP1), and corresponding control groups (OE-NC and sh-NC) (Supplementary Figure 1). These results indicate that stably transfected mesothelioma cell lines with KAP1 gene knockdown and overexpression have been preliminarily established, and further experiments are needed to validate the efficiency of KAP1 knockdown and overexpression in mesothelioma cells.
Verification of KAP1 knockdown and overexpression efficiency at the mRNA and protein levels
KAP1 knockdown and overexpression efficiency at the mRNA and protein levels in the stably transfected MSTO-211H cell line was detected using quantitative real-time qRT‒PCR and Western blotting. The results revealed that KAP1 mRNA and protein expression levels in the overexpression group (OE-KAP1) were significantly greater than those in the control group (OE-NC) (P < 0.05), and KAP1 mRNA and protein expression levels in the knockdown group (sh-KAP1) were significantly lower than those in the control group (sh-NC) (P < 0.05) (Supplementary Figure 2). These results indicate that the KAP1 gene was effectively overexpressed and knocked down at the mRNA and protein levels in the MSTO-211H stably transfected cell line constructed by lentiviral infection.
Effects of KAP1 overexpression and knockdown on mesothelioma MSTO-211H cell proliferation, migration, and invasion
The results of the CCK-8 proliferation assay revealed that at 24 h of culture, there was no significant difference in the OD450 among the OE-KAP1 overexpression group, the OE-KAP1 knockdown group (sh-KAP1), and the control groups (OE-NC and sh-NC). However, after 48, 72, and 96 h of culture, the OD450 of the overexpression group (OE-KAP1) was significantly greater than that of the control group (OE-NC) (P < 0.05), and the OD450 of the knockdown group (sh-KAP1) was significantly lower than that of the control group (sh-NC) (P < 0.05). The above results indicate that KAP1 overexpression increases the in vitro proliferative capacity of MSTO-211H cells, whereas knockdown of this gene significantly inhibits the proliferative ability of MSTO-211H cells (P < 0.05) (Supplementary Figure 3).
The plate colony formation assay results revealed that the number of colonies formed by mesothelioma MSTO-211H cells in the overexpression group (OE-KAP1) was significantly greater than that in the control group (OE-NC) (P < 0.05). In contrast, the number of colonies formed by mesothelioma MSTO-211H cells in the knockdown group (sh-KAP1) was significantly lower than that in the control group (sh-NC), and the difference in plate colony formation ability was statistically significant (P < 0.05) (Figure 2). The results of the plate colony formation assay were consistent with the previous CCK-8 assay results, indicating that KAP1 overexpression increases the in vitro proliferative capacity of mesothelioma MSTO-211H cells, whereas the knockdown of KAP1 expression decreases the in vitro proliferative capacity of mesothelioma MSTO-211H cells.
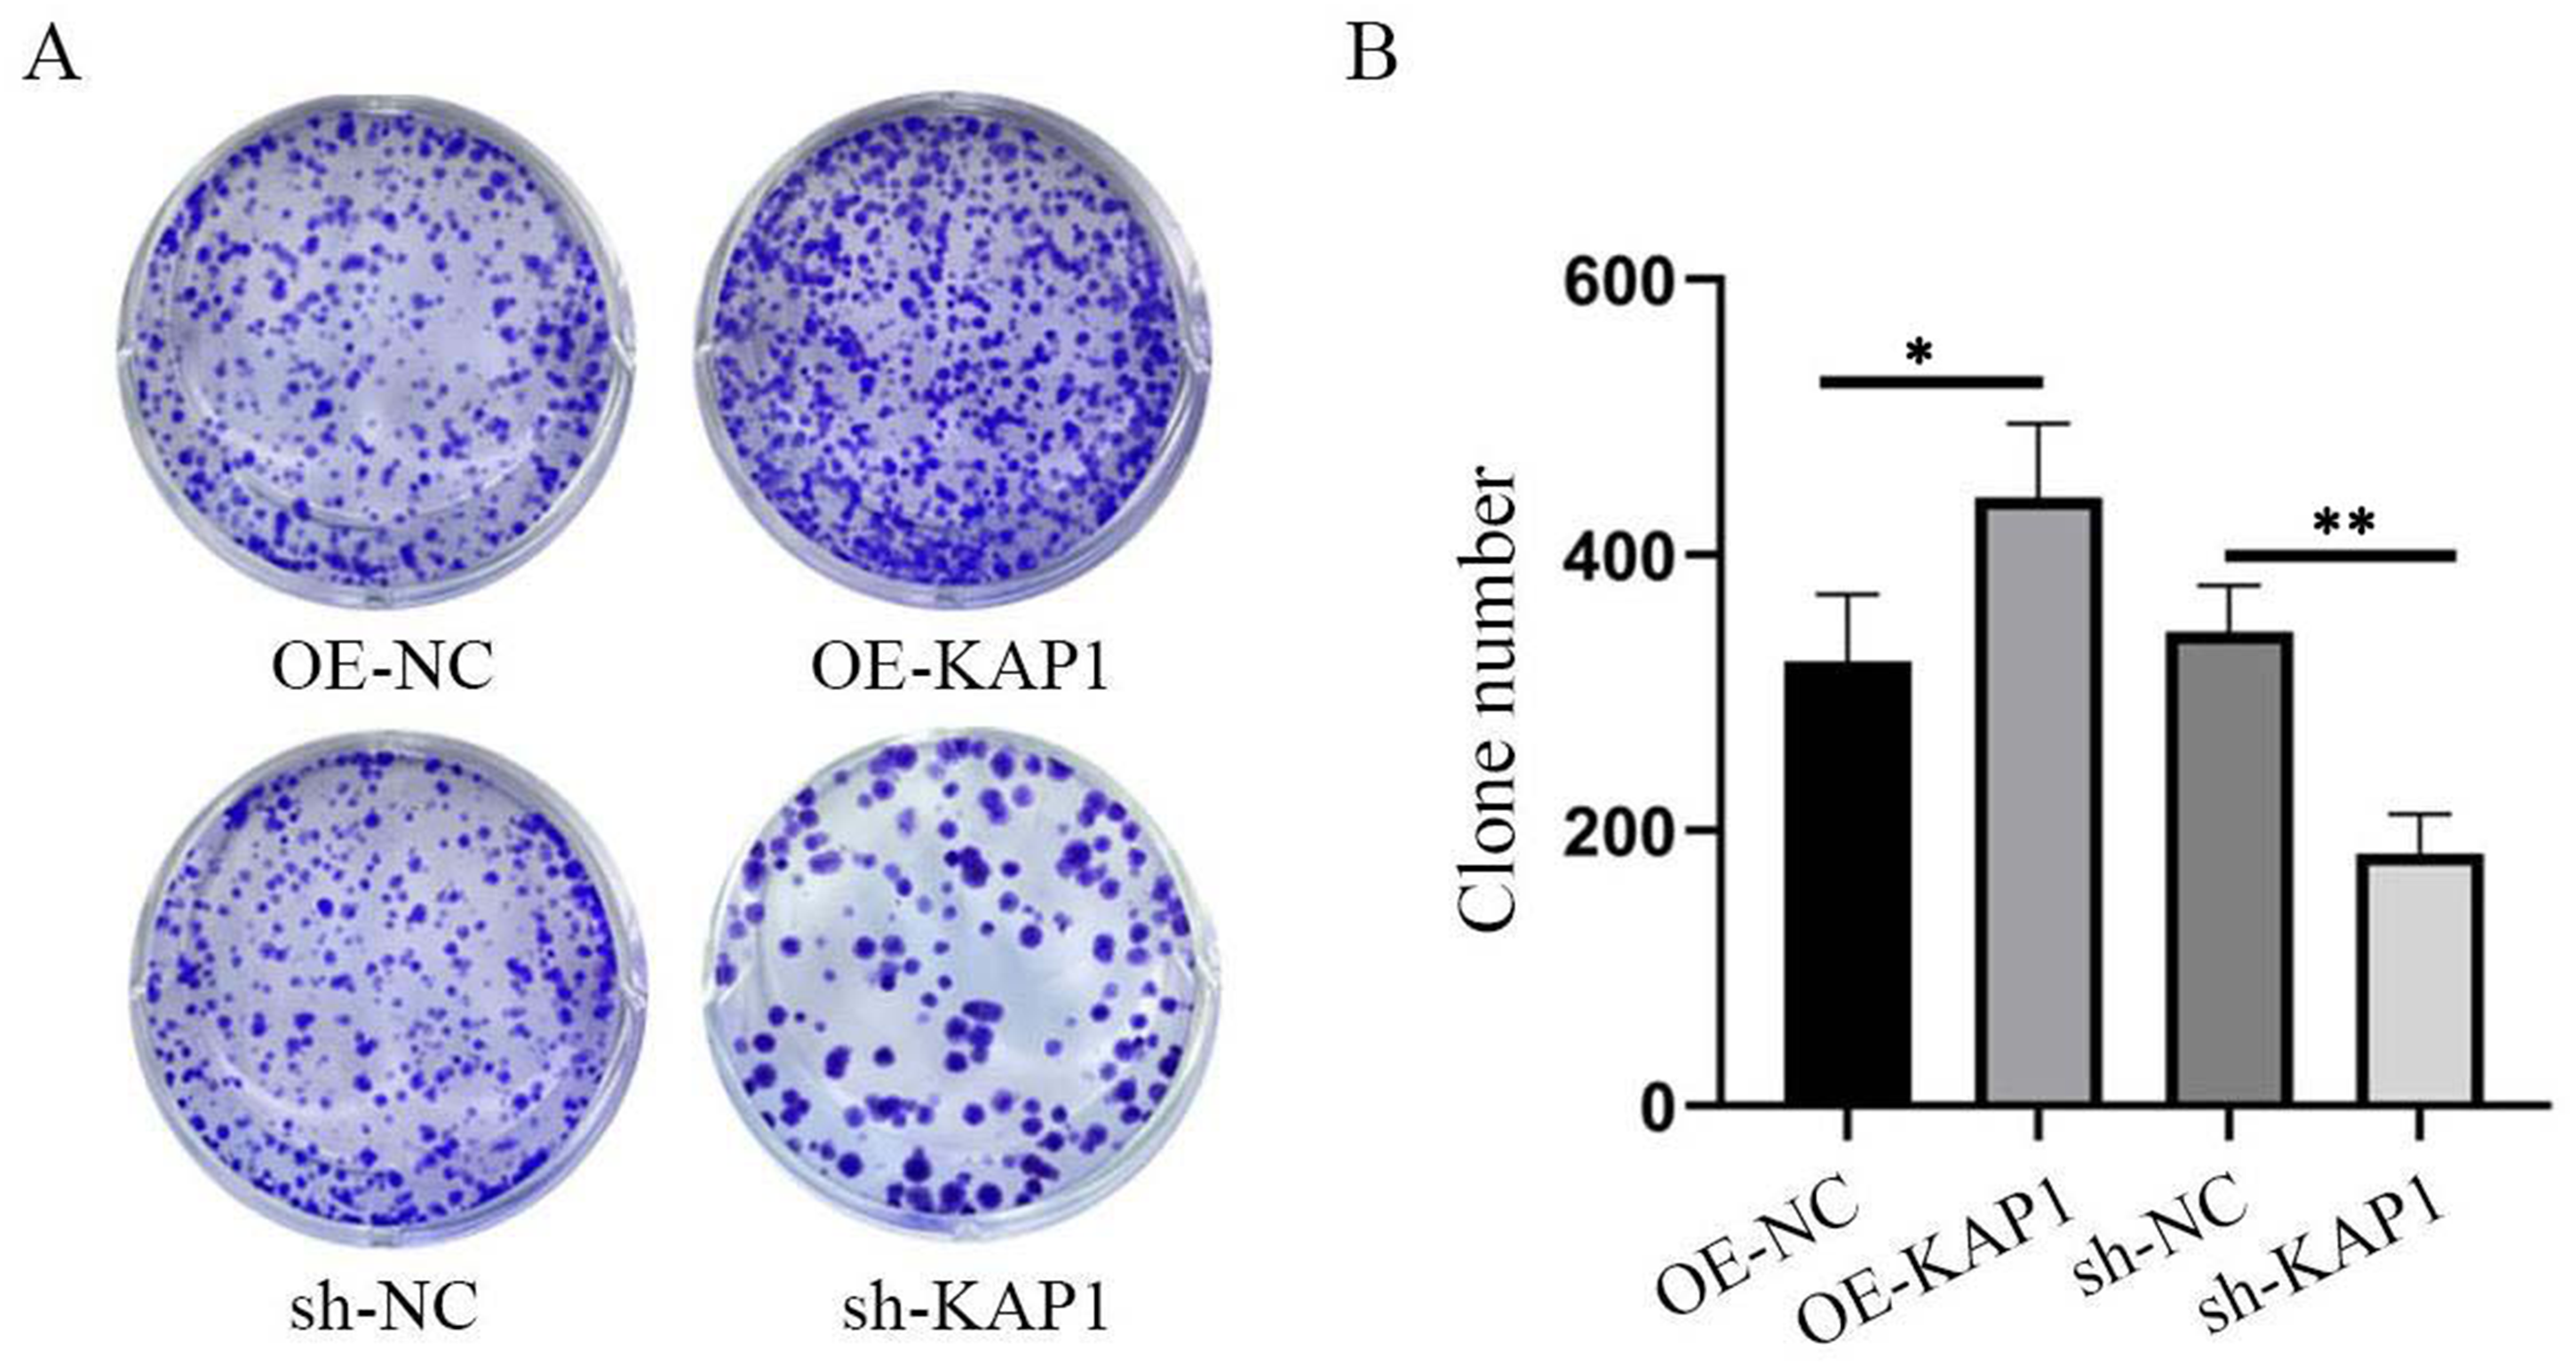
The effects of KAP1 gene overexpression and knockdown on cell proliferation were detected by a colony formation assay. **P < 0.01,*P < 0.05.
A cell scratch assay was conducted to evaluate the effects of KAP1 overexpression and knockdown on MSTO-211H mesothelioma cell migration and healing. The areas at 0 h, 24 h, and 48 h were continuously measured. The healing area was calculated, and statistical bar charts were generated. Compared with that of the control group (OE-NC), the healing ability of the overexpression group (OE-KAP1) was significantly greater (P < 0.05); compared with that of the control group (sh-NC), the healing ability of the knockdown group (sh-KAP1) was significantly lower (P < 0.05) (Figure 3).
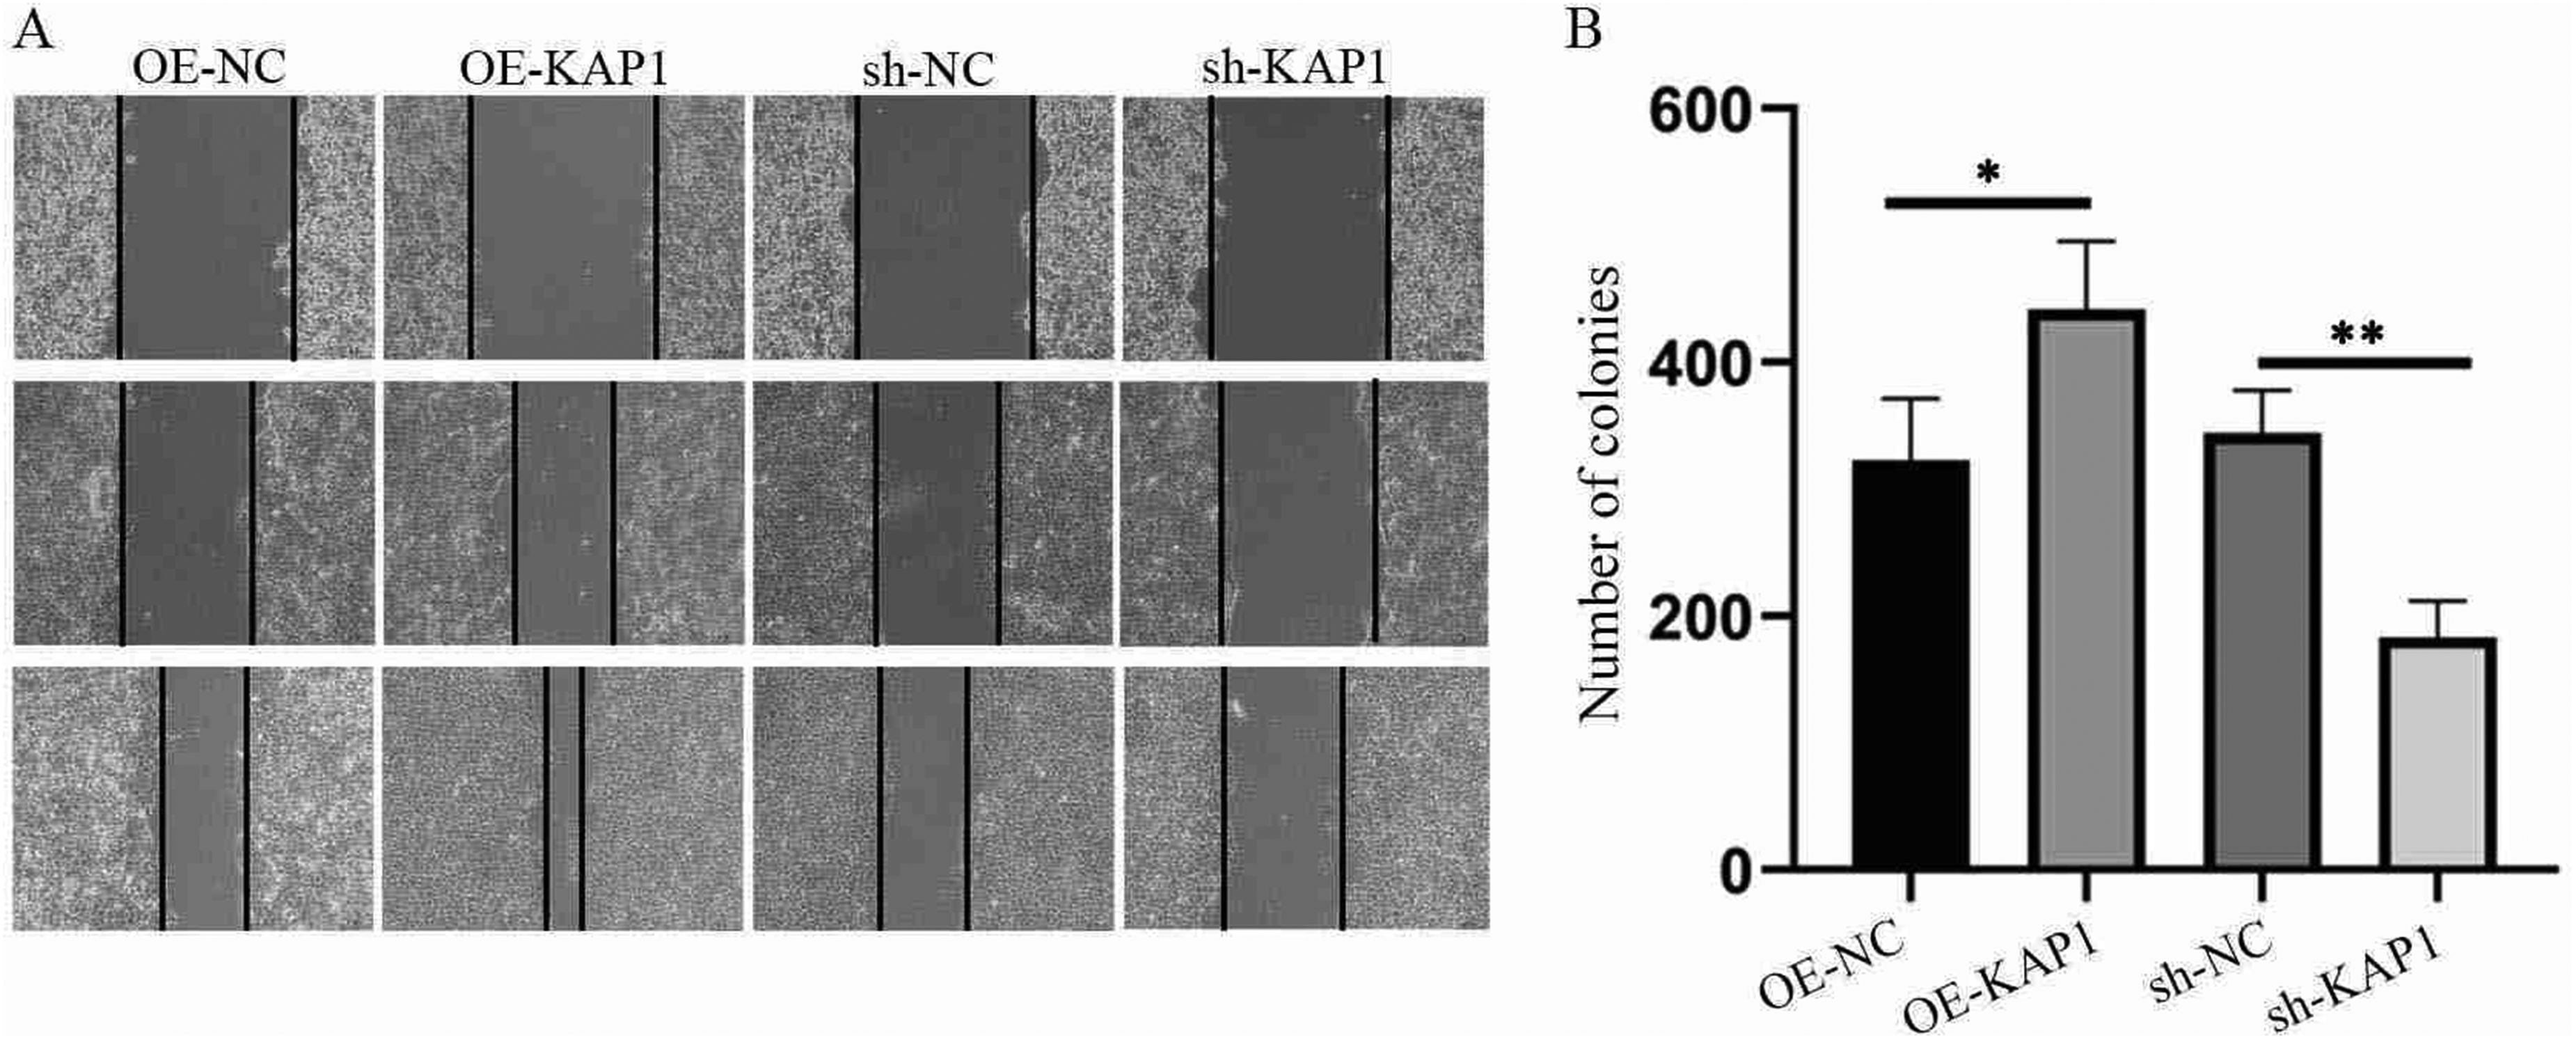
A cell scratch assay was used to detect the effects of KAP1 gene overexpression and knockdown on cell migration ability. **P < 0.01, *P < 0.05.
A Transwell assay was used to detect the effects of KAP1 overexpression and knockdown on the invasive ability of MSTO-211H mesothelioma cells by counting the number of cells that migrated through the chamber and plotting a statistical bar graph. Compared with that of the control group (OE-NC), the invasive ability of the overexpression group (OE-KAP1) was significantly greater (P < 0.05). Compared with that of the control group (sh-NC), the invasive ability of the knockdown group (sh-KAP1) was significantly lower (P < 0.05) (Figure 4).
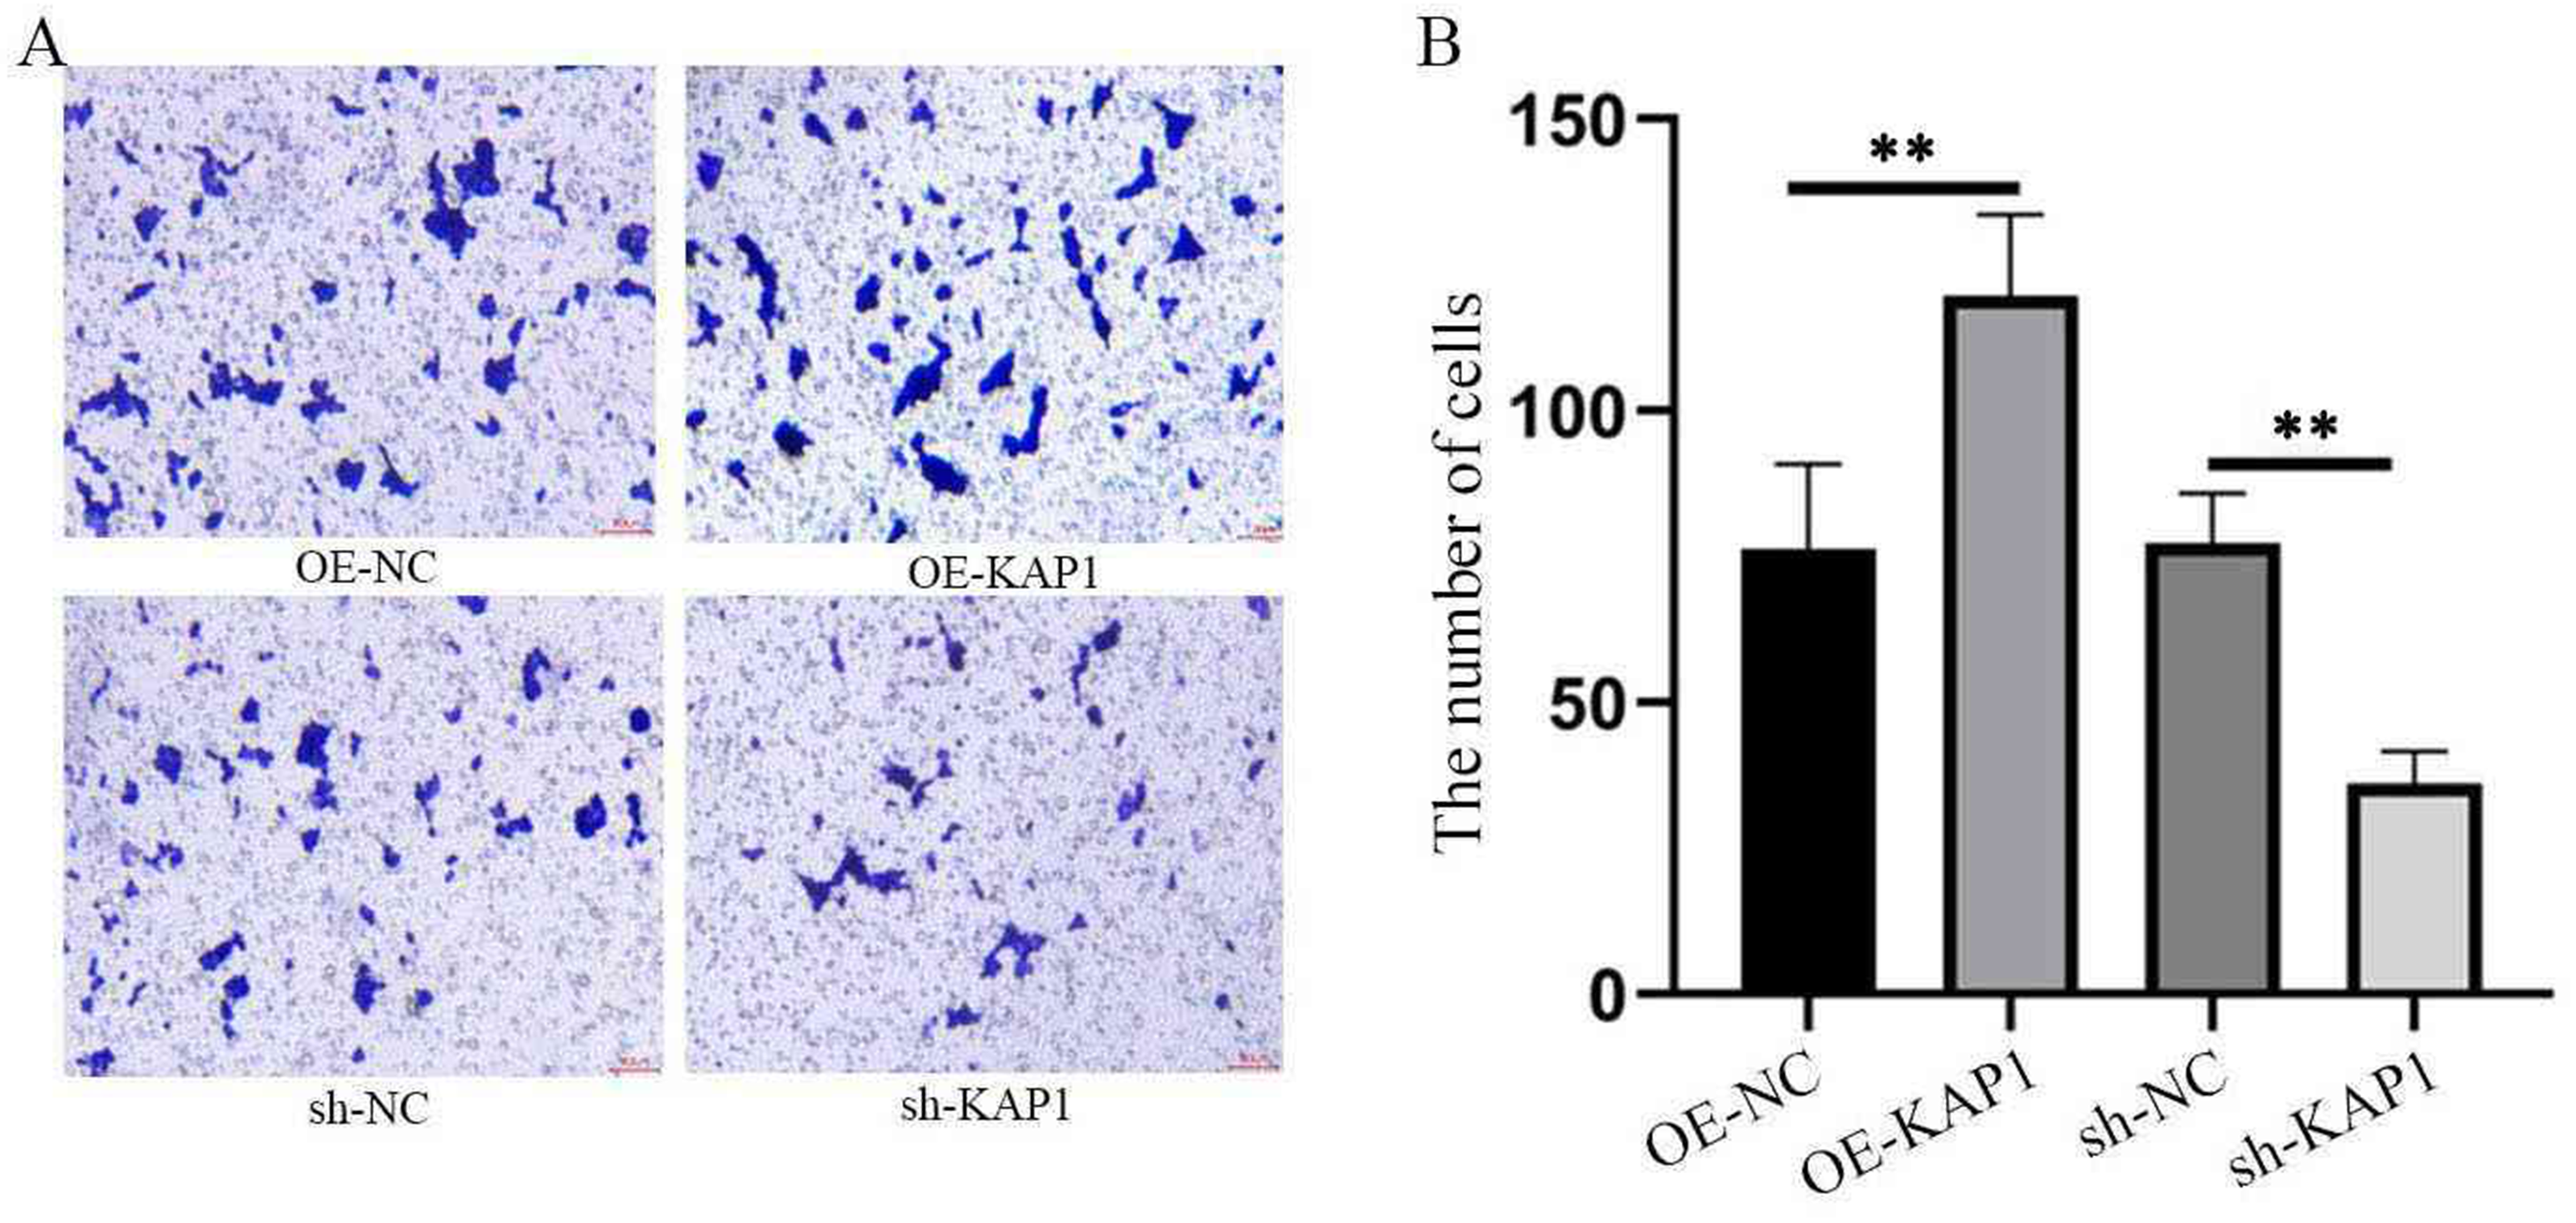
Transwell assays were used to detect the effects of KAP1 gene overexpression and knockdown on cell invasion ability. **P < 0.01.
Flow cytometry analysis of the effect of KAP1 on the cell cycle of mesothelioma MSTO-211H cells
Compared with the control group (OE-NC), the overexpression group (OE-KAP1) did not exhibit significant G1/S phase arrest, and the cell proliferation status remained unaffected. In contrast, compared with the control group (sh-NC), the knockdown group (sh-KAP1) presented a significant increase in the proportion of cells in the G1 phase and a significant decrease in the proportion of cells in the S phase (P < 0.05), indicating that the cell cycle was arrested at the G1/S phase. Therefore, knockdown of KAP1 expression in mesothelioma MSTO-211H cells resulted in marked arrest of the cell cycle at the G1 phase, a reduction in the number of cells in the S phase, and consequently, inhibition of cell proliferation (Supplementary Figure 4).
Effects of KAP1 on cyclin D1, cyclin B, and cyclin E protein expression levels
The RT‒PCR and Western blot results indicated that, compared with those in the control group (OE-NC) cells, cyclin D1 and cyclin E mRNA and protein expression levels in the overexpression group (OE-KAP1) were significantly greater (P < 0.05). In contrast, compared with those in the control group (sh-NC), cyclin D1 and cyclin E mRNA and protein expression levels in the knockdown group (sh-KAP1) were significantly lower (P < 0.05), suggesting that the KAP1 gene may be an oncogene (Figure 5).
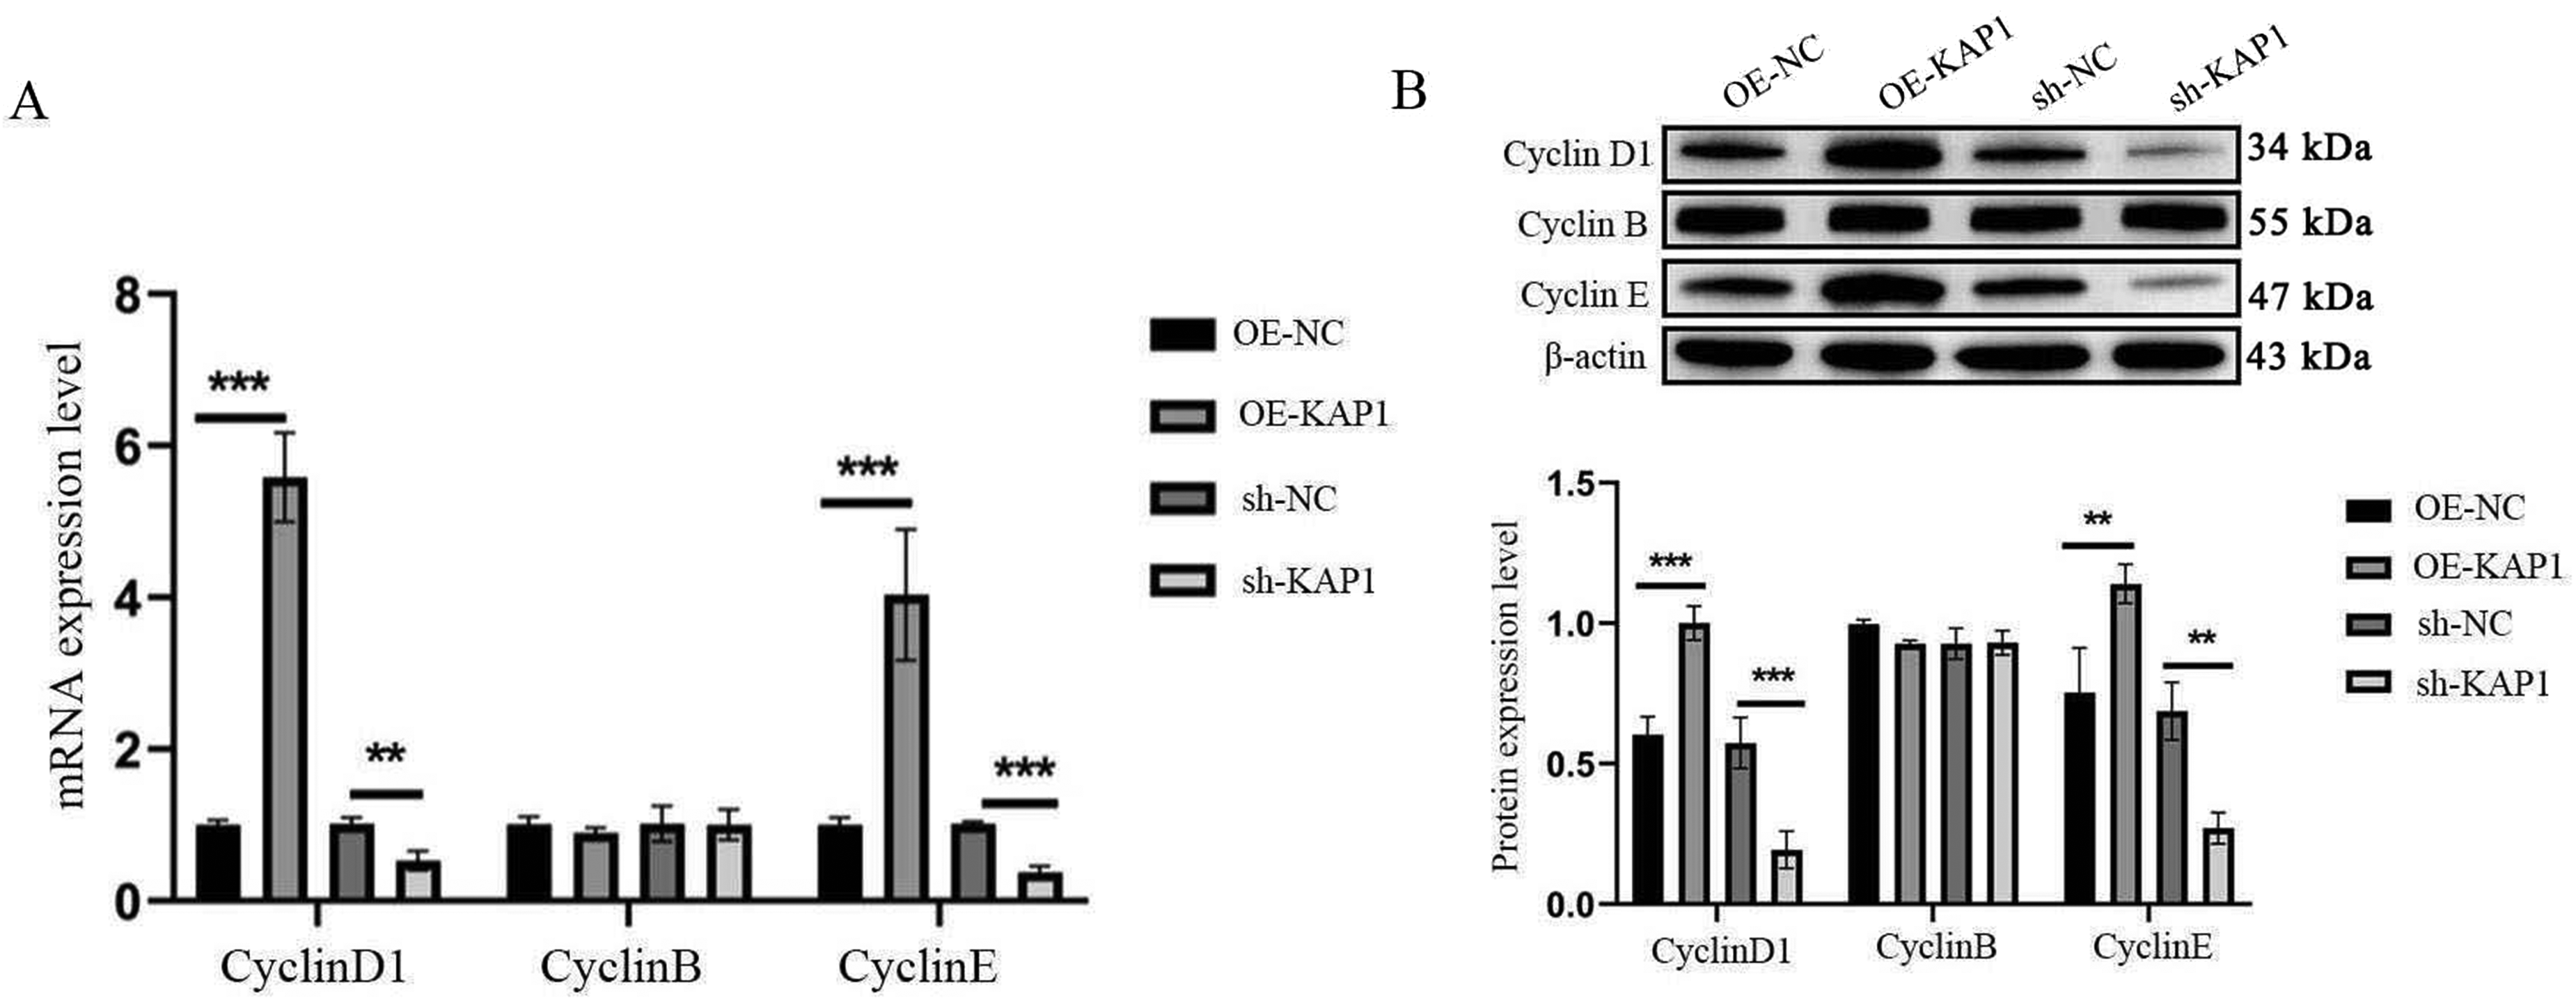
Effect of KAP1 on cyclin D1, cyclin B, and cyclin E protein expression levels. (a) RT-PCR was used to detect the effects of overexpression and knockdown of the KAP1 gene on cyclin D1, B, and E mRNA expression levels. ***P < 0.001, **P < 0.01. (b) Western blot analysis was performed to examine the effects of KAP1 gene overexpression and knockdown on cyclin D1, B, and E protein expression levels. And relative protein expression. ***P < 0.001, **P < 0.01. KAP1: KRAB-associated protein 1; mRNA: messenger RNA; RT-PCR: reverse transcription polymerase chain reaction.
Flow cytometry analysis of the effect of KAP1 on apoptosis
MSTO-211H mesothelioma cells were double-stained with Annexin V and PI, and apoptosis was analyzed using flow cytometry. The results revealed that there was no significant difference in the percentage of apoptotic cells between the overexpression group (OE-KAP1) and the control group (OE-NC) (P > 0.05); however, the percentage of apoptotic cells in the knockdown group (sh-KAP1) was significantly greater than that in the control group (sh-NC) (P < 0.05) (Supplementary Figure 5). These results indicate that KAP1 knockdown may lead to a significant increase in the number of apoptotic cells and a significant increase in the apoptosis rate in the MSTO-211H mesothelioma cell line.
KAP1 gene expression is associated with TP53, SHOX2, MTAP, and MSLN genes
Spearman correlation analysis revealed significant positive associations between KAP1 mRNA expression and TP53 (R = 0.31, P = 0.0032) and SHOX2 (R = 0.25, P = 0.021). Conversely, KAP1 expression was significantly negatively correlated with MTAP (R = −0.038, P = 0.00034) and MSLN (R = −0.41, P = 7.3 × 10⁻⁵) (Supplementary Figure 6).
GSEA reveals KAP1-associated enrichment of DNA repair, cell cycle, and proteostasis pathways in TCGA-MESO
As shown in the figure, samples from the TCGA-MESO cohort were stratified into high- and low-risk groups according to the median mRNA expression level of KAP1. Differential expression analysis was then performed between the two groups, and genes were ranked across the entire transcriptome based on their log fold-change (logFC) values. This ranked gene list was subsequently used for gene set enrichment analysis (GSEA). The top five enriched pathways were base excision repair, cell cycle, Fanconi anemia pathway, nucleocytoplasmic transport, and proteasome. Collectively, these pathways are predominantly involved in key biological processes, including DNA damage repair and replication stress responses, regulation of cell proliferation, and protein homeostasis and intracellular transport, suggesting that the risk stratification is closely associated with tumor cell proliferative activity, maintenance of genomic stability, and functions related to protein degradation and nucleocytoplasmic trafficking (Supplementary Figure 7).
Discussion
KAP1 possesses a variable intrinsically disordered domain at its C-terminus. This protein mediates interactions with KRAB domain-containing partners, such as c-Myc and E2F1, thereby influencing the transcription of target genes. 12 Primarily localized in the nucleus, KAP1 is involved in multiple aspects of cellular activity and has diverse biological functions, including cytokine production, cell differentiation, the DNA damage response (DDR), embryonic development, viral replication, and immune responses.13,14 Emerging evidence indicates that KAP1 is a novel nonhereditary susceptibility gene for PM. It is highly expressed in various malignancies and influences tumorigenesis and progression by regulating tumor cell proliferation, invasion, migration, and apoptosis, exhibiting oncogene-like properties. 15 Collectively, these studies demonstrate a strong association between KAP1 and cancer, suggesting its potential as a specific biomarker for the early diagnosis of PM. However, the precise relationship between KAP1 and PM pathogenesis remains incompletely understood and requires further experimental validation. Our preliminary findings revealed that both KAP1 mRNA and protein expression levels were significantly greater in mesothelioma tissues than in adjacent nontumorous tissues. 16 Similarly, Lu et al. 17 reported that KAP1 expression was markedly elevated in gastric cancer tissues relative to matched adjacent tissues and that this increased expression correlated with decreased overall survival in patients. Han et al. 18 identified KAP1 as an independent risk factor for poor prognosis in hepatocellular carcinoma (HCC) patients. Its high expression was significantly associated with advanced tumor stage, higher histological grade, shorter overall survival, and elevated serum AFP levels. Patients with high KAP1 expression presented significantly lower 5-year survival rates, higher recurrence rates, and poorer outcomes. Fitzgerald et al. 19 demonstrated that high KAP1 expression in colorectal cancer tissues serves as an independent predictor of adverse patient outcomes. Furthermore, Jeon et al. 20 reported that KAP1 expression was significantly higher in ovarian cancer tissues compared with adjacent normal tissues. Taken together, these studies indicate that KAP1 is highly expressed across diverse cancer types and is significantly associated with poor prognosis. Consequently, KAP1 shows promise as a potential biomarker for the early diagnosis of PM.
On this basis, stable MSTO-211H mesothelioma cell lines with KAP1 overexpression or knockdown were further constructed. Western blot and qRT-PCR analyses revealed that, compared with those in the two control groups, KAP1 protein and mRNA expression levels were significantly increased in the overexpression group but significantly decreased in the knockdown group. These results indicate that stable MSTO-211H mesothelioma cell lines with KAP1 gene overexpression or knockdown were successfully established. CCK-8, colony formation, cell scratch, and Transwell invasion assays demonstrated that MSTO-211H mesothelioma cells overexpressing KAP1 exhibited significantly enhanced proliferation, migration, and invasion abilities, whereas KAP1-knockdown cell lines presented the opposite effects. These results indicate that the KAP1 gene may promote the proliferation, migration, and invasion capabilities of MSTO-211H mesothelioma cells. Similarly, Jin et al. 21 reported that KAP1 promotes the proliferation of lung cancer cells by downregulating the expression of the p53 protein through targeting ubiquitin ligases and that stable overexpression of this gene increases the proliferation, migration, and invasion of lung cancer cells. Chen et al. 22 reported that KAP1 knockdown in lung cancer cells blocked TGF-β-induced epithelial‒mesenchymal transition and affected the acetylation and methylation of E-cadherin and N-cadherin, thereby inhibiting lung cancer cell invasion and migration. Ning et al. 23 reported that KAP1 expression was significantly increased in gastric cancer tissues and cells, that high expression of this gene was significantly correlated with poor prognosis in patients, and that high expression of KAP1 promoted the migration and invasion of gastric cancer cells. Ni et al. 24 reported that KAP1 is highly expressed in colorectal cancer cells and that salt-inducible kinase 2 (SIK2) upregulates the expression of KAP1, promoting the occurrence of colorectal cancer and glycolysis. Gan et al. 25 demonstrated that KAP1 expression is increased in rectal cancer tissues and that targeted inhibition of KAP1 expression by overexpressing miR-3127-5p suppresses rectal cancer cell proliferation, migration, and invasion. Yu et al. 26 reported that KAP1 is highly expressed in pancreatic cancer and that KAP1 overexpression enhances the invasive and migratory capabilities of pancreatic cancer cells. Some studies have also reported that KAP1 knockdown impedes the Wnt/β-catenin signaling pathway, thereby inhibiting ovarian cancer cell migration and invasion. 20 Research by Chen et al. 27 demonstrated that KAP1 is highly expressed in endometrial cancer and that knockdown of this gene suppresses the proliferation, migration, and invasion of endometrial cancer cells. The overexpression or knockdown of KAP1 promotes or inhibits the phosphorylation of protein kinase B (AKT) and mammalian target of rapamycin (mTOR), respectively. This gene promotes endometrial cancer cell proliferation and migration by regulating the AKT/mTOR pathway. Agarwal et al. 28 reported that KAP1 is highly expressed in bladder cancer and acts as a transcriptional activator of the telomerase reverse transcriptase promoter, promoting bladder cancer cell proliferation. Studies on various types of tumors have demonstrated that KAP1 plays a significant role in regulating the biological behaviors of tumor cells, such as proliferation, migration, and invasion. Therefore, we hypothesize that KAP1 may function as a pro-oncogenic factor in PM.
Flow cytometry analysis of the cell cycle revealed that the proportions of MSTO-211H mesothelioma cells stably overexpressing KAP1 in the G0/G1, S, and G2/M phases did not significantly change, indicating that there was no cell cycle arrest and that the cells remained in a good proliferative state. However, after KAP1 expression was knocked down, the proportion of cells in the G0/G1 phase significantly increased, whereas the proportions in the S and G2/M phases did not significantly change, suggesting G0/G1 phase arrest in the cell cycle. Together, these results support a role for KAP1 in enforcing the G1/S transition, consistent with a transcriptional coupling of KAP1 to cell-cycle regulators. This finding may imply that the proliferative capacity of the cells is inhibited, leading to reduced DNA synthesis and replication, which is consistent with the CCK-8 experimental results. Cyclin D1, B, and E levels in each group were detected by both Western blotting and RT-PCR. Cyclin D1 and E mRNA and protein levels in KAP1-overexpressing mesothelioma MSTO-211H cells were significantly greater than those in the control cells, whereas cyclin D1 and E mRNA and protein levels in KAP1-knockdown mesothelioma MSTO-211H cells were significantly lower than those in the control cells. These experimental results suggest that the KAP1 gene may promote cell growth. Additionally, flow cytometry analysis of apoptosis revealed that KAP1 overexpression in mesothelioma MSTO-211H cells did not significantly alter the apoptosis rate, whereas KAP1 knockdown promoted apoptosis in mesothelioma MSTO-211H cells, with a significant increase in the apoptosis rate. Such a pattern is consistent with a model in which KAP1 maintains the integrity of stress-buffering networks that become essential when removed. TRIM28 has been implicated in p53 control through a ubiquitin-ligase cascade involving RLIM and MDM2, where TRIM28 depletion stabilizes p53 and triggers p53-dependent apoptosis. 21 In parallel, cancer-specific MAGE–TRIM28 complexes can rewire metabolic checkpoints, including the turnover of AMPK to support anabolic growth.29,30 Although our study did not directly assay p53 signaling, AMPK status, or DNA-damage responses, the directionality of the phenotype provides a focused set of next experiments (e.g., p53 target induction, caspase activation, and metabolic stress readouts) to connect KAP1 depletion to a defined apoptotic trigger in mesothelioma. Beyond proliferation, KAP1 increased migration and invasion, while its knockdown restrained these traits, indicating that KAP1 coordinates not only cell-cycle progression but also cellular plasticity relevant to local dissemination. TRIM28 has been reported to promote metastatic behavior via stabilization of EMT drivers such as TWIST1 and through broader chromatin reprogramming that impacts adhesion and motility networks.31,32 The concordance between these reports and our invasion/migration data supports the view that KAP1 can integrate transcriptional programs that couple growth with aggressiveness. Collectively, these findings advance the conceptual framework that PM, despite a relatively low mutational burden, can be driven by actionable epigenetic dependencies.33,34 KAP1 emerges as a candidate biomarker and therapeutic node with two immediate translational hypotheses. First, the cyclin D1/E shift and G1 restriction upon KAP1 silencing suggest that KAP1 status could stratify sensitivity to CDK4/6 or CDK2-directed strategies in a disease enriched for CDKN2A disruption.35,36 Second, mounting evidence that TRIM28 regulates immune-evasion circuits, including PD-L1 abundance and innate-immune signaling in other tumor contexts, 37 raises the possibility that KAP1-high tumors may couple intrinsic growth programs to extrinsic immune suppression. While our current data address cell-intrinsic behavior, these links motivate testing KAP1 perturbation in immunocompetent or humanized models and exploring combinations with checkpoint blockade.
Several limitations temper the scope of inference while preserving the central conclusion. First, the functional experiments were performed in a single mesothelioma cell line (MSTO-211H), and mesothelioma exhibits marked inter-tumor heterogeneity across histologic and molecular subtypes.34,38 Validation in additional epithelioid, sarcomatoid, and biphasic lines, as well as patient-derived cultures or xenografts, will be essential to establish generality. Second, the study focuses on phenotypic readouts and cyclin D1/E expression without defining direct KAP1-bound regulatory elements; ChIP–seq and perturbation-coupled RNA-seq will be required to distinguish primary transcriptional targets from secondary responses. overexpression approaches can exceed physiologic ranges and RNA-interference can have off-target effects; rescue experiments using RNAi-resistant KAP1, alongside dose-titrated expression, will strengthen causality and address potential artefacts. Finally, while our tissue comparison indicates enrichment of KAP1 in PM, larger clinical cohorts with multivariable analyses are needed to determine whether KAP1 adds independent prognostic information beyond histology and established clinicopathologic variables. 16
As a transcriptional coregulator, TRIM28 may be recruited to the promoter regions of p53 target genes; however, whether it enhances or represses transcription likely depends on the specific genomic context and its covalent modification status. 33 The oncogenic role of TRIM28 may act independently of, or in cooperation with, p53 status. MTAP is frequently inactivated in multiple cancers through genetic deletion or epigenetic silencing, with particularly high deletion rates observed in mesothelioma. 39 When TRIM28 expression is elevated, its potent gene-silencing capacity may be exploited to further repress or silence MTAP expression. Even in the absence of DNA-level deletion of the MTAP gene, overexpressed TRIM28 may downregulate MTAP through epigenetic mechanisms, such as promoting histone H3K9 trimethylation at the MTAP promoter region. Conversely, normal or high MTAP expression may indicate that its genomic locus resides in an open chromatin state, where the silencing function of TRIM28 is ineffective, resulting in relatively low TRIM28 levels. In mesothelioma, inactivation of the tumor suppressor gene MTAP may therefore occur not only through classical genetic deletion but also via dynamic epigenetic silencing mechanisms centered on TRIM28, providing a more complex perspective on the disruption of tumor-suppressive networks in this disease. In mesothelioma diagnosis, mesothelin (MLSN) serves as a highly specific auxiliary marker; prognostically, its expression level, together with the tumor microenvironment, shapes patient survival outcomes; and in therapeutic monitoring, its dynamic changes represent a sensitive indicator for treatment efficacy assessment and early relapse detection. 40 MLSN expression is negatively correlated with KAP1 mRNA levels, a relationship that is unlikely to be coincidental and may reflect underlying biological regulatory interactions. For instance, KAP1, as a transcriptional corepressor, may directly inhibit MLSN transcription, whereas MLSN may function as a negative regulator of downstream KAP1 targets, forming a negative feedback loop that balances cell cycle progression. Elucidation of this regulatory mechanism may reveal new dimensions of cell cycle checkpoint control in mesothelioma. The methylation status of SHOX2 (short stature homeobox 2), a chemical modification of DNA, exhibits abnormally high levels of methylation in mesothelioma tissues. This characteristic enables effective discrimination between malignant lesions and benign reactive proliferations and offers potential for real-time monitoring of therapeutic response. 41 SHOX2 and KAP1 may synergistically promote mesothelioma cell proliferation, invasion, and metastasis through direct interaction or shared signaling pathways. For example, SHOX2 may regulate genes involved in cell cycle control or epithelial–mesenchymal transition (EMT), while KAP1 may enhance SHOX2 function by modulating chromatin architecture or transcription factor activity, thereby jointly driving tumor progression. Combined assessment of SHOX2 and KAP1 expression levels may provide greater predictive value than analysis of either gene alone, enabling more accurate evaluation of patient survival risk and informing clinical decision-making.
In summary, our work supports a model in which KAP1 functions as an oncogene-like epigenetic coordinator in pleural mesothelioma, linking cell-cycle control to invasive behavior and survival. The underlying KAP1-mediated mechanisms remain to be elucidated. Future investigations incorporating large, well-characterized patient cohorts with long-term follow-up, together with comprehensive in vitro and in vivo cellular and molecular studies, are required to validate and clarify the functional role of KAP1 in PM. Moreover, the identification and development of siRNA-based strategies and small-molecule inhibitors capable of effectively suppressing KAP1 overexpression may provide therapeutic benefit for PM.
Limitations
PM is a rare tumor with a poor prognosis. The significance of this observation was limited by the small sample size, especially for patients with sarcomatoid malignant pleural mesothelioma. Thus, a further increase in sample size would help unravel the complex genetic architecture of KAP1 and PM.
Conclusions
In summary, this study revealed that KAP1 is highly expressed in mesothelioma tissues. By constructing stable MSTO-211H mesothelioma cell lines with KAP1 overexpression or knockdown, we discovered that this gene is involved in regulating mesothelioma cell proliferation, migration, invasion, the cell cycle, and apoptosis. These findings indicate that the KAP1 gene functions as a cancer-promoting factor in PM and serves as a potential biomarker and therapeutic target for mesothelioma, providing experimental evidence for early clinical diagnosis and treatment.
Supplemental Material
sj-doc-1-jbm-10.1177_03936155261421213 - Supplemental material for High KAP1 expression promotes pleural mesothelioma cell proliferation and metastasis
Supplemental material, sj-doc-1-jbm-10.1177_03936155261421213 for High KAP1 expression promotes pleural mesothelioma cell proliferation and metastasis by Wen Mei, Yiqi Wang, Shengjie Yang, Qunshan Fu, Wei Xiong and Yepin Zhang in The International Journal of Biological Markers
Footnotes
Abbreviations
Acknowledgments
We express our appreciation to the patients who participated in this study.
Ethics approval and informed consent
This work was performed in accordance with the Declaration of Helsinki (2000) of the World Medical Association. This study was approved by The People's Hospital of Chuxiong Yi Autonomous Prefecture (ID: 2023-68). Therefore, the institution waived the requirement to obtain written informed consent from the patients. However, written informed consent for publication of their clinical data was obtained from the patients.
Author contributions
Conception and design: Wen Mei; Shengjie Yang Administrative support: Wen Mei; Wei Xiong. Provision of study materials or patients: Shengjie Yang Collection and assembly of data: Yiqi Wang Data analysis and interpretation: Yiqi Wang Manuscript writing: All authors Final approval of manuscript: All authors.
Funding
This study was supported by the Special Basic Cooperative Research Programs of Yunnan Provincial Undergraduate Universities (No. 202301BA070001-26; 202301BA070001-027).
Declaration of conflicting interests
The authors declared no potential conflicts of interest with respect to the research, authorship, and/or publication of this article.
Supplemental material
Supplemental material for this article is available online.